Kindlin-1 regulates IL-6 secretion and modulates the immune environment in breast cancer models
- Cancer Research UK Edinburgh Centre, Institute of Genetics and Cancer, University of Edinburgh, United Kingdom
Figures
Figure 1 with 2 supplements
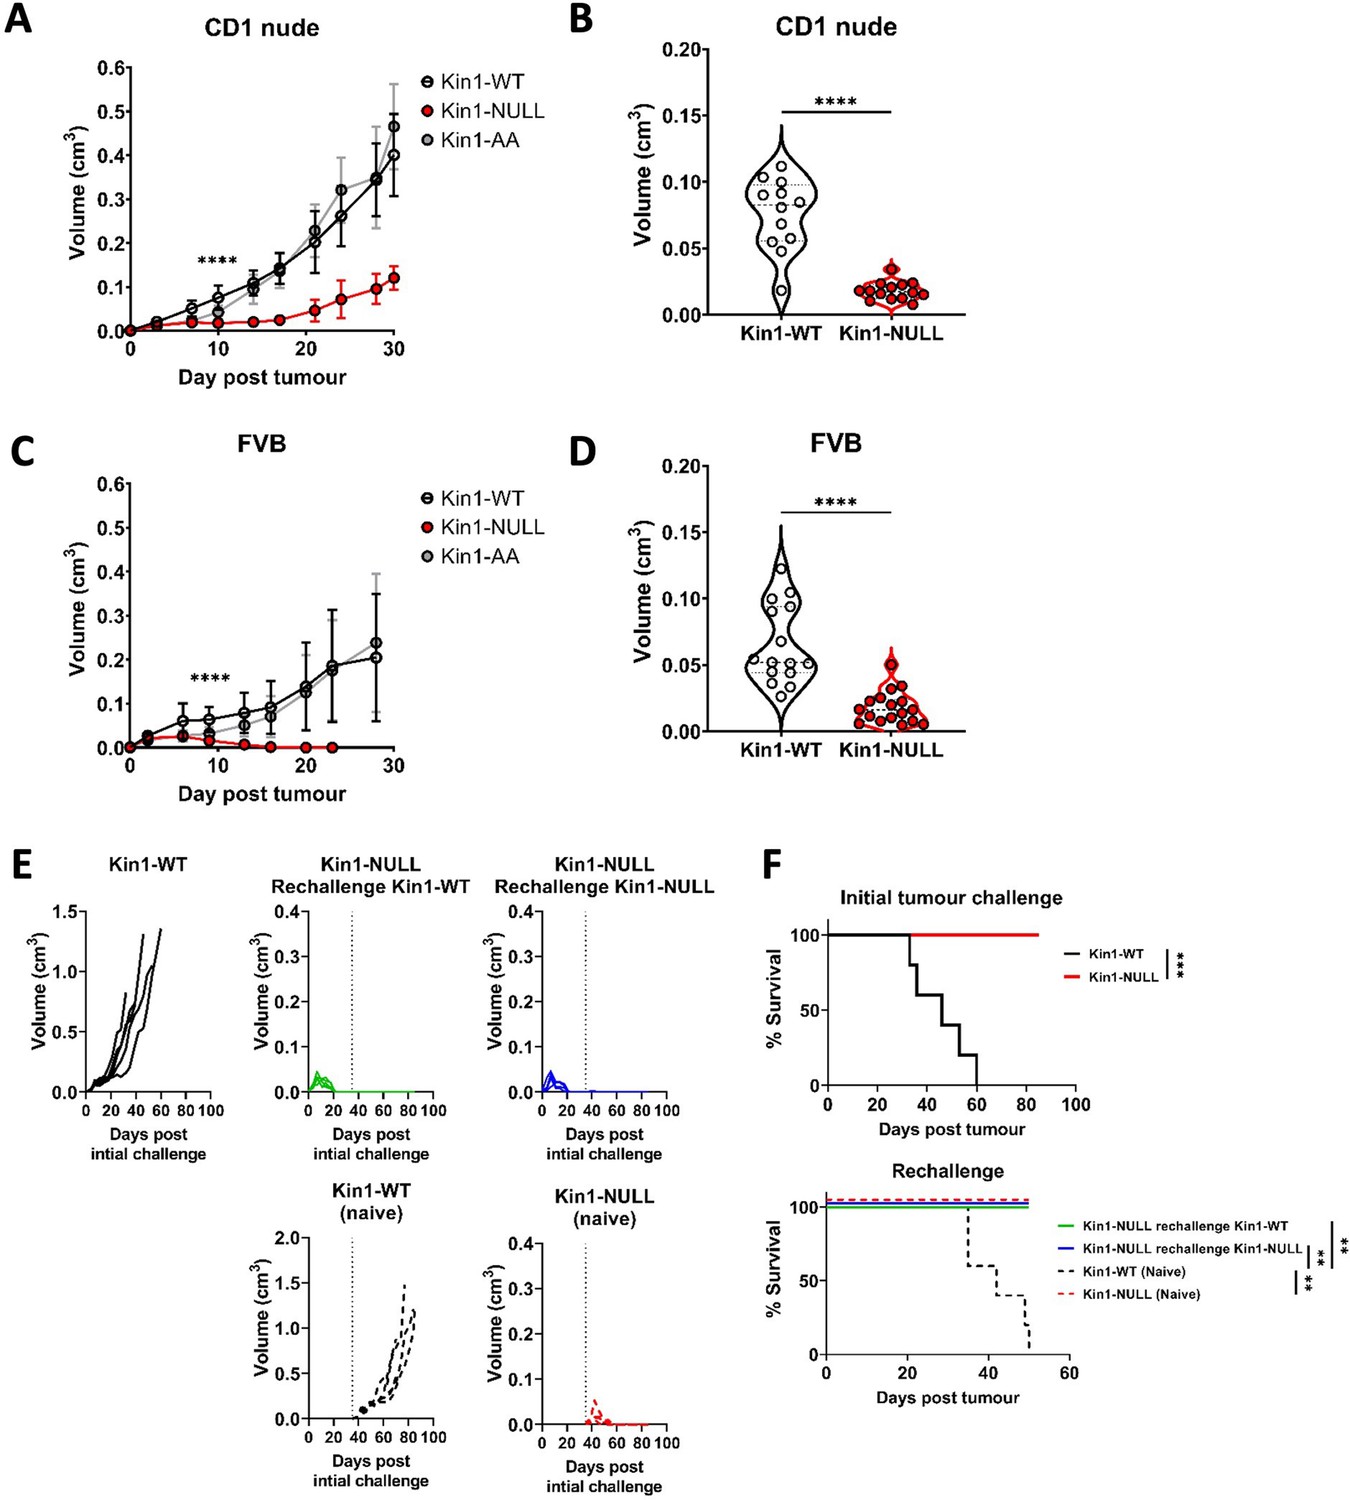
Loss of Kindlin-1 leads to tumor clearance and immunological memory.
(A, C) Met-1 Kin1-WT, Kin1-NULL or Kin1-AA tumors were established via subcutaneous injection into flanks of CD1 nude mice (A) or FVB mice (C). Tumor growth was monitored and recorded until day 30, with average tumor growth shown. (B, D) Tumor size at day 10 post injection shown in CD1 nude mice (B) and FVB mice (D). (E) Left flank of FVB mice was injected with Met-1 Kin1-WT or Kin1-NULL cells. At day 35, when no tumor was present, Kin1-NULL injected mice were rechallenged with either Kin1-WT or Kin1-NULL Met-1 cells on the right flank. Naïve FVB mice were also injected concurrently. Tumor growth and survival (F) were monitored throughout. Combined data from three independent experiments (A–D). Example of two independent experiments (E–F). n=5–16 per group. Unpaired t-test (A–D) or Log Rank (F) with * =< 0.05, ** =< 0.01, *** =< 0.001. Analysis of human cell line MDA-MB-231 is shown in Figure 1—figure supplement 1, with proliferation analysis of tumours shown in Figure 1—figure supplement 2.
Figure 1—figure supplement 1
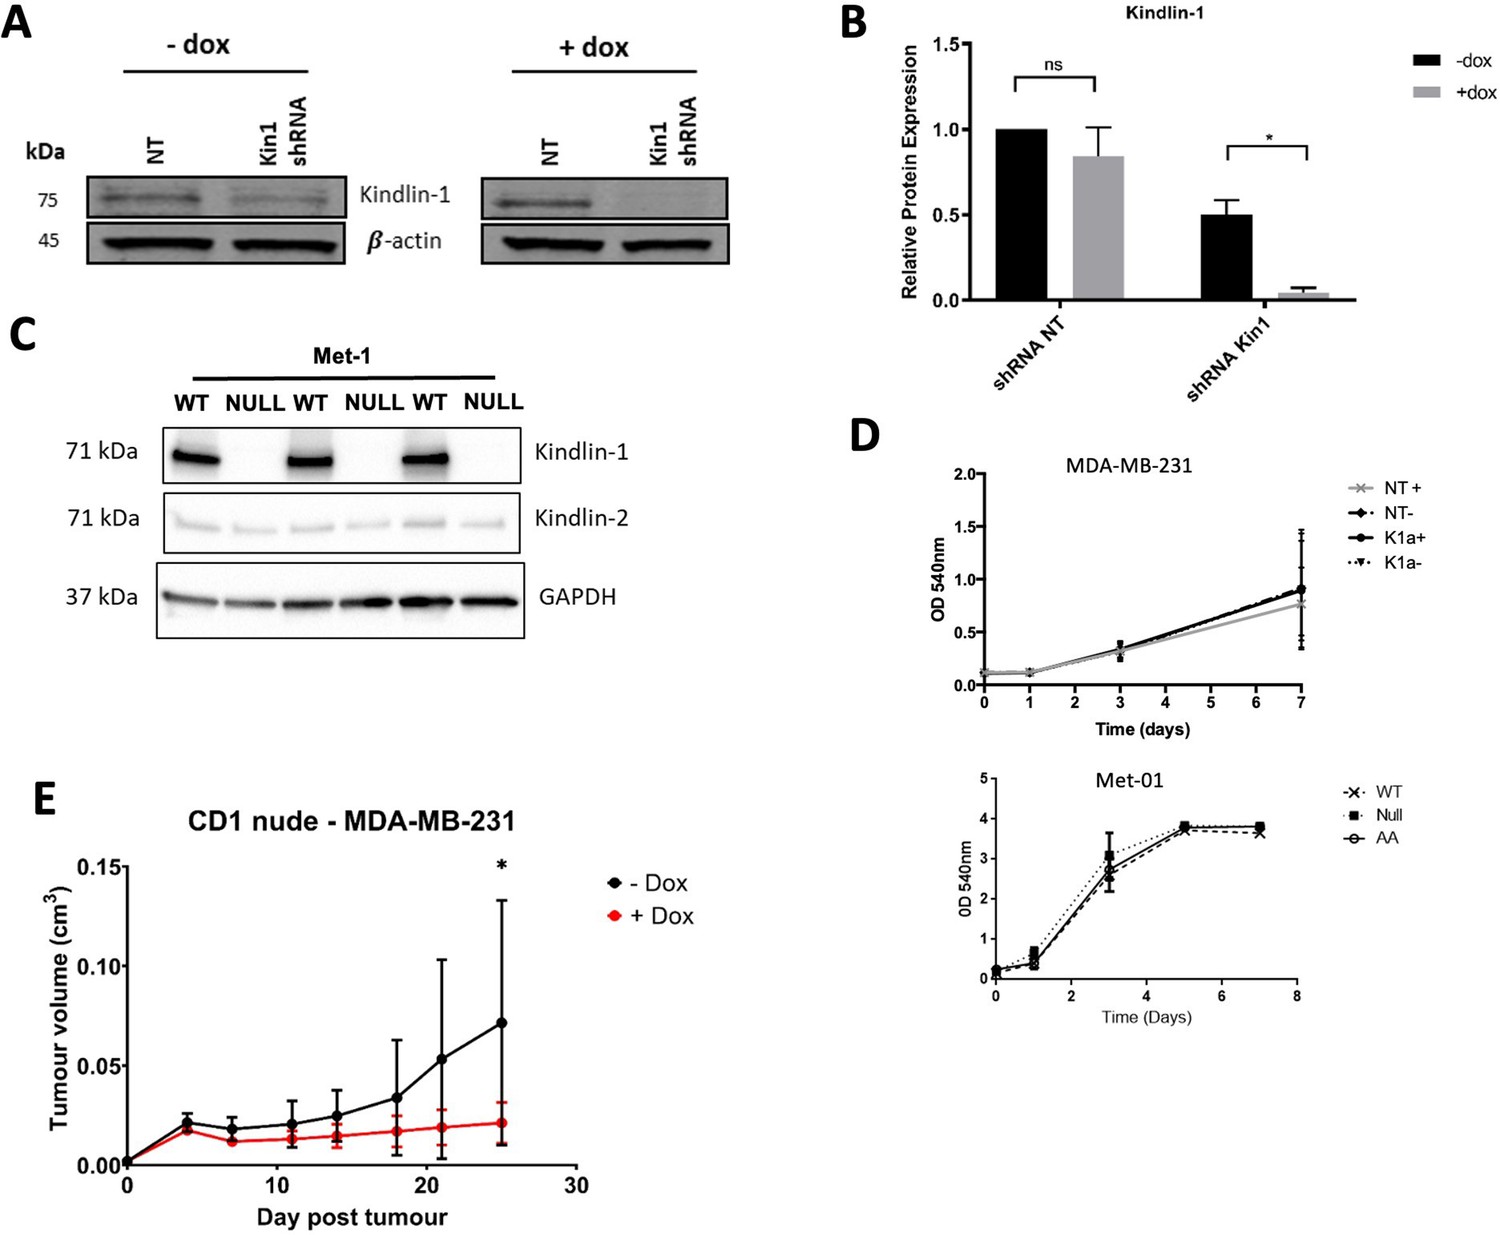
Loss of Kindlin-1 leads to reduction of tumor growth in human breast cancer model.
(A) Representative western blot demonstrating Kindlin-1 protein knockdown after addition of doxycycline to MDA-MB-231 cells expressing inducible non-targeting (NT) or FERMT1 shRNA. (B) Quantification of A normalised to loading control, n=3 per group, error bars = SEM. (C) Western blot demonstrating Kindlin-1 deletion in Met-1 cells. (D) Loss of Kindlin-1 has no effect on in vitro proliferation of MDA-MB-231 (NT shRNA) and FERMT1 shRNA (K1a), or Met-1 cells, n=3 per group, error bars = SEM. (E) MDA-MB-231 cells carrying doxycycline inducible FERMT1 shRNA were subcutaneously injected into CD1 nude mice, after which doxycycline treatment was commenced for half the group. Tumor growth was monitored and recorded until day 25, with average tumor growth shown. n = 8 mice per group, error bars = SD. Unpaired t-test with * =< 0.05.
-
Figure 1—figure supplement 1—source data 1
Raw western blot images for Figure 1—figure supplement 1A, C.
- https://cdn.elifesciences.org/articles/85739/elife-85739-fig1-figsupp1-data1-v2.pdf
Figure 1—figure supplement 2
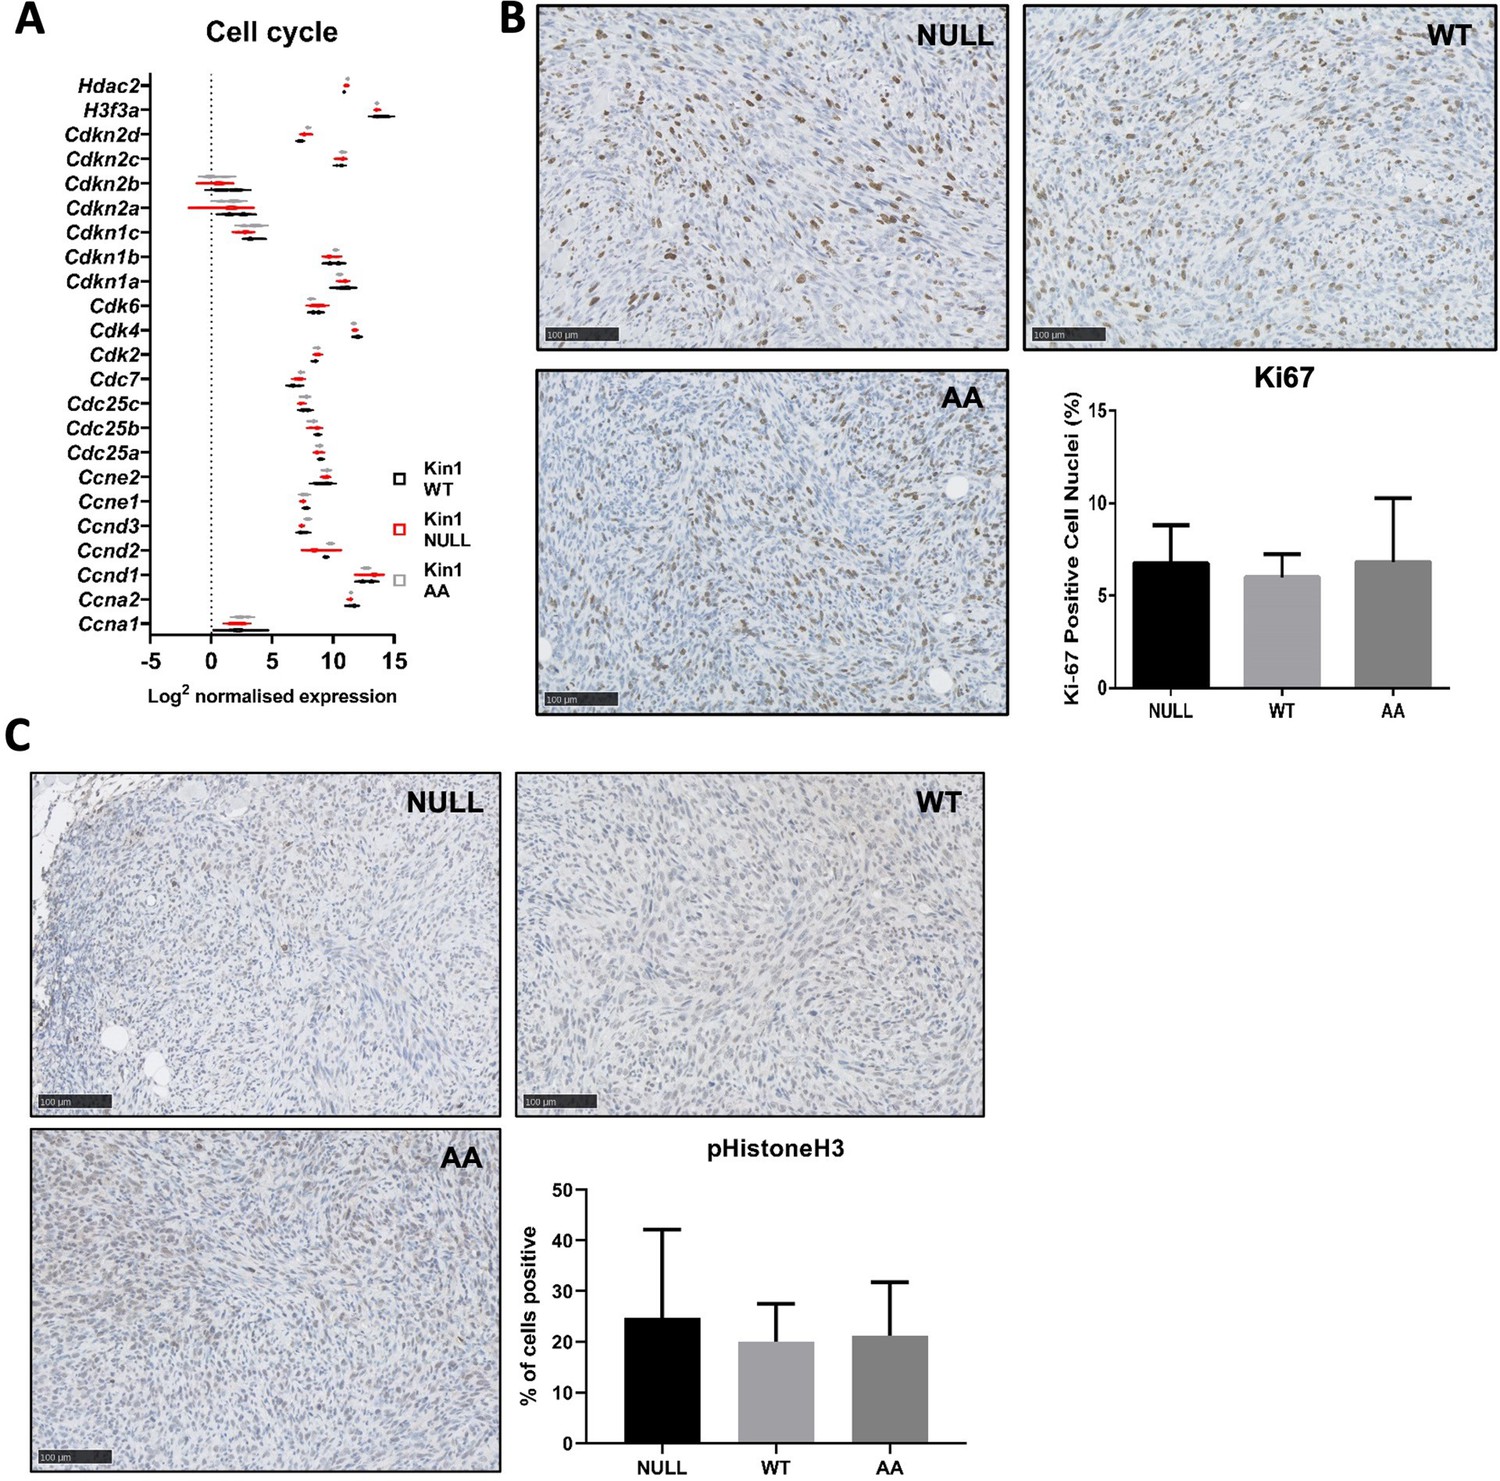
Loss of Kindlin-1 does not alter proliferation rate of Met-1 cells and tumors.
(A) Nanostring PanCancer panel of cell cycle genes in Met-1 cells. n=3 per group. (B, C) Immunohistochemical analysis of Ki67 (B) and phospho-histone H3 (C) in Met-1 tumors, with representative images and quantification shown. n=3 per group, error bars = SD (BC).
-
Figure 1—figure supplement 2—source data 1
Nanostring PanCancer panel analysis of Met-1 Kin1-WT and NULL cells in vitro.
- https://cdn.elifesciences.org/articles/85739/elife-85739-fig1-figsupp2-data1-v2.xlsx
Figure 2 with 2 supplements
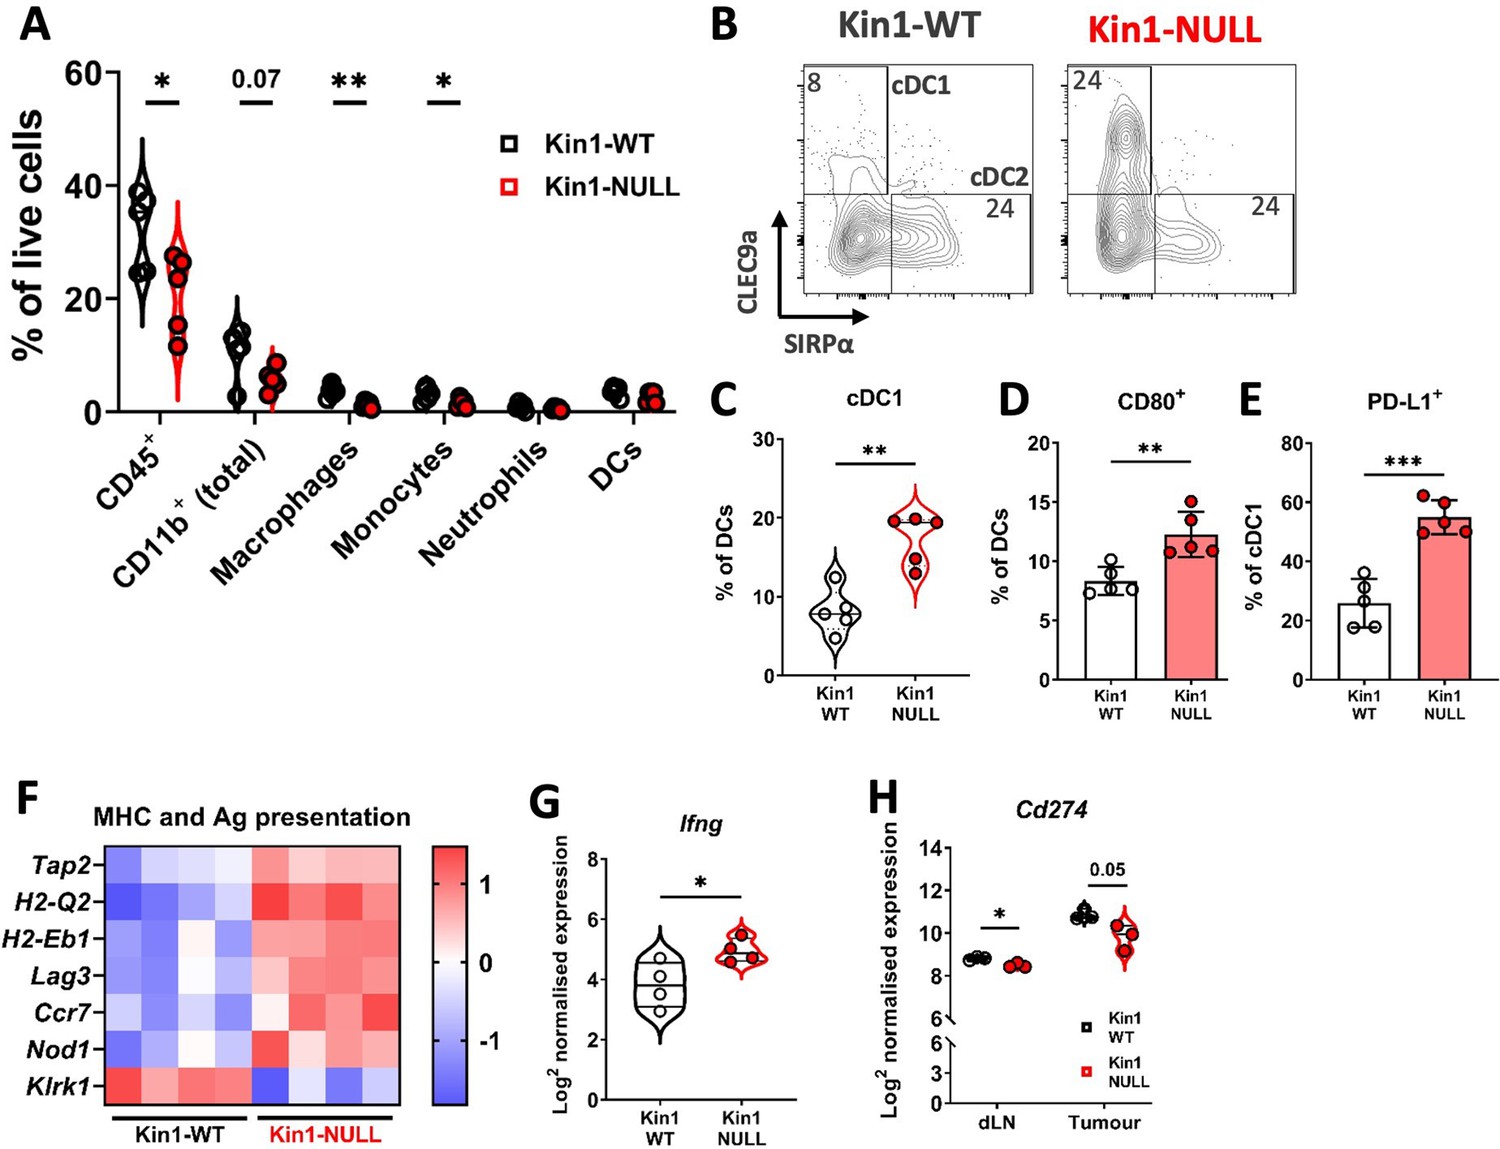
Loss of Kindlin-1 reduces tumor associated macrophages and increases cDC1 dendritic cells.
(A) Met-1 Kin1-WT or Kin1-NULL tumors were established via subcutaneous injection in FVB mice, and harvested at day 10 for immunophenotyping by flow cytometry. Major myeloid populations were quantified as a percentage of live (total) cells. Gating demonstrated in Figure 2—figure supplement 1. (B) Raw FACS plots demonstrating gating of cDC1 and cDC2 cells, and quantified (C) as a percentage of total DCs (CD11c+ MHC II+). (D) Quantification of CD80 expression on total DCs by flow cytometry. (E) Quantification of PD-L1 expression on cDC1 cells. (F) As in A but bulk tumors were harvested for RNA expression analysis using Nanostring PanCancer Immune panel. Differentially expressed genes related to the gene sets ‘MHC’ and ‘Antigen (Ag) presentation’ are shown. (G) Expression of Ifng using Nanostring PanCancer Immune panel comparing Met-1 Kin1-WT and Kin1-NULL cells. (H) Expression of Cd274 (PD-L1) on isolated CD45+ cells using Nanostring Immune Exhaustion panel comparing draining lymph nodes (dLN) and tumors from Met-1 Kin1-WT and Kin1-NULL tumor bearing mice. Example of two independent experiments (A–E), n=3–5 per group, error bars = SD. For F, fold change cut off = 1.2, FDR =< 0.05. Unpaired t-test with * =< 0.05, ** =< 0.01, *** =< 0.001. Further macrophage and dendritic cell profiling shown in Figure 2—figure supplement 2.
Figure 2—figure supplement 1
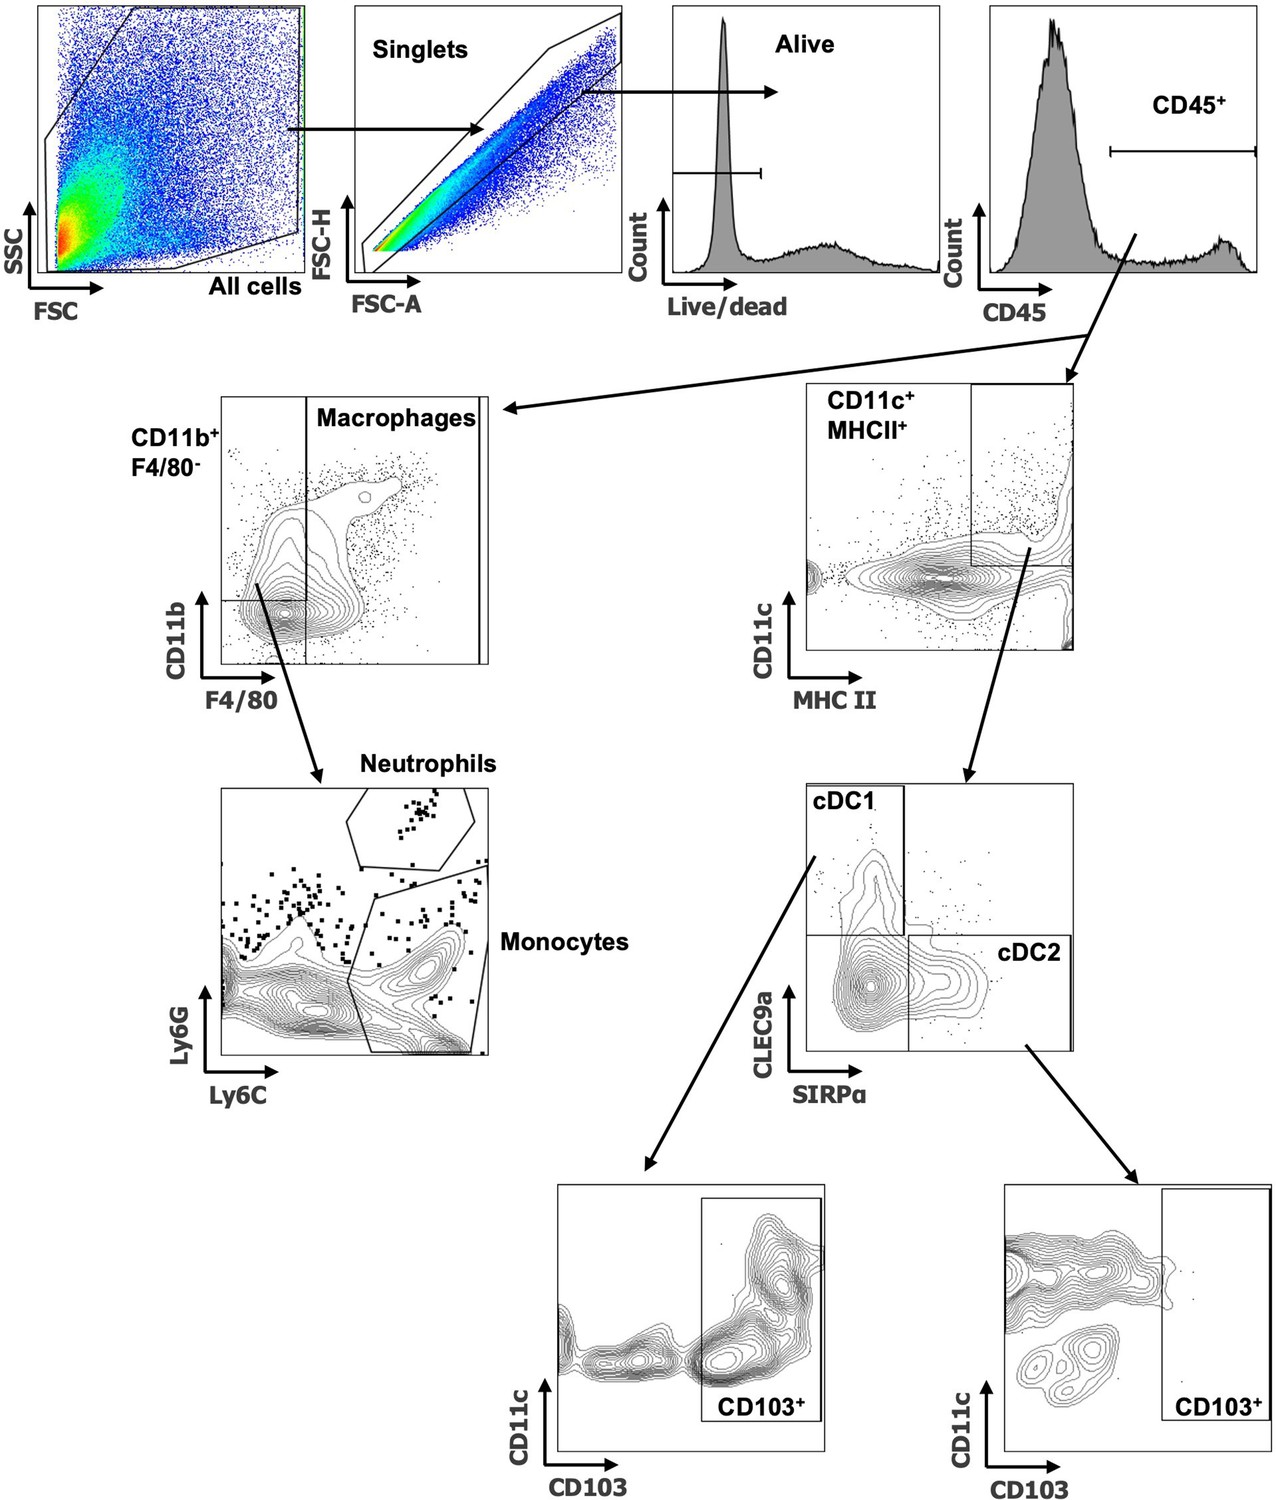
Flow cytometry gating examples of myeloid populations.
Example of tumor myeloid cell gating shown. First debris is removed by All cells gate, followed by singlets and live cells. CD45+ cells are selected for downstream identification of Macrophages (F4/80+), Neutrophils (CD11b+ F4/80- Ly6Ghi Ly6cint) and Monocytes (CD11b+ F4/80- Ly6Glo Ly6C+). Total dendritic cells (DCs) were defined as CD11c+ MHC II+ with further downstream gating of cDC1 (CLEC9a+ SIRPα-) and cDC2 (CLEC9a- SIRPα+). Expression of CD103 was then assessed on cDC1s and cDC2s.
Figure 2—figure supplement 2
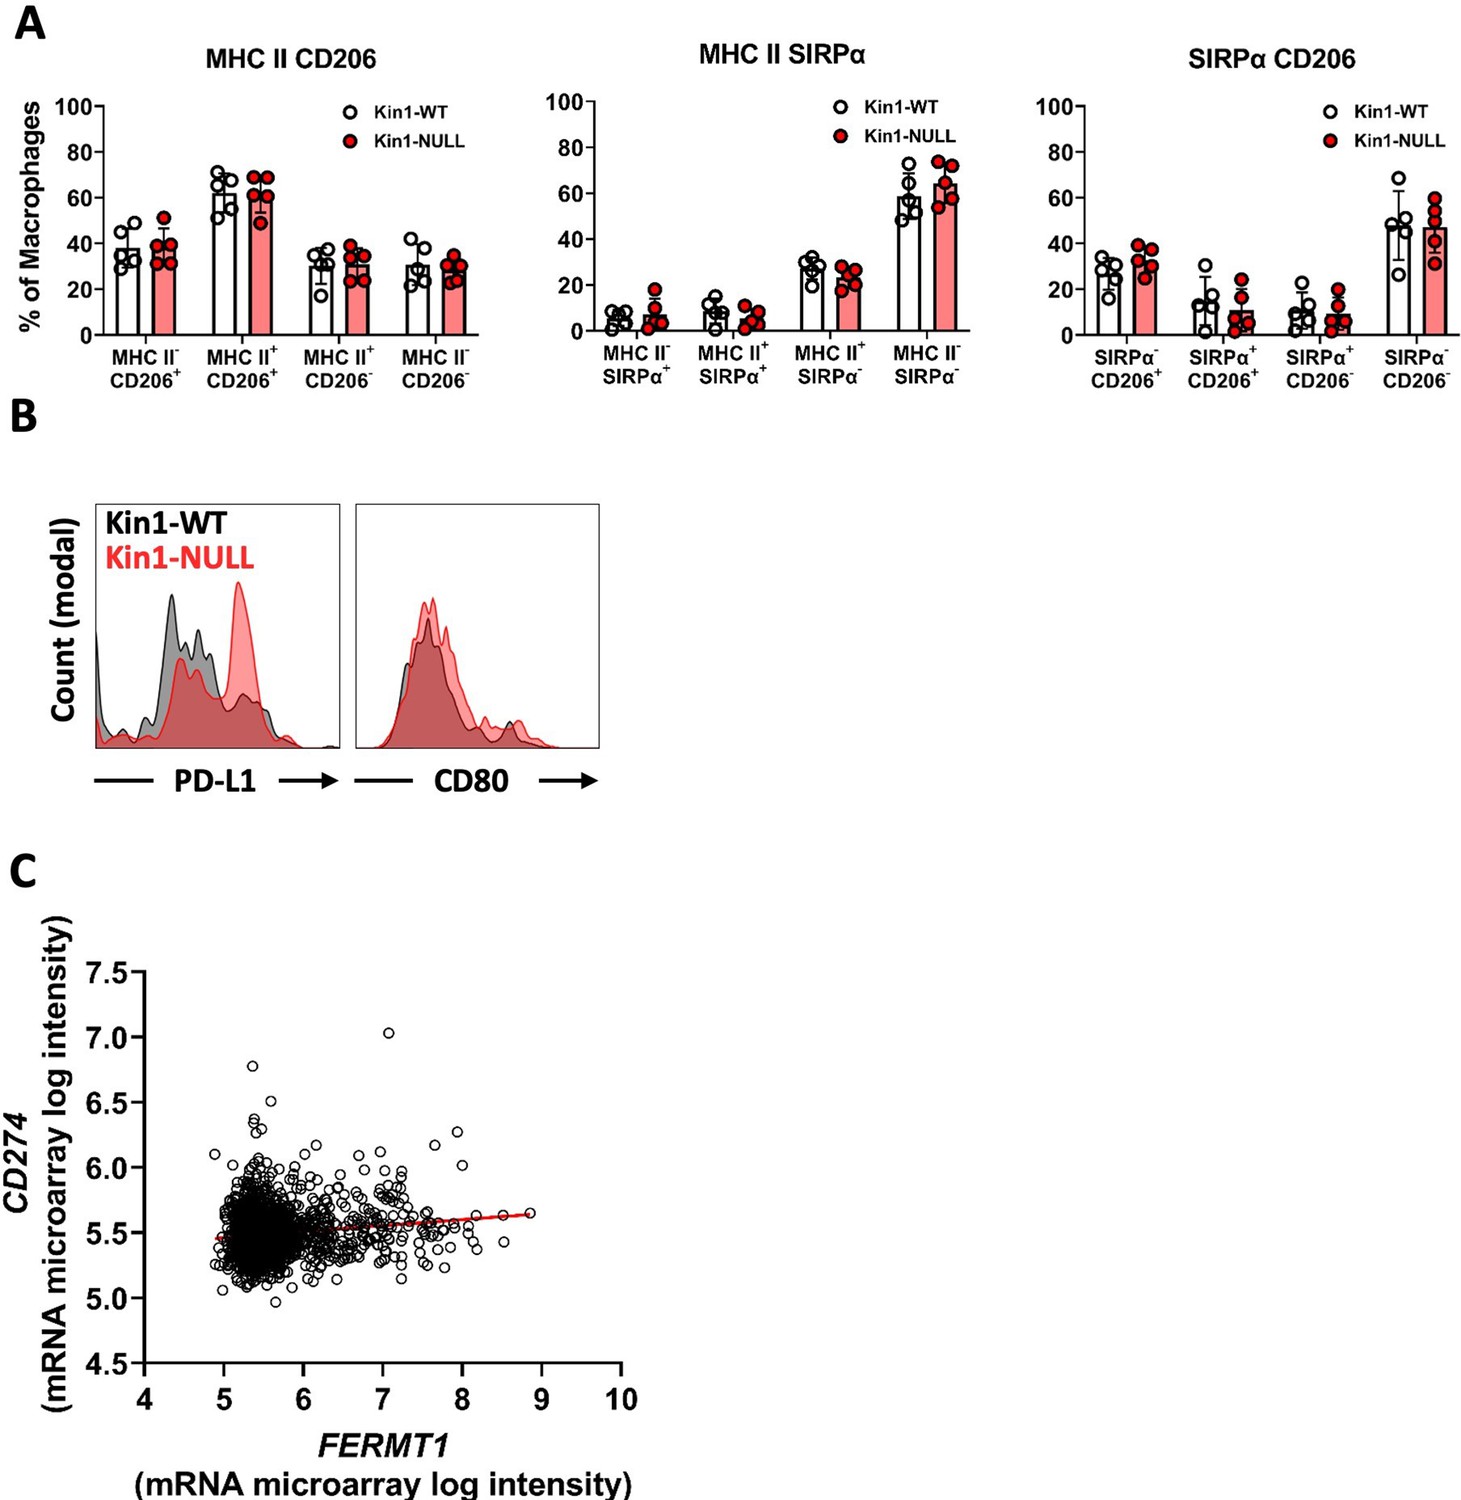
Macrophage and dendritic cell profiling in Met-1 tumors and PD-L1- Kindlin-1 correlation in human breast cancer dataset.
(A) Quantification of MHC II and CD206 (left), MHC II and SIRPα (middle), and SIRPα and CD206 (right) as a percentage of total macrophages infiltrating MET-1 tumors. Data representative of two independent experiments. n=5 per group, error bars = SD. (B) Representative histograms of PD-L1 and CD80 expression on cDC1 cells in Met-1 Kin1-WT and NULL tumors. (C) Correlation analysis of FERMT1 (Kindlin-1) and CD274 (PD-L1) using METABRIC human breast cancer data set. n=1904,, r=0.1375 (95% confidence interval 0.09–0.18), p<0.0001.
Figure 3 with 3 supplements
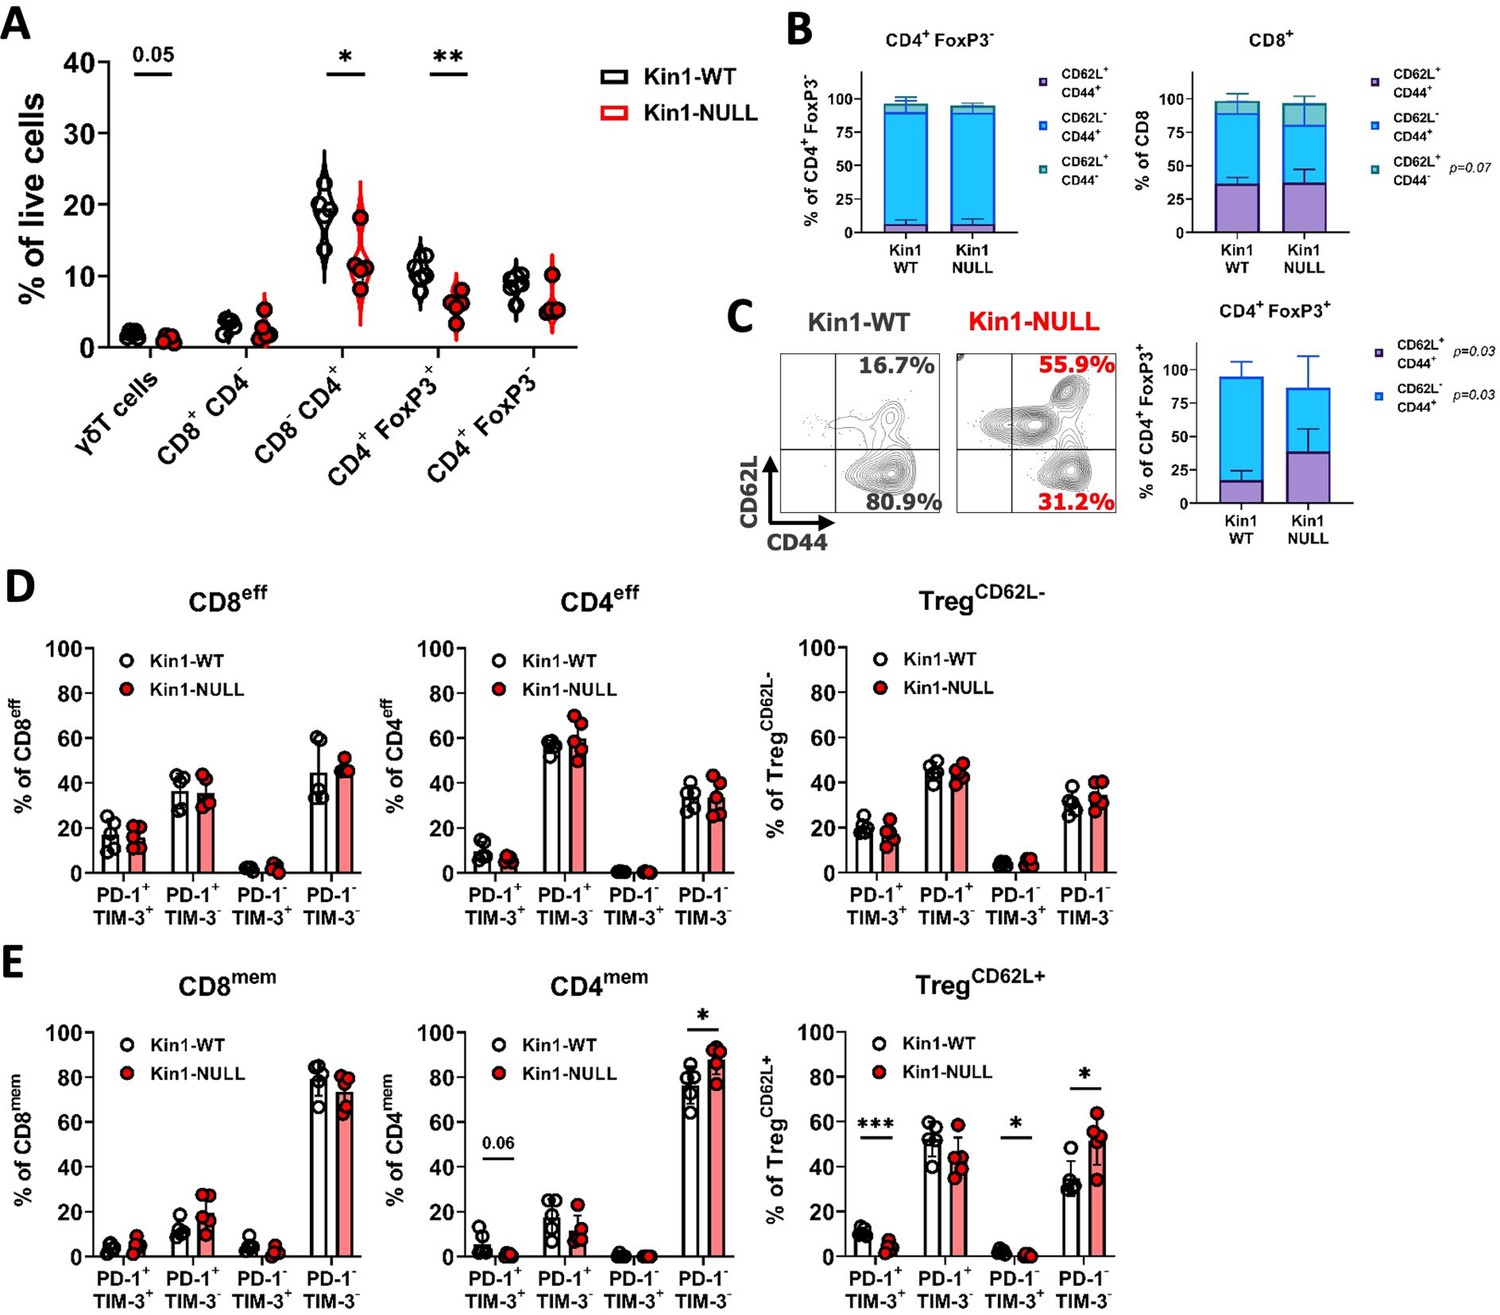
Loss of Kindlin-1 reduces tumor infiltrating Treg cells.
(A) Met-1 Kin1-WT or Kin1-NULL tumors were established via subcutaneous injection in FVB mice, and harvested at day 10 for immunophenotyping by flow cytometry. Gating of major T cell populations was conducted and quantified as percentage of total (alive) cells. Gating provided and further population analysis in Figure 3—figure supplements 1 and 2. (B) Quantification of effector (CD62L- CD44+), memory (CD62L+ CD44+) and naive (CD62L+ CD44-) populations as a percentage of corresponding T cell subset. (C) Representative example of gating resting Tregs (CD62L+) and activated Tregs (CD62L-) in tumors, with quantification on the right. (D, E) Quantification of PD-1 and TIM-3 expression on T cell subset effector (or CD62L-) populations (D) and memory (or CD62L+) populations (E). Example of two independent experiments (A–E). n=3–5 per group, error bars = SD. Unpaired t-test with * =< 0.05, ** =< 0.01, *** =< 0.001. Similar analysis of MMTV-PyV tumors provided in Figure 3—figure supplement 3.
Figure 3—figure supplement 1
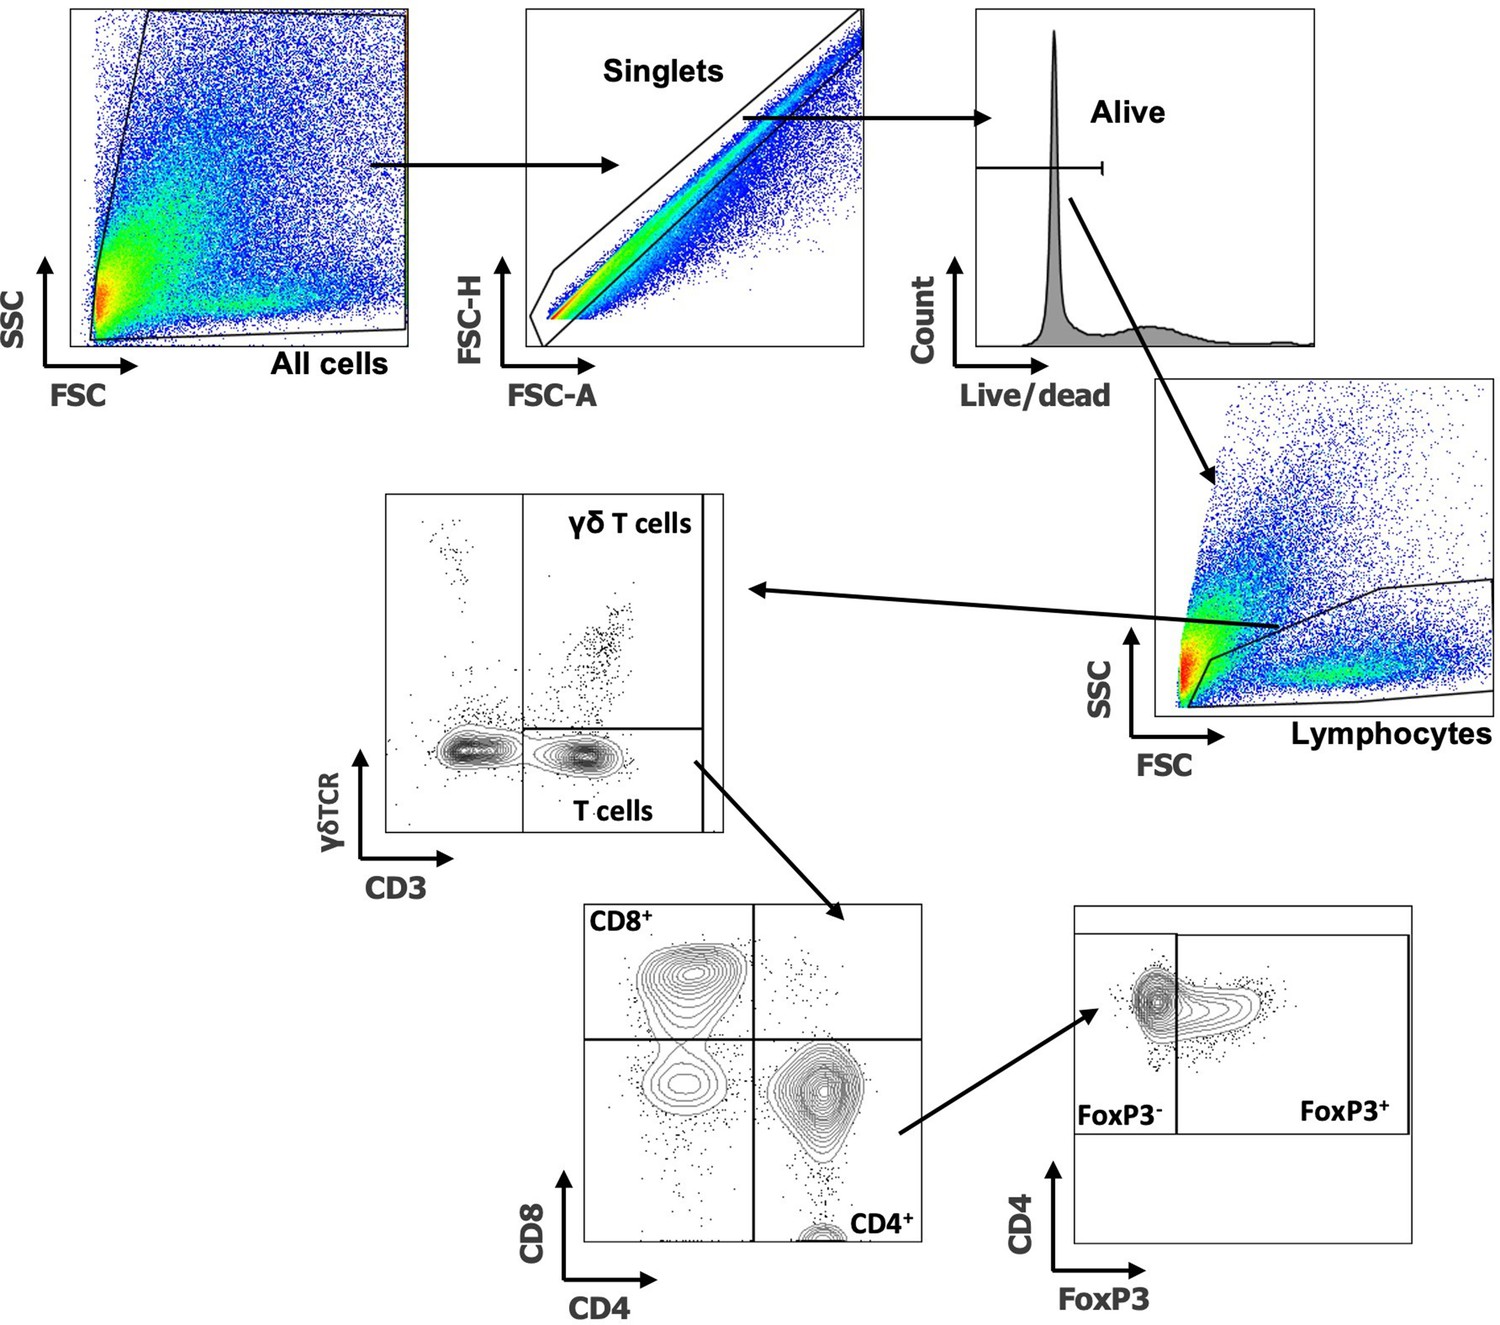
Flow cytometry gating examples of T cell populations.
Example of tumor T cell cell gating shown. First debris is removed by All cells gate, followed by singlets, live cells and lymphocytes. γδT cells (CD3+ γδTCR+) and T cells (CD3+ γδTCR-) were gated. T cells were then further subdivided into CD8+ and CD4+ T cells. From the CD4+ gate Tregs (FoxP3+) and non-Treg CD4s (FoxP3-) were gated.
Figure 3—figure supplement 2

Loss of Kindlin-1 reduces tumor infiltrating Treg cells.
(A) Met-1 Kin1-WT or Kin1-NULL tumors were established via subcutaneous injection in FVB mice, and harvested at day 10 for immunophenotyping by flow cytometry. Gating of CD3+ cells was conducted with subsequent gating and quantification of major T cell populations (B) as percentage of total CD3+ cells. (C) As in A but quantification of T cell subset in spleen (left) and draining (inguinal) lymph nodes (right). Example of two independent experiments (A–C). n=3–5 per group. Unpaired t-test with *=<0.05, ** =< 0.01, *** =< 0.001.
Figure 3—figure supplement 3
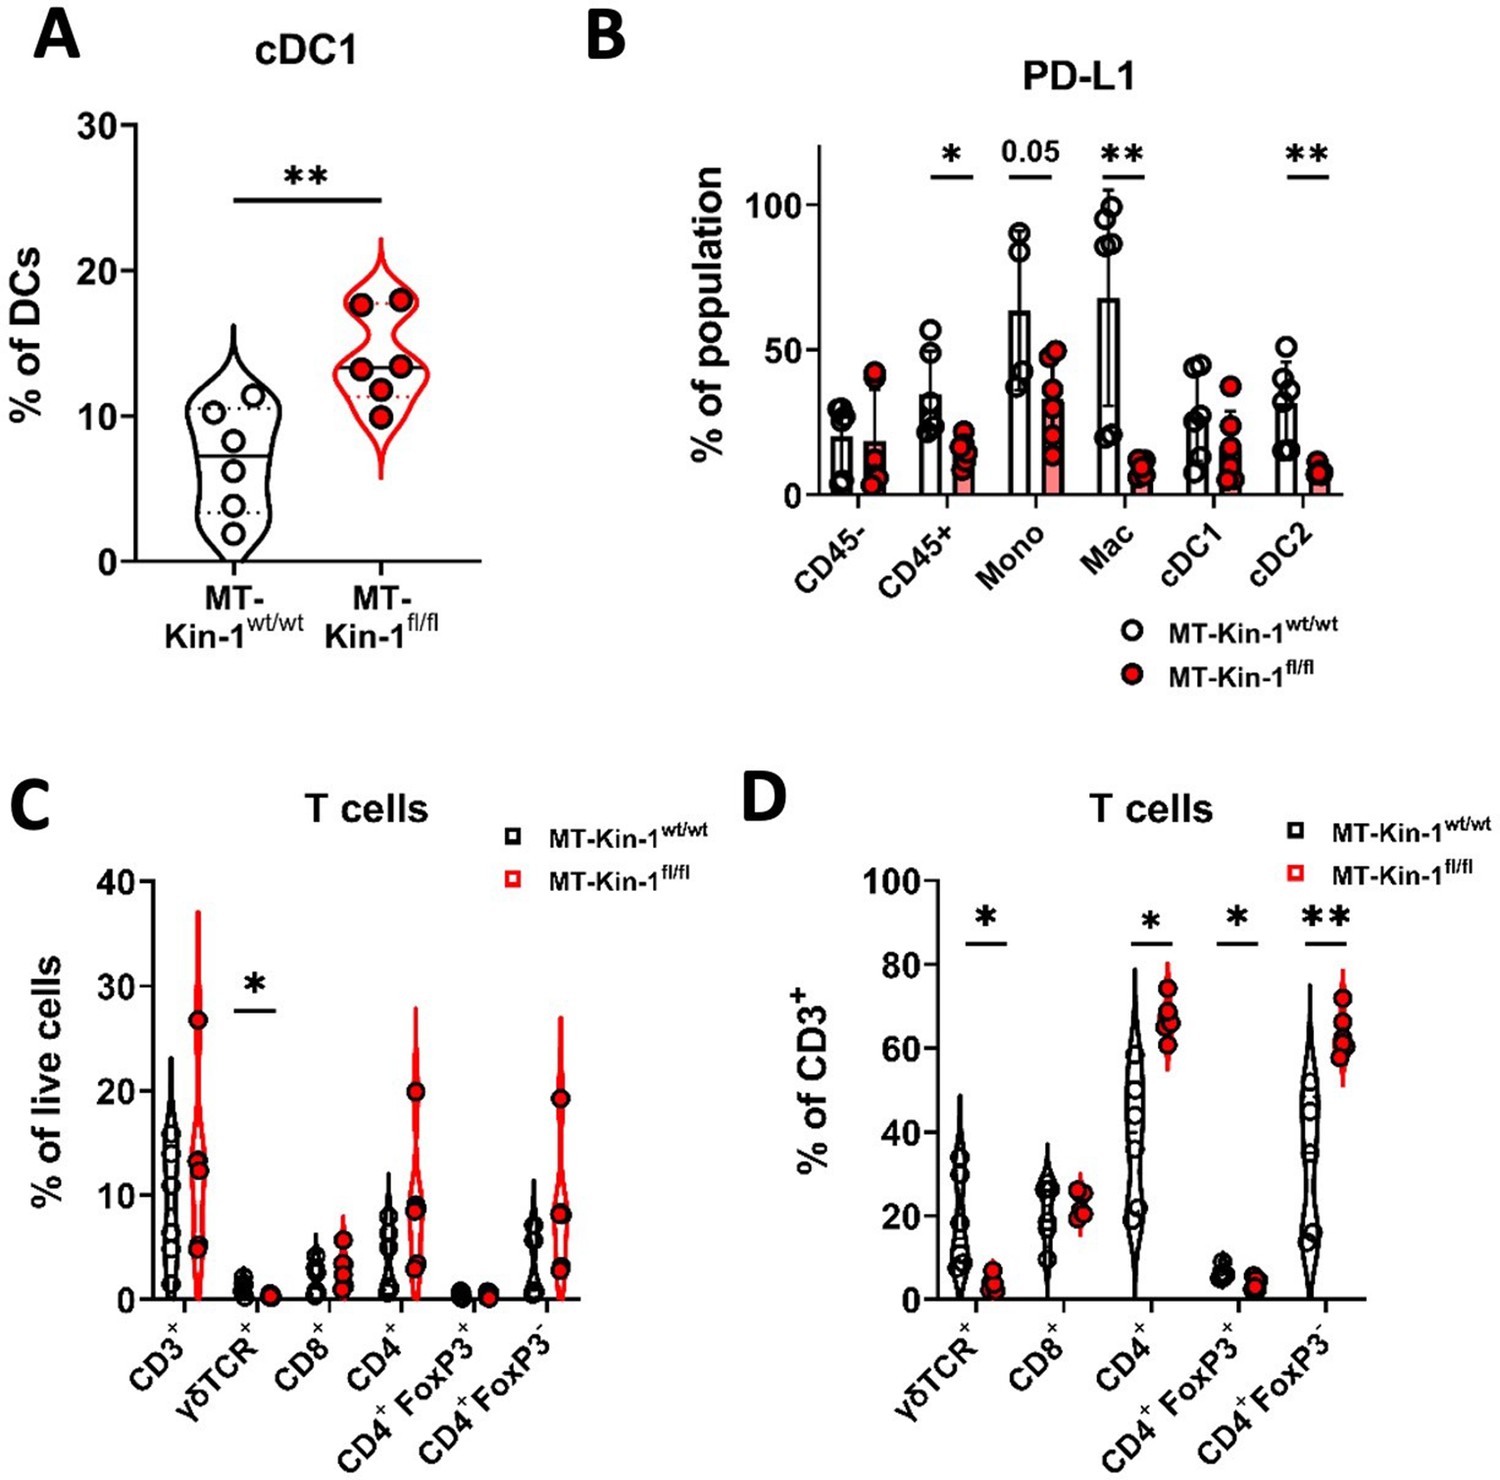
Immune modulation in MMTV-PyV MMTV-Kin-1wt/wt and MMTV-Kin-1fl/fl spontaneous tumor model.
(A) Spontaneous MT-Kin-1wt/wt or MT-Kin-1fl/fl tumors were harvested once 1 tumour reached 10 mm for immunophenotyping by flow cytometry. Quantification of cDC1 cells as a percentage of total DCs (CD11c+ MHC II+). (B) Quantification of PD-L1 expression on non-immune (CD45-) and myeloid subsets from MT-Kin-1wt/wt or MT-Kin-1fl/fl tumours, as a percentage of the corresponding cell population. (C) As in A but quantification of major T cell subsets as a % of live (total) cells and, (D) % of CD3+ cells. n=5–6 mice per group, error bars = SD. Unpaired t-test with *=<0.05, ** =< 0.01.
Figure 4 with 1 supplement
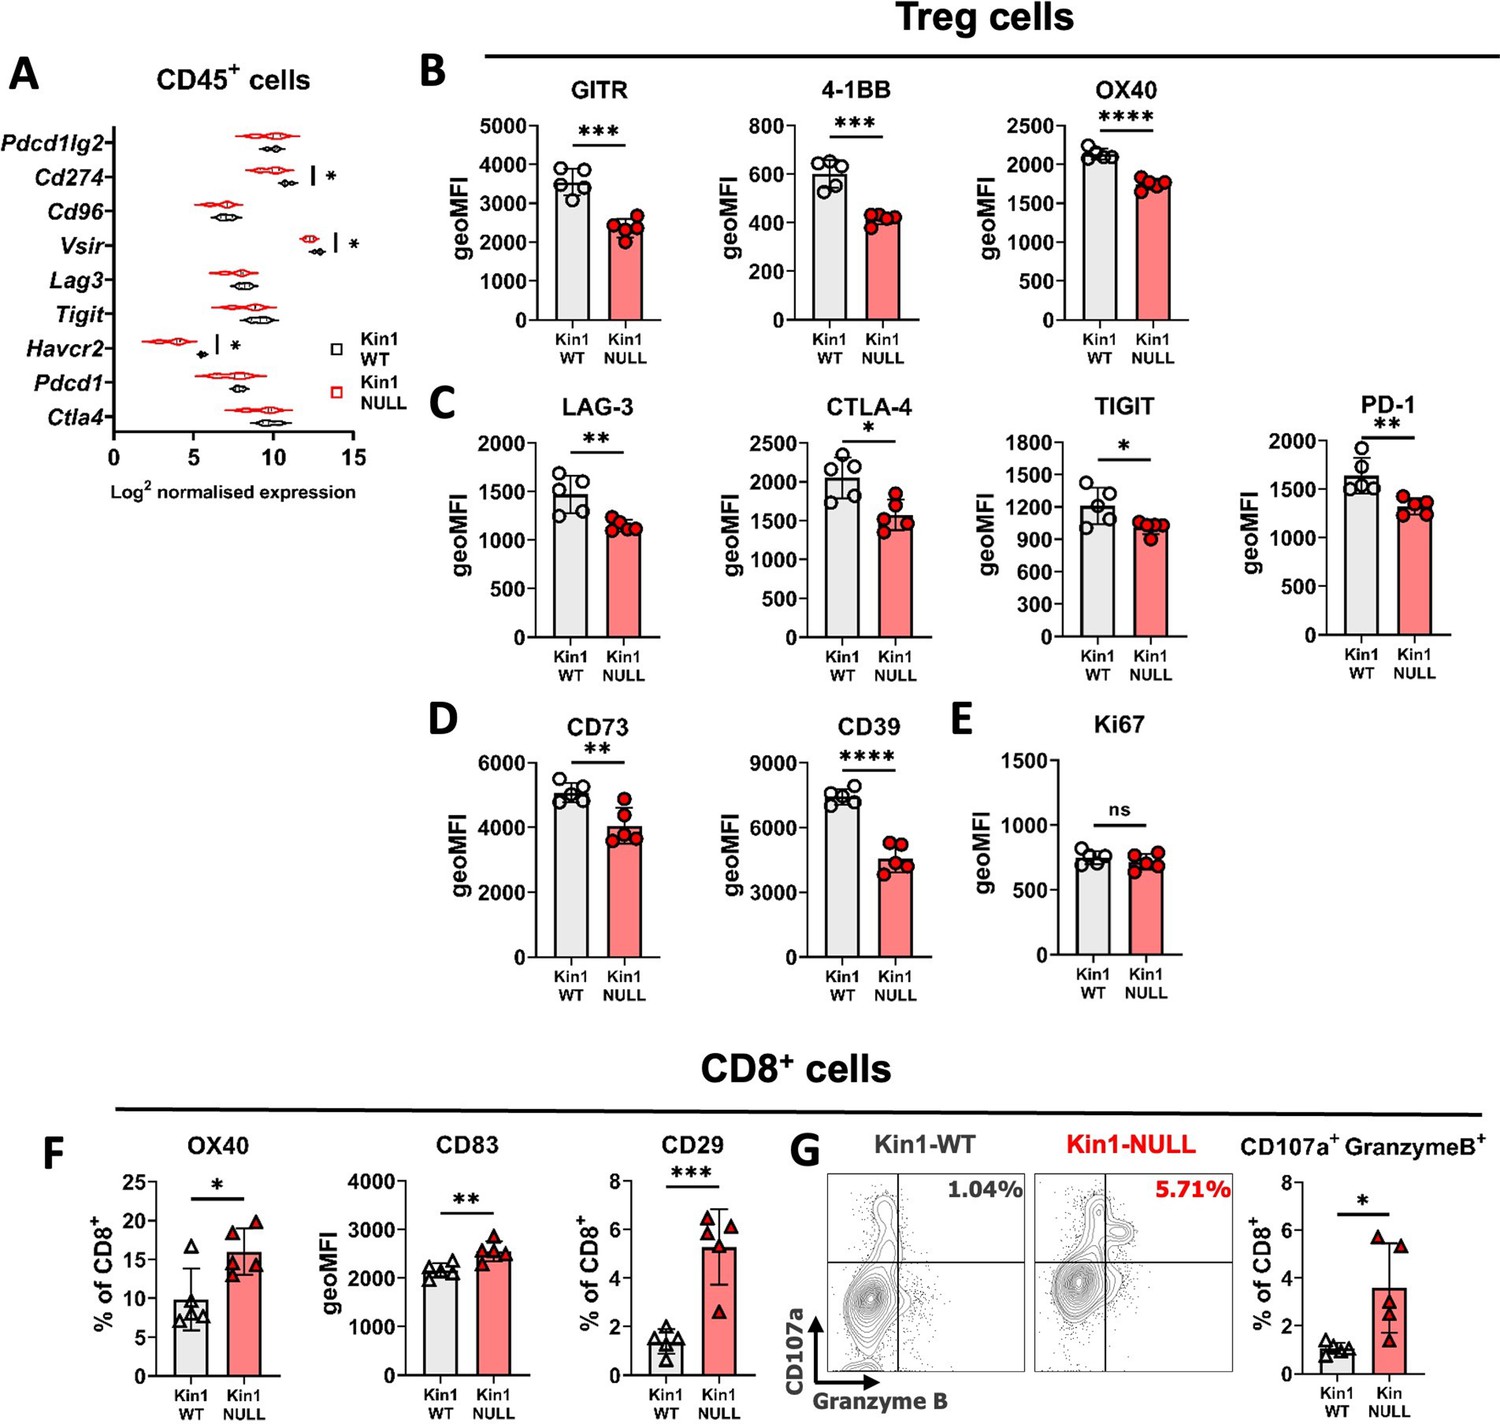
Loss of Kindlin-1 modulates Treg phenotype and function.
(A) Met-1 Kin1-WT or Kin1-NULL tumors were established via subcutaneous injection in FVB mice, and harvested at day 10 for RNA analysis of isolated CD45+ cells using Nanostring Immune Exhaustion panel. Shown is log2 normalised expression of known T cell inhibitory receptors and pathways. n = 3 per group. (B) As in A but tumors harvested for immunophenotyping by flow cytometry. Analysis of expression of markers were assessed on gated CD4+ FoxP3+ T cells (Tregs). Quantification of expression as geo mean fluorescent intensity (geoMFI) shown for TNF superfamily members (B), known inhibitory receptors (C), metabolism related receptors (D) and proliferation marker (E). Histograms and percentage expression is shown in Figure 4—figure supplement 1. (F) As in A with quantification of activation associated receptors on tumor infiltrating CD8+T cells. (G) Expression of markers of degranulation (CD107a) and cytotoxicity (Granzyme B) in tumor infiltrating CD8+ T cells. Example contour plots (left) and quantification of double positive cells (right). n=4–5 per group, error bars = SD. Unpaired t-test with * =< 0.05, ** =< 0.01, *** =< 0.001, **** =< 0.0001.
Figure 4—figure supplement 1
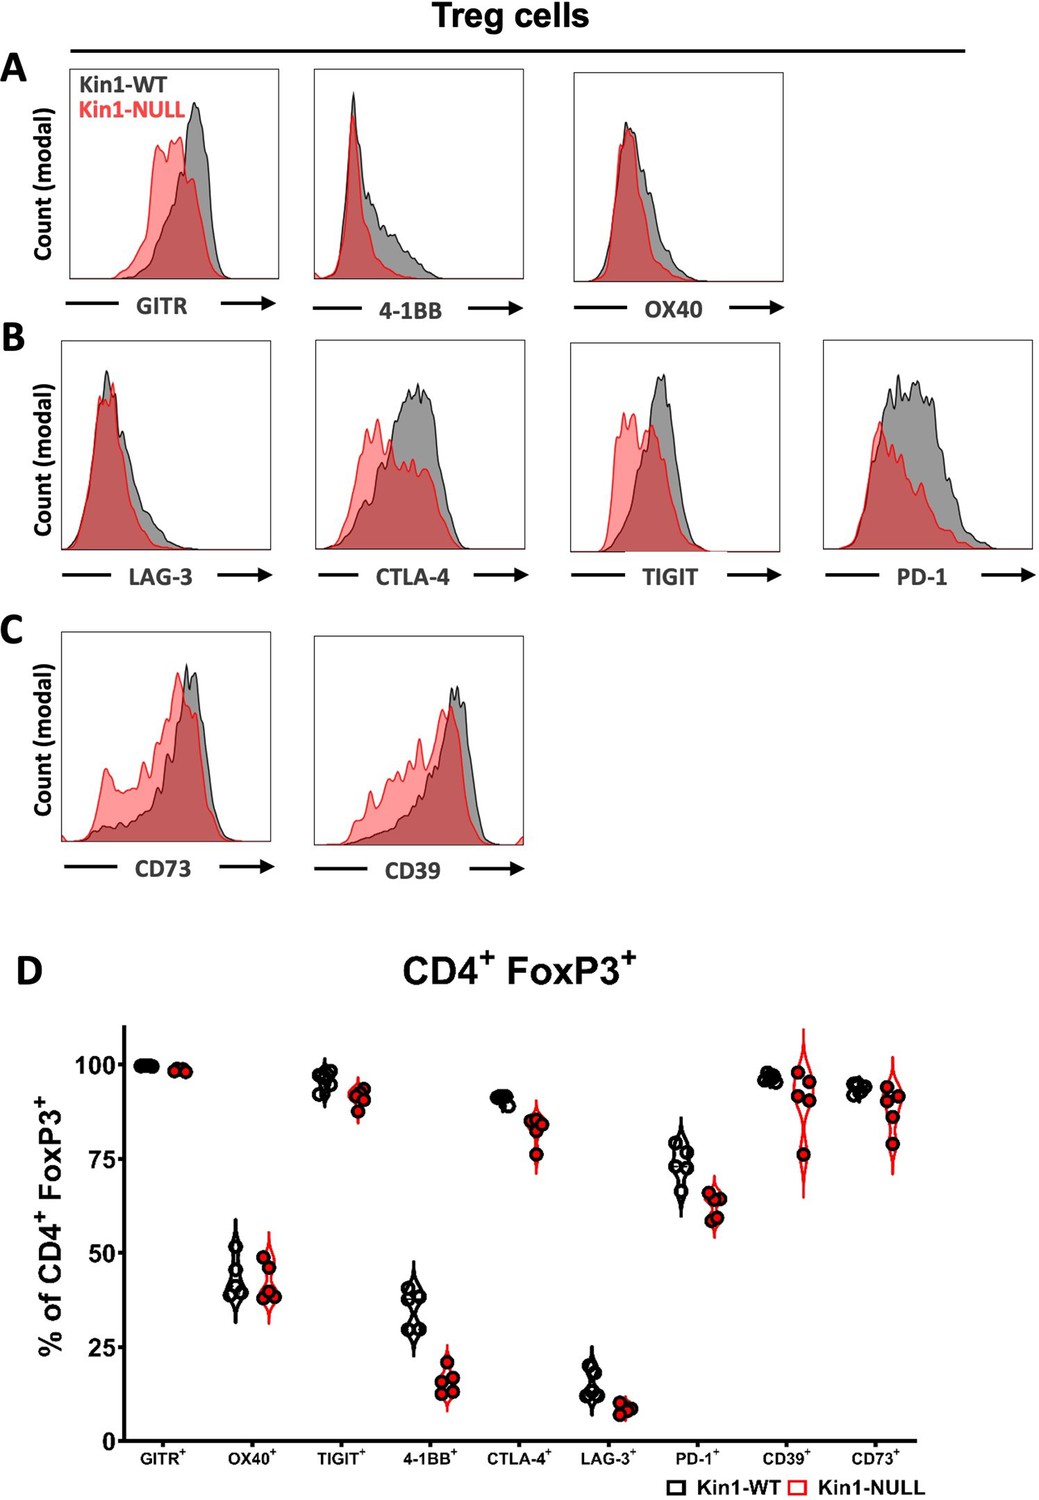
Loss of Kindlin-1 modulates Treg phenotype markers.
(A–D) Met-1 Kin1-WT or Kin1-NULL tumors were established via subcutaneous injection in FVB mice, and harvested at day 10 for immunophenotyping by flow cytometry. Analysis of expression of markers was assessed on Tregs (CD4+ FoxP3+). (A–C) Example histograms of marker expression. (D) Expression shown as a percentage of Treg population. n=4–5 per group.
Figure 5 with 3 supplements

Loss of Kindlin-1 leads to altered cytokine secretion.
(A) Met-1 Kin1-WT or Kin1-NULL cells were cultured for 48 hr before conditioned media (CM) was harvested for analysis by forward phase protein array. Proteins detected above background are shown as fold change over Kin1-WT. Individual data points and Met-1 Kin1-AA are shown in Figure 5—figure supplement 2A. (B) Quantification of IL-6 in Met-1 conditioned media via ELISA. (C) Bulk tumor RNA analysis of Met-1 Kin1-WT or Kin1-NULL tumors at day 10. Log2 normalised expression of IL-6-related genes are shown. Expression of Cxcl13 genes is shown in Figure 5—figure supplement 2B. (D) As in C for Met-1 Kin1-WT or Kin1-NULL cells in vitro. n = 3-6 per group, error bars = SD. Unpaired t-test with *=<0.05, ** =< 0.01, *** =< 0.001, **** =< 0.0001. Expression of TGFβ signaling genes is shown in Figure 5—figure supplement 1, with quantification of B cells shown in Figure 5—figure supplement 3.
-
Figure 5—source data 1
Forward Phase Protein Array of Met-1 cells (raw values).
- https://cdn.elifesciences.org/articles/85739/elife-85739-fig5-data1-v2.xlsx
-
Figure 5—source data 2
Nanostring PanCancer Immune panel analysis of Met-1 Kin1-WT and NULL cells in vitro.
- https://cdn.elifesciences.org/articles/85739/elife-85739-fig5-data2-v2.xlsx
Figure 5—figure supplement 1
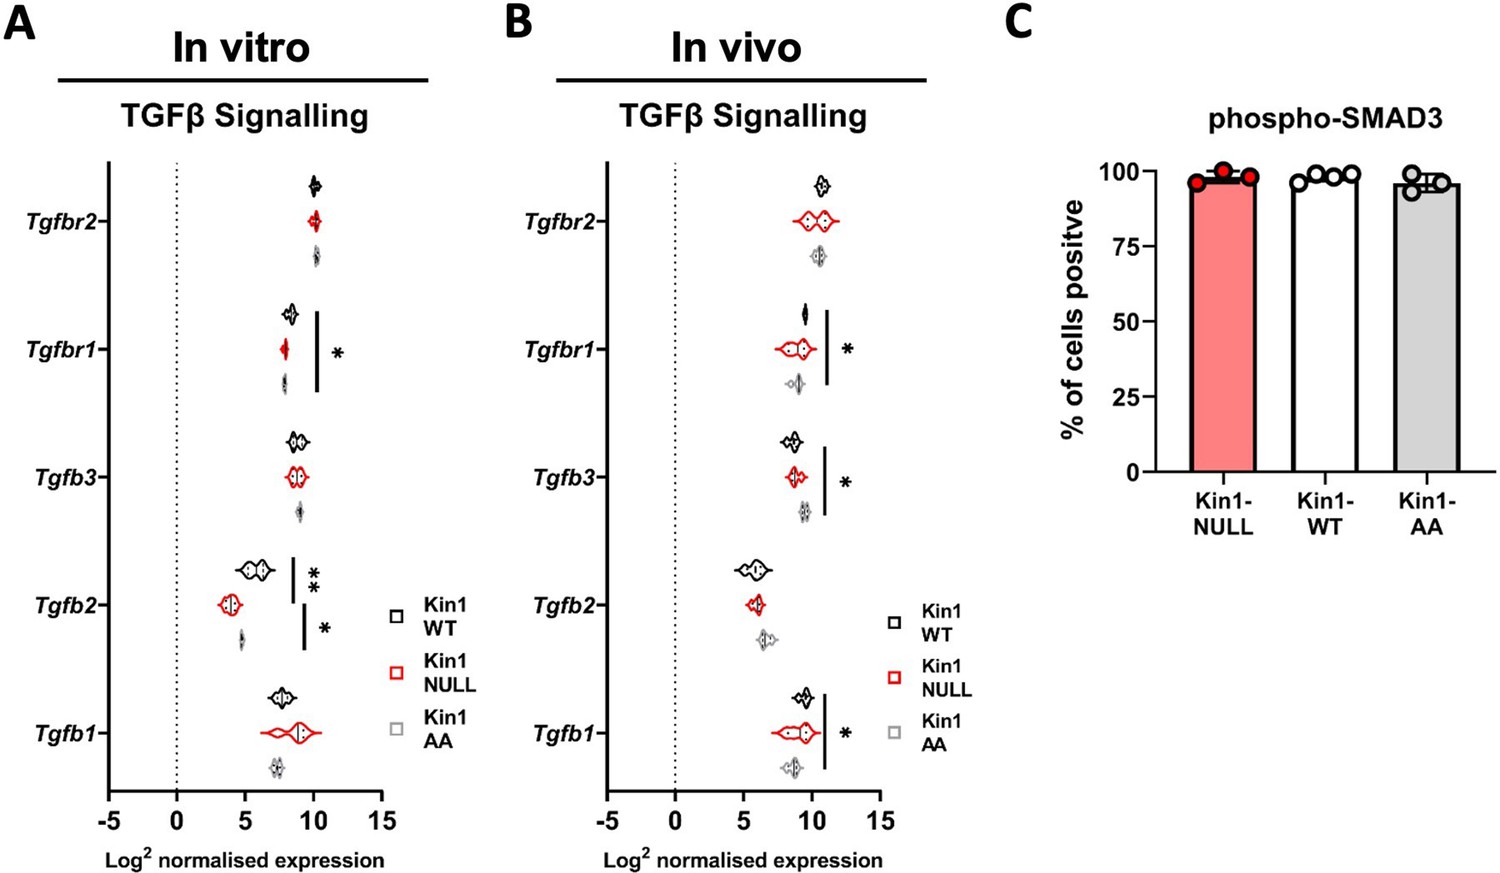
Analysis of TGFβ signaling in Met-1 Kin1-WT, NULL tumors.
(A) RNA analysis of TGFβ signalling related genes in Met-1 Kin1-WT and NULL cells in vitro, using Nanostring PanCancer immune profiling panel. (B) Met-1 Kin1-WT, NULL and AA tumors were established via subcutaneous injection in FVB mice, and harvested at day 10 for bulk tumour RNA analysis of TGFβ signalling related genes using Nanostring PanCancer immune profiling panel. (C) Immunohistochemistry analysis of phosphorylated SMAD3 in FFPE sections of Met-1 Kin-1 WT, NULL and AA tumours. n=3 biological replicates (A), n=4 mice per group (B), n=3-4 mice per group, error bars = SD (C). Unpaired t-test with * =< 0.05 and ** =< 0.01.
Figure 5—figure supplement 2

Quantification of CXCL13 and IL-6 in Met-1 Kin1-WT, Kin1-NULL and Kin1-AA cells.
(A) Met-1 Kin1-WT, Kin1-NULL, and Kin1-AA cells were cultured for 48 hr before conditioned media (CM) was harvested for analysis by forward phase protein array. Data for CXCL13 and IL-6 from Figure 5 are presented here with individual data points and Met-1 Kin-1-WT, -NULL and -AA shown as fold change to WT. (B) RNA analysis of Met-1 Kin1-WT and Kin1-NULL cells in vitro. Log2 normalised expression of Cxcl13 and its receptor Cxcr5 are shown. n=3 biological replicates, error bars = SD. Unpaired t-test with * =< 0.05, ** =< 0.01, *** =< 0.001.
Figure 5—figure supplement 3

Quantification of B cells in Met-1 Kin1-WT and Kin1-NULL tumors.
Met-1 Kin1-WT or Kin1-NULL tumors were established via subcutaneous injection in FVB mice, and harvested at day 10 for immunophenotyping by flow cytometry. Gating of CD3- cells was conducted with subsequent gating of B220+B cells as a percentage of total cells. n=3 per group. Unpaired t-test.
Figure 6 with 1 supplement
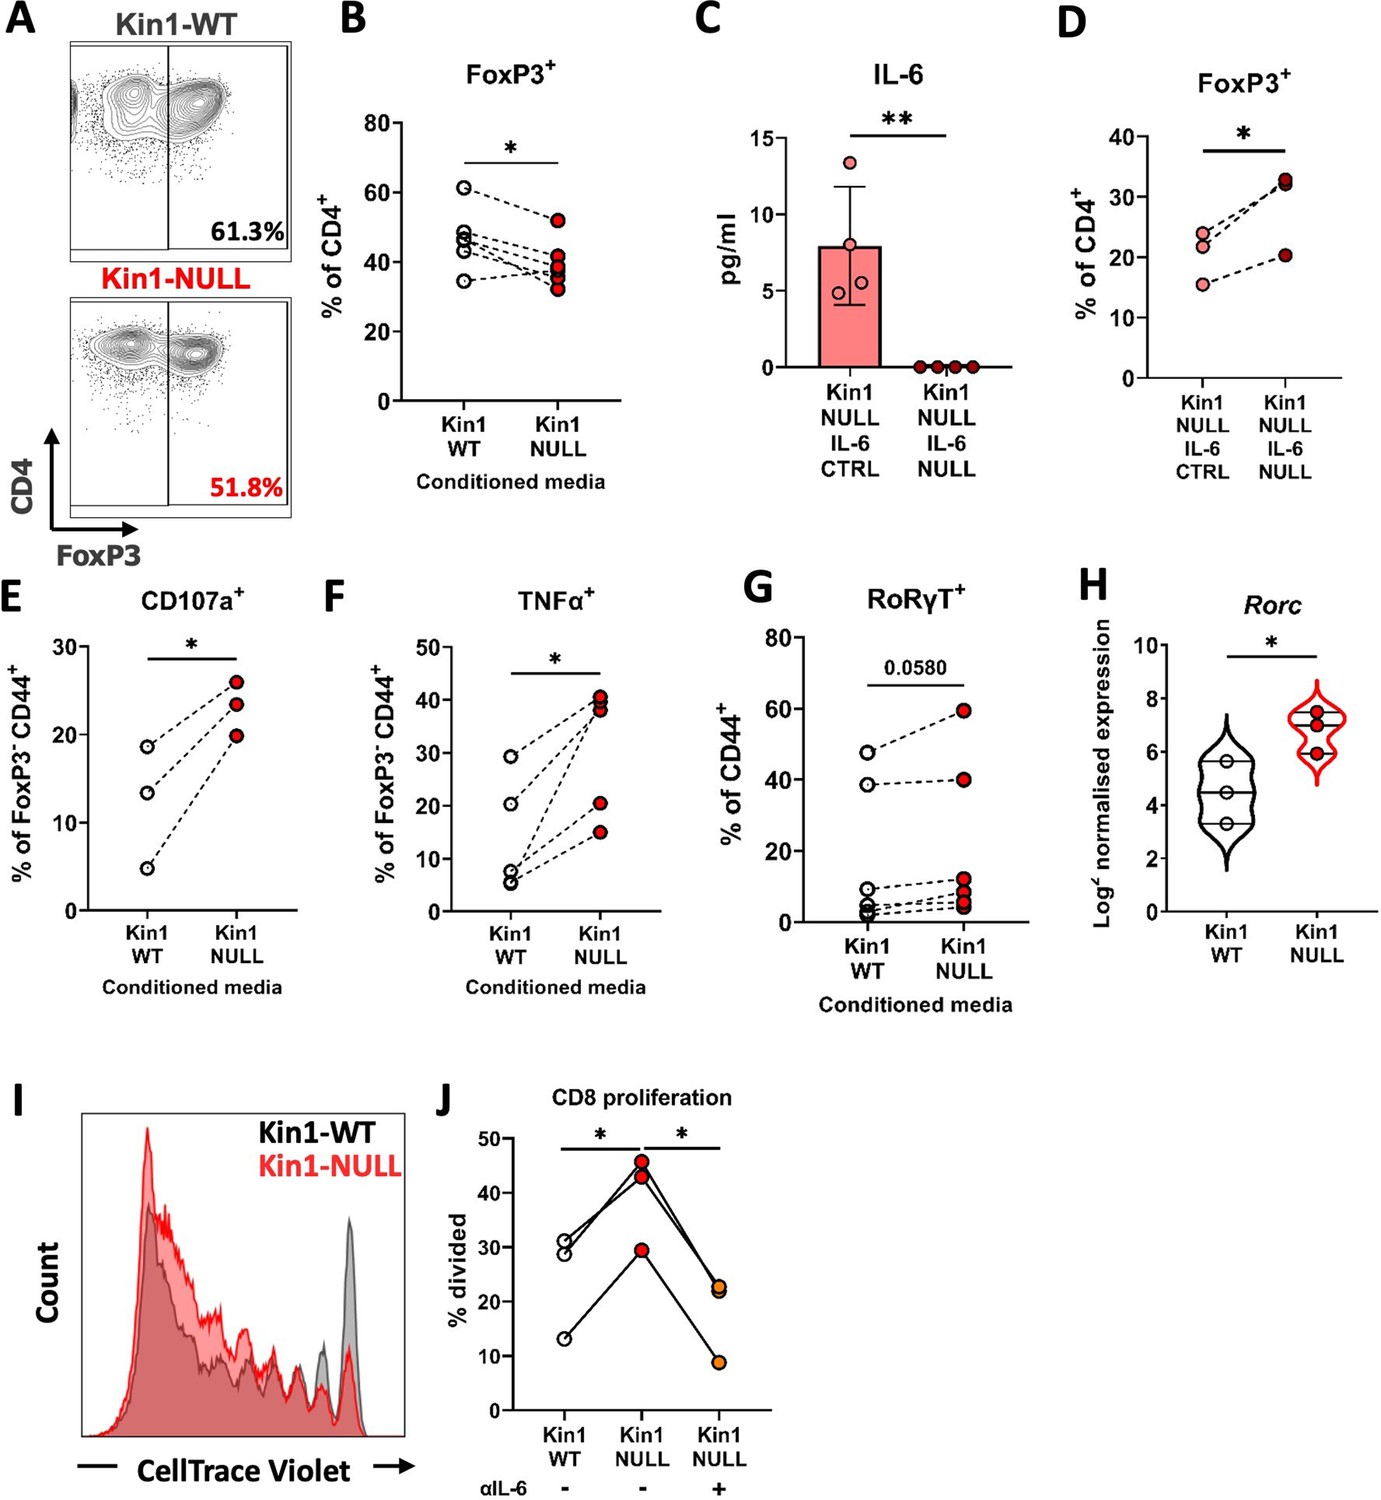
Loss of Kindlin-1 leads to modulation of Treg differentiation and function.
(A–B) Met-1 Kin1-WT or Kin1-NULL cells were cultured for 48 hr before conditioned media (CM) was harvested. Naïve CD4+ T cells were isolated from FVB mice spleens and stimulated in the presence of either Met-1 Kin1-WT or Kin1-NULL CM. At day 5 T cells were harvested for analysis of Treg differentiation by expression of FoxP3 (A). Example of gating is shown together with, (B) quantification as percentage of CD4+ cells. (C) Genetic knockout of IL-6 was performed in Met-1 Kin1-NULL cells (Kin1-NULL IL-6 NULL), with a no crRNA control (Kin1-NULL IL-6 CTRL). IL-6 knockout was assessed by ELISA of CM. (D) Naive CD4+ differentiation assay was performed as in A, using CM from Met-1 Kin1-NULL IL-6 NULL and CTRL cells. Analysis of Treg differentiation was conducted. Same is shown for CXCL13 blocking in Figure 6—figure supplement 1. (E, F) As in A with expression of degranulation marker CD107a (E) and functional cytokine TNFα (F) production in FoxP3- CD4 T cells. (G) As in A with quantification of RoRγT expression as a percentage of CD4+ FoxP3- CD44+ cells. (H) Rorc gene expression in isolated CD45+ cells from either Met-1 Kin1-WT or Kin1-NULL tumors as shown as Log2 normalised expression. (I) CD8+ CD4- CD25- and CD8- CD4+ CD25hi (Treg) cells were sorted from FVB spleens. CD8+ cells were labelled with CellTrace Violet and co-cultured with Tregs under stimulation at a ratio of 1:8 (Treg:CD8), in the presence of conditioned media +/-anti-IL-6 blocking antibody. At day 5, cells were harvested and analysis of proliferation of CD8 cells was conducted. Example histogram of CellTrace Violet staining with (J) quantification of CD8 proliferation shown. n=3–7 per group, error bars = SD. Unpaired t-test with * =< 0.05 and ** =< 0.01.
Figure 6—figure supplement 1
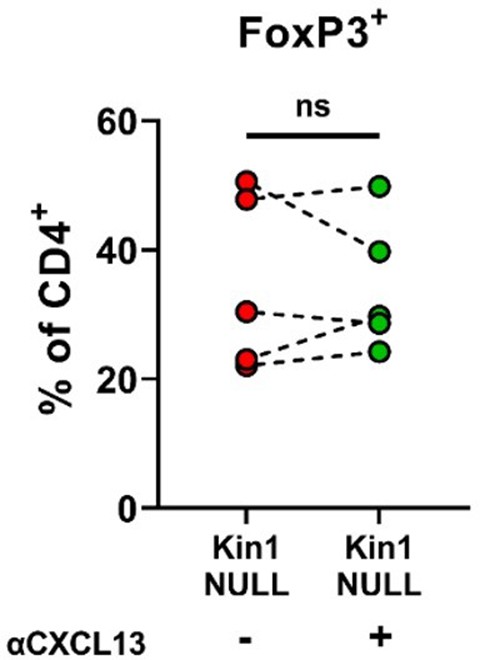
Blocking CXCL13 does not alter Treg differentiation in vitro.
Met-1 Kin1-NULL cells were cultured for 48 hr before conditioned media (CM) was harvested. Naive CD4+ T cells were isolated from FVB mice spleens and stimulated in the presence of Kin1-NULL CM +/– anti-CXCL13 blocking antibody. At day 5, T cells were harvested for analysis of Treg differentiation by expression of FoxP3 as a percentage of CD4+ cells. n=5 per group. Unpaired t-test.
Figure 7 with 1 supplement
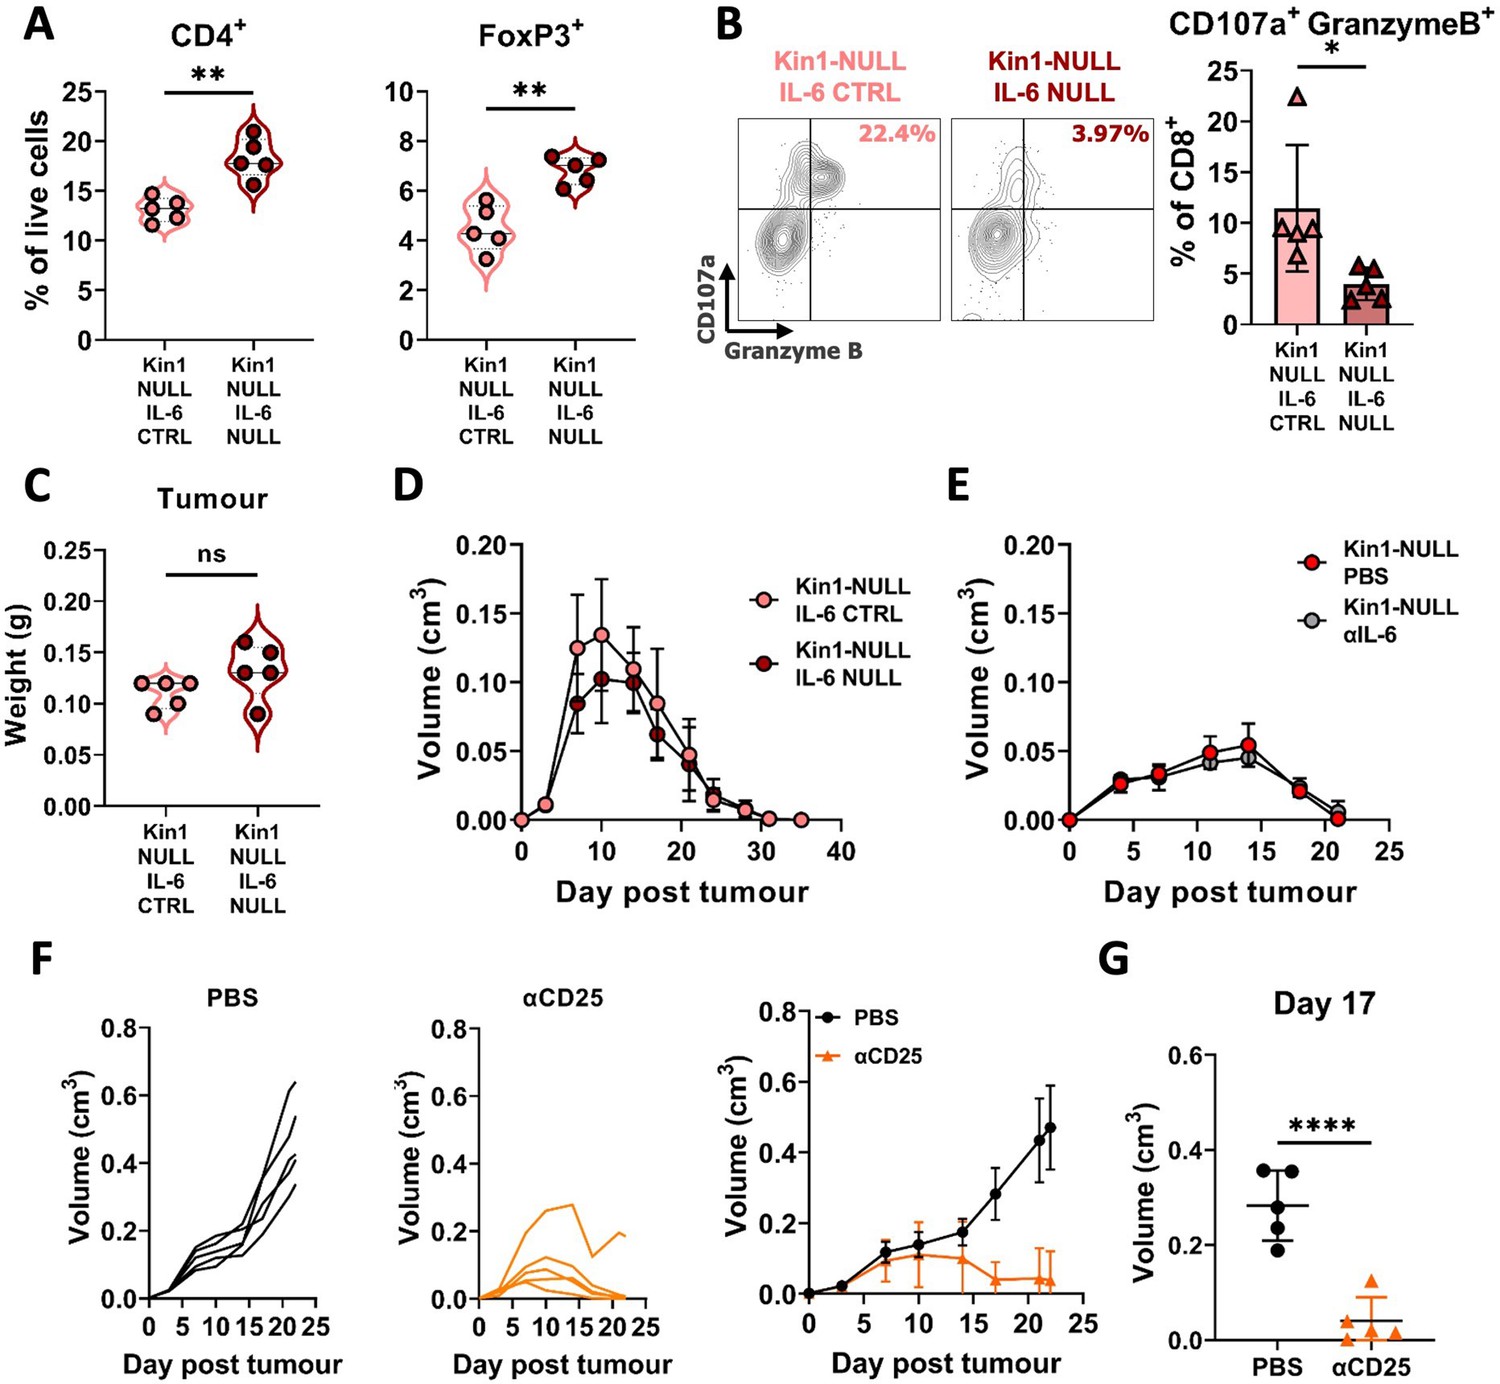
Loss of tumor-derived IL-6 drives changes in Treg numbers and function but is not sufficient to reverse clearance of Kin1-NULL tumors.
(A) Met-1 Kin1-NULL IL-6-CTRL or Kin1-NULL IL-6-NULL tumors were established via subcutaneous injection in FVB mice, and harvested at day 10 for immunophenotyping by flow cytometry. Gating of CD4+ T cell populations was conducted and quantified as percentage of total (alive) cells. (B) As in A with quantification of expression of markers of degranulation (CD107a) and cytotoxicity (Granzyme B) in tumor infiltrating CD8+ T cells. Example contour plots (left) and quantification of double positive cells (right). (C) Weights of tumors from mice shown in A-B. (D) Met-1 Kin1-NULL IL-6-CTRL or Kin1-NULL IL-6-NULL tumors were established via subcutaneous injection in FVB mice. Tumor size was recorded. (E) Met-1 Kin1-NULL tumors were established via subcutaneous injection in FVB mice, with 20 μg anti-IL-6 neutralising antibody administered on Day –1, 0, 4, 8, 12, and 16 post tumor cell injection. Tumor size was recorded. (F) Met-1 tumors were established in mice pre-treated with anti-CD25 to deplete Tregs. Tumor growth for individual mice (left and middle) and averages (right) are shown. Depletion demonstrated in Figure 7—figure supplement 1 (G) Tumor size at Day 17 from F. n=3–7 per group, error bars = SD. Unpaired t-test with * =< 0.05, ** =< 0.01, *** =< 0.001, **** =< 0.0001.
Figure 7—figure supplement 1
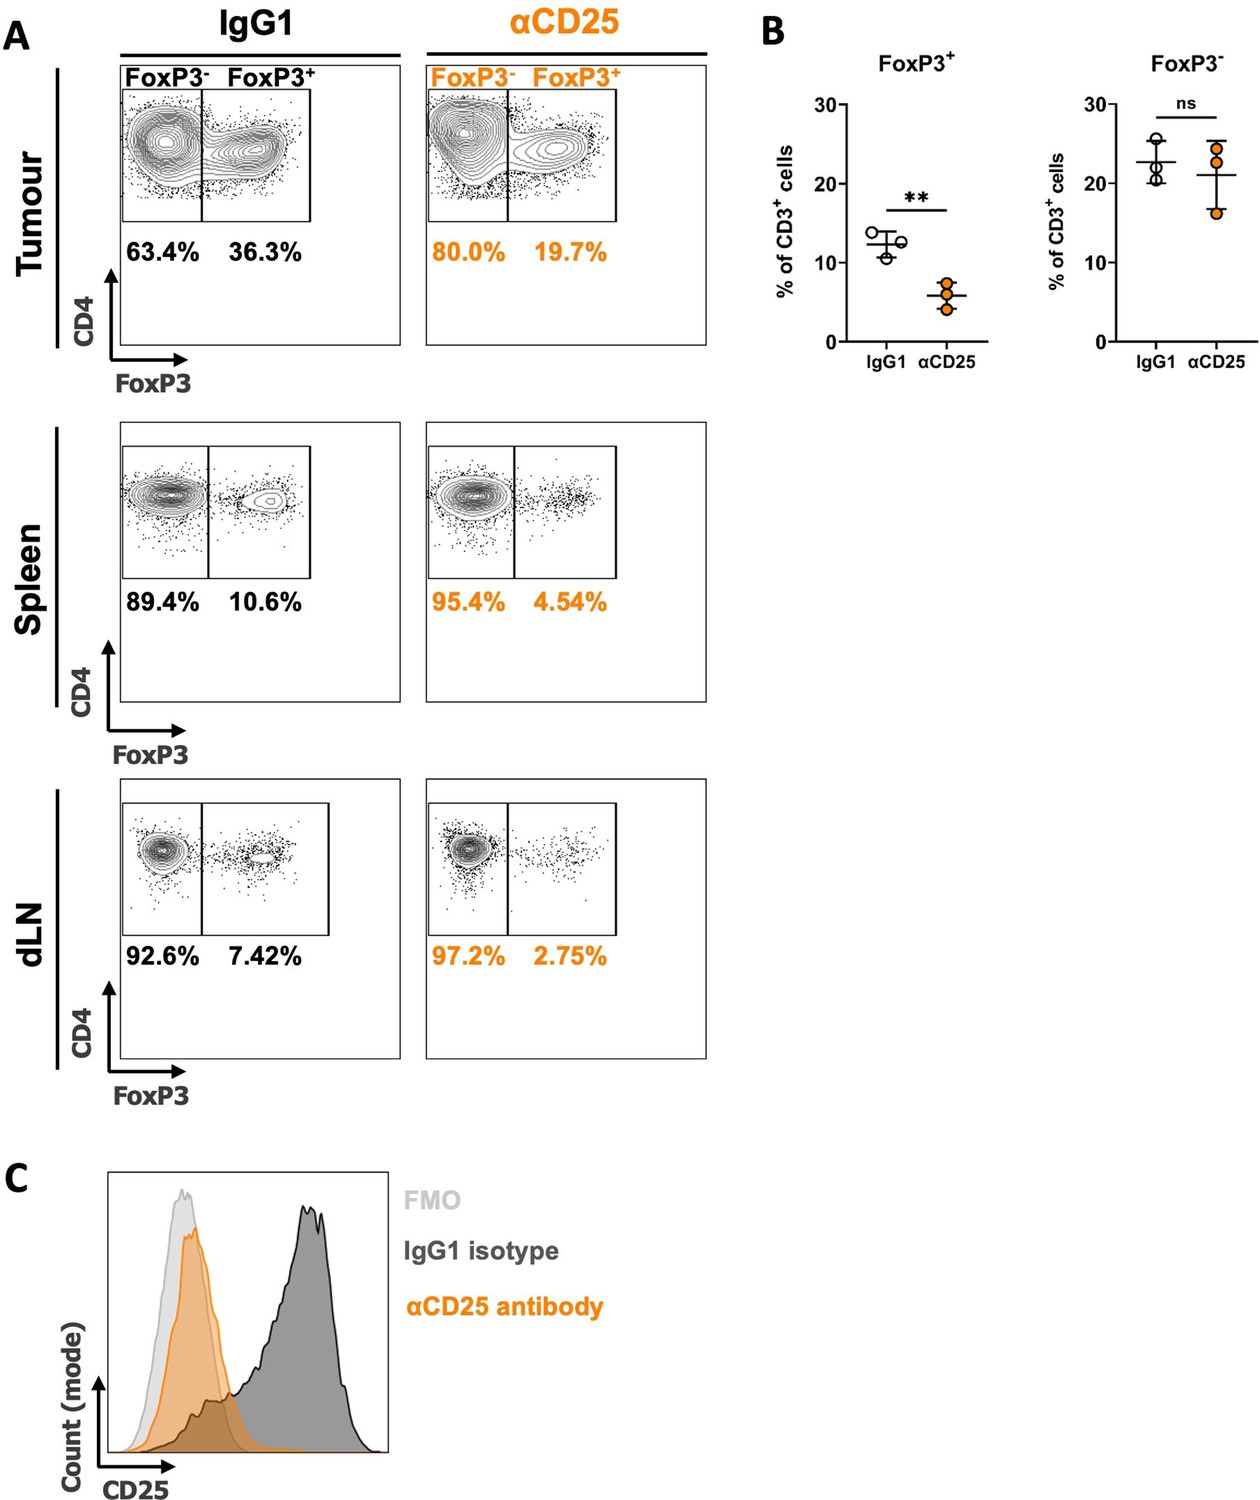
Depletion of Tregs with anti-CD25 antibody treatment.
(A) After 3 day pre-treatment with anti-CD25 or isotype control antibody, Met-1 Kin1-WT or Kin1-NULL tumors were established via subcutaneous injection in FVB mice. Antibody treatment was continued weekly for 21 days at which point tissue was harvested to assess Treg-specific deletion. Representative plots showing depletion of Treg cells in tumour (top), spleen (middle) and draining lymph node (dLN – bottom). (B) Quantification of tumour data for both FoxP3+ (Treg) and FoxP3- (non-Treg CD4+) cells. (C) Example histogram demonstrating CD25 expression on Treg cells. Representative example of two experiments. n=3 per group, error bars = SD. Unpaired t-test * =< 0.05, ** = <0.01.
Additional files
-
Supplementary file 1
List of antibodies used for immunophenotyping.
- https://cdn.elifesciences.org/articles/85739/elife-85739-supp1-v2.xlsx
-
MDAR checklist
- https://cdn.elifesciences.org/articles/85739/elife-85739-mdarchecklist1-v2.docx
-
Source data 1
NanoString PanCancer Immune panel analysis of bulk Met-1 tumors at day 10 (normalised expression), related to Figure 2 and Figure 5.
- https://cdn.elifesciences.org/articles/85739/elife-85739-data1-v2.csv
-
Source data 2
Nanostring immune exhaustion panel of isolated CD45+ cells from Met-1 tumors at Day 10, related to Figure 2, Figure 4 and Figure 6.
- https://cdn.elifesciences.org/articles/85739/elife-85739-data2-v2.csv
Download links
A two-part list of links to download the article, or parts of the article, in various formats.
Downloads (link to download the article as PDF)
Open citations (links to open the citations from this article in various online reference manager services)
Cite this article (links to download the citations from this article in formats compatible with various reference manager tools)
Kindlin-1 regulates IL-6 secretion and modulates the immune environment in breast cancer models
eLife 12:e85739.
https://doi.org/10.7554/eLife.85739


