LGG-1/GABARAP lipidation is not required for autophagy and development in Caenorhabditis elegans
- Institute for Integrative Biology of the Cell (I2BC), Université Paris-Saclay, CEA, CNRS, France
- INSERM U1280, France
- Institute for Genetics and Cologne Excellence Cluster on Cellular Stress Responses in Aging-Associated Diseases (CECAD), University of Cologne, Germany
- Laboratoire de Chimie de Coordination (LCC), CNRS, France
- Center for Molecular Medicine Cologne (CMMC), Faculty of Medicine and University Hospital of Cologne, Germany
Figures
Figure 1 with 3 supplements
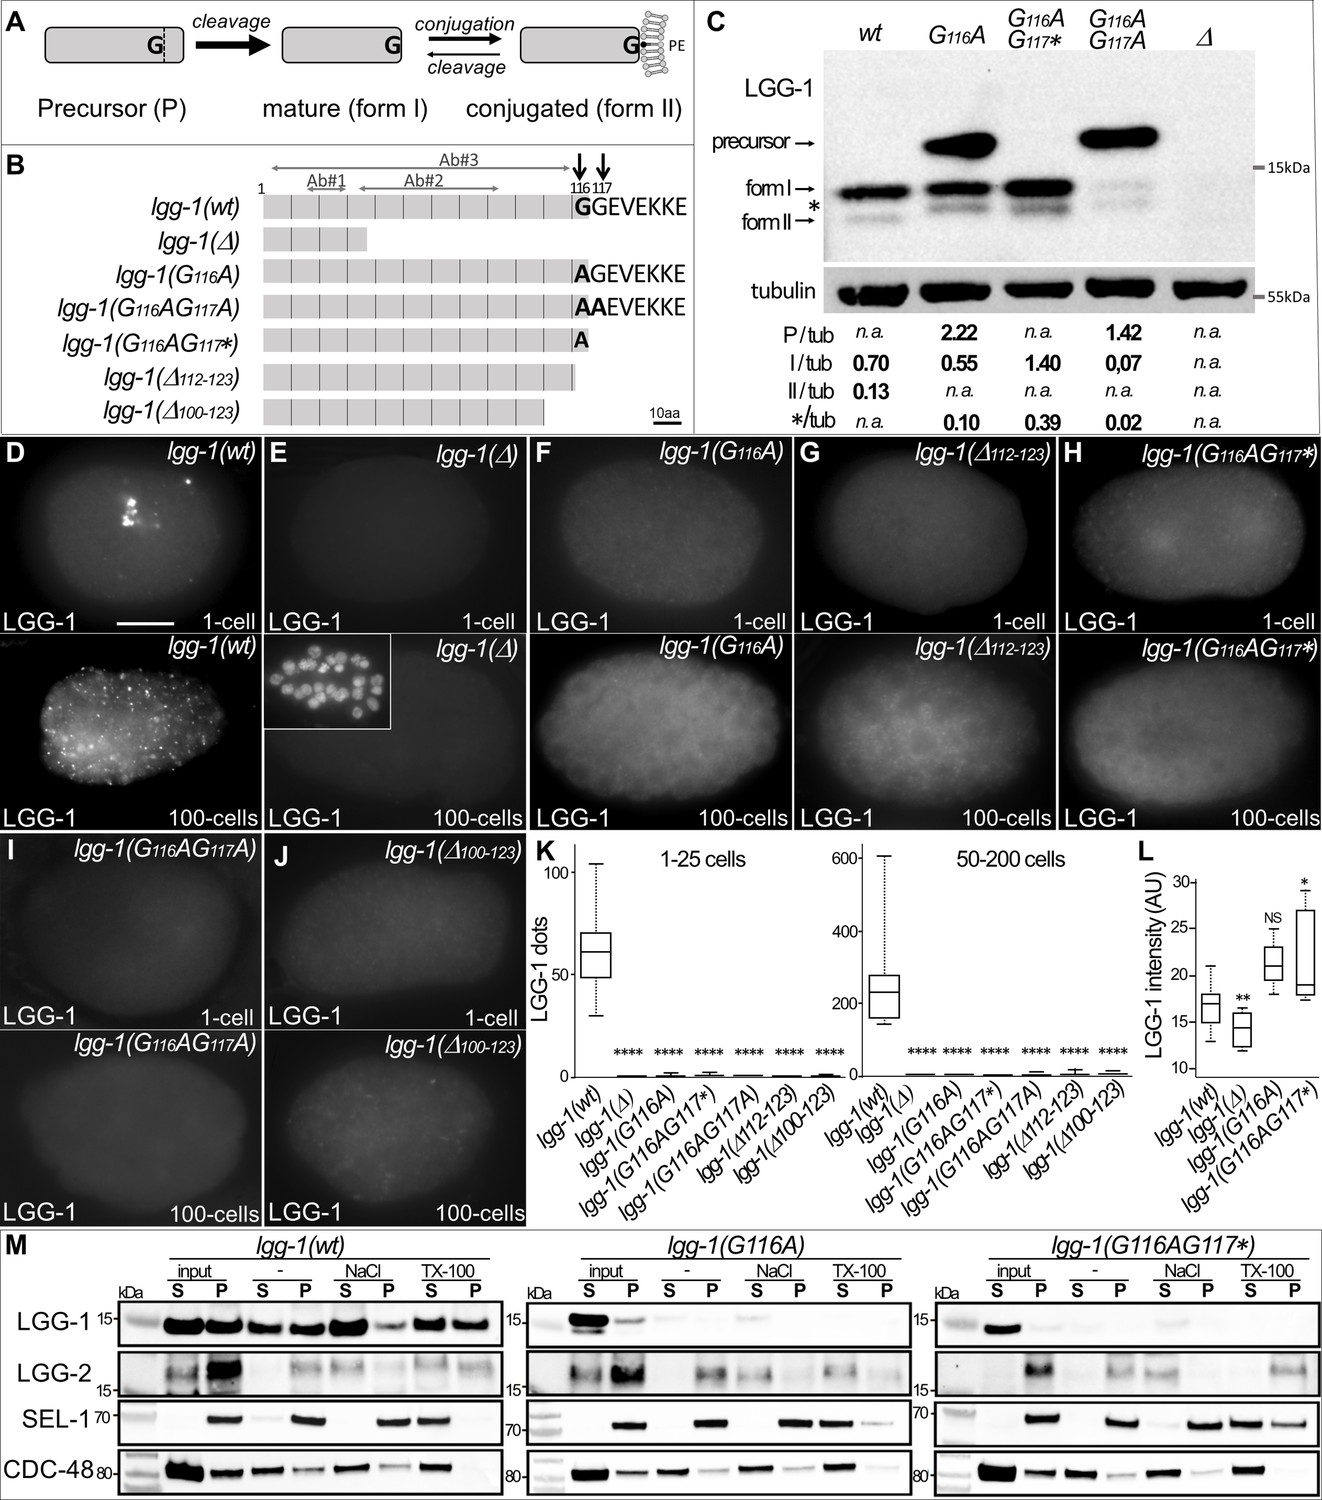
G116A abolishes the conjugation of LGG-1 to the membrane but not its cleavage.
(A) Schematic representation of the various isoforms of Atg8s proteins after cleavage of the precursor and reversible conjugation to a phosphatidylethanolamine (PE). (B) Diagram of the theoretical proteins produced by the allelic lgg-1 series used in this study. LGG-1(Δ) protein corresponds to the reference allele lgg-1(tm3489), considered as a null, all others mutants have been generated using CRISP-Cas9. Black arrows point to the di-glycine residues which are mutated in alanine or stop codon (*). Other deletion mutants of the C-terminus result from non-homologous end joining. The mapping of the epitopes recognized by the LGG-1 antibodies (Ab#1, 2, 3) used in this study are indicated by horizontal grey arrows. (C) Western blot analysis of endogenous LGG-1 from total protein extracts of wild-type, lgg-1(G116A), lgg-1(G116AG117*), lgg-1(G116AG117A), lgg-1(Δ) young adults. The data shown is representative of three experiments using Ab#3 and was confirmed with Ab#1. The theoretic molecular mass of the precursor, and the form I are 14.8 kDa and 14.0 kDa, respectively, while the lipidated form II migrates faster. The asterisk indicates an unknown band. The quantification of each LGG-1 isoforms was normalized using tubulin. (D–L) Immunofluorescence analysis of endogenous LGG-1 (Ab#1 or Ab#2) in early and late embryos in wild-type (D), lgg-1(Δ) (E), lgg-1(G116A) (F), lgg-1(Δ112–123) (G), lgg-1(G116AG117*) (H), lgg-1(G116AG117A) (I), lgg-1(Δ100–123) (J). Inset in E shows the corresponding DAPI staining of nuclei. Box-plots quantification showing the absence of puncta in all lgg-1 mutants (K, left n=19, 13, 11, 10, 6, 7, 6; right n=18, 14, 12, 10, 10, 9, 12) and the increase of cytosolic staining in lgg-1(G116A) and lgg-1(G116AG117*) (L, n=19, 13, 11, 10). Kruskal Wallis test, p-value *<0.05, **<0.01, ****<0.0001, NS non-significant. Scale bar is 10 µm. (M) Cellular fractionation of membrane vesicles. Western blot analysis for detection of LGG-1 together with LGG-2 (autophagosome marker), SEL-1 (ER marker), and CDC-48 (ER-associated and cytosol) using supernatant (S) and pellet (P) fractions of lgg-1 wild-type, lgg-1(G116A), and lgg-1(G116AG117*) worm lysates treated with fractionation buffer (-), sodium chloride (NaCl) or Triton X-100 (TX-100) after subcellular fractionation. Proteins associated with membranes are solubilized by NaCl, and resident proteins in membrane-bound organelles are released only by dissolving the membrane with detergents. While wild-type LGG-1 is detected in the cytosolic fraction (input S) and in the various membrane fractions, mutant LGG-1 is almost exclusively present in the cytosolic fraction in lgg-1(G116A) and lgg-1(G116AG117*).
-
Figure 1—source data 1
Folder containing original microscopy pictures, quantification data and western blots shown in Figure 1.
- https://cdn.elifesciences.org/articles/85748/elife-85748-fig1-data1-v2.zip
Figure 1—figure supplement 1
Description of lgg-1 alleles.
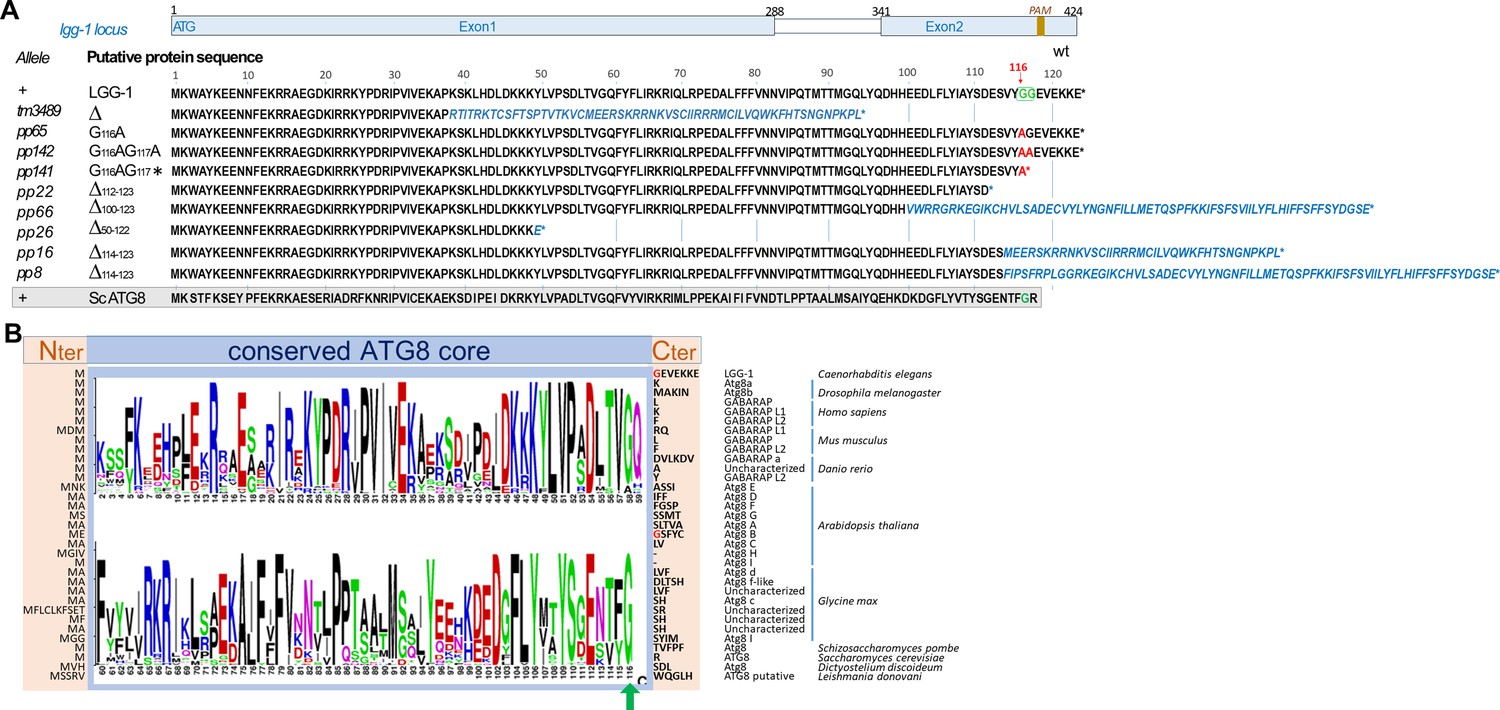
(A) Schematic representation of lgg-1 locus indicating the exon/intron composition and the localization of the PAM used for CRISPR-Cas9. The names of the alleles and the theoretical sequences of the proteins series are indicated. Residues in red are the results of the point mutations and residues in blue italics are the theoretical consequence of frameshifts. The di-glycine motif in position 116–117 is shown in green and the red arrow points to the conserved glycine 116. The grey box shows the aligned sequence of S. cerevisiae Atg8 (B) Comparison of Atg8/GABARAP homologs in worm (Ce), fly (Dm), human (Hs), mouse (Mm), zebrafish (Dr), plants (At, Gm), yeasts (Sp, Sc), amoeba (Dd) and parasite protozoa (Ld), identified in the eukaryotic proteomes from NCBI landmark Blast database. The conserved core sequence (blue box) is represented using a LOGO analysis (after removal of a small insertion in At Atg8D and in two Gm uncharacterized homologs) and the variable N- and C-terminus sequences are indicated in light beige. Green arrows points to the invariable glycine 116.
Figure 1—figure supplement 2
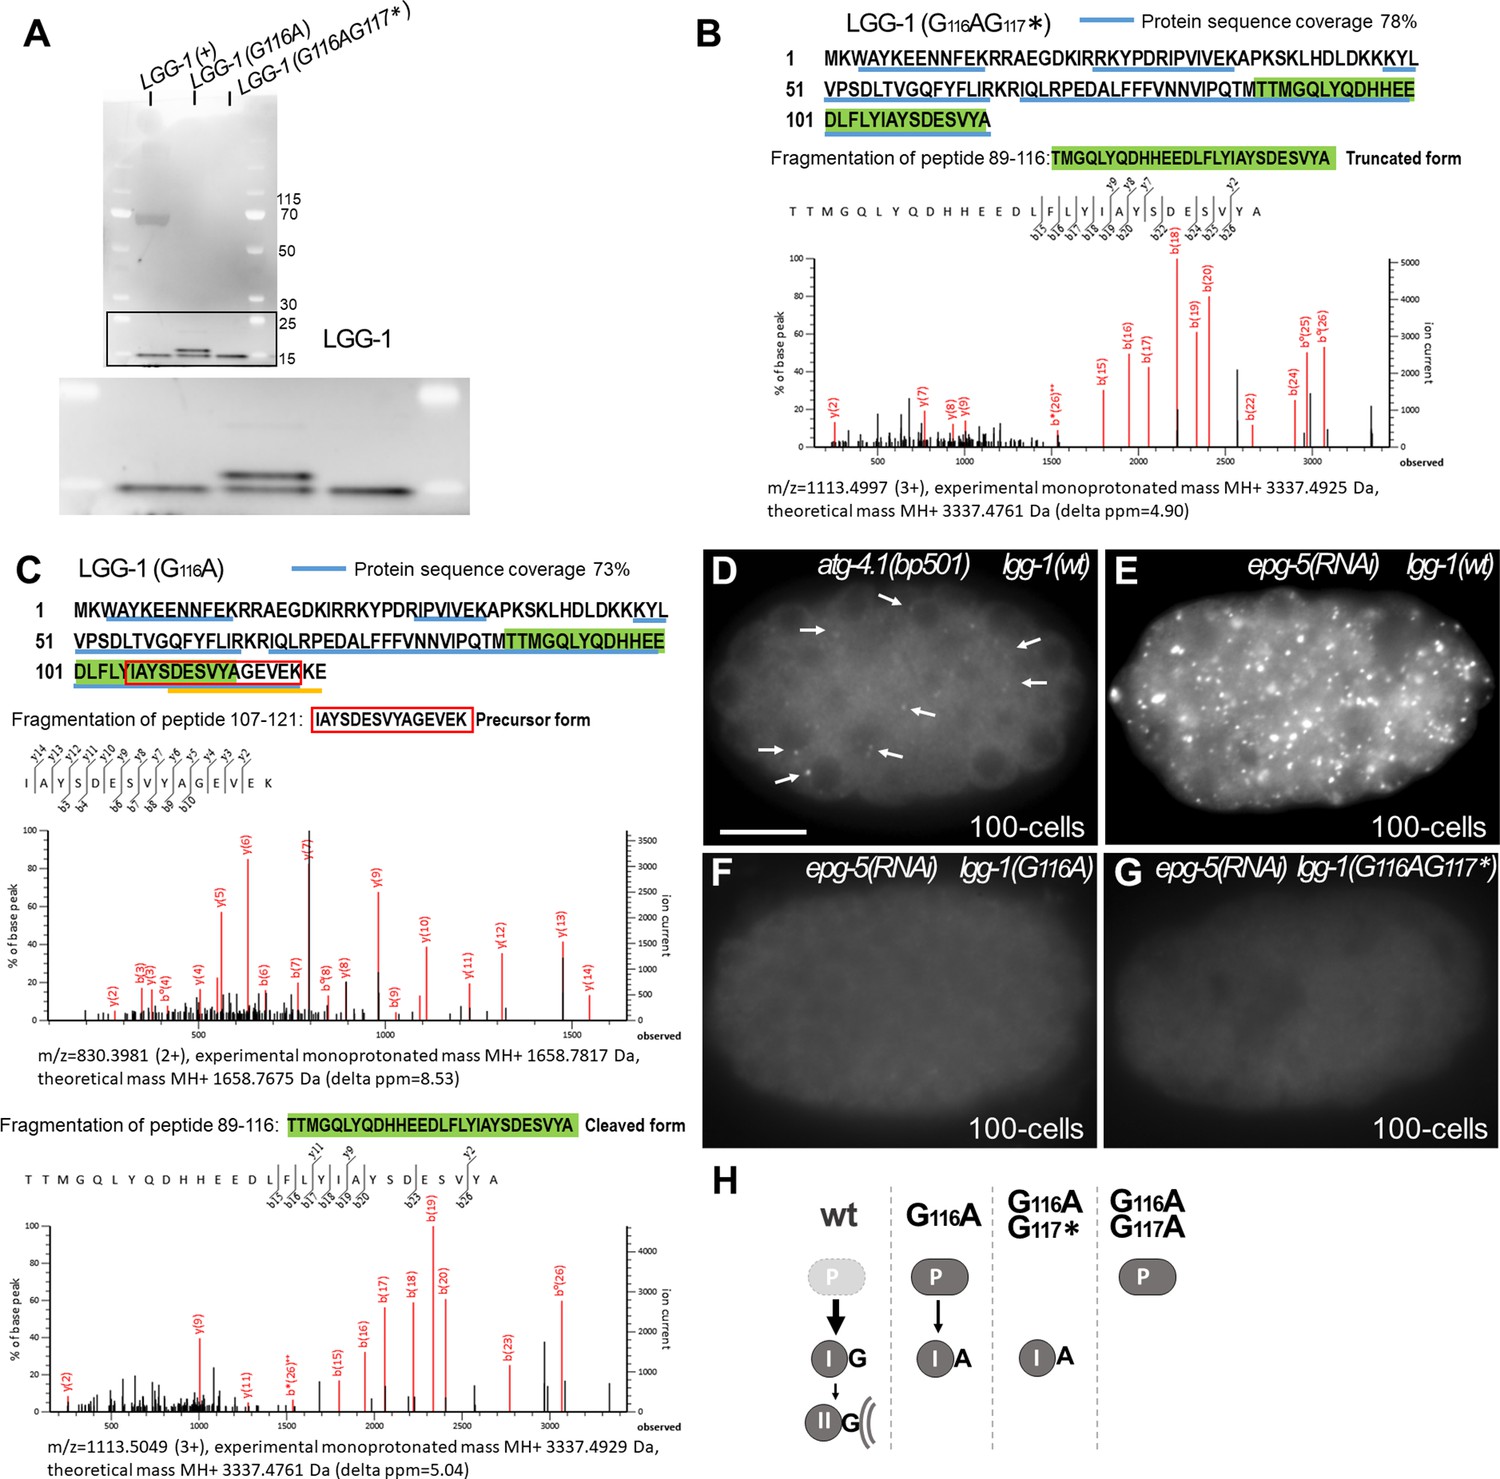
Identification of LGG-1(G116A) and LGG-1(G116AG117*) forms.
(A) Western blot analysis of affinity purified samples using LC3 traps. Molecular weight markers (kDa) are indicated on the right. (B) Protein sequence, and peptides coverage of LGG-1(G116AG117*) identified by mass spectrometry analyses after trypsin treatment (blue underline). The MS/MS fragmentation of the C-terminal peptide 89–116 (green) identifying the truncated form is shown below. (C) Protein sequence and peptides coverage of LGG-1(G116A) identified by mass spectrometry analyses after trypsin treatment (blue underline). The yellow underline indicates a C-terminal 111–123 peptide identified after trypsin and AspN digestion. The MS/MS fragmentation of the C-terminal peptide 107–121 (red box) identifying the precursor form and peptide 89–116 (green) identifying the cleaved form are shown below. (D–G) Mutant for the protease atg-4.1(bp501) (D) still presents few small puncta (arrows) in wild-type due to the presence of a paralog, atg-4.2. Autophagosome maturation defective epg-5(RNAi) embryos accumulate LGG-1 positive autophagosomes (E) but do not show puncta in lgg‐1(G116A) and lgg‐1(G116AG117*) embryos (F, G). Scale bar is 10 µm. (H) Schematic representation of the forms present in the wild-type and lgg-1 mutants based on western-blot, immunofluorescence and mass spectrometry analyses.
-
Figure 1—figure supplement 2—source data 1
Folder containing original microscopy pictures and quantification data shown in Figure 1—figure supplement 2.
- https://cdn.elifesciences.org/articles/85748/elife-85748-fig1-figsupp2-data1-v2.zip
Figure 1—figure supplement 3
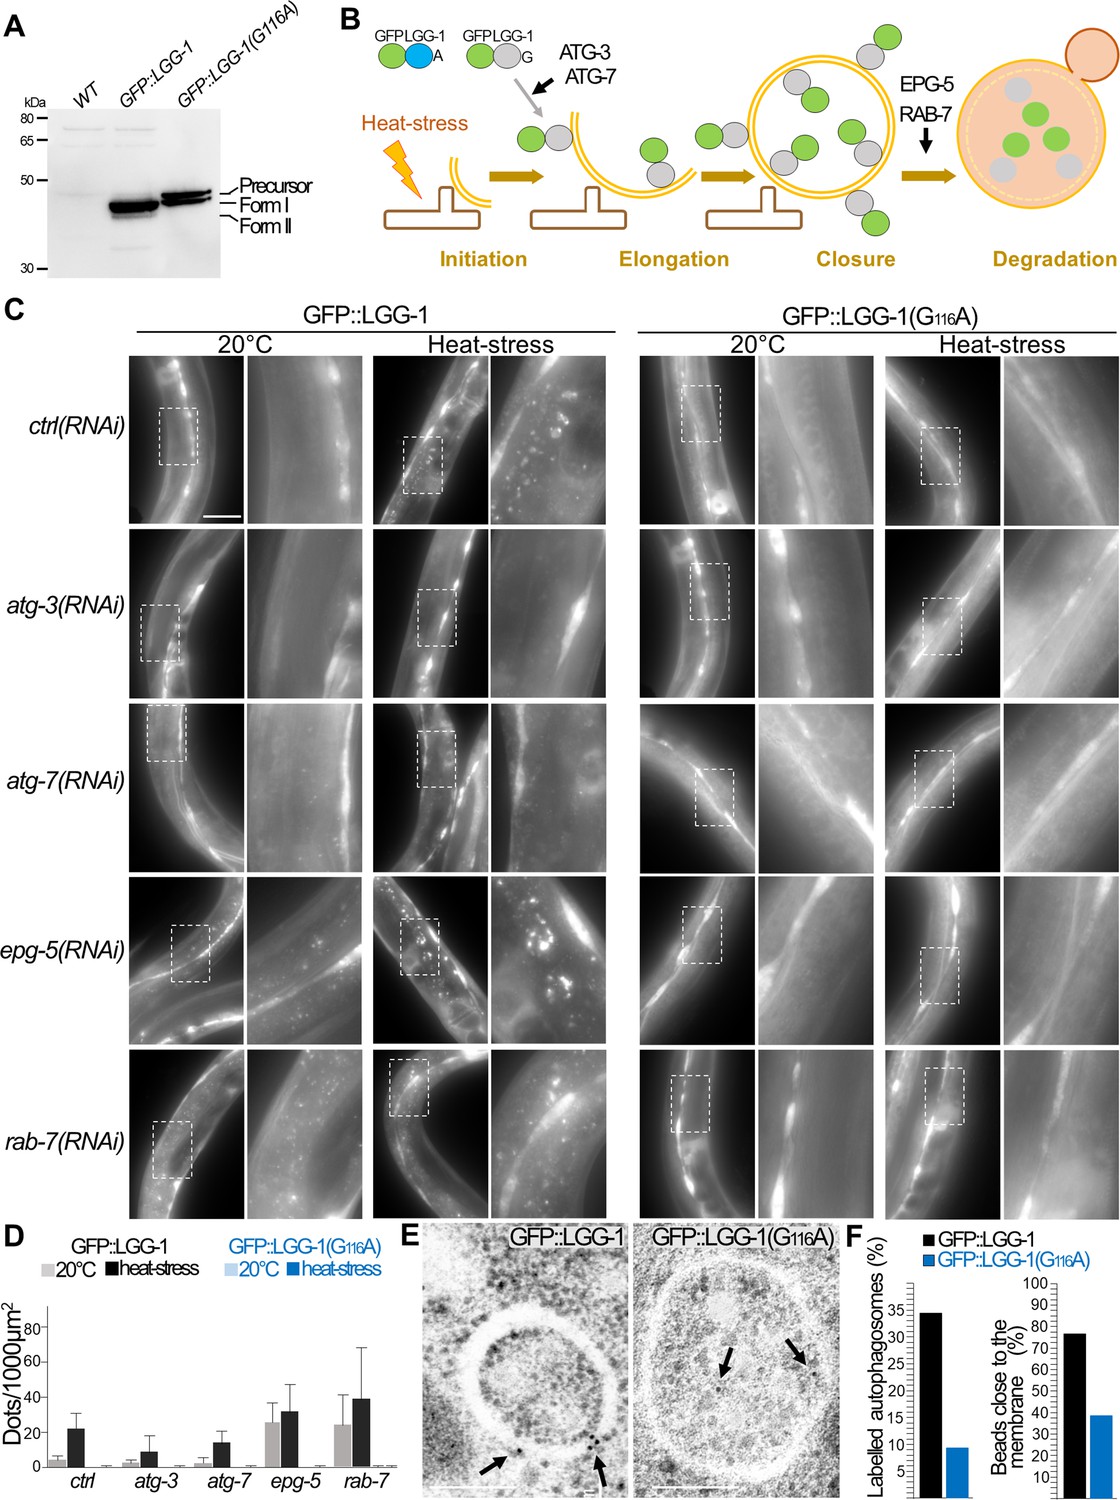
GFP::LGG-1(G116A) does not localize to autophagosomes.
(A) Western blot analysis of GFP::LGG-1 and GFP::LGG-1(G116A) using Ab#3, from total protein extracts from young adults. Accumulation of the precursor but absence of form II is observed. Molecular weight markers (kDa) are indicated on the left. (B) Schema of the experimental approach indicating the GFP reporters and the autophagy steps affected upon specific RNAi depletion. A 60 minutes heat-stress at 37 °C induces an autophagy flux. (C–D) In vivo epifluorescence images of GFP::LGG-1(wt) (left columns) and GFP::LGG-1(G116A) (right columns) in the epidermis of control, atg-3(RNAi), atg-7(RNAi), epg-5(RNAi),and rab-7(RNAi) 4th stage larvae. GFP::LGG-1(wt) puncta indicate the autophagosomes formed upon autophagy induction. The alteration of the conjugation process (atg-3, atg-7) or the fusion with the lysosome (epg-5, rab-7) results in a decrease or an accumulation of the puncta, respectively. GFP::LGG-1(G116A) does not localize to autophagosomes even in the conditions of strong accumulation. The zoomed images are 3 fold magnifications of the dotted rectangles. Scale bar is 50 µm. Quantifications are shown in (D) (n=10, 10, 6, 7, 10, 10, 4, 8, 10, 10, 7, 10, 10, 10, 4, 6, 10, 10, 5, 6). (E–F) Electron microscopy images of GFP-immunolabeled GFP::LGG-1(wt) and GFP::LGG-1(G116A) in the epidermis of 4th stage larvae after heat stress. Arrows indicates gold beads present on autophagosomes and quantifications are shown in (F). In GFP::LGG-1(G116A) animals labelled autophagosomes are very rare and beads are located in the lumen (n=110, 116, from four independent immunostainings). Scale bar is 200 nm.
-
Figure 1—figure supplement 3—source data 1
Folder containing original microscopy pictures and quantification data shown in Figure 1—figure supplement 3.
- https://cdn.elifesciences.org/articles/85748/elife-85748-fig1-figsupp3-data1-v2.zip
Figure 2
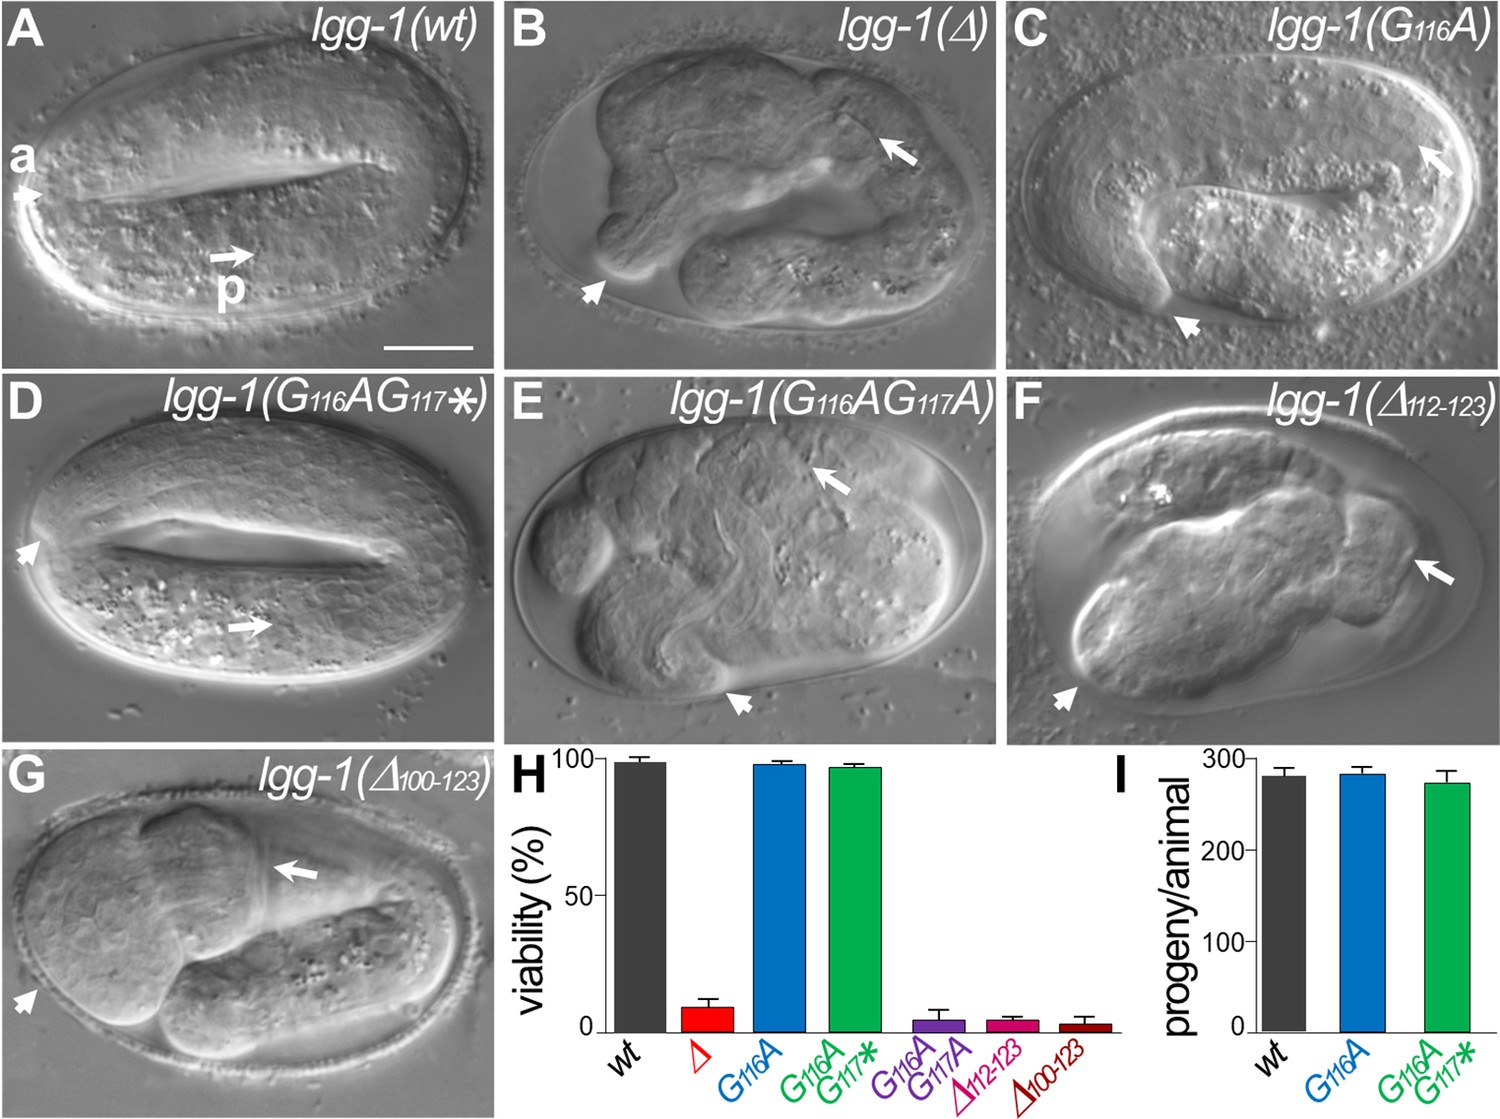
lgg-1(G116A) and lgg-1(G116AG117*) mutants are viable with no developmental defect.
(A–G) DIC images of embryos after morphogenesis in wild-type (A), lgg-1(Δ) (B), lgg-1(G116A) (C), lgg-1(G116AG117*) (D), lgg-1(G116AG117A) (E), lgg-1(Δ112–123) (F), lgg-1(Δ100–123) (G). lgg-1(G116AG117A), lgg-1(Δ112–123), lgg-1(Δ100–123), lgg-1(Δ) mutant embryos present severe developmental defects. Short and long white arrows point to the anterior (a) and posterior (p) part of the pharynx, respectively. Scale bar is 10 µm. (H) The viability, expressed as the percentage of embryos reaching adulthood, is not affected in lgg-1(G116A) and lgg-1(G116AG117*) mutants (42<n < 103). (I) The fertility, total number of progenies, of lgg-1(G116A) and lgg-1(G116AG117*) adults is similar to wild-type (n=20).
-
Figure 2—source data 1
Folder containing original microscopy pictures and quantification data shown in Figure 2.
- https://cdn.elifesciences.org/articles/85748/elife-85748-fig2-data1-v2.zip
Figure 3 with 2 supplements
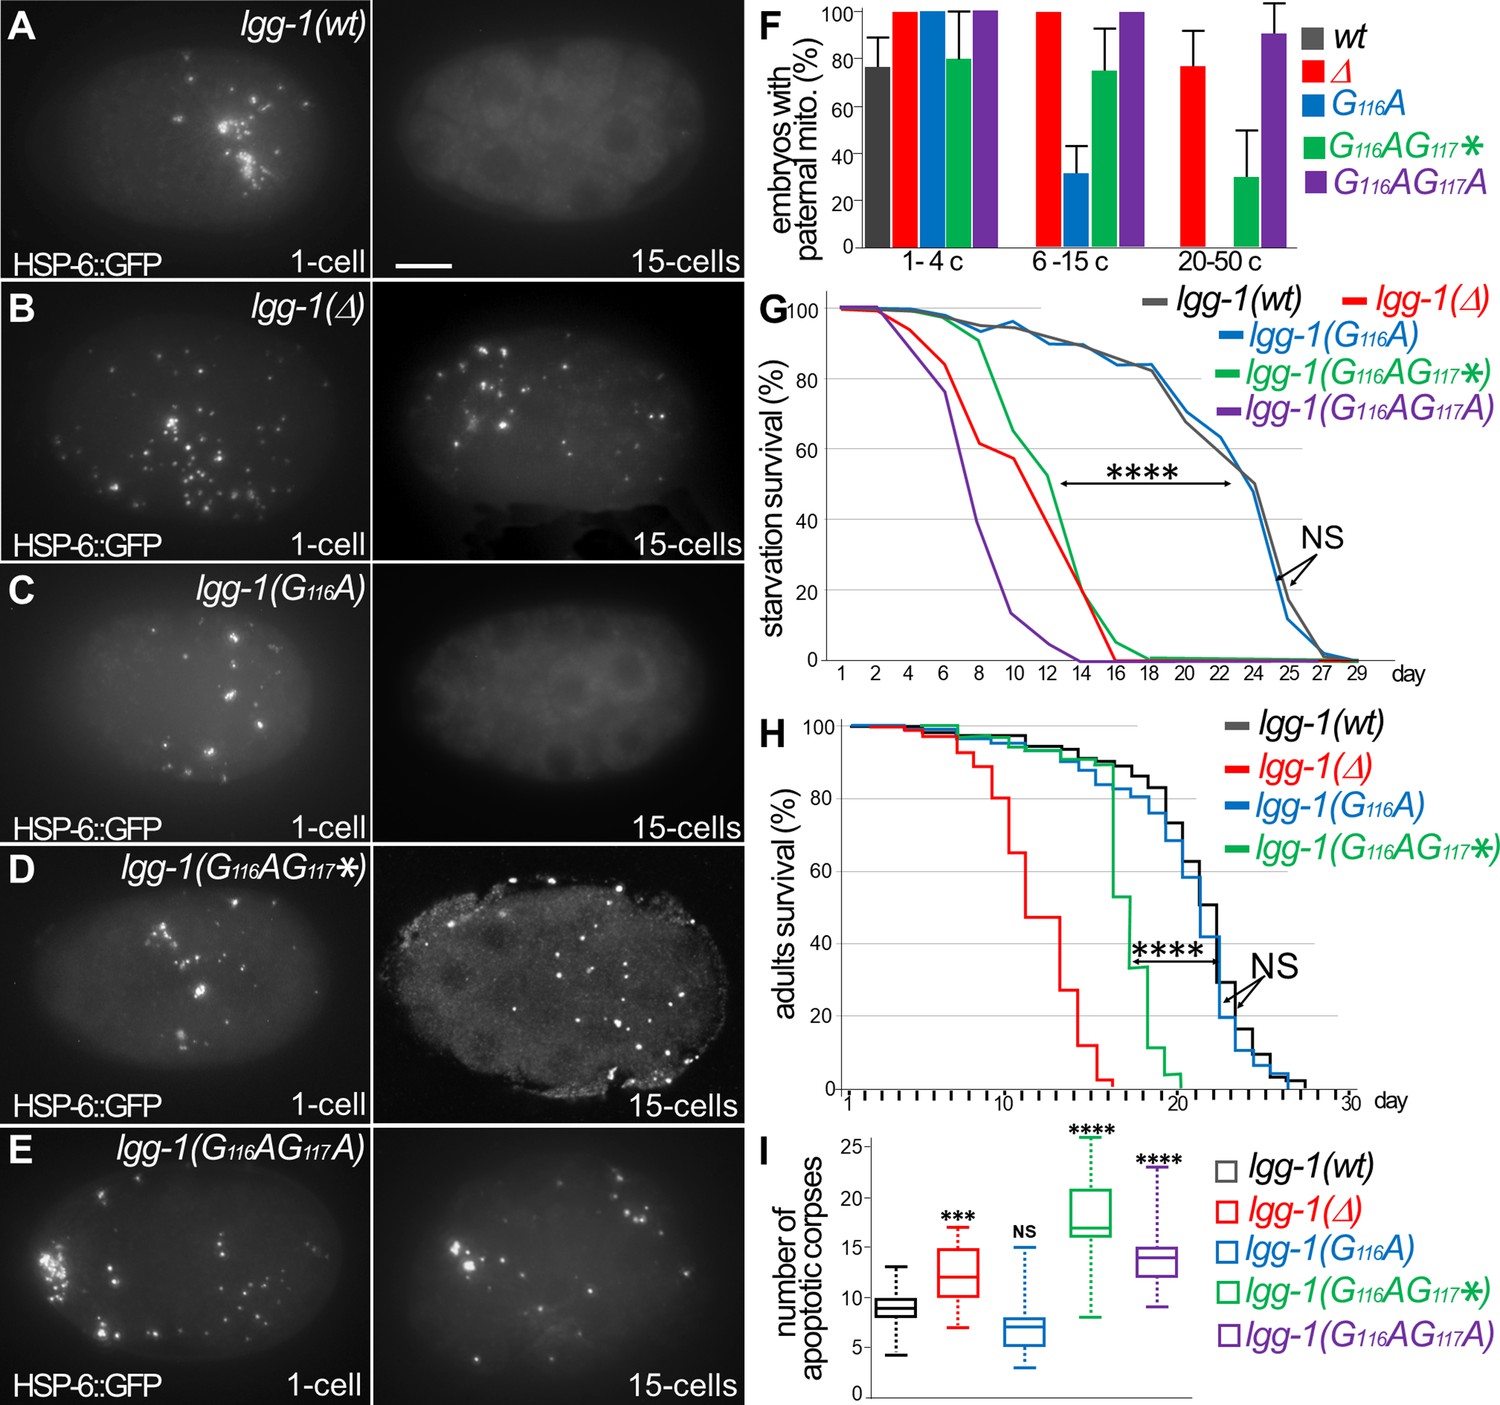
Autophagy is functional in lgg-1(G116A) but not in lgg-1(G116AG117*) and lgg-1(G116AG117A).
(A–E) In vivo epifluorescence images of paternal mitochondria (HSP-6::GFP) at the 1 cell and 15 cells stages in wild-type (A), lgg-1(Δ) (B), lgg-1(G116A) (C), lgg-1(G116AG117*)(D), lgg-1(G116AG117A)(E) embryos showing an effective degradation of paternal mitochondria in wt and lgg-1(G116A) but not in lgg-1(Δ) lgg-1(G116AG117*) and lgg-1(G116AG117A). Quantification are shown in (F). (G, H) Bulk autophagy during aging and stress was assessed by worm longevity (G, log rank test n>100 animals, p-value ****<0.001) and starvation survival (H, Chi-square test at day 15 p-value ****<0.001). The survival is significantly reduced in lgg-1(Δ), lgg-1(G116AG117*) and lgg-1(G116AG117A) compared to wt and lgg-1(G116A). NS non-significant. (I) Box-plots quantification of apoptotic corpses showing a defective degradation in lgg-1(G116AG117*) and lgg-1(G116AG117A) but not in lgg-1(G116A) (n=22, 40, 46, 14, 21 Kruskal Wallis test ***<0.001, ****<0.0001, NS non-significant).
-
Figure 3—source data 1
Folder containing original microscopy pictures and quantification data shown in Figure 3.
- https://cdn.elifesciences.org/articles/85748/elife-85748-fig3-data1-v2.zip
Figure 3—figure supplement 1
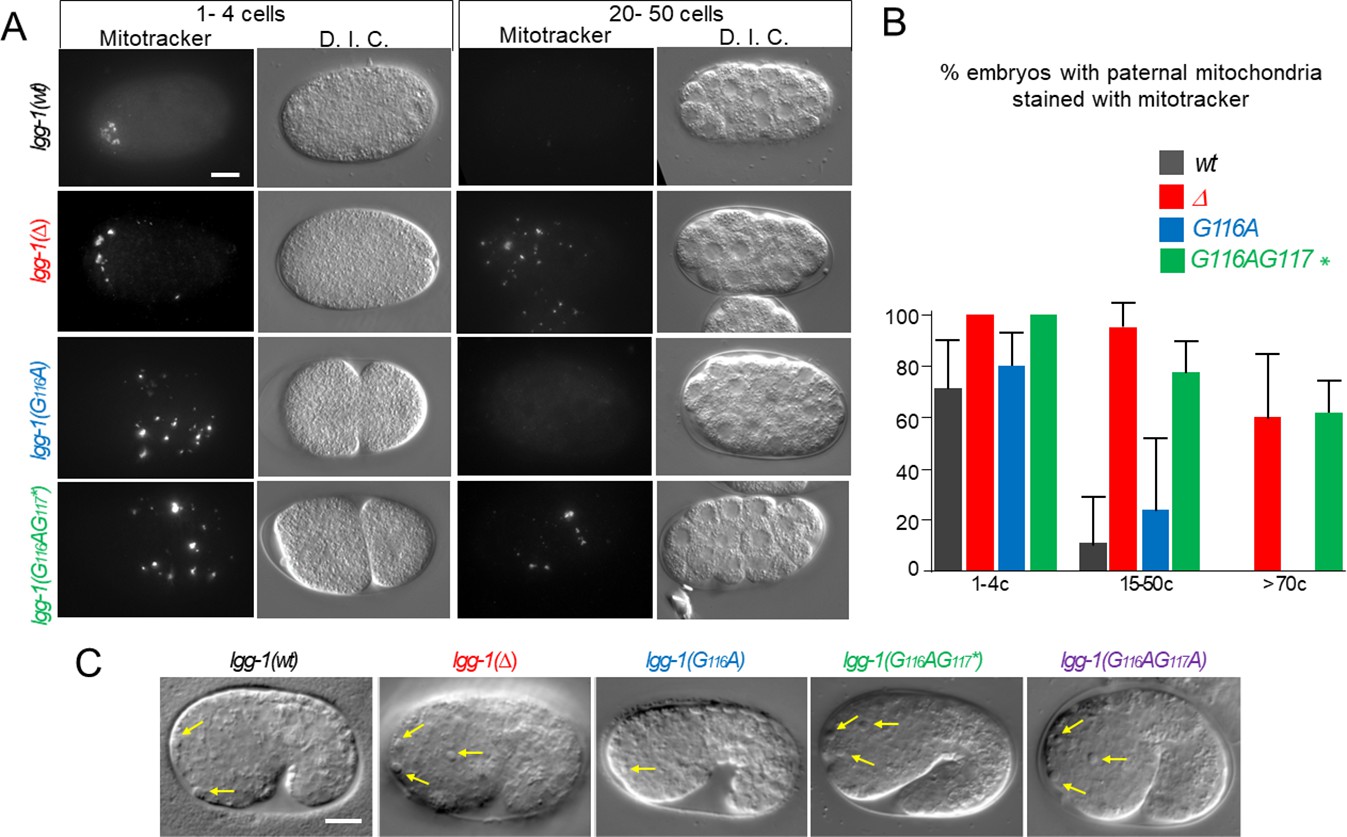
Autophagy is functional in lgg-1(G116A) but not in lgg-1(G116AG117*).
(A–B) In vivo epifluorescence images of paternal mitochondria (left, mitotracker) and corresponding DIC images (right) at the 1–4 cells and 20–50 cells stages in wild-type, lgg-1(Δ), lgg-1(G116A), lgg-1(G116AG117*) embryos showing an effective degradation of paternal mitochondria in wt and lgg-1(G116A) but not in lgg-1(Δ) lgg-1(G116AG117*). Quantifications are shown in (B). (C) DIC images of 1.5-fold stage wild-type, lgg-1(Δ), lgg-1(G116A), lgg-1(G116AG117*) and lgg-1(G116AG117A) embryos. Apoptotic corpses in the head region are indicated by yellow arrows. The quantification of apoptotic corpses is shown in Figure 3I. Scale bar is 10 µm.
-
Figure 3—figure supplement 1—source data 1
Folder containing original microscopy pictures and quantification data shown in Figure 3—figure supplement 1.
- https://cdn.elifesciences.org/articles/85748/elife-85748-fig3-figsupp1-data1-v2.zip
Figure 3—figure supplement 2
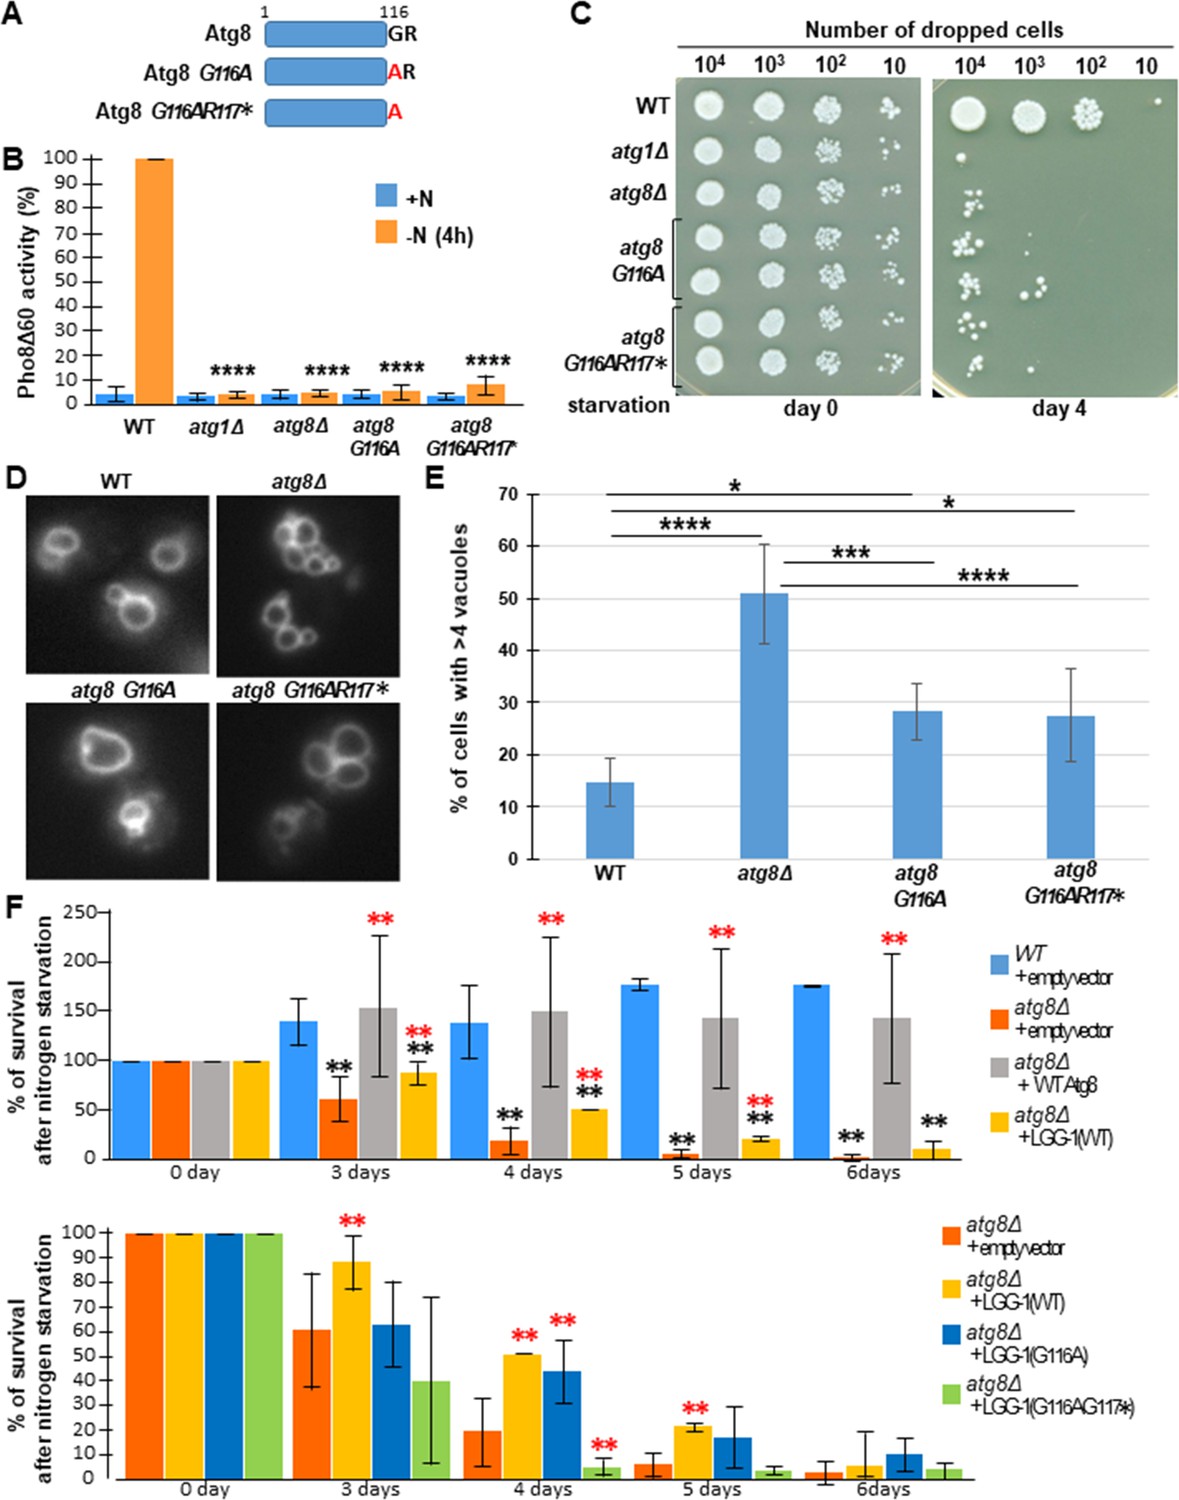
Atg8(G116A) and Atg8(G116AR117*) are functional for vacuolar shaping but not for autophagy in S. cerevisiae.
(A) Schematic representation of wild-type and mutant Atg8 proteins. (B) Autophagic activity is abolished in S. cerevisiae mutant strains atg8G116A or atg8G116A-R117Δ forms of Atg8. Autophagic activity of wild-type, atg1Δ, atg8Δ, atg8G116A and atg8G116AR117* strains was measured using the quantitative Pho8Δ60 assay, before (+N) and after (-N) 4 hours of nitrogen starvation. The data shown are the mean ± s.e.m. of three independent experiments (Mann-Whitney test, p-value****<0.0001). (C) S. cerevisiae mutants atg8Δ, atg8G116A or atg8G116AR117* have a similar cell viability defect upon nitrogen starvation. (D) Epifluorescence image of FM4-64 staining of the vacuole of wild-type and atg8 mutant strains (single focal plan). (E) Quantification of vacuoles in wild-type and atg8 mutants. atg8G116A and atg8G116AR117* mutants present a less severe vacuolar phenotype than atg8Δ mutant (n>200 cells, Chi-square test, p-value *<0.05, ***<0.001, ****<0.0001). (F) Rescue assays of atg8Δ by lgg-1(wt), lgg-1(G116A) and lgg-1(G116AG117*). In the upper part, the survival in nitrogen starvation of atg8Δ cells transformed with lgg-1(wt) or ATG8 is compared with atg8Δ and wild-type. In the lower part, the survival in nitrogen starvation of atg8Δ cells transformed with lgg-1(wt), lgg-1(G116A), lgg-1(G116AG117*) are compared with atg8Δ. The percentage of surviving cells was calculated in comparison with day 0. lgg-1(G116A) expression improves the survival but less efficiently than lgg-1(wt). Black and red stars show statistical difference with wild-type and atg8Δ, respectively, Mann-Whitney test, p-value **<0.001.
-
Figure 3—figure supplement 2—source data 1
Folder containing original microscopy pictures and quantification data shown in Figure 3—figure supplement 2.
- https://cdn.elifesciences.org/articles/85748/elife-85748-fig3-figsupp2-data1-v2.zip
Figure 4
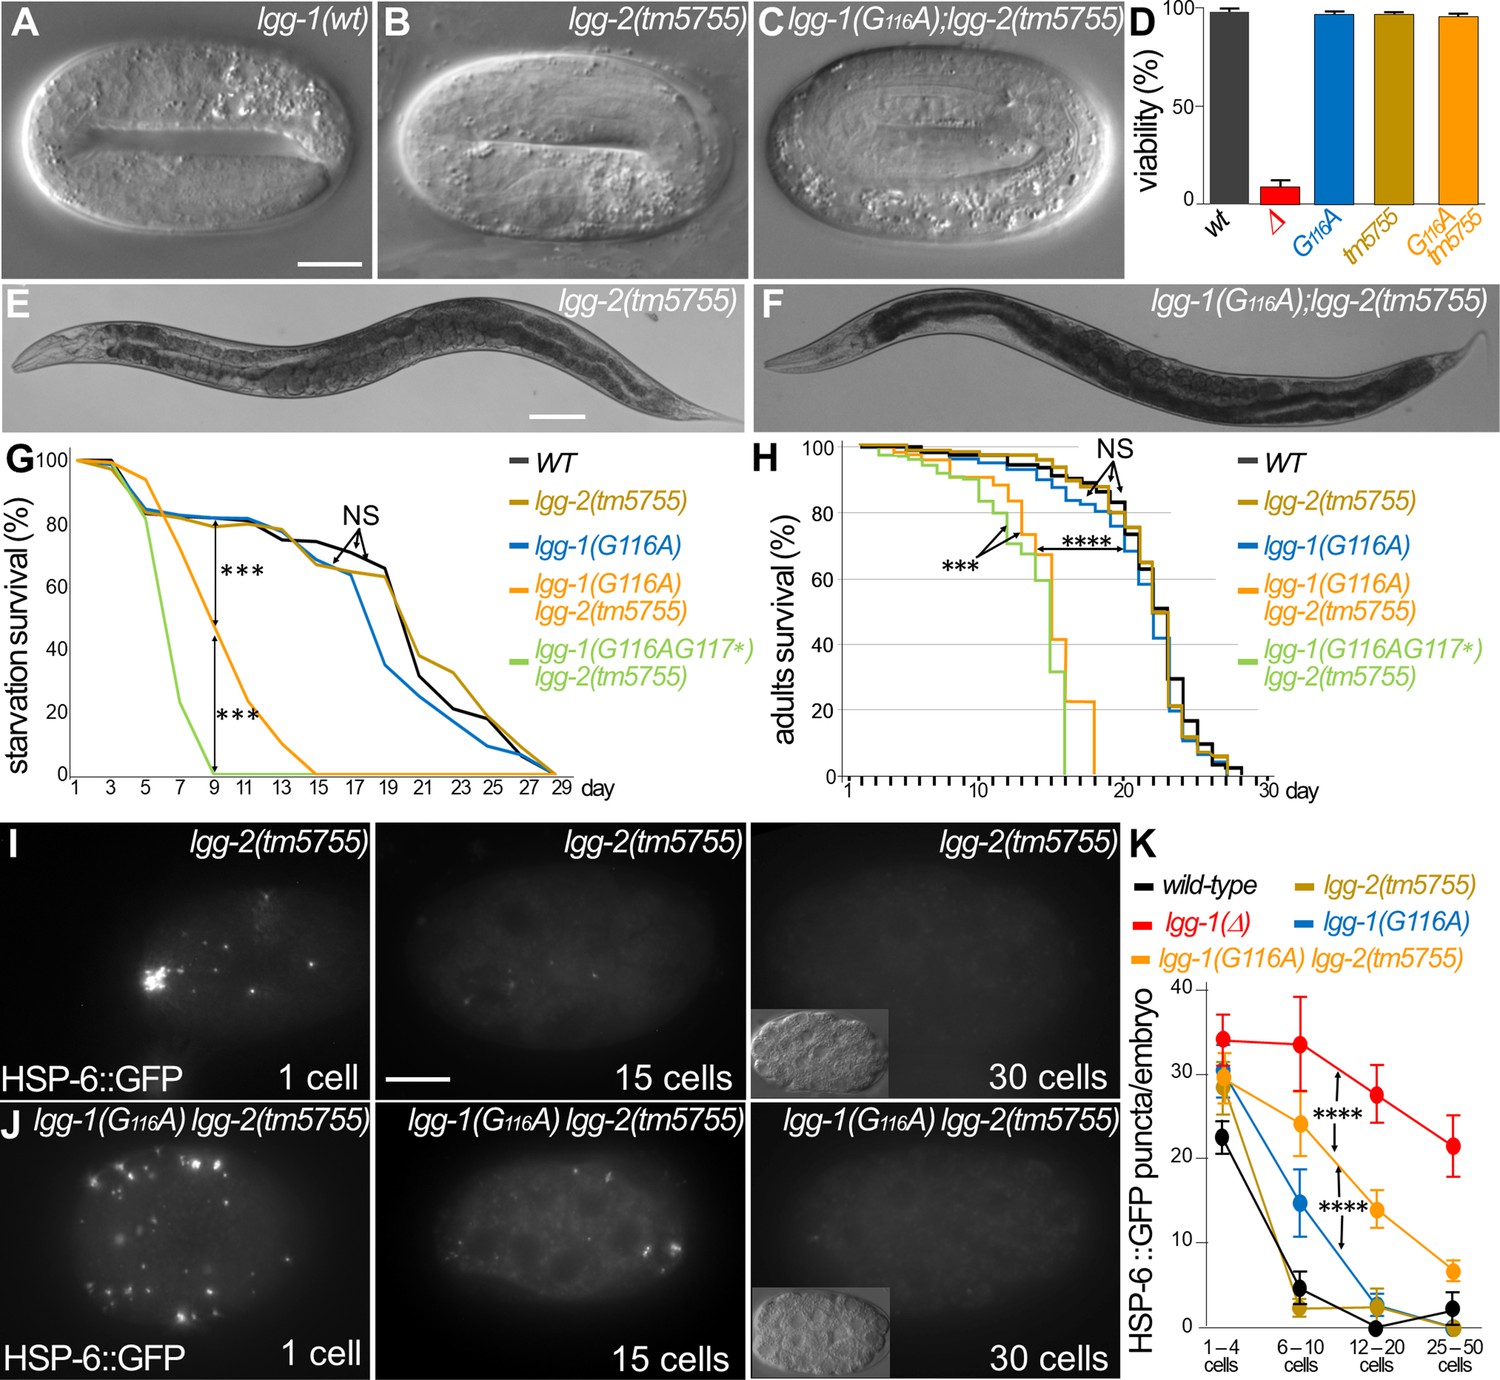
Autophagy but not developmental function of LGG-1(G116A) partially depends on LGG-2.
(A–F) DIC images of embryos and bright field images of adults in wild-type (A), lgg-2(tm5755) (B, E), lgg-1(G116A); lgg-2(tm5755) (C, F). The double mutant lgg-1(G116A); lgg-2(tm5755) animals have no morphogenetic defects and no decrease in viability compare to single mutants or the lgg-1(Δ) (quantification in D). (G–H) Bulk autophagy during stress and aging was assessed by starvation survival (G, Chi-square test at day 9 ***p-value <0.001) and worm longevity (H, log rank test n>100 animals, ***p-value <0.001, ****p-value <0.0001). The survival of double mutants lgg-1(G116A); lgg-2(tm5755) and lgg-1(G116AG117*); lgg-2(5755) is reduced compared to wild-type and single mutant lgg-1(G116A) and lgg-2(tm5755). lgg-1(G116A); lgg-2(tm5755) animals survive to starvation better than lgg-1(G116AG117*); lgg-2(5755) and present a slightly higher lifespan. (I–K) In vivo epifluorescence imaging of paternal mitochondria (HSP-6::GFP) at the 1 cell, 15 cells, and 30 cells stages in lgg-2(tm5755), (I) lgg-1(G116A); lgg-2(tm5755) (J) embryos and quantification (n=50, 39, 35, 45, 46 Chi-square test ****<0.0001) (K). Elimination of mitochondria is efficient but delayed in lgg-1(G116A); lgg-2(5755) compared to lgg-1(G116A). Insets show the corresponding DIC pictures. Scale bar is 10 µm (A–C, I, J) or 100 µm (E, F).
-
Figure 4—source data 1
Folder containing original microscopy pictures and quantification data shown in Figure 4.
- https://cdn.elifesciences.org/articles/85748/elife-85748-fig4-data1-v2.zip
Figure 5 with 1 supplement
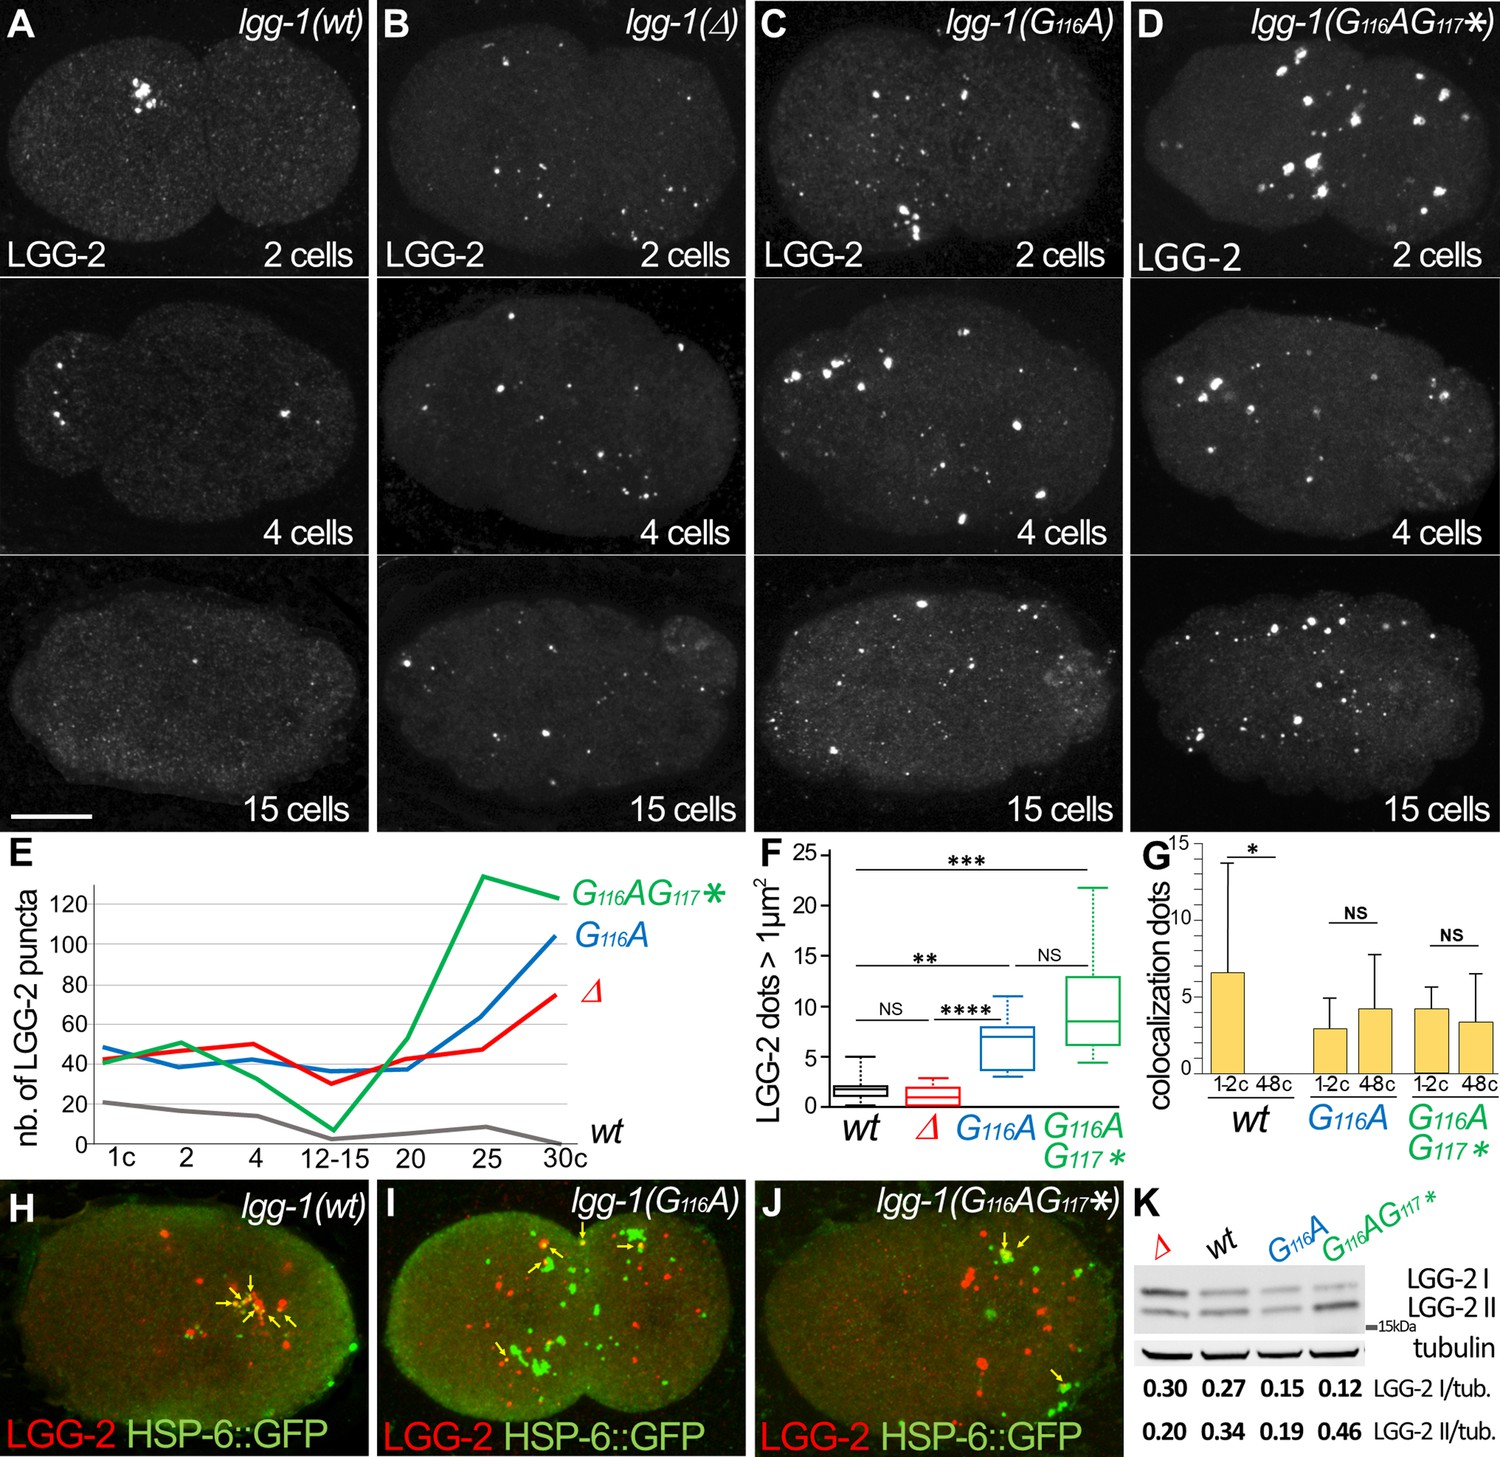
The degradation of autophagosomes is delayed in lgg-1(G116A).
(A–F) Confocal images of LGG-2 immunofluorescence in 2 cells, 4 cells, and 15 cells in wild-type (A), lgg-1(Δ) (B), lgg-1(G116A) (C), lgg-1(G116AG117*) (D) and quantification of the number (E) and size of puncta (F) (embryo analyzed 19, 37, 28, 14; Mann-Whitney test, p-value ****<0.0001). In lgg-1(G116A) and lgg-1(G116AG117*) mutants LGG-2 is detected as heterogeneous sparse structures that persist. (G–J) Colocalization analysis of paternal mitochondria (HSP-6::GFP) and LGG-2 puncta (H) from confocal images of wild-type (H), lgg-1(G116A) (I) and lgg-1(G116AG117*) (J) early embryos. (Mean + SD, n=16, 20, 12, Kruskal Wallis test p-value*<0.05). The clustering of paternal mitochondria and LGG-2 autophagosomes are absent in lgg-1(G116A) and lgg-1(G116AG117*) where HSP-6::GFP and LGG-2 puncta are mainly separated with rare colocalization events (yellow arrows). (K) Western blot analysis of endogenous LGG-2 from total protein extracts from wild-type, lgg-1(G116A), lgg-1(G116AG117*), lgg-1(Δ) young adults. The quantification of LGG-2 upper and lower bands was normalized using tubulin.
-
Figure 5—source data 1
Folder containing original microscopy pictures, quantification data and western blots shown in Figure 5.
- https://cdn.elifesciences.org/articles/85748/elife-85748-fig5-data1-v2.zip
Figure 5—figure supplement 1
Colocalization quantification of HSP-6::GFP and LGG-2.
Quantification of puncta positive for the paternal mitochondria marker HSP-6::GFP, the autophagosomal marker LGG-2 and both, in early embryos wild-type, lgg-1(G116A) and lgg-1(G116AG117*) (Mean + SD, n=16, 20, 12 Kruskal Wallis p-value*<0.05, **<0.01).
-
Figure 5—figure supplement 1—source data 1
Folder containing quantification data shown in Figure 5—figure supplement 1.
- https://cdn.elifesciences.org/articles/85748/elife-85748-fig5-figsupp1-data1-v2.zip
Figure 6
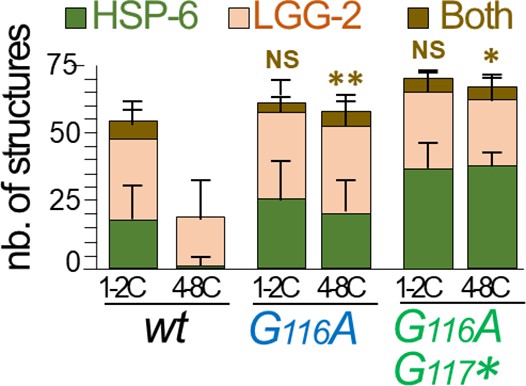
The cleaved LGG-1 is sufficient for autophagosome biogenesis.
(A–J) Electron microscopy images of autophagosomes in wild-type (A), lgg-1(Δ) (B), lgg-1(G116A) (C–E), lgg-1(G116AG117*) (F–G), lgg-1(G116A); lgg-2(tm5755) (H), lgg-1(G116AG117*) lgg-2(tm5755) (I) and lgg-2(tm5755) (J) early embryos. Type 1 autophagosomes (A, C, D) appear as closed structures containing various membrane organelles. Among those, sequestered paternal mitochondria (black arrows) are observed in wild-type and lgg-1(G116A) embryos but remain unsequestered in lgg-1(Δ) and lgg-1(G116AG117*) embryos. Type 2 autophagosomes (E, white arrow in H, J) appear as closed structures containing unidentified or degraded materials. Type 3 structures (G, I) are multi-lamellar structures only detected in lgg-1(G116AG117*) embryos. Scale bar is 200 nm. (K) Quantification of type 1, type 2, and type 3 structures in early embryo (1–12 cells). In lgg-1(G116A) embryos, the numbers of type 1 and type 2 autophagosomal structures increase supporting a retarded degradation. The formation of autophagosomes in lgg-1(G116A) and lgg-1(G116AG117*) embryos is partially dependent of LGG-2 (n sections = 32, 62, 32, 19, 32, 26, 52).
-
Figure 6—source data 1
Folder containing original microscopy pictures and quantification data shown in Figure 6.
- https://cdn.elifesciences.org/articles/85748/elife-85748-fig6-data1-v2.zip
Figure 7 with 1 supplement
The lipidated LGG-1 is involved in the coordination between cargo recognition and autophagosome biogenesis.
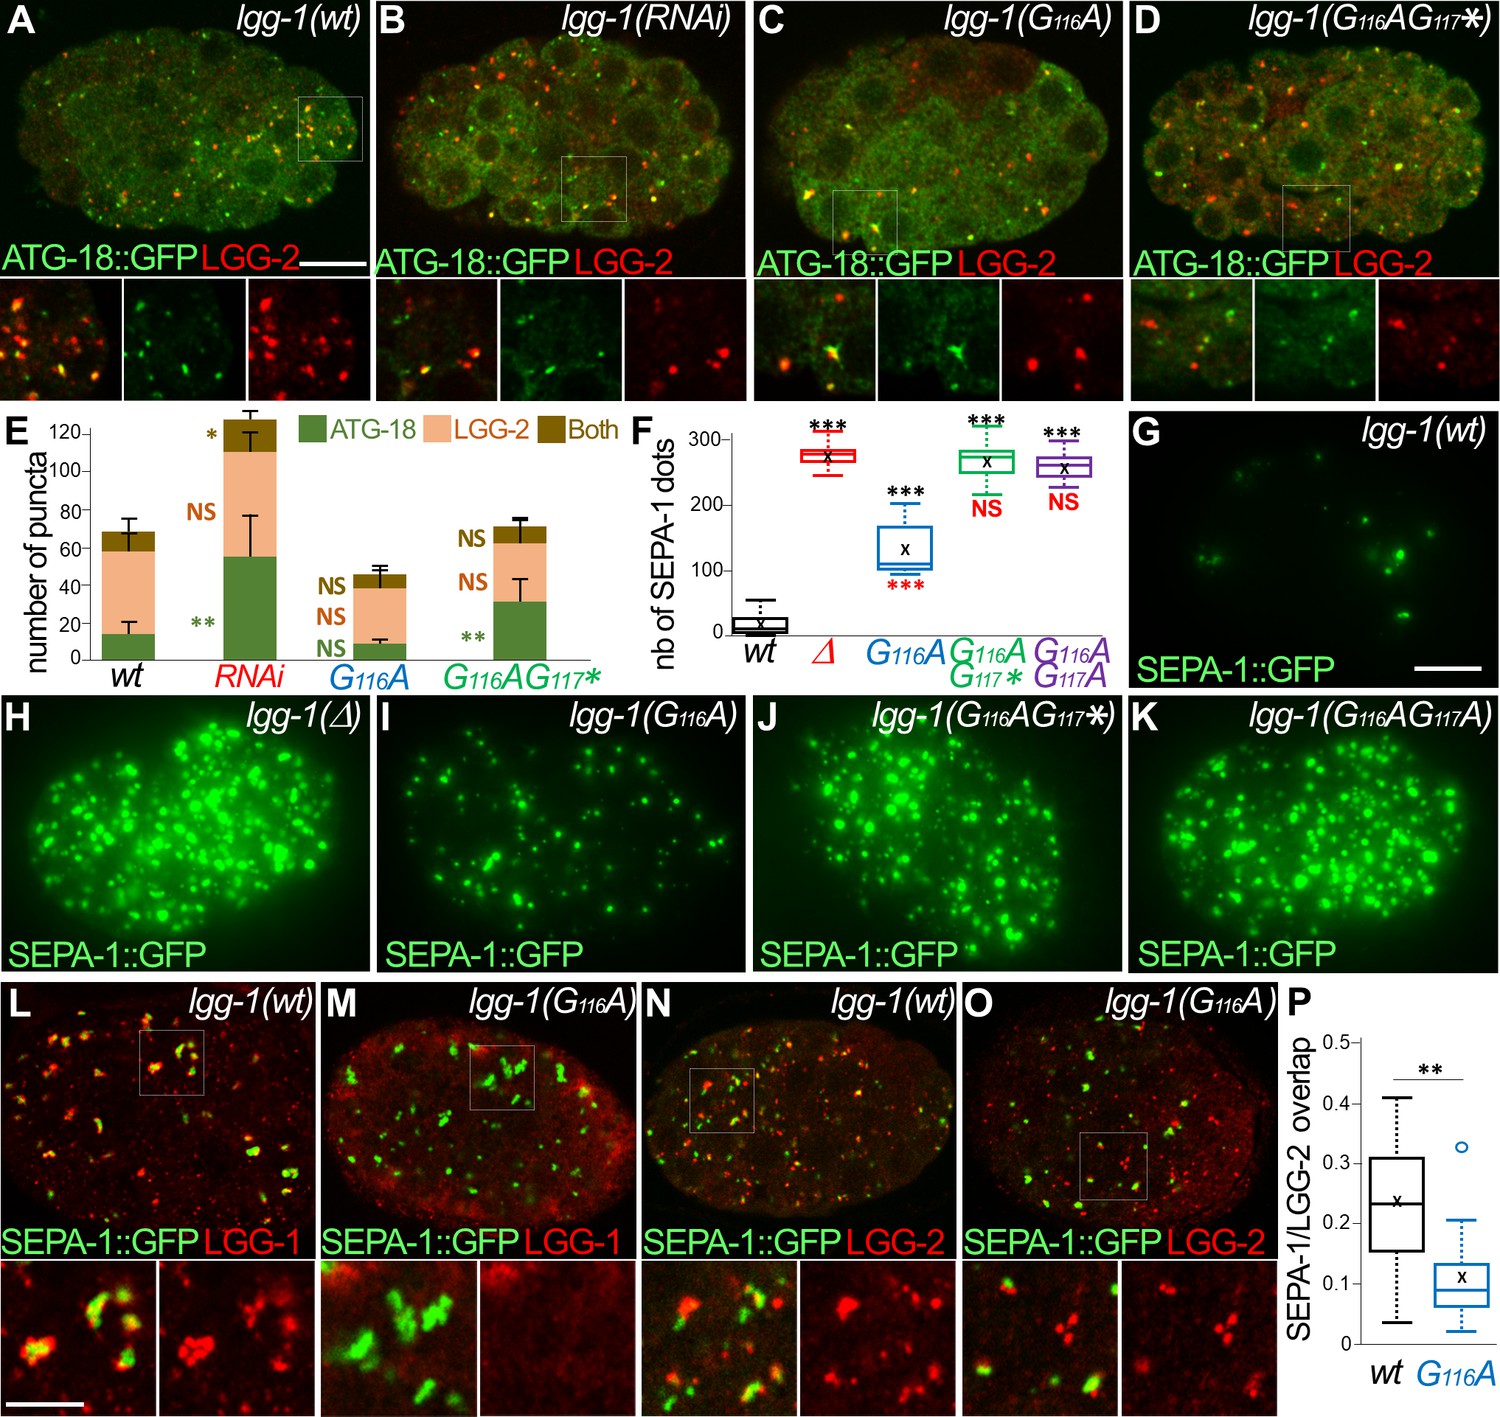
(A–E) Confocal images of ATG-18::GFP (green) and LGG-2 (red) immunofluorescence in wild-type (H), lgg-1(RNAi) (I), lgg-1(G116A) (J), lgg-1(G116AG117*) (K) 100 cells embryos. Insets are twofold magnification of the white boxed regions. (E) Compared to ATG-18 puncta the number of colocalization is decreased in lgg-1(RNAi) (P-value <0.05) and lgg-1(G116AG117*) (p-value*<0.001) but not lgg-1(G116A) embryos (mean + SD, n=10, 10, 10, 10; Kruskal Wallis p-value*<0.05**<0.01). (F–K) Quantification (F) and maximum projections of epifluorescence images of the aggrephagy cargo SEPA-1::GFP in 1.5 fold embryos for wild-type (G), lgg-1(Δ) (H), lgg-1(G116A) (I), lgg-1(G116AG117*) (J) and lgg-1(G116AG117A) (K). Boxplots of SEPA-1::GFP dots (n=10) (F) indicate that the degradation is stronger in lgg-1(G116A) embryos than in lgg-1(RNAi), lgg-1(G116AG117*) and lgg-1(G116AG117A) but weaker than in wt. (L–P) Confocal images of SEPA-1::GFP (green) and LGG-1 (L, M) or LGG-2 (N, O) (red) immunofluorescence in wild-type (L, N) and lgg-1(G116A) (M, O) 100 cells embryos. Insets are 2.5-fold magnification of the white boxed regions. In lgg-1(G116A) embryos LGG-2-positive/ LGG-1-negative autophagosomes are detected close to SEPA-1::GFP cargos but with a decreased overlap. (P) Box-plots of the overlap between green and red pixels (Manders coefficient) in wild-type and lgg-1(G116A) (n=11, 13; Mann-Whitney test **<0.01). Scale bar is 10 µm (A–K) or 5 µm (L- O).
-
Figure 7—source data 1
Folder containing original microscopy pictures and quantification data shown in Figure 7.
- https://cdn.elifesciences.org/articles/85748/elife-85748-fig7-data1-v2.zip
Figure 7—figure supplement 1
LGG-1(G116A) function in aggrephagy is dependent on UNC-51 and EPG-2.
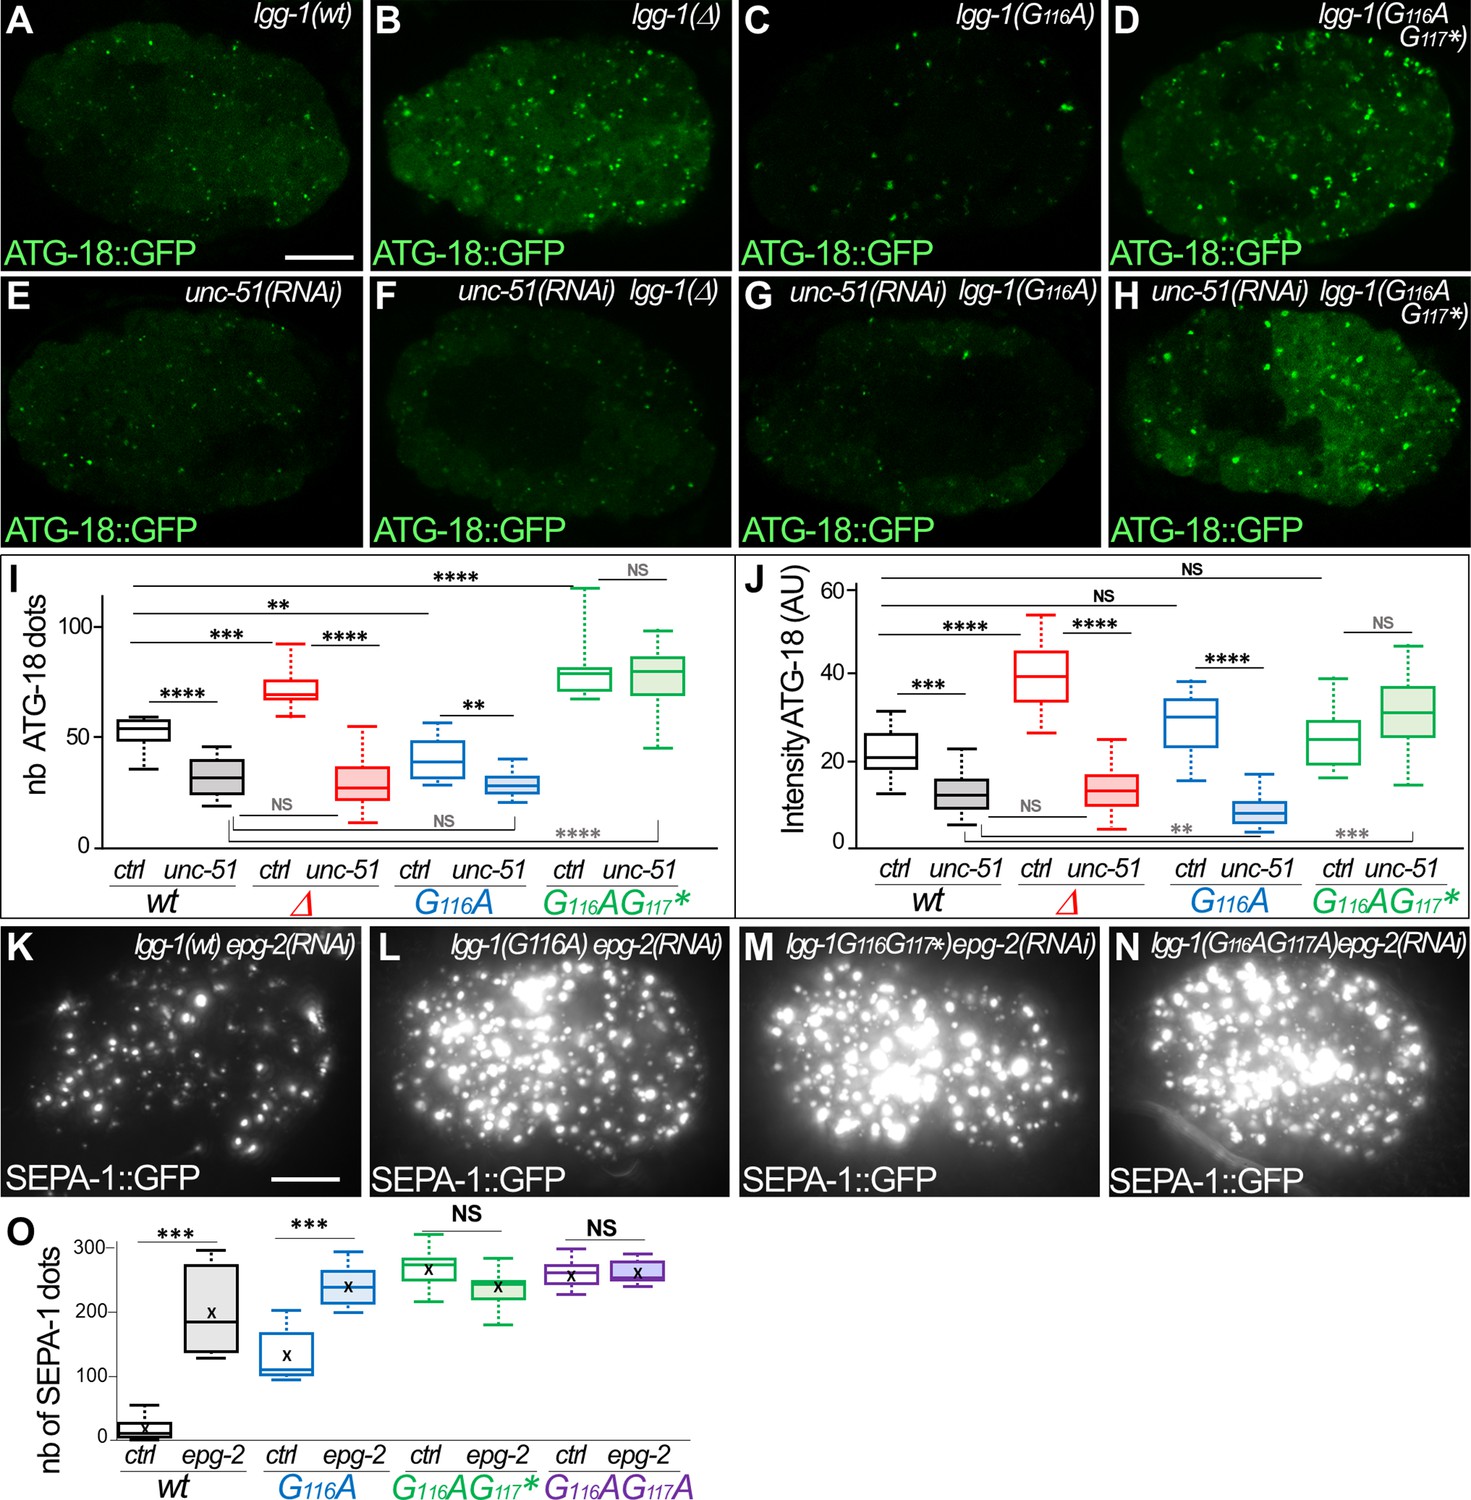
(A–H) In vivo confocal images of ATG-18::GFP, showing the initiation of autophagosome biogenesis, in 50–100 cells embryos for wild-type (A), lgg-1(Δ)(B), lgg-1(G116A) (C), lgg-1(G116AG117*) (D), unc-51 (RNAI)(E), unc-51(RNAI);lgg-1(Δ)(F), unc-51(RNAI);lgg-1(G116A)(G) and unc-51(RNAI);lgg-1(G116AG117*)(H). (I, J) Boxplots of the number of ATG-18::GFP puncta (P) (n=13, 24, 10, 14, 28, 36, 27, 20) and the mean fluorescent intensity (Q) (n=42, 45, 55, 140, 145, 130,115, 100) (Kruskal-Wallis test p-value *<0.05, **p<0.01, ***p<0.001, ****p<0.0001, NS non-significant) (K–O) Maximum projections of epifluorescence images of the aggrephagy cargo SEPA-1::GFP in 1.5-fold embryos for epg-2(RNAi) (K), lgg-1(G116A) epg-2(RNAi) (L), lgg-1(G116AG117*) epg-2(RNAi) (M) and lgg-1(G116AG117A) epg-2(RNAi) (N). Boxplots of SEPA-1::GFP dots (n=10, Kruskal Wallis p-value***<0.001, NS non-significant) (O). The degradation of SEPA-1::GFP in lgg-1(G116A) animals is dependent on EPG-2. Scale bar is 10 µm.
-
Figure 7—figure supplement 1—source data 1
Folder containing original microscopy pictures and quantification data shown in Figure 7—figure supplement 1.
- https://cdn.elifesciences.org/articles/85748/elife-85748-fig7-figsupp1-data1-v2.zip
Tables
Key resources table
| Reagent type (species) or resource | Designation | Source or reference | Identifiers | Additional information |
|---|---|---|---|---|
| Gene (C. elegans) | lgg-1 | Wormbase | WBGene00002980 | |
| Strain, strain background (C. elegans) | N2 | CGC | Wild-type strain | |
| Genetic reagent (C. elegans) | DA2123 | CGC | adIs2122[gfp::lgg‐1;rol‐6(su1006)] | |
| Genetic reagent (C. elegans) | GK1057 | Sato and Sato, 2011 | Pspe‐11‐hsp‐6::GFP | |
| Genetic reagent (C. elegans) | HZ455 | CGC | him‐5(e1490) V; bpIs131[sepa‐1::gfp] | |
| Genetic reagent (C. elegans) | HZ1685 | CGC | atg‐4.1(bp501) | |
| Genetic reagent (C. elegans) | MAH247 | CGC | sqls25[atg‐18 p::atg‐18::gfp +rol‐6(su1006) ] | |
| Genetic reagent (C. elegans) | RD202 | Legouis lab | Is202[unc‐119(ed3)III;plgg‐1::GFP::LGG‐1 G‐>A] | |
| Genetic reagent (C. elegans) | lgg-1(Δ) | Mitani lab | NBRP: tm3489 | lgg‐1(tm3489) |
| Genetic reagent (C. elegans) | lgg-2(tm5755) | Mitani lab | NBRP: tm5755 | lgg‐2(tm5755) |
| Genetic reagent (C. elegans) | RD363; lgg-1(Δ112–123) | This paper | lgg‐1(pp22)dpy‐10(pp157) Legouis lab | |
| Genetic reagent (C. elegans) | RD367; lgg-1(G116A) | This paper | lgg‐1(pp65[G116A]) Legouis lab | |
| Genetic reagent (C. elegans) | RD368; lgg-1(Δ100–123) | This paper | lgg‐1(pp66) Legouis lab | |
| Genetic reagent (C. elegans) | RD420; lgg-1(G116AG117*) | This paper | lgg‐1(pp141[G116AG117stop]) Legouis lab | |
| Genetic reagent (C. elegans) | RD421; lgg-1(G116AG117A) | This paper | dpy-10(pp163)lgg-1(pp142[G116AG117A]) Legouis lab | |
| Genetic reagent (C. elegans) | RD425 | This paper | dpy-10(pp163)lgg1(pp142)/+; SEPA-1::gfp Legouis lab | |
| Genetic reagent (C. elegans) | RD435 | This paper | lgg‐1(pp141[G116AG117stop]); atg‐18 p::atg‐18::gfp +rol‐6(su1006) Legouis lab | |
| Genetic reagent (C. elegans) | RD436 | This paper | lgg‐1(pp65[G116A]); atg‐18 p:: atg‐18::gfp +rol‐6(su1006) Legouis lab | |
| Genetic reagent (C. elegans) | RD440 | This paper | lgg‐1(pp141[G116AG117stop]); lgg‐2(tm5755) Legouis lab | |
| Genetic reagent (C. elegans) | RD446 | This paper | lgg‐1(pp65[G116A]); lgg‐2(tm5755) Legouis lab | |
| Genetic reagent (C. elegans) | RD447 | This paper | lgg‐1(tm3489); atg‐18 p::atg‐ 18::gfp +rol‐6(su1006) Legouis lab | |
| Genetic reagent (C. elegans) | RD448 | This paper | lgg‐1(pp65[G116A]); SEPA‐1::gfp Legouis lab | |
| Genetic reagent (C. elegans) | RD449 | This paper | lgg‐1(pp141[G116AG117stop]); SEPA‐1::gfp Legouis lab | |
| Genetic reagent (C. elegans) | RD450 | This paper | lgg‐1(tm3489)II; SEPA‐1::gfp Legouis lab | |
| Strain, strain background (S. cerevisiae) | BY4742 | Euroscarf | Mat alpha ura3Δ0, his3Δ1, leu2Δ0, lys2Δ0 | |
| Genetic reagent (S. cerevisiae) | OC513 | YKO collection | BY4742, atg1::KanMX4 | |
| Genetic reagent (S. cerevisiae) | OC612 | YKO collection | BY4742, atg8::KanMX4 | |
| Genetic reagent (S. cerevisiae) | OC608‐OC609 | This paper | BY4742, atg8G116A Legouis lab | |
| Genetic reagent (S. cerevisiae) | OC610‐OC611 | This paper | BY4742, atg8G116A‐R117* Legouis lab | |
| Genetic reagent (S. cerevisiae) | OC613 | This paper | BY4742, pho8::pho8Δ60‐URA3KL Legouis lab | |
| Genetic reagent (S. cerevisiae) | OC614 | This paper | BY4742, atg1::KanMX4, pho8:: pho8Δ60‐URA3KL Legouis lab | |
| Genetic reagent (S. cerevisiae) | OC615 | This paper | BY4742, atg8::KanMX4, pho8:: pho8Δ60‐URA3KL Legouis lab | |
| Genetic reagent (S. cerevisiae) | OC616‐OC617 | This paper | BY4742, atg8G116A, pho8:: pho8Δ60‐URA3KL Legouis lab | |
| Genetic reagent (S. cerevisiae) | OC618‐OC619 | This paper | BY4742, atg8G116A‐R117*, pho8:: pho8Δ60‐URA3KL Legouis lab | |
| Strain strain background (E. coli) | OP50 | CGC | see Material and Methods | |
| Genetic reagent (E. coli) | JA-C32D5.9 | Open Biosystem | lgg‐1 RNAi feeding bacterial clone | |
| Genetic reagent (E. coli) | JA-C56C10.12 | Open Biosystem | epg‐5 RNAi feeding bacterial clone | |
| Genetic reagent (E. coli) | JA-Y55F3AM.4 | Open Biosystem | atg-3 RNAi feeding bacterial clone; | |
| Genetic reagent (E. coli) | JA-M7.5 | Open Biosystem | atg-7 RNAi feeding bacterial clone | |
| Genetic reagent (E. coli) | JA-W03C9.3 | Open Biosystem | rab-7 RNAi feeding bacterial clone | |
| Genetic reagent (E. coli) | JA- Y39G10AR.10 | Open Biosystem | epg-2 RNAi feeding bacterial clone | |
| Sequence-based reagent | CrRNA(s) | Paix et al., 2015 | dpy-10 : 5’GCUACCAUAGGCACCACGAGGU UUUAGAGCUAUGCUGUUUUG3’ | |
| Sequence-based reagent | CrRNA(s) | This paper | lgg-1 Legouis lab 5’UACAGUGACGAAAGUGUG UAGUUUUAGAGCUAUGCUGUUUUG3’ | |
| Sequence-based reagent | Repair template | Paix et al., 2015; | dpy-10 : 5’CACTTGAACTTCAATACGGCAAGATGAGAATGACTGGAAACCGTACCGCATGCGGTGCCTATGGTAGCGGAGCTTCACATGGCTTCAGACCAACAGCCTAT3’ | |
| Sequence-based reagent | Repair template | This paper | lgg-1 (G116A): Legouis lab 5’CTTTACATCGCGTACAGTGACGAAAGTGTCTACGCCGGAGAGGTCGAAAAGAAGGAATAAAGTGTCATGTAT3’ | |
| Sequence-based reagent | Repair template | This paper | lgg-1 (G116AG117 *): Legouis lab 5’TTCCTTTACATCGCCTACAGTGACGAAAGTGTGTACGCCTAAGAATTCGAAAAGAAGGAATAAAGTGTCATGTATTATCCG3’ | |
| Sequence-based reagent | Repair template | This paper | lgg-1 (G116AG117A): Legouis lab 5’TTCCTTTACATCGCCTACAGTGACGAAAGTGTGTACGCCGCAGAGGTCGAAAAGAAGGAATAAGAATTCAGTGTCATGTATTATCCGCCGACGAATGTGTATAC3’ | |
| Sequence-based reagent | Universal tracrRNA | Dharmacon GE | U-002000–05 | 5’AACAGCAUAGCAAGUUAAAAUAAGGCU AGUCCGUUAUCAACUUGAAAAAGUGGC ACCGAGUCGGUGCUUUUUUU3’ |
| Peptide, recombinant protein | S. pyogenes Cas9 | Dharmacon | CAS11201 | Edit-R Cas9 Nuclease Protein, 1000 pmol |
| Antibody | anti‐LGG‐1 (rabbit polyclonal) | Springhorn and Hoppe, 2019 | Ab#3 WB (1:3000) | |
| Antibody | anti‐LGG‐1 (rabbit polyclonal) | Al Rawi et al., 2011 | Ab#1 WB (1:200) IF(1:100) | |
| Antibody | anti‐LGG‐2 (rabbit polyclonal) | Manil-Ségalen et al., 2014 | WB (1:200) IF (1:200) | |
| Antibody | anti‐Tubulin (mouse monoclonal) | Sigma | 078K4763 | WB (1:1000) |
| Antibody | anti-SEL-1 (rabbit polyclonal) | Hoppe’s lab | WB (1:8000) | |
| Antibody | anti-CDC-48.1 (rabbit polyclonal) | Hoppe’s lab | WB (1:5000) | |
| Antibody | Anti-Rabbit HRP (goat polyclonal) | Promega | W401B | WB (1:5000) |
| Antibody | Anti-mouse HRP (goat polyclonal) | Promega | W4021 | WB (1:10,000) |
| Antibody | anti-GABARAP (rabbit polyclonal) | Chemicon | AB15278 | IF (1:200) |
| Antibody | anti-GFP (mouse monoclonal) | Roche | 1814460 | IF (1:250) |
| Antibody | anti-mouse IgG Alexa Fluor488 (goat polyclonal) | Molecular Probes | A11029 | IF (1:500 to 1:1000) |
| Antibody | anti-rabbit IgG Alexa Fluor488 (goat polyclonal) | Molecular Probes | A110034 | IF (1:500 to 1:1000) |
| Antibody | anti-rabbit IgG Alexa Fluor568 (goat polyclonal) | Sigma-Aldrich | A11036 | IF (1:500 to 1:1000) |
| Antibody | anti-GFP (rabbit polyclonal) | Abcam | ab6556 | (Immunogold 1:10) |
| Antibody | anti-rabbit IgG (goat polyclonal) | Biovalley | 810.011 | Coupled to 10 nm colloidal gold particles (Immunogold 1:20) |
| Chemical compound, drug | EPON | Agar Scientific | R1165 | see Materials and methods |
| Chemical compound, drug | lead citrate | Sigma‐Aldrich | 15326 | see Materials and methods |
| Chemical compound, drug | LRWHITE | Electron Microscopy Sciences | 14381 | see Materials and methods |
| Peptide, recombinant protein | LC3 traps | Quinet et al., 2022 | Molecular traps for LGG-1 | |
| Commercial assay or kit | Super Signal Pico Chemiluminescent Substrate | Thermo Scientific | 34579 | see Materials and methods |
| Commercial assay or kit | NuPAGE 4%‐12% Bis‐ Tris gel | Life Technologies | NP0321BOX | see Materials and methods |
| Software, algorithm | ImageJ | http://imagej.nih.gov/ij | see Materials and methods | |
| Software, algorithm | Fidji | https://fiji.sc/ | see Materials and methods | |
| Software, algorithm | Prism | GraphPad | see Materials and methods | |
| Software, algorithm | R software | https://www.r-project.org/ | see Materials and methods | |
| Software, algorithm | Crispr | http://Crispr.mit.edu | see Materials and methods | |
| Software, algorithm | Crispor | http://crispor.org | see Materials and methods | |
| Other | MitoTracker Red CMXRos | Molecular Probes | M7512 | see Materials and methods |
Additional files
Download links
A two-part list of links to download the article, or parts of the article, in various formats.
Downloads (link to download the article as PDF)
Open citations (links to open the citations from this article in various online reference manager services)
Cite this article (links to download the citations from this article in formats compatible with various reference manager tools)
LGG-1/GABARAP lipidation is not required for autophagy and development in Caenorhabditis elegans
eLife 12:e85748.
https://doi.org/10.7554/eLife.85748


