Dermal appendage-dependent patterning of zebrafish atoh1a+ Merkel cells
- Department of Biology, University of Washington, United States
- Molecular and Cellular Biology Program, University of Washington, United States
- Department of Biological Structure, University of Washington, United States
- Department of Otolaryngology - Head and Neck Surgery, University of Washington, United States
- Institute for Stem Cell and Regenerative Medicine, University of Washington, United States
Figures
Figure 1 with 3 supplements

The adult scale epidermis contains atoh1a+ Merkel cells (MCs).
(A) Illustration of the adult zebrafish trunk anatomy showing the organization of epidermis, scales, and dermis. Scales are flat bony discs arranged in an overlapping, imbricated pattern and coated on their external surface by epidermis. (B) Transmission electron microscopy (TEM) of a presumptive MC from the scale epidermis. Dotted boxes indicate regions of magnification in B’–B’’’. (B’) Magnification of B showing cytoplasmic granules (g, brackets) juxtaposed to a putative axon (a) contact containing a mitochondrion (m). (B’’ and B’’’) Magnifications of B showing desmosomal-like (d, arrows) attachments between keratinocytes (B’’) and between a presumptive MC and keratinocyte (B’’’). (C and C’) TEM of a presumptive MC from the scale epidermis showing a microvillar process (p, arrowhead). (D) Illustration of a cross section of the scale epidermis based on TEM observations. Periderm cells (superficial epidermis; dark blue) are located in the uppermost epidermal stratum, and basal keratinocytes (light blue) are located in the lowermost epidermal stratum. MCs containing cytoplasmic granules, extending microvillar processes, and contacting axons localize between keratinocytes. (E) Lateral confocal micrograph of the trunk epidermis in an adult expressing reporters for keratinocytes (Tg(actb2:LOXP-BFP-LOXP-DsRed)) and atoh1a-expressing cells (Tg(atoh1a:nls-Eos)). Dotted boxes indicate areas of magnification in E’ and E’’. (E’) Magnification of E showing atoh1a+ hair cells (HCs) and progenitors within neuromasts (nm) of the posterior lateral line. (E’’) Magnification of E showing atoh1a+ MCs scattered throughout the scale epidermis. (F) Lateral and reconstructed cross sectional confocal micrographs of the trunk in an adult expressing reporters for keratinocytes (Tg(actb2:LOXP-BFP-LOXP-DsRed)) and atoh1a-expressing cells (Tg(atoh1a:nls-Eos)) and stained with Alizarin Red S (ARS) to label the mineralized scale matrix. Note that atoh1a+ MCs localize to the epidermis above scales (arrowhead). (G) Lateral confocal micrograph of the scale epidermis in an adult expressing reporters for keratinocytes (Tg(krt4:DsRed)) and F-actin within atoh1a+ MCs (Tg(atoh1a:Lifeact-EGFP)). Note that all atoh1a+ MCs extend multiple microvilli. (G’) Magnification of G with arrowheads indicating individual microvillar processes on the surface of MCs. (G’’) Reconstructed cross section along the yellow line in G. MCs localize to the upper epidermal strata as diagrammed in D. Note that Tg(krt4:DsRed) (blue) preferentially labels keratinocytes in the upper epidermal strata, but not in the basal cell layer. Scale bars: 1 µm (B and C), 0.1 µm (B’–B’’’), 0.5 µm (C’), 50 µm (E–E’’ and F), 10 µm (G), and 5 µm (G’ and G’’).
Figure 1—figure supplement 1
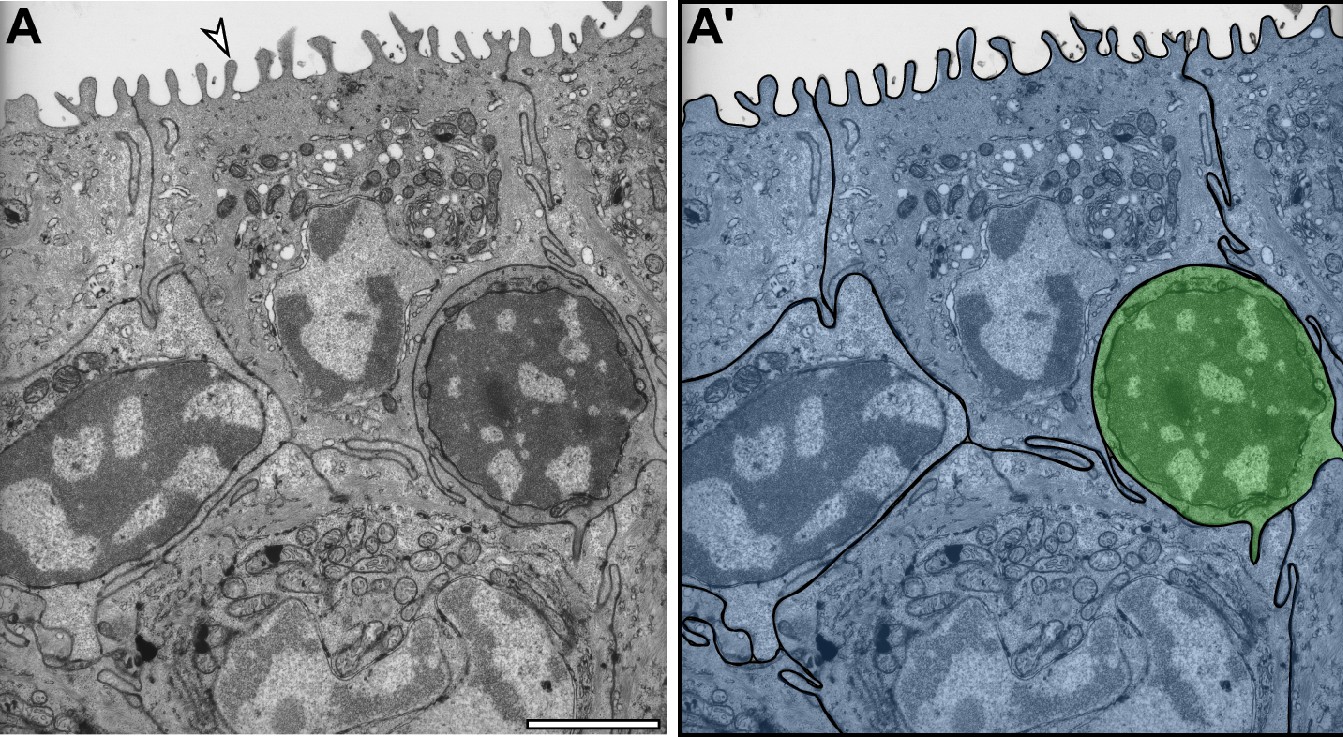
TEM characterization of presumptive MC and adjacent keratinocytes.
(A) Transverse TEM of adult scale epidermis illustrating typical keratinocyte and MC morphologies. Arrowhead indicates a microridge on the surface of a periderm cell. (A’) Pseudocolored overlay showing keratinocytes (blue) and a presumptive MC (green). Scale bar: 2 µm.
Figure 1—figure supplement 2
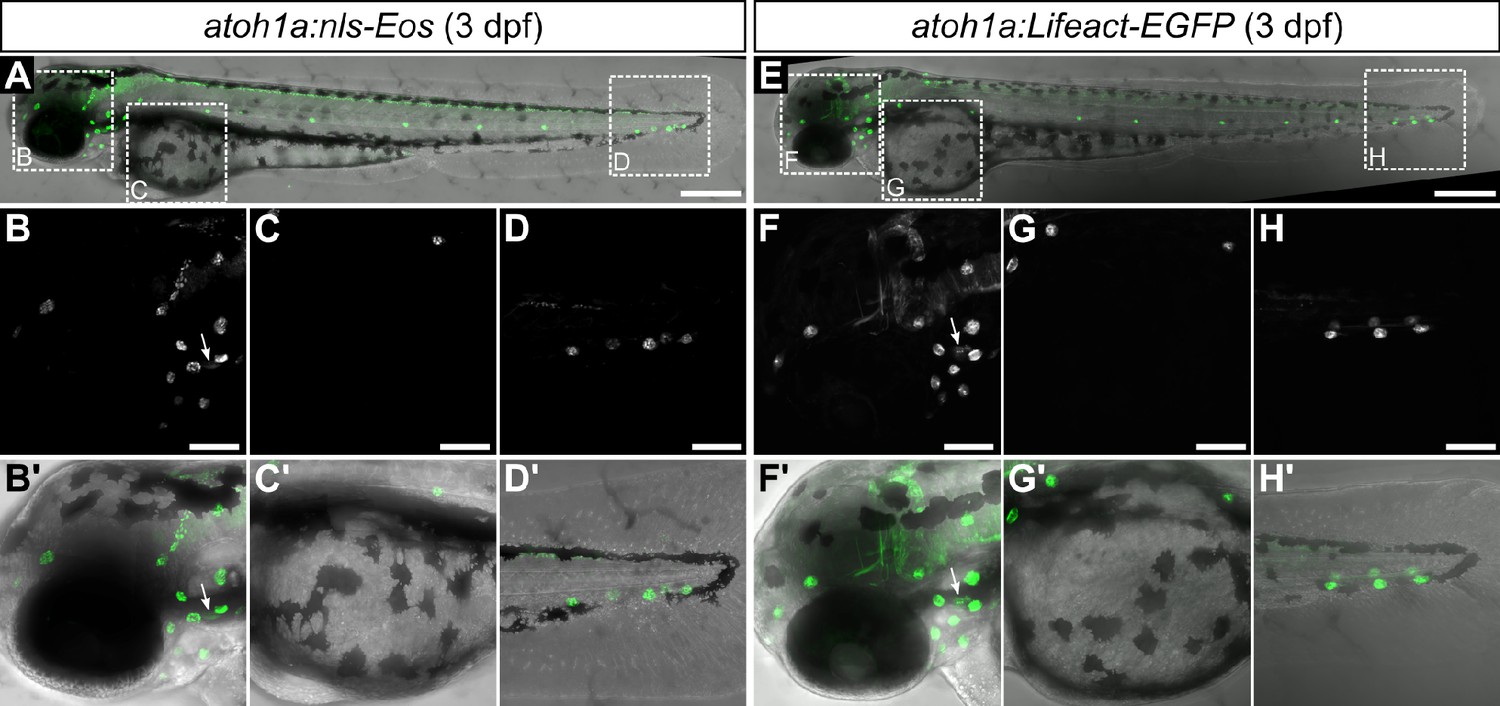
Characterization of atoh1a reporter transgenes in larvae.
(A-H) Confocal micrographs of 3 dpf larvae expressing the indicated transgenes. Dotted boxes in A and E indicate areas of magnification for panels below. Arrows indicate expression by hair cells of the inner ear. Scale bars: 300 μm (A, E) and 100 μm (B-D, F-H).
Figure 1—figure supplement 3
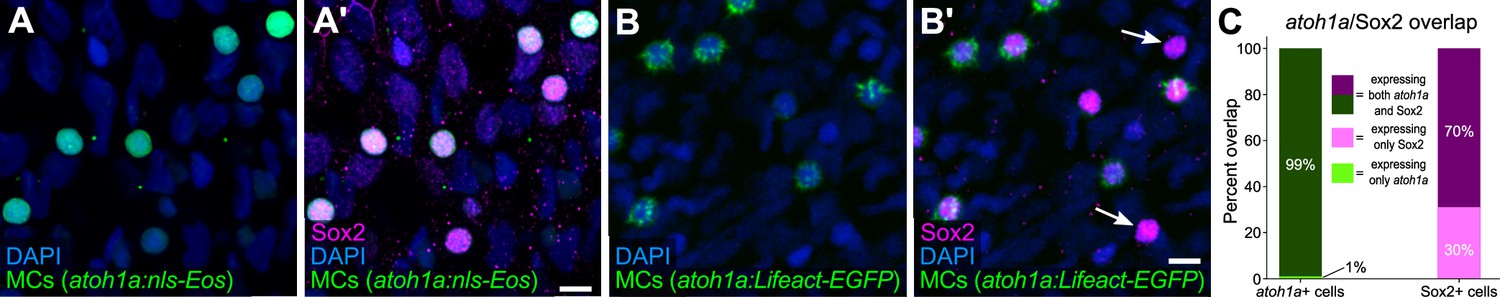
MCs in the adult epidermis express Sox2.
(A-B’) Lateral confocal micrographs of the scale epidermis showing anti-Sox2 immunostaining of MCs labeled by either Tg(atoh1a:nls-Eos) (A, A’) or Tg(atoh1a:Lifeact-EGFP) (B, B’). Arrows indicate examples of Sox2+/atoh1a- cells. DAPI labels epidermal nuclei. (C) Quantification of the overlap between atoh1a+ MCs and Sox2 immunostaining. 99% of atoh1a:nls-Eos+ MCs expressed Sox2 (769/774 cells from N=5 fish; 25–29 mm SL) and 70% of Sox2+ cells were atoh1a+ (769/1102 cells from N=5 fish; 25–29 mm SL). Scale bars: 5 μm.
-
Figure 1—figure supplement 3—source data 1
Datasheet for Figure 1—figure supplement 3.
- https://cdn.elifesciences.org/articles/85800/elife-85800-fig1-figsupp3-data1-v2.xlsx
Figure 2
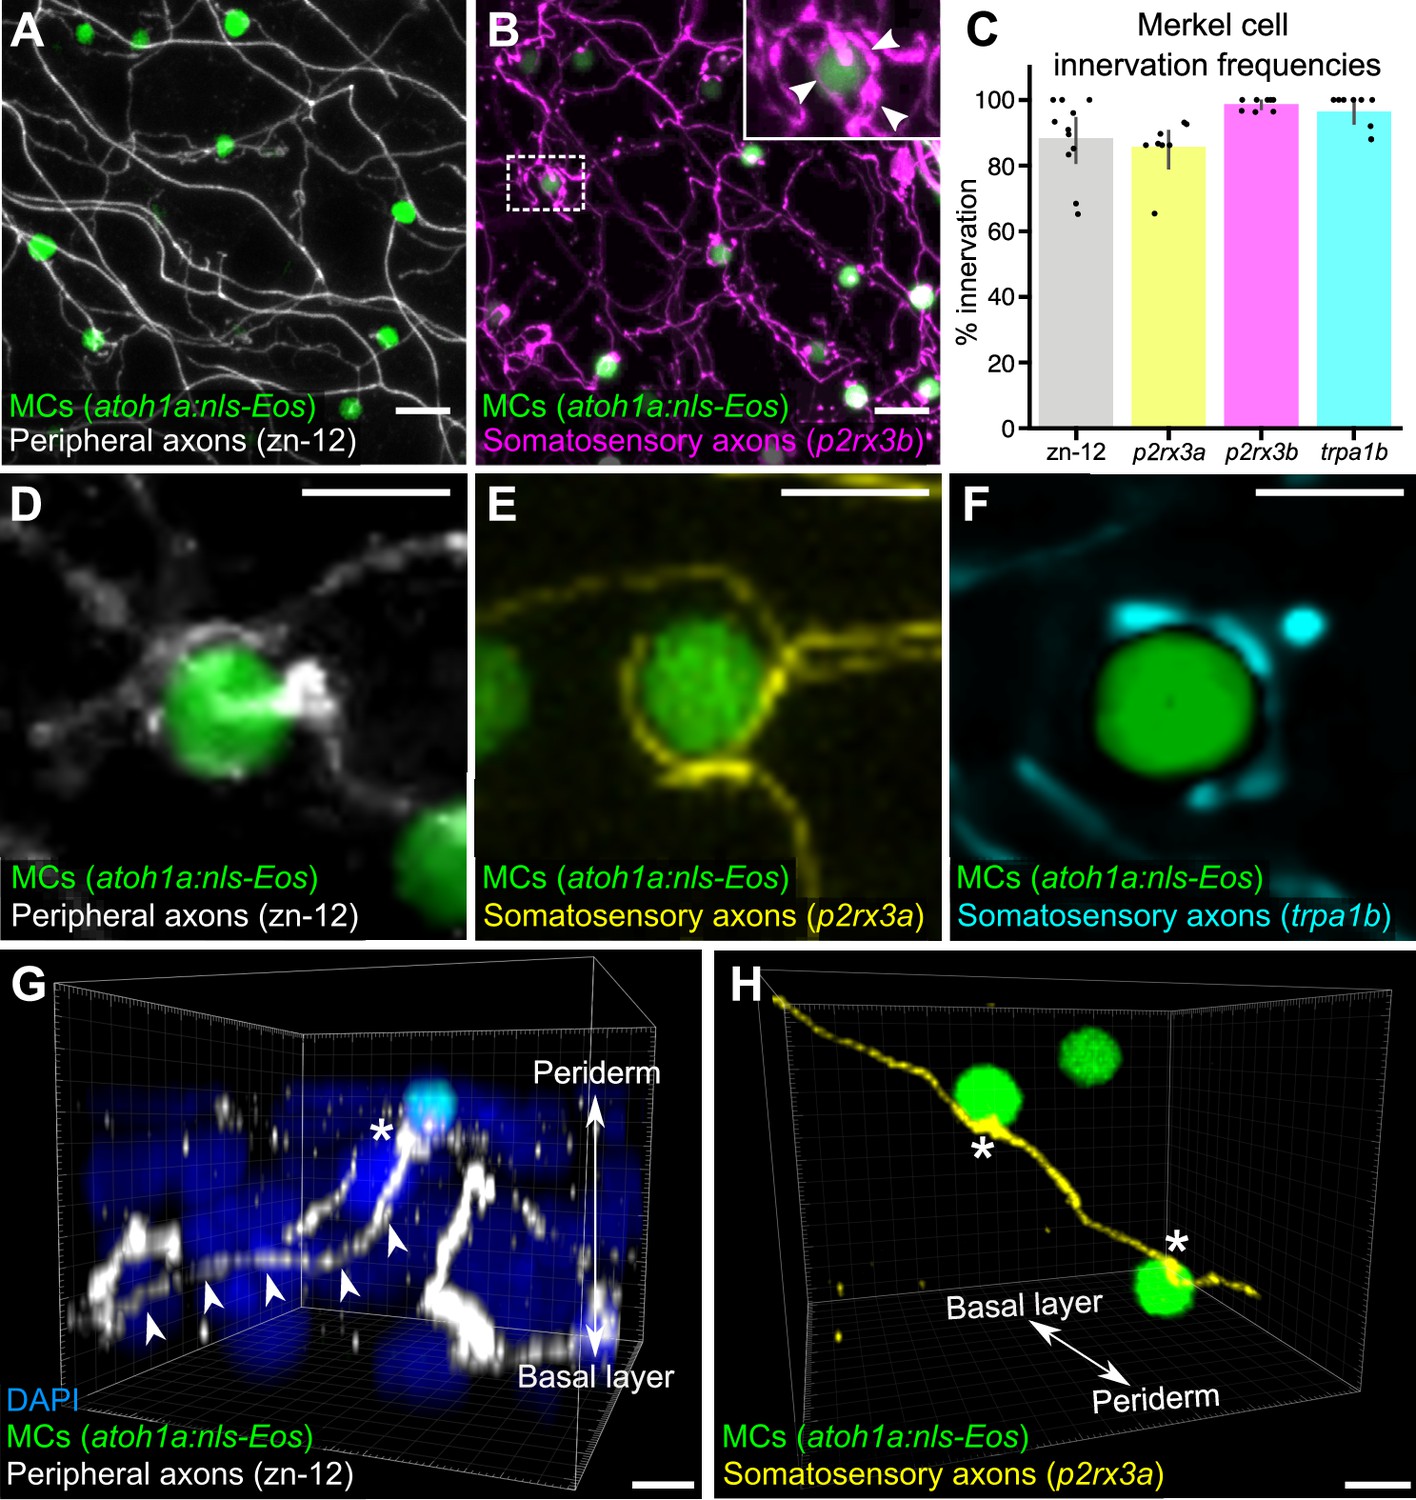
Somatosensory axons innervate Merkel cells (MCs) in the adult epidermis.
(A) Lateral confocal micrograph of the scale epidermis from an adult expressing an MC reporter immunostained for peripheral axons (zn-12). (B) Lateral confocal micrograph of the scale epidermis showing that somatosensory peripheral axons (Tg(p2rx3b:EGFP)) innervate MCs. Inset of dotted region shows axonal varicosities adjacent to an MC (arrowheads). (C) Quantification of MC innervation in the scale epidermis (17–30 mm standard length [SL]). Each dot represents measurements from an individual scale. Innervation frequencies: zn-12, 91% (284/311 cells; N=3 adults); Tg(p2rx3a>mCherry), 86% (196/228 cells; N=4 adults); Tg(p2rx3b:EGFP), 99% (225/228 cells; N=4 adults); Tg(trpa1b:EGFP), 96% (217/225 cells; N=9 adults). Error bars represent 95% CIs. (D–F) High-magnification confocal micrographs showing examples of somatosensory axons forming extended, ring-like contacts with MCs within the scale epidermis. (G) Three-dimensional (3D) reconstruction of an axon (zn-12 immunostaining, arrowheads) forming a bouton-like ending (asterisk) that terminates in close proximity to an MC. DAPI staining labels epidermal nuclei. (H) 3D reconstruction of a single somatosensory axon (Tg(p2rx3a>mCherry)) that forms en passant-like contacts (asterisks) with multiple MCs. Scale bars: 10 μm (A and B), 5 μm (D–H).
-
Figure 2—source code 1
ImageJ macro used for Figure 2C.
- https://cdn.elifesciences.org/articles/85800/elife-85800-fig2-code1-v2.zip
-
Figure 2—source data 1
Datasheet for Figure 2C.
- https://cdn.elifesciences.org/articles/85800/elife-85800-fig2-data1-v2.xlsx
Figure 3 with 1 supplement

Merkel cells (MCs) in the adult epidermis express neurosecretory and mechanosensory machinery.
(A and B) Anti-SV2 (A–A’’) or anti-5-hydroxytryptamine (5-HT) (B–B’’) immunostaining of the scale epidermis from an adult expressing an MC reporter. Insets of dotted regions show the punctate localization of SV2 and 5-HT staining in MCs (arrowheads), consistent with a vesicular localization. 96% of MCs (178/185) were SV2+. 98% of MCs (326/332) were 5-HT+. Cells analyzed from n=3 scales from N=2 adults (25–27 mm standard length [SL]). DAPI labels epidermal nuclei. (C) Scale epidermis from an adult expressing an MC reporter stained with AM1-43. 98% of MCs (90/92) were AM1-43+. Cells analyzed from n=6 scales from N=2 adults. Inset of dotted region shows puncta within an MC labeled by AM1-43 (arrowheads). AM1-43 has been reported to stain neurites innervating MCs in murine whisker vibrissae (Meyers et al., 2003). However, our AM1-43 staining regimen did not strongly label cutaneous axons, although we cannot exclude low levels of staining. (D) Scale epidermis from an adult expressing an MC reporter stained with hybridization chain reaction (HCR) probes against piezo2 and an anti-GFP antibody. 99% of MCs (310/314) were piezo2+. Cells analyzed from n=7 scales from N=2 adults. Arrowheads indicate examples of positive staining within an MC. Scale bars: 5µm.
Figure 3—figure supplement 1
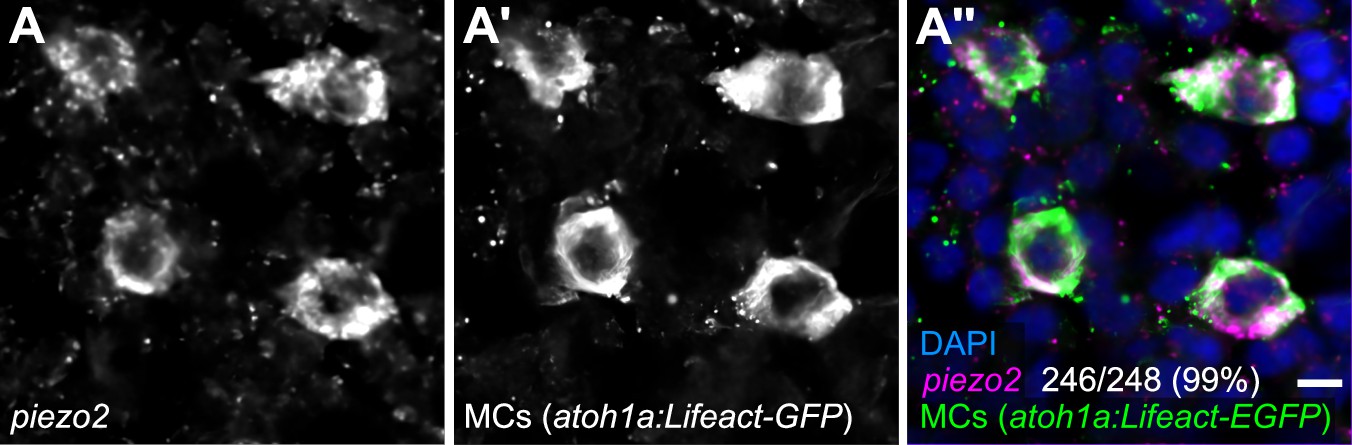
MCs in the adult epidermis express piezo2.
(A) Scale epidermis from an adult expressing an MC reporter stained with an antisense RNA probe against piezo2 and an anti-GFP antibody. 99% of MCs (246/248) were piezo2+. Cells analyzed from n=3 individual scales from N=2 adults (23–27 mm SL). Scale bar: 5 µm.
Figure 4 with 1 supplement
Merkel cells (MCs) derive from the basal keratinocyte lineage.
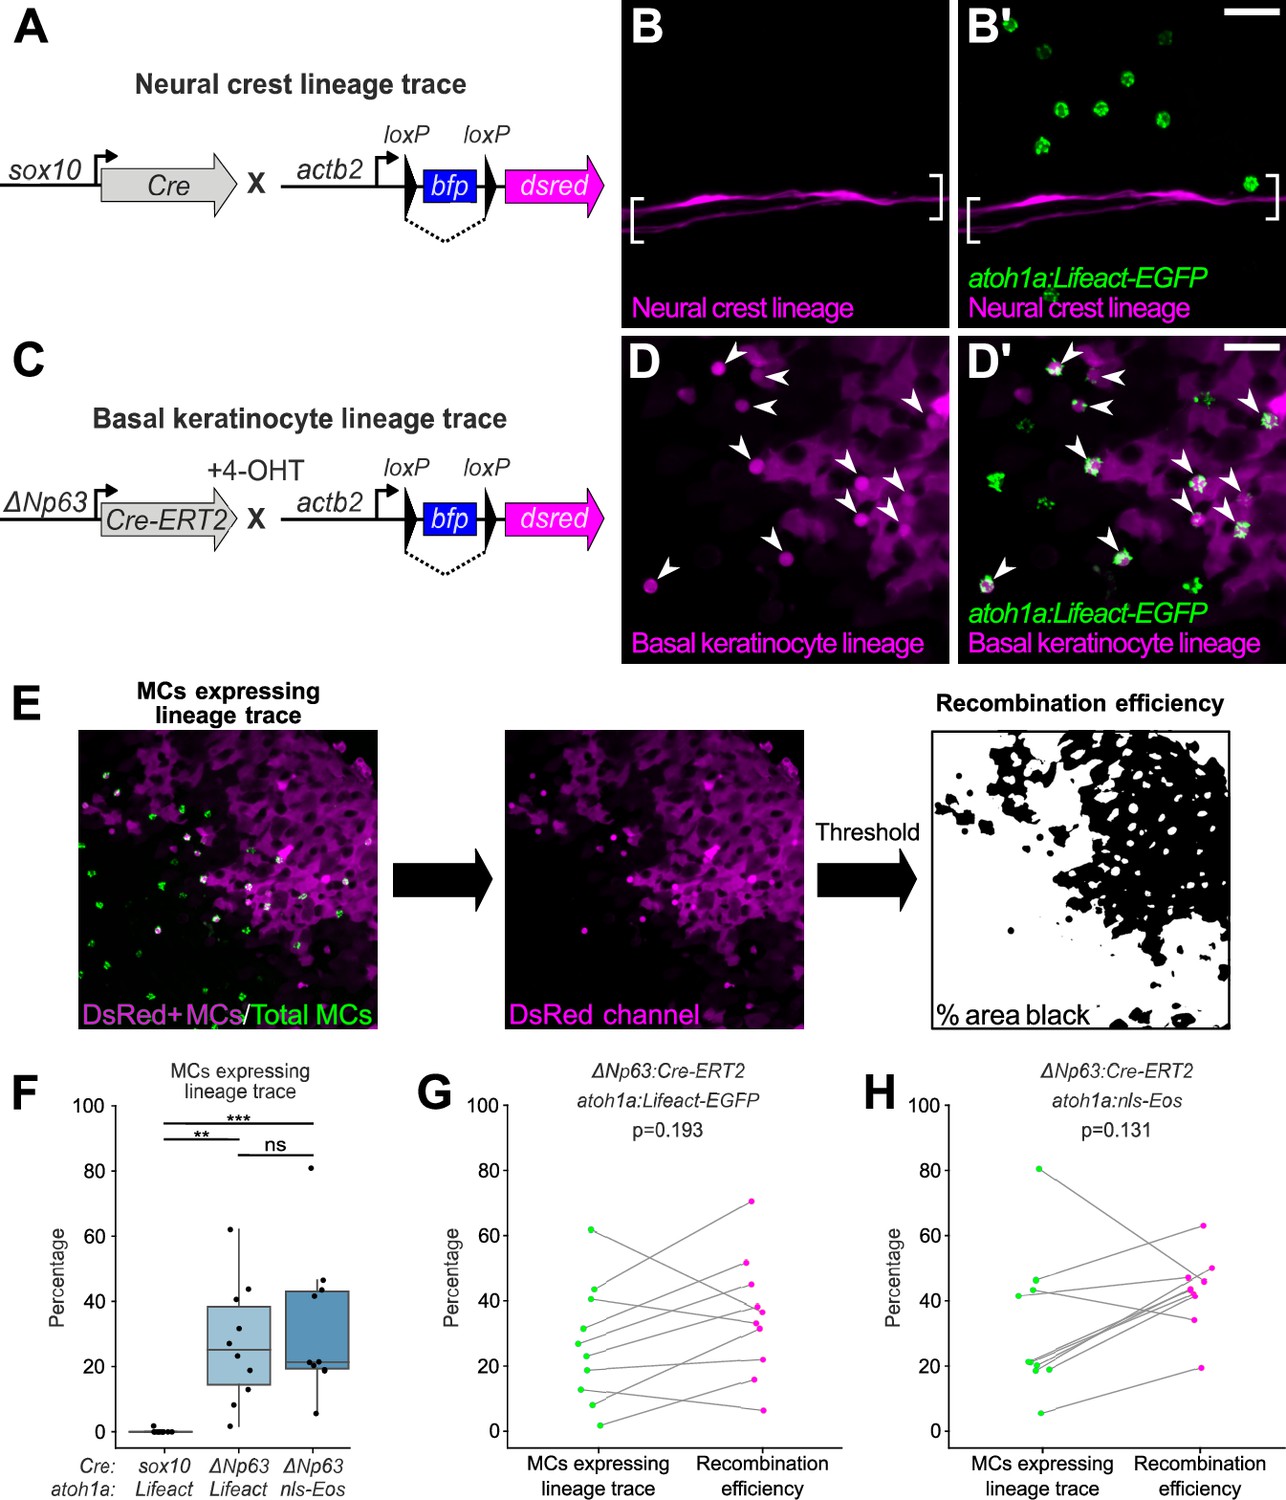
(A) Schematic of Cre-based neural crest lineage tracing strategy. (B) Confocal micrograph of the scale epidermis in an adult expressing neural crest lineage (Tg(sox10:Cre); Tg(actb2:LOXP-BFP-LOXP-DsRed)) and MC (Tg(atoh1a:Lifeact-EGFP)) reporters. Brackets denote Schwann cells associated with a nerve along a scale radius. (C) Schematic of Cre-based basal keratinocyte lineage tracing strategy. (D) Confocal micrograph of the scale epidermis in an adult expressing basal keratinocyte lineage (TgBAC(ΔNp63:Cre-ERT2); Tg(actb2:LOXP-BFP-LOXP-DsRed)) and MC (Tg(atoh1a:Lifeact-EGFP)) reporters, which was treated with 4-hydroxytamoxifen (4-OHT) at 1 day post-fertilization (dpf). Arrowheads indicate MCs labeled by the basal keratinocyte lineage reporter. Note that recombination is not complete, possibly explaining why not all MCs express the lineage reporter. (E) Workflow to calculate percentage of MCs expressing lineage reporter and percentage of total cells expressing lineage reporter. (F) Boxplots of the percentage of MCs expressing the lineage tracing reporters diagrammed in panels A and C. Each dot represents an individual scale. Overall percentage of MCs expressing lineage trace reporters: sox10/Lifeact, 0.3% (1/323 cells; N=6 adults, 27.5–31 mm standard length [SL]); ΔNp63/Lifeact, 29.7% (299/1005 cells; N=6 adults, 21–26 mm SL); ΔNp63/nls-Eos, 32.3% (386/1195 cells; N=4 adults, 20–30 mm SL). A one-way ANOVA (F=12.06; p<0.001) with Tukey’s post-hoc honestly significant difference (HSD) test was used to compare groups. **, p<0.01; ***, p<0.001. (G and H) Paired dot plots of the percentage of MCs expressing the indicated atoh1a reporter and the basal keratinocyte lineage reporter compared to the percentage of all cells in the field of view expressing DsRed. Statistical analyses were performed using the Wilcoxon test. Scale bars: 20 µm.
-
Figure 4—source data 1
Datasheet for Figure 4F.
- https://cdn.elifesciences.org/articles/85800/elife-85800-fig4-data1-v2.xlsx
-
Figure 4—source data 2
Datasheet for Figure 4G and H.
- https://cdn.elifesciences.org/articles/85800/elife-85800-fig4-data2-v2.xlsx
Figure 4—figure supplement 1
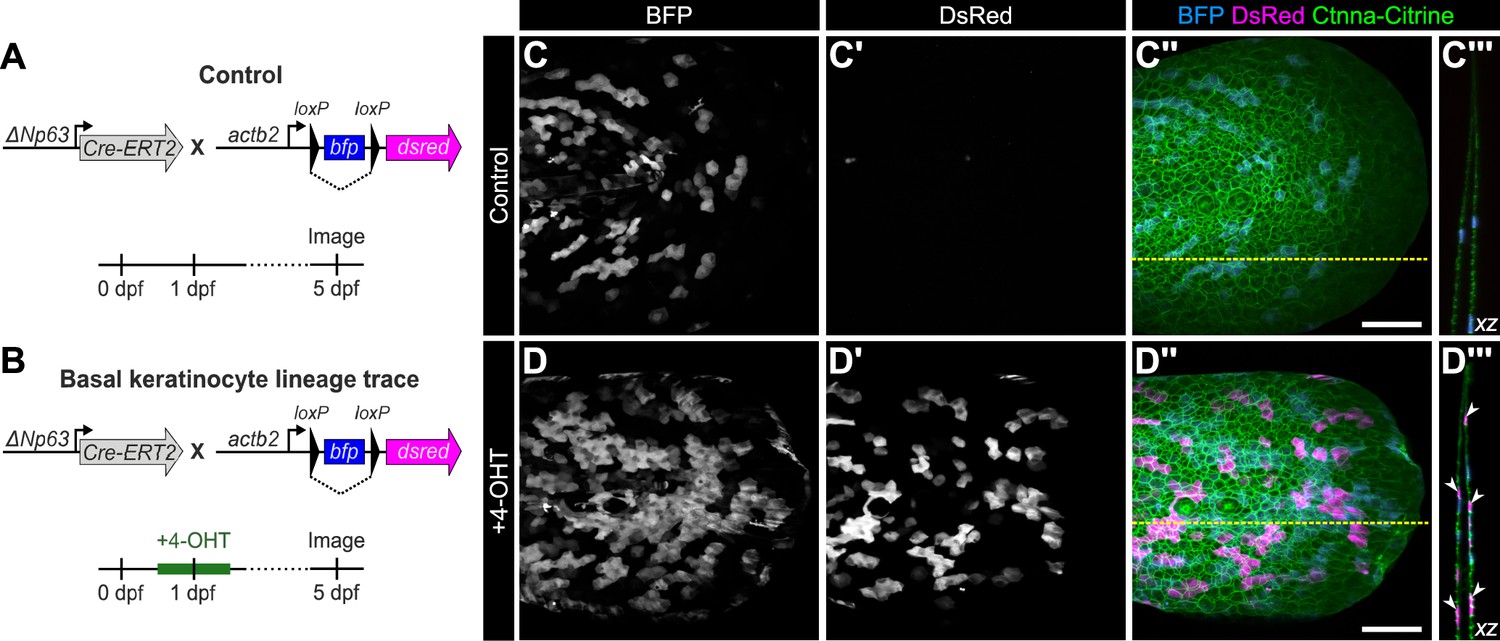
Validation of basal keratinocyte lineage tracing strategy.
(A, B) Schematics of the experimental design. (C-C’’, D-D’’) Lateral confocal micrographs of the caudal fin of TgBAC(ΔNp63:Cre-ERT2); Tg(actb2:LOXP-BFP-LOXP-DsRed) larvae treated as indicated. Gt(Ctnna-Citrine) labels keratinocyte plasma membranes. (C’’’, D’’’) Reconstructed cross sections along the dashed yellow line in C’’ or D’’. Arrowheads indicate examples of basal keratinocytes that have undergone Cre recombination as evidenced by DsRed expression. Scale bar: 100 μm.
Figure 5
Homeostatic replacement of Merkel cells (MCs) in the adult epidermis.
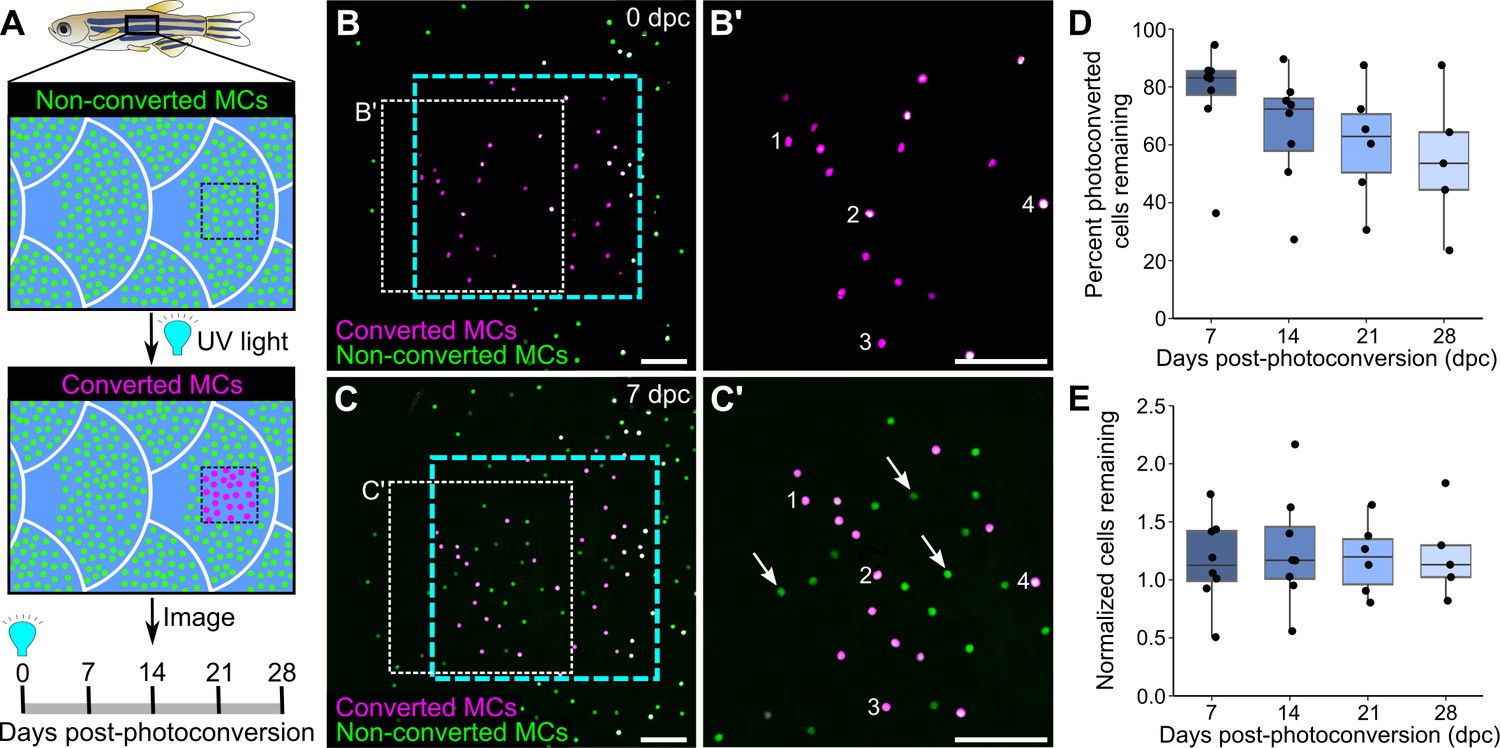
(A) Illustration of the photoconversion experiment showing the epidermis (blue), non-converted MCs (green), and converted MCs (magenta) after exposure of a region of the scale epidermis to UV light. (B and C) Representative images of MCs labeled by Tg(atoh1a:nls-Eos) at 0 (B) or 7 (C) days post-conversion (dpc) from a single adult. Cyan dotted box indicates the photoconverted region. White dotted box indicates the area magnified in B’ and C’. (B’ and C) Numbers label examples of individual cells present at 0 and 7 dpc. Arrows indicate examples of newly added cells, which appear green due to the presence of non-converted nls-Eos (green) and absence of converted nls-Eos (magenta). (D and E) Boxplots of the percentage of photoconverted MCs remaining compared to 0 dpc (D) and the total number of MCs (converted+non-converted) present at each day compared to 0 dpc (E). Each dot represents an individual fish. N=5–8 fish (24–32 mm standard length [SL]). Scale bars: 50 μm.
-
Figure 5—source data 1
Datasheet for Figure 5D and E.
- https://cdn.elifesciences.org/articles/85800/elife-85800-fig5-data1-v2.xlsx
Figure 6

Merkel cells (MCs) are widely distributed across the skin, in compartment-specific patterns.
(A) Illustration indicating the epidermal regions imaged in adult zebrafish. (B) Quantification of MC densities in the specified regions. Each dot represents an individual fish (N=8–18, 20–29.5 mm standard length [SL]). *** indicates p<0.001 using a one-way ANOVA (F=83.94; p<0.001) with post-hoc Tukey’s HSD test. (C–J) Lateral confocal micrographs of MCs in the different skin regions from animals expressing the indicated reporters. The regions imaged are indicated in A. Note that MCs expressing Tg(atoh1a:Lifeact-EGFP) have a similar morphology across skin compartments (G–J). nm, neuromasts of the posterior lateral line. Scale bars: 50 μm (C–F) and 10 μm (G–J).
-
Figure 6—source data 1
Datasheet for Figure 6B.
- https://cdn.elifesciences.org/articles/85800/elife-85800-fig6-data1-v2.xlsx
Figure 7 with 1 supplement

Merkel cells (MCs) develop concomitant with dermal appendage morphogenesis.
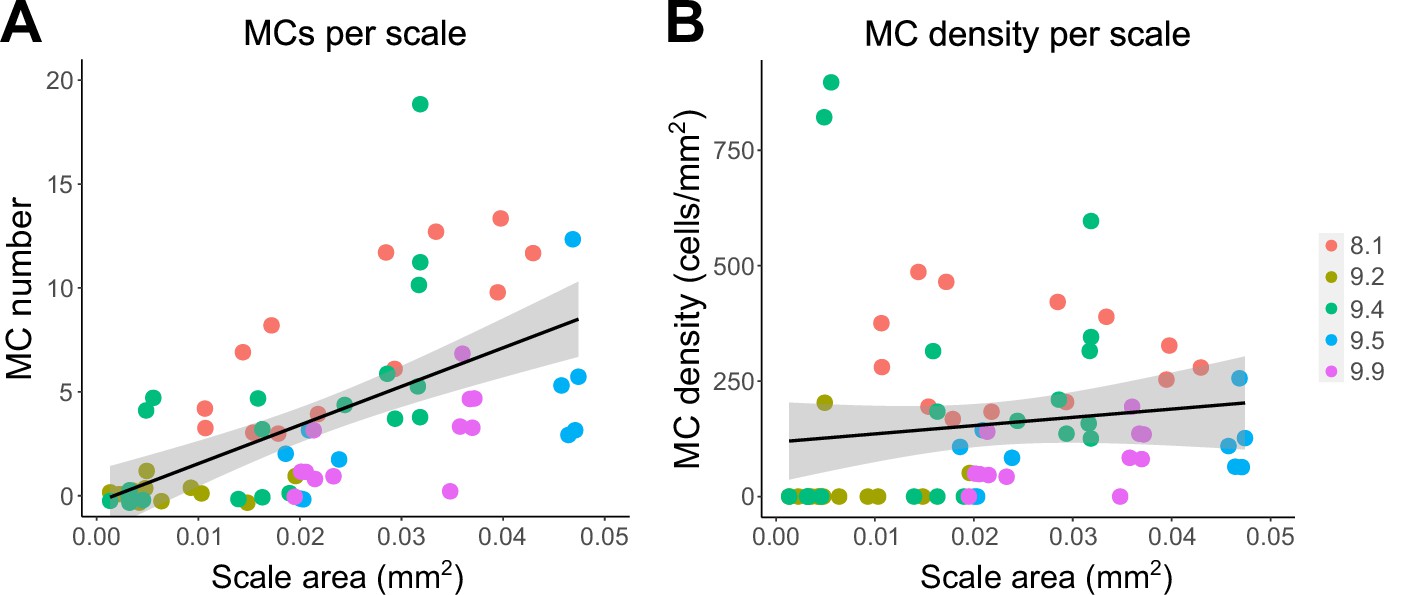
(A) Abbreviated zebrafish developmental timeline relative to standard length (SL) in millimeters. Developing scales are drawn in magenta below the approximate corresponding stage. (B–E) Representative lateral confocal micrographs of MCs and osteoblasts along the trunk at the indicated stages. Note that MCs increase in number and density as scale-forming osteoblasts develop below the epidermis. nm, neuromast of the posterior lateral line. (F) Quantification of MC density according to SL. Each dot represents an individual fish. Data represent n=81 scales from N=52 fish. Line indicates segmented linear regression (breakpoint = 8.27 mm SL). (G and H) Quantification of the number (G) or density (H) of MCs relative to scale area. Each dot represents an individual scale. Data represent n=62 scales from N=18 fish. Dot colors represent animal SL as indicated in the legend. Shading indicates a 95% CI around the linear regression lines in G and H. Correlation coefficients (R2): 0.08 (F, slope 1), 0.68 (F, slope 2), 0.73 (G), and 0.31 (H). F-statistics: 3.5 (F, slope 1), 83.9 (F, slope 2),164.6 (G), and 28.31 (H). p-values: 0.07 (F, slope 1), <0.05 (F, slope 2), and <0.05 (G and H). Scale bars: 50 μm.
-
Figure 7—source data 1
Datasheet for Figure 7F.
- https://cdn.elifesciences.org/articles/85800/elife-85800-fig7-data1-v2.xlsx
-
Figure 7—source data 2
Datasheet for Figure 7G and H.
- https://cdn.elifesciences.org/articles/85800/elife-85800-fig7-data2-v2.xlsx
Figure 7—figure supplement 1
MC number and density in relation to juvenile scale size.
(A, B) Quantification of the number (A) or density (B) of MCs relative to scale area in juveniles 8–10 mm SL. Each dot represents an individual scale. Data represent n=67 scales from N=5 fish. Dot colors represent animal SL as indicated in the legend. Shading indicates a 95% CI around the linear regression lines. Correlation coefficients (R2): 0.36 (A), 0.02 (B). F-statistics: 35.99 (A), 1.08 (B). p-values: <0.05 (A), 0.30 (B).
Figure 8 with 1 supplement
Loss of Eda signaling decreases Merkel cell (MC) density in trunk, but not facial skin.
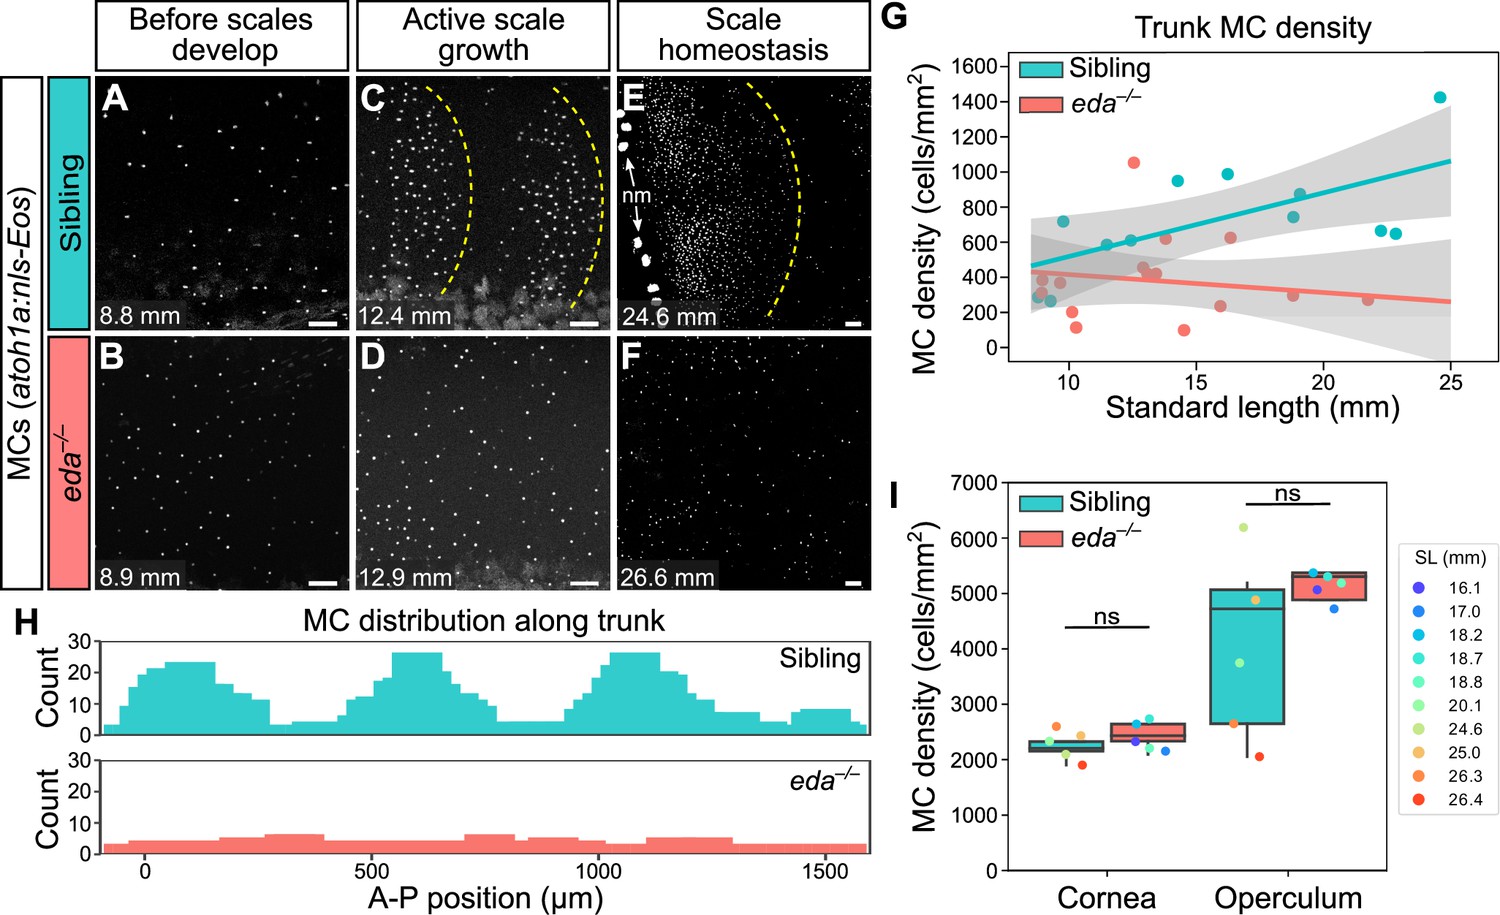
(A–F) Representative confocal images of MCs in the trunk of animals of the indicated genotypes at the indicated stages. Dotted yellow lines indicate posterior scale boundaries. nm, neuromasts of the posterior lateral line. (G) Quantification of MC density in the trunk skin relative to standard length (SL). Gray shading indicates a 95% CI around the linear regression lines. The difference between genotypes was significant above 12.5 mm SL (p<0.05, Johnson-Neyman Technique). Each dot represents an individual fish (N=16–18 fish/genotype). (H) Histograms of the distribution of trunk MCs along a rectangular segment encompassing three scales in a sibling and an identically sized region in an eda mutant (18–19 mm SL). (I) Boxplots of MC densities in the epidermis above the cornea or operculum in animals of the indicated genotypes. ns, not significant (cornea, p=0.21; operculum, p=0.14; Mann-Whitney test). Scale bars: 50 μm (A–F).
-
Figure 8—source data 1
Datasheet for Figure 8G.
- https://cdn.elifesciences.org/articles/85800/elife-85800-fig8-data1-v2.xlsx
-
Figure 8—source data 2
Datasheet for Figure 8I.
- https://cdn.elifesciences.org/articles/85800/elife-85800-fig8-data2-v2.xlsx
Figure 8—figure supplement 1
eda mutants exhibit significantly decreased MC addition.
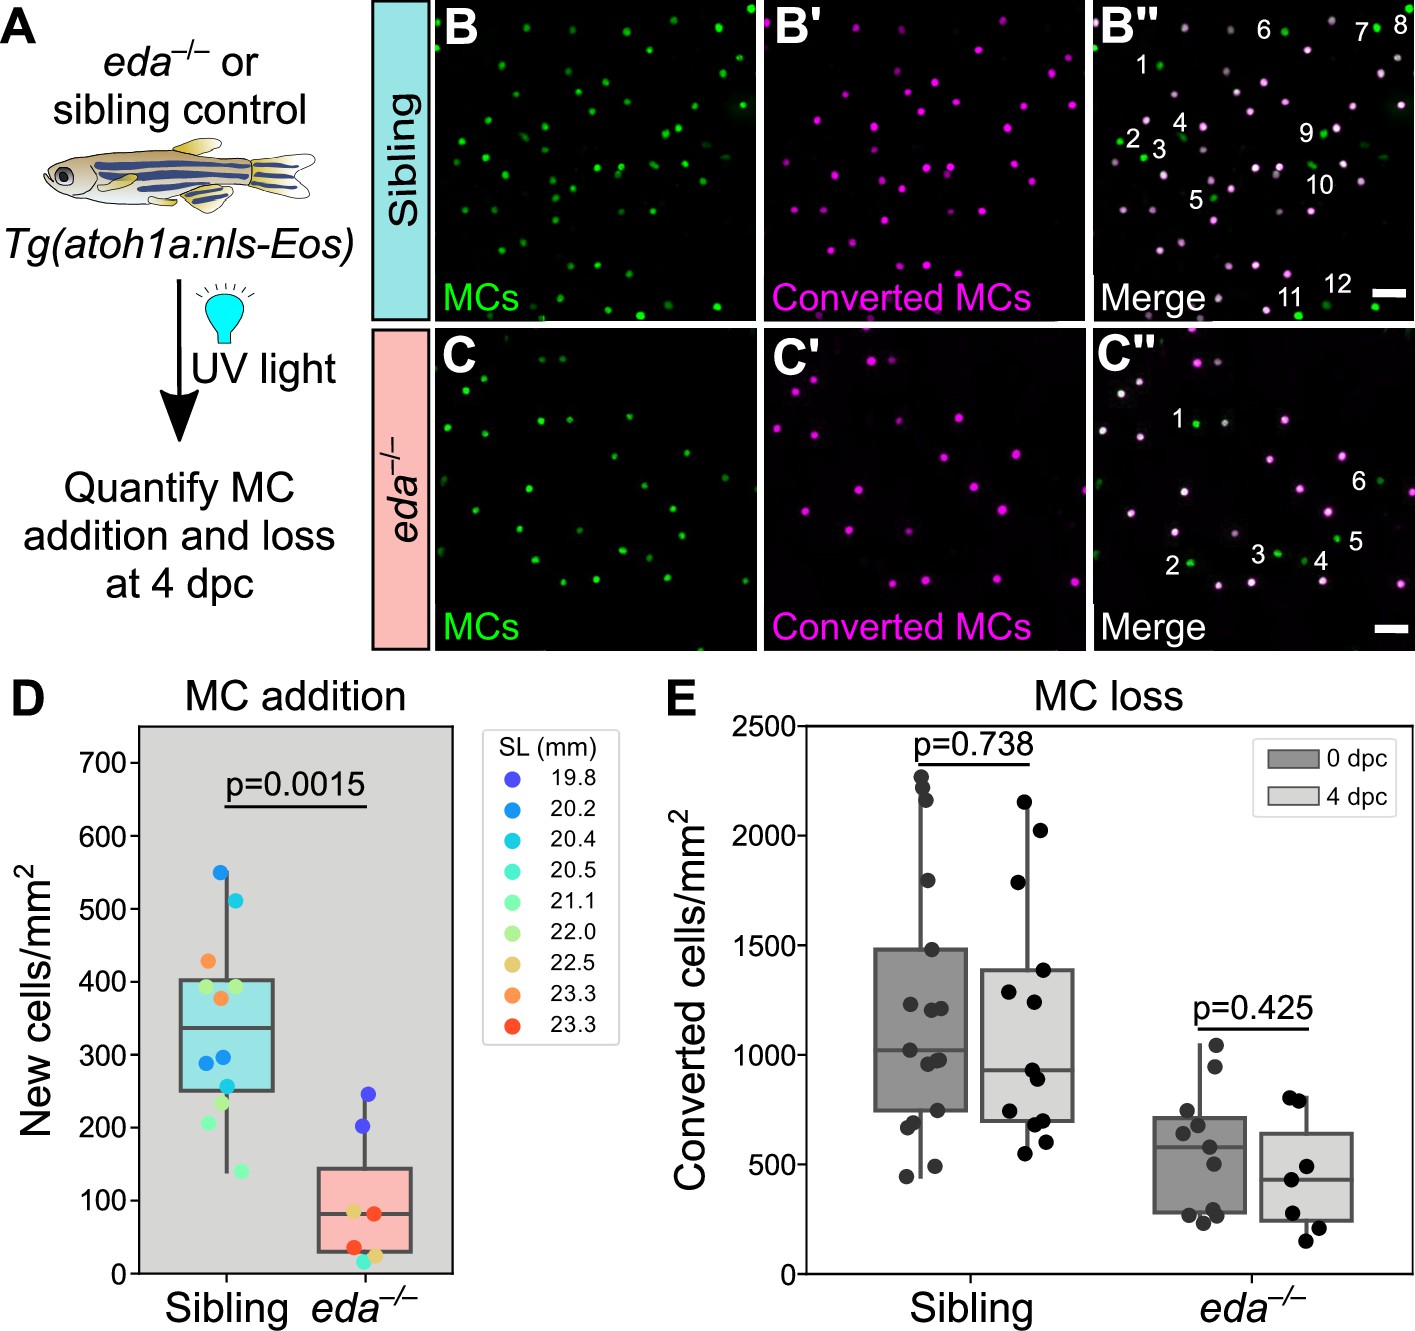
(A) Schematic of experimental approach. Following whole animal photoconversion, densities of converted and non-converted MCs were quantified at 4 dpc. (B-C’’) Representative lateral confocal micrographs of MCs at 4 dpc in adults of the indicated genotypes. Numbers label newly added cells, distinguishable by the absence of photoconverted nls-Eos (magenta). (D) Boxplots of MC addition at 4 dpc in the indicated genotypes. eda mutants show a significantly lower rate of MC cell addition (Mann-Whitney test). (E) Boxplots of photoconverted MC density in animals of the indicated genotypes at 0 and 4 dpc. p-values from a Mann-Whitney test are listed above the boxplots for each genotype. For D and E, 1–3 independent regions were analyzed from N=4–5 fish/genotype. Scale bars: 20 μm (B, C).
-
Figure 8—figure supplement 1—source data 1
Datasheet for Figure 8—figure supplement 1D and E.
- https://cdn.elifesciences.org/articles/85800/elife-85800-fig8-figsupp1-data1-v2.xlsx
Figure 9 with 1 supplement
Merkel cell (MC) patterning is not predetermined along the trunk.
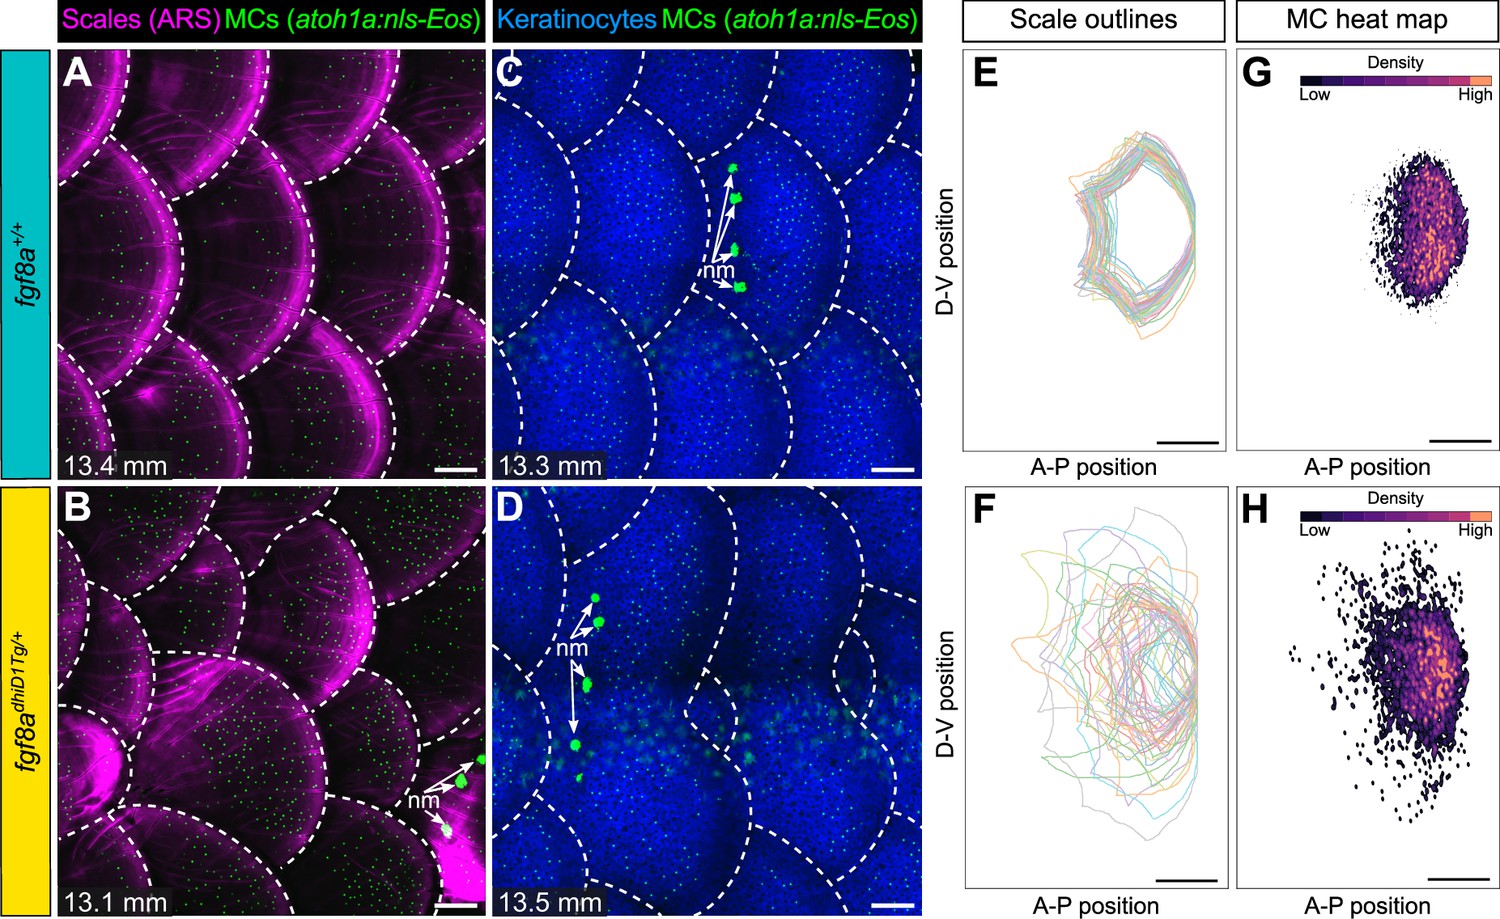
(A–D) Representative images of juvenile animals of the indicated genotypes expressing an MC reporter and stained with Alizarin Red S (ARS) to visualize scales (A and B) or co-expressing MC and keratinocyte (Tg(krt4:DsRed)) reporters (C and D). Dotted lines indicate scale boundaries. nm, neuromasts of the posterior lateral line. (E–H) Tracings of scale outlines (E and F) and density plots of MC position (G and H) from juvenile animals (n=43–49 scales/genotype from N=10–13 fish/genotype; 11.6–14.7 mm standard length [SL]) of the indicated genotypes. Scale tracings were aligned at the dorsal-ventral midpoint of the posterior scale margin. Note the variability in scale shape and size and corresponding increased spread of MC position in fgf8adhiD1Tg/+ juveniles compared to sibling controls. Scale bars: 100 μm (A–D) and 200 μm (E–H).
-
Figure 9—source data 1
Datasheet for Figure 9G, H, Figure 9—figure supplement 1E.
- https://cdn.elifesciences.org/articles/85800/elife-85800-fig9-data1-v2.xlsx
Figure 9—figure supplement 1
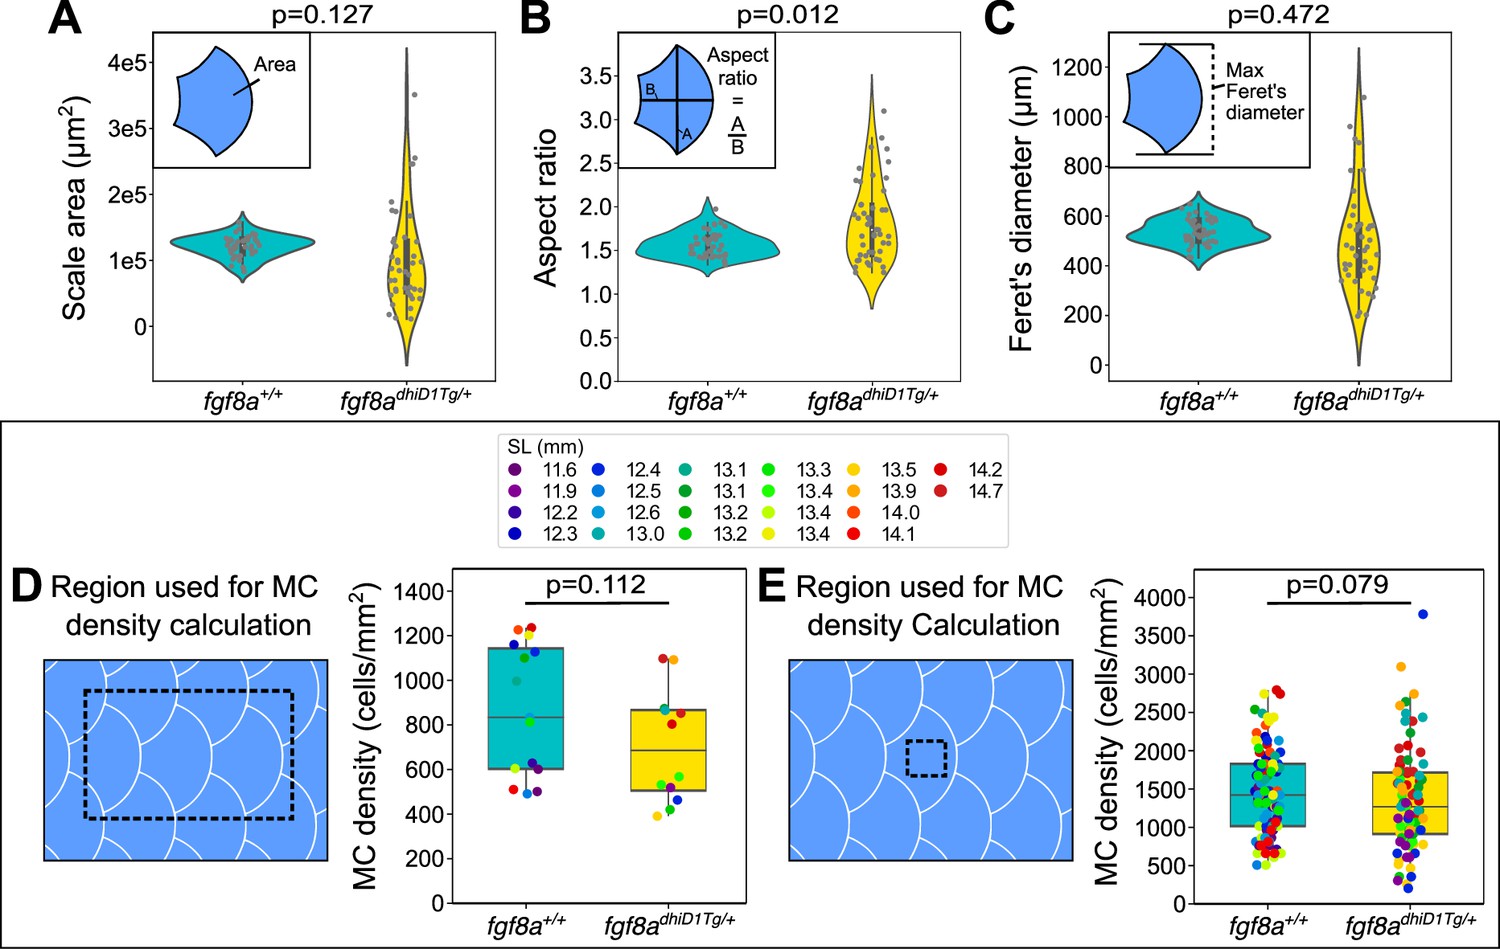
fgf8adhiD1Tg/+ juveniles show altered dermal appendage size and shape, but not MC density.
(A-C) Violin plots of scale area, aspect ratio, and Feret’s diameter from juveniles (11.6–14.7 mm SL) of the indicated genotypes. p-values (Mann-Whitney test), listed above each plot, indicate a significant difference between the genotypes for the scale aspect ratio, but not scale area or Feret’s diameter. Data represent n=42 scales from N=13 fish (fgf8a+/+) and n=32 scales from N=9 fish (fgf8adhiD1Tg/+). Gray dots are individual scales and inner plots are boxplots. Insets illustrate the various measurements. (D, E) Boxplots of MC density across the trunk epidermis (D) or the epidermis directly above individual scales (E) as indicated by the black dotted boxes in juveniles expressing a MC reporter (Tg(atoh1a:nls-Eos)). Dot colors represent animal SL as indicated in the legend. Total fish analyzed: fgf8a+/+ (N=13); fgf8adhiD1Tg/+ (N=9). p-values (Mann-Whitney test) are listed above each plot.
-
Figure 9—figure supplement 1—source data 1
Datasheet for Figure 9—figure supplement 1A–C.
- https://cdn.elifesciences.org/articles/85800/elife-85800-fig9-figsupp1-data1-v2.xlsx
-
Figure 9—figure supplement 1—source data 2
Datasheet for Figure 9—figure supplement 1D.
- https://cdn.elifesciences.org/articles/85800/elife-85800-fig9-figsupp1-data2-v2.xlsx
-
Figure 9—figure supplement 1—source data 3
Datasheet for Figure 9—figure supplement 1E.
- https://cdn.elifesciences.org/articles/85800/elife-85800-fig9-figsupp1-data3-v2.xlsx
Author response image 1

atoh1a+ cells in the adult oral epithelium.
(A,B) Low- (A) and high-magnification (B) confocal micrographs of oral roof palate epithelium in an adult expressing reporters for keratinocytes (Tg(krt4:DsRed)) and atoh1a-expressing cells (Tg(atoh1a:Lifeact-EGFP)). (B’) Reconstructed cross section along the yellow line in B showing two atoh1a+ cells in the upper strata of the oral epithelium. Scale bars: 50 µm (A) and 10 µm (B,B’).
Videos
Video 1
Three-dimensional (3D) reconstruction of somatosensory axon and MC interactions.
3D rotation of somatosensory axons (green) and photoconverted MCs (green and magenta) in the adult scale epidermis. Arrows indicate axonal varicosities in close proximity to MCs. Scale bar: 4 µm.
Tables
Key resources table
| Reagent type (species) or resource | Designation | Source or reference | Identifiers | Additional information |
|---|---|---|---|---|
| Antibody | Anti-Serotonin (rabbit polyclonal) | MilliporeSigma | Cat #: S5545, RRID:AB_477522 | (1:1000) |
| Antibody | Anti-Sv2 (mouse monoclonal) | DSHB; (Buckley and Kelly, 1985) | Cat #: SV2, RRID:AB_2315387 | (1:50) |
| Antibody | Anti-Sox2 (rabbit polyclonal) | GeneTex | Cat #: GTX124477, RRID:AB_11178063 | (1:500) |
| Antibody | Anti-Fluorescein Polyclonal Antibody, POD Conjugated (sheep polyclonal) | Roche | Cat #: 11426346910, RRID:AB_840257 | (1:2000) |
| Antibody | Anti-GFP (rabbit polyclonal) | Thermo Fisher Scientific | Cat #: A11122, RRID:AB_221569 | (1:1000) |
| Antibody | zn-12 (mouse monoclonal) | Zebrafish International Resource Center | Cat #: zn-12, RRID:AB_10013761 | (1:200) |
| Antibody | Anti-Rabbit Alexa Fluor 647 (goat polyclonal) | Thermo Fisher Scientific | Cat #: A32733, RRID:AB_2633282 | (1:500) |
| Antibody | Anti-Mouse Alexa Fluor 647 (goat polyclonal) | Thermo Fisher Scientific | Cat #: A32728, RRID:AB_2633277 | (1:500) |
| Antibody | Anti-Rabbit Alexa Fluor 568 (goat polyclonal) | Thermo Fisher Scientific | Cat #: A-11036, RRID:AB_10563566 | (1:500) |
| Antibody | Anti-Mouse Alexa Fluor 568 (goat polyclonal) | Thermo Fisher Scientific | Cat #: A-11031, RRID:AB_144696 | (1:500) |
| Antibody | Anti-Rabbit Alexa Fluor 488 (goat polyclonal) | Thermo Fisher Scientific | Cat #: A32731, RRID:AB_2633280 | (1:500) |
| Commercial assay and kit | TSA Plus Cyanine 5 | Akoya Biosciences | Cat #: NEL705A001KT | (1:50) |
| Sequence-based reagent | piezo2 in situ probe (originally referred to as piezo2b) | Faucherre et al., 2013 | N/A | |
| Sequence-based reagent | atoh1a gRNA, 5’-GGA GAC TGA ATA AAG TTA TG-3’ | Pickett et al., 2018 | N/A | |
| Sequence-based reagent | Mbait gRNA, 5’-GGC TGC TGC GGT TCC AGA GGT GG-3’ | Kimura et al., 2014 | N/A | |
| Sequence-based reagent | Zebrafish piezo2 HCR v3.0 probe | Molecular Instruments | N/A | Used at 2 pmol |
| Chemical compound and drug | MS-222 | MilliporeSigma | Cat #: E10521 | |
| Chemical compound and drug | (Z)–4-Hydroxytamoxifen (4-OHT) | MilliporeSigma | Cat #: H7904 | Used at 10 μM |
| Strain and strain background (Danio rerio) | AB (Wild-Type) | Zebrafish International Resource Center | ZIRC Cat# ZL1, RRID:ZIRC_ZL1 | |
| Genetic reagent (Danio rerio) | Tg(actb2:LOXP-BFP-LOXP-DsRed) | Kobayashi et al., 2014 | Tg(actb2:LOXP-BFP-LOXP-DsRed)sd27Tg, ZFIN: ZDB-TGCONSTRCT-141111–5 | |
| Genetic reagent (Danio rerio) | Tg(atoh1a:nls-Eos) | Pickett et al., 2018 | Tg(atoh1a:nls-Eos)w214Tg, ZFIN: ZDB-TGCONSTRCT-190701–2 | |
| Genetic reagent (Danio rerio) | Tg(atoh1a:lifeact-EGFP) | This study | Tg(atoh1a:lifeact-EGFP)w259Tg | |
| Genetic reagent (Danio rerio) | TgBAC(ΔNp63:Cre-ERT2) | This study | TgBAC(ΔNp63:Cre-ERT2)w267Tg | |
| Genetic reagent (Danio rerio) | Tg(sox10:Cre) | Kague et al., 2012 | Tg(Mmu.Sox10-Mmu.Fos:Cre)zf384, ZFIN: ZDB-TGCONSTRCT-130614–2 | |
| Genetic reagent (Danio rerio) | Gt(ctnna-citrine) | Trinh et al., 2011 | Gt(ctnna-citrine)ct3aGt, ZFIN: ZDB-ALT-111010–23 | |
| Genetic reagent (Danio rerio) | Tg(sp7:mCherry) | Singh et al., 2012 | Tg(Ola.Sp7:mCherry-Eco.NfsB)pd46Tg, ZFIN: ZDB-TGCONSTRCT-120503–4 | |
| Genetic reagent (Danio rerio) | Tg(p2rx3a>mCherry) | Palanca et al., 2013 | Tg(Tru.P2rx3a:LEXA-VP16,4xLEXOP-mCherry)la207Tg, ZFIN: ZDB-TGCONSTRCT-130307–1 | |
| Genetic reagent (Danio rerio) | Tg(trpa1b:EGFP) | Pan et al., 2012 | TgBAC(trpa1b:EGFP)a129Tg, ZFIN: ZDB-TGCONSTRCT-120208–2 | |
| Genetic reagent (Danio rerio) | Tg(p2rx3b:EGFP) | Kucenas et al., 2006 | Tg(p2rx3b:EGFP)sl1Tg, ZFIN: ZDB-TGCONSTRCT-070117–110 | |
| Genetic reagent (Danio rerio) | Tg(krt4:DsRed) | Rieger and Sagasti, 2011 | Tg(krt4:DsRed)la203Tg, ZFIN: ZDB-TGCONSTRCT-120127–5 | |
| Genetic reagent (Danio rerio) | edadt1261 | Harris et al., 2008 | edadt1261, ZFIN: ZDB-ALT-090324–1 | |
| Genetic reagent (Danio rerio) | fgf8adhiD1Tg/+ | Amsterdam et al., 2009 | fgf8adhiD1Tg/+, ZFIN: ZDB-ALT-010427–4 | |
| Software and algorithm | FIJI | http://fiji.sc | RRID:SCR_002285 | |
| Software and algorithm | Imaris | Bitplane | RRID:SCR_007370 | |
| Other | Fetal bovine serum | Gibco | Cat #: 10082–139 | |
| Other | Normal goat serum | Abcam | Cat #: ab7481, RRID:AB_2716553 | |
| Other | DAPI | MilliporeSigma | Cat #: 508741 | Used at 5 ng/μl |
| Other | AM1-43 | Biotinium | Cat #: 70024 | Used at 15 μm |
| Other | Alizarin Red S | ACROS Organics | Cat #: 400480250 | Used at 0.01% |
| Other | Proteinase K | Thermo Fisher Scientific | Cat #: 100005393 | Used at 0.1 mg/ml |
| Other | Hoechst 3342 | Thermo Fisher Scientific | Cat #: H3570 | Used at 5 ng/μl |
Additional files
Download links
A two-part list of links to download the article, or parts of the article, in various formats.
Downloads (link to download the article as PDF)
Open citations (links to open the citations from this article in various online reference manager services)
Cite this article (links to download the citations from this article in formats compatible with various reference manager tools)
Dermal appendage-dependent patterning of zebrafish atoh1a+ Merkel cells
eLife 12:e85800.
https://doi.org/10.7554/eLife.85800


