Global diversity and antimicrobial resistance of typhoid fever pathogens: Insights from a meta-analysis of 13,000 Salmonella Typhi genomes
- Cambridge Institute of Therapeutic Immunology and Infectious Disease (CITIID), University of Cambridge School of Clinical Medicine, Cambridge Biomedical Campus, United Kingdom
- Department of Infection Biology, Faculty of Infectious and Tropical Diseases, London School of Hygiene & Tropical Medicine, United Kingdom
- IAVI, Chelsea & Westminster Hospital, United Kingdom
- Department of Infectious Diseases, Central Clinical School, Monash University, Australia
- Wellcome Sanger Institute, Wellcome Genome Campus, United Kingdom
- Department of Microbiology and Immunology at the Peter Doherty Institute for Infection and Immunity, The University of Melbourne, Australia
- National Institute of Health, Pakistan
- Nigeria Field Epidemiology and Laboratory Training Programme, Nigeria
- College of Veterinary Medicine, North Carolina State University, United States
- United Kingdom Health Security Agency, United Kingdom
- National University Hospital, Singapore
- Centre for International Health, University of Otago, New Zealand
- Department of Clinical Sciences, Liverpool School of Tropical Medicine, United Kingdom
- Malawi-Liverpool Wellcome Programme, Kamuzu University of Health Sciences, Malawi
- Centre for Pathogen Genomics, Department of Microbiology and Immunology, University of Melbourne at Doherty Institute for Infection and Immunity, Australia
- Microbiological Diagnostic Unit Public Health Laboratory, The University of Melbourne at the Peter Doherty Institute for Infection and Immunity, Australia
- Independent consultant, South Africa
- University of Antwerp, Belgium
- Centers for Disease Control and Prevention, United States
- Global Health Research Unit (GHRU) for the Genomic Surveillance of Antimicrobial Resistance, Faculty of Pharmacy, University of Ibadan, Nigeria
- Lady Willingdon Hospital, India
- Department of Clinical Microbiology, Christian Medical College, India
- Division of Infectious Diseases and Geographic Medicine, Stanford University, United States
- Malawi-Liverpool Wellcome Programme, Malawi
- Institute of Infection, Veterinary and Ecological Sciences, University of Liverpool, United Kingdom
- Oxford University Clinical Research Unit Nepal, Nepal
- KEM Hospital Research Centre, India
- Department of Medicine, Division of Infectious Diseases, University of Toronto, Canada
- International Vaccine Institute, Republic of Korea
- International Centre for Diarrhoeal Disease Research, Bangladesh
- UCLA Fielding School of Public Health, United States
- Korea University, Republic of Korea
- Topiwala National Medical College, India
- ESR, Institute of Environmental Science and Research Ltd., Porirua, New Zealand
- Grupo de Microbiologia, Instituto Nacional de Salud, Colombia
- Centre for Tropical Medicine and Global Health, Nuffield Department of Medicine, University of Oxford, United Kingdom
- Mahidol Oxford Tropical Medicine Research Unit, Mahidol University, Thailand
- ICMR - National Institute of Cholera & Enteric Diseases, India
- Department of Medical Microbiology, Faculty of Health Sciences, University of Pretoria, South Africa
- Department of Medical Microbiology, Tshwane Academic Division, National Health Laboratory Service, South Africa
- Sabin Vaccine Institute, United States
- Federation University Australia, Australia
- Papua New Guinea Institute of Medical Research, Papua New Guinea
- Post Graduate Institute of Medical Education and Research, India
- Technical University of Denmark, Denmark
- Research Department of Infection, Division of Infection and Immunity, University College London, United Kingdom
- Child Health Research Foundation, Bangladesh
- Bacteriologia, Subdepartamento de Enfermedades Infecciosas, Departamento de Laboratorio Biomedico, Instituto de Salud Publica de Chile (ISP), Chile
- Department of Pediatrics and Child Health, Aga Khan University, Pakistan
- Rural Development Trust Hospital, India
- Department of Community Health, Christian Medical College, India
- Medical Research Council Unit The Gambia at London School Hygiene & Tropical Medicine, Gambia
- All India Institute of Medical Sciences, India
- Centre for Microbiology Research, Kenya Medical Research Institute, Kenya
- Quadram Institute Bioscience, United Kingdom
- Makunda Christian Hospital, India
- Center for Vaccine Development and Global Health (CVD), University of Maryland School of Medicine, Baltimore, Maryland, USA, United States
- Central Research Laboratory, Kempegowda Institute of Medical Sciences, India
- National Microbiology Reference Laboratory, Zimbabwe
- World Health Organization, Zimbabwe
- Kamuzu University of Health Sciences, Malawi
- Saint Johns Medical College and Hospital, India
- Ministry of Health, Government of Samoa, Samoa
- Institut Pasteur, Université Paris Cité, France
- Kanchi Kamakoti CHILDS Trust Hospital, India
- Oxford Vaccine Group, Department of Paediatrics, University of Oxford, United Kingdom
- The NIHR Oxford Biomedical Research Centre, United Kingdom
- Department of Microbiology and Immunology, University of Maryland School of Medicine, United States
- Institute for Genome Sciences, University of Maryland School of Medicine, United States
- Murdoch Children’s Research Institute, Royal Children’s Hospital, Australia
- Centre for Health Research and Development, Society for Applied Studies, India
- University of Rwanda, College of Science and Technology, Rwanda
- Chacha Nehru Bal Chikitsalaya, India
- Institute of Biodiversity, Animal Health and Comparative Medicine, University of Glasgow, United Kingdom
- Dhulikhel Hospital, Nepal
- Institute for Research in Science and Technology, Nepal
- Kasturba Hospital for Infectious Diseases, India
- Center for Infectious Disease Research & Surveillance, Dhulikhel Hospital, Kathmandu University Hospital, Nepal
- Research Institute for Tropical Medicine, Department of Health, Philippines
- Chinchpada Christian Hospital, India
- Centre for Enteric Diseases, National Institute for Communicable Diseases, South Africa
- Christian Medical College, Ludhiana, India
- Duncan Hospital, India
- University of California Davis, United States
- Centre for Genomic Pathogen Surveillance, Big Data Institute, University of Oxford, United Kingdom
Figures
Figure 1 with 4 supplements
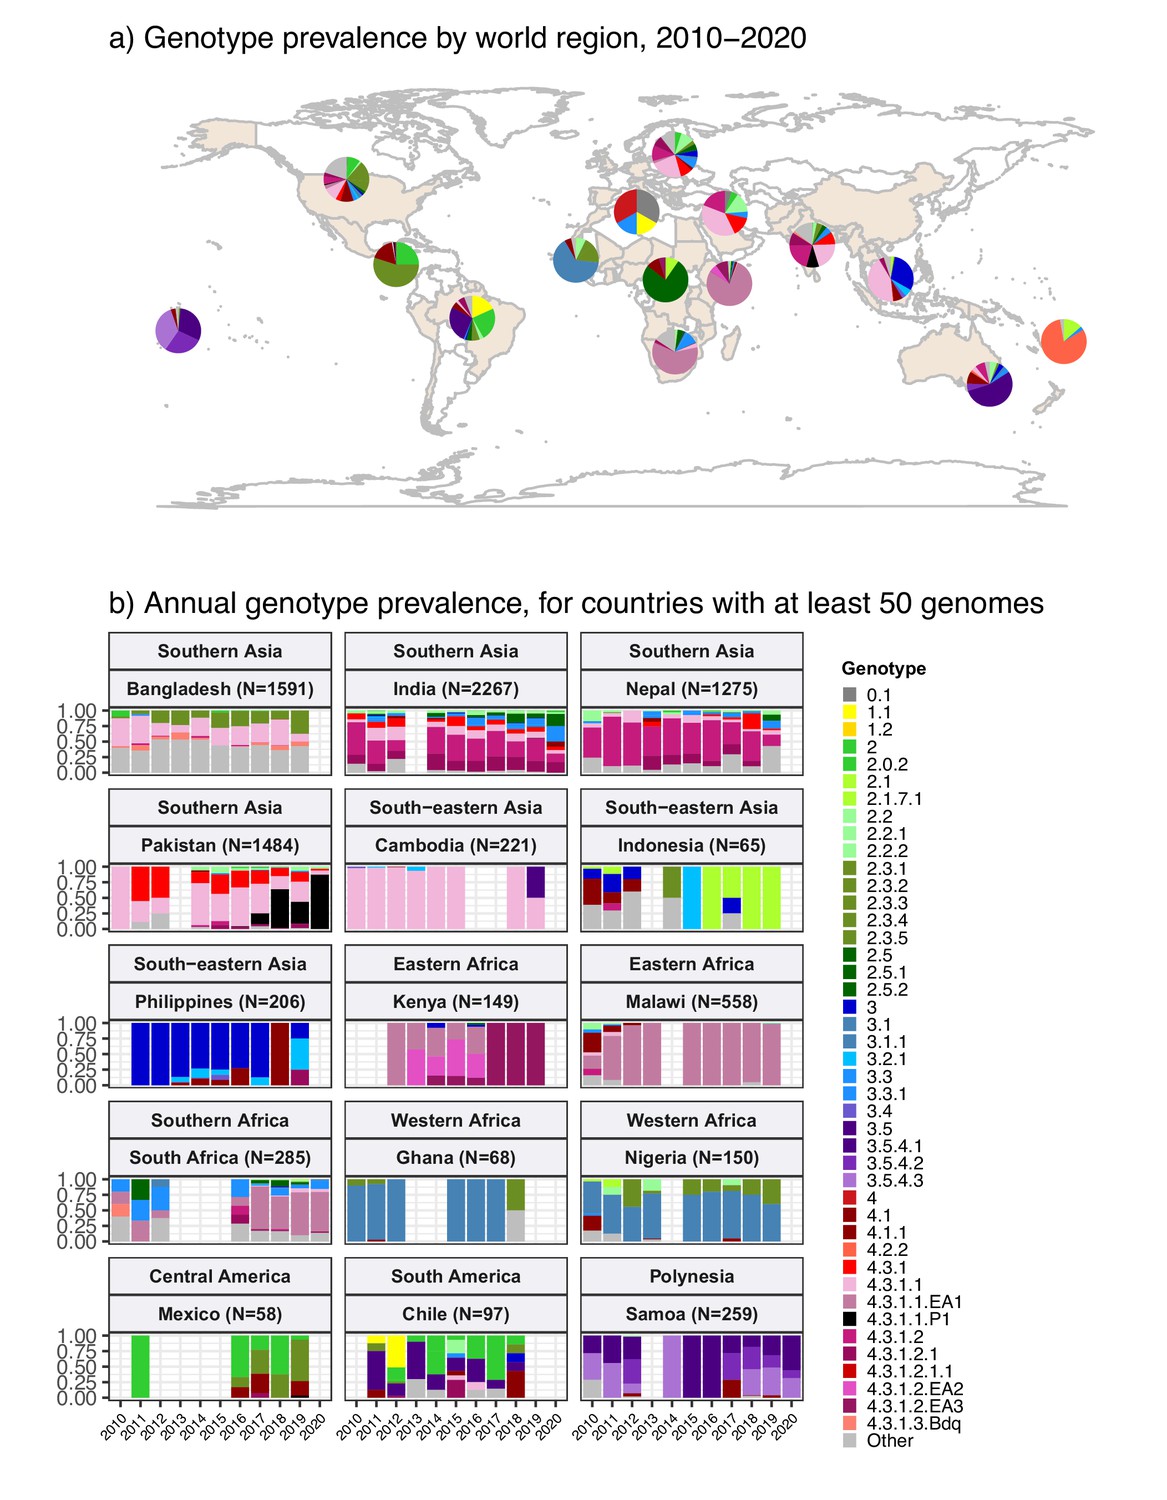
Global genotype prevalence estimates.
Based on assumed acute cases isolated from untargeted sampling frames from 2010 onwards, with known country of origin (total N=9478 genomes). (a) Genotype prevalence by world region, 2010–2020. Countries contributing data are shaded in beige, and are grouped by regions as defined by the UN statistics division. (b) Annual genotype prevalence for countries with ≥50 genomes where typhoid is endemic. In both plots, colours indicate prevalence of Typhi genotypes, as per inset legend. Genotypes not exceeding 20% frequency in at least one country are aggregated as ‘other’. Full data on regional and national genotype prevalences, including raw counts, proportions, and 95% confidence intervals, are given in Supplementary files 5 and 6, respectively.
Figure 1—figure supplement 1
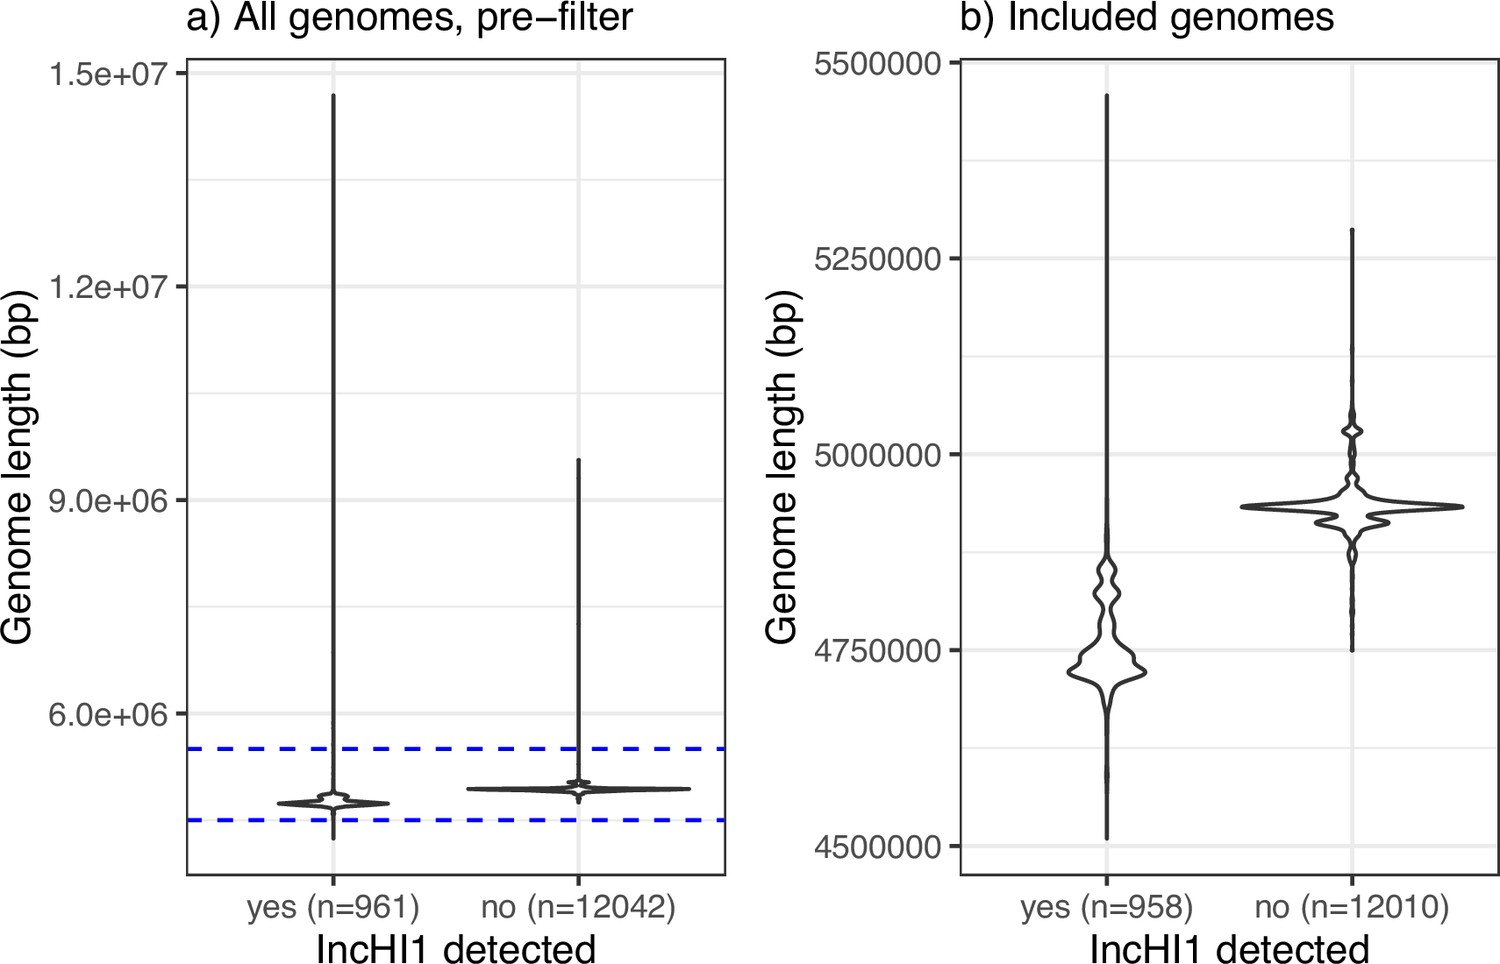
Genome size pre- and post-filtering, stratified by detection of an IncHI1 plasmid replicon marker.
(a) All assemblies examined (n=13,000). (b) Assemblies of genomes included in the analysis (n=12,965), inclusion criterion being size between 4.5 and 5.5 Mbp.
Figure 1—figure supplement 2
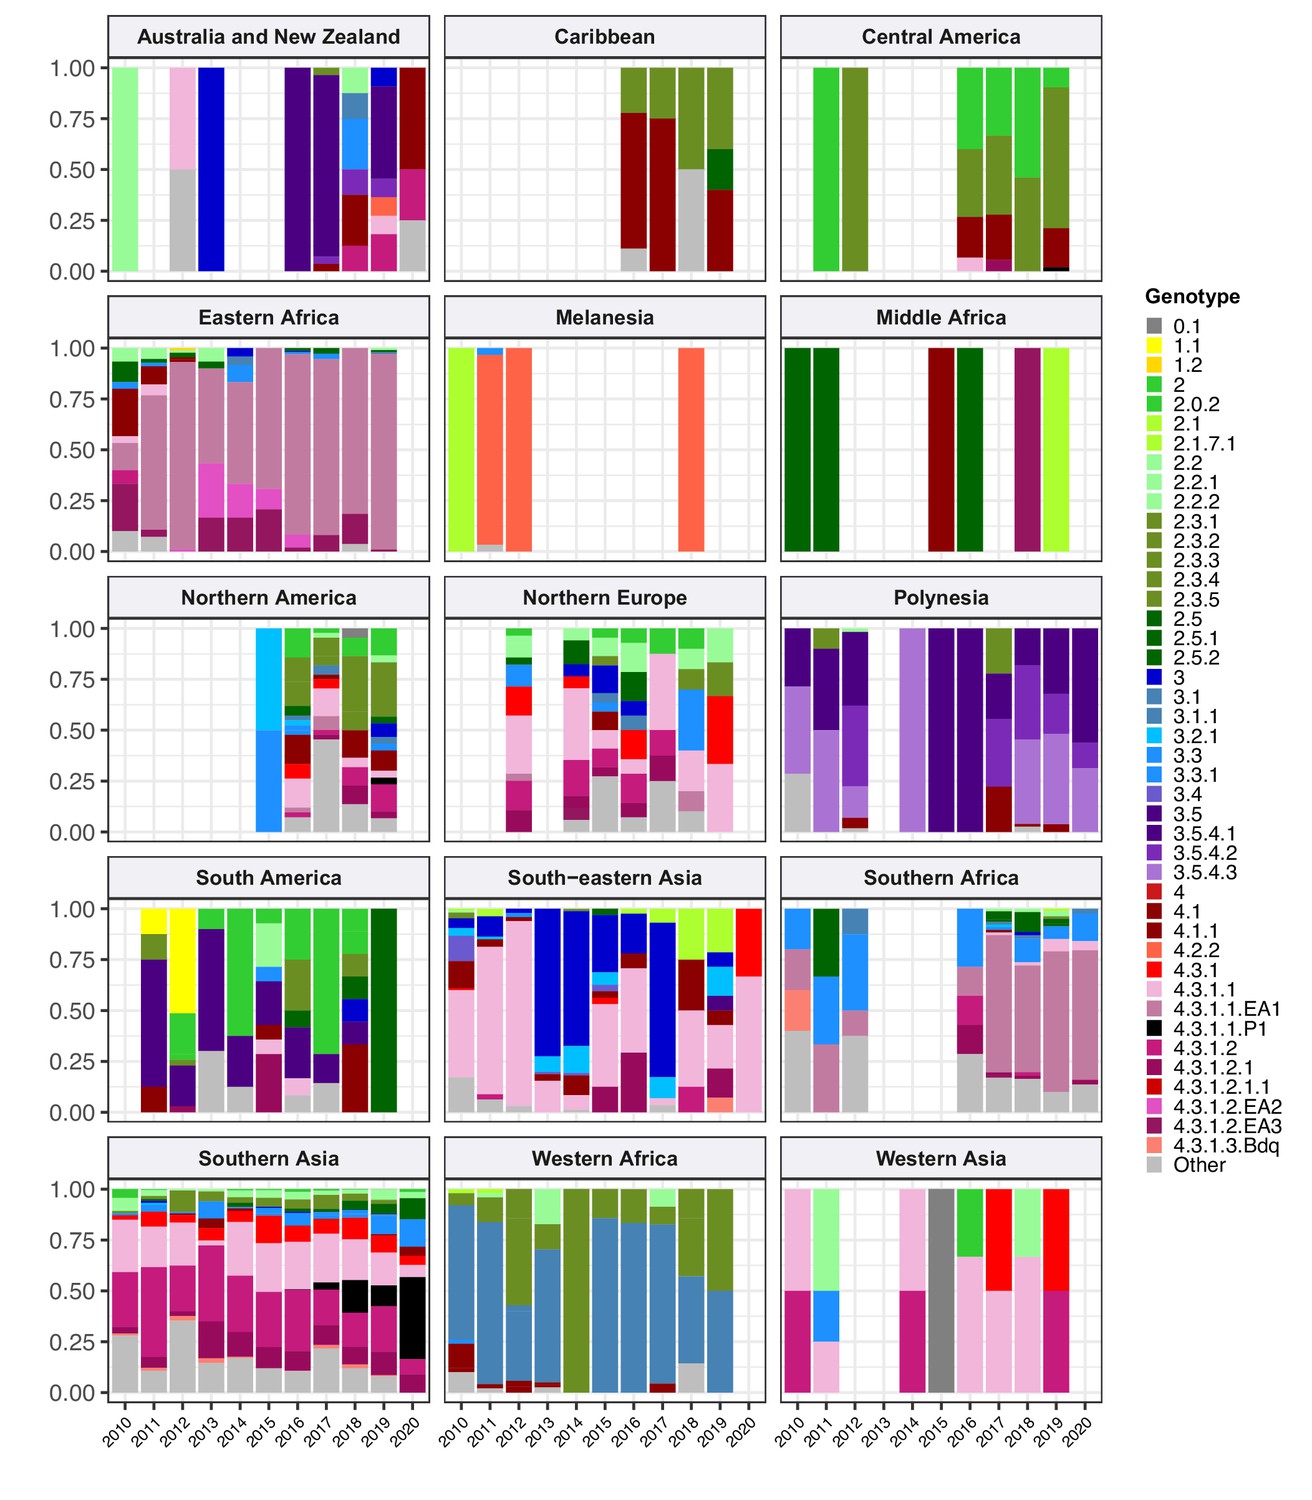
Annual breakdown of genotypes per world region, 2010–2020, for regions with ≥20 representative genomes.
Bars show genotype prevalence rates observed per annum, coloured as per inset legend. Genotypes present at ≥20% frequency in any country are indicated separately, rare genotypes are aggregated as ‘other’. Full data, including raw counts, proportions, and 95% confidence intervals, are available in Supplementary file 5.
Figure 1—figure supplement 3
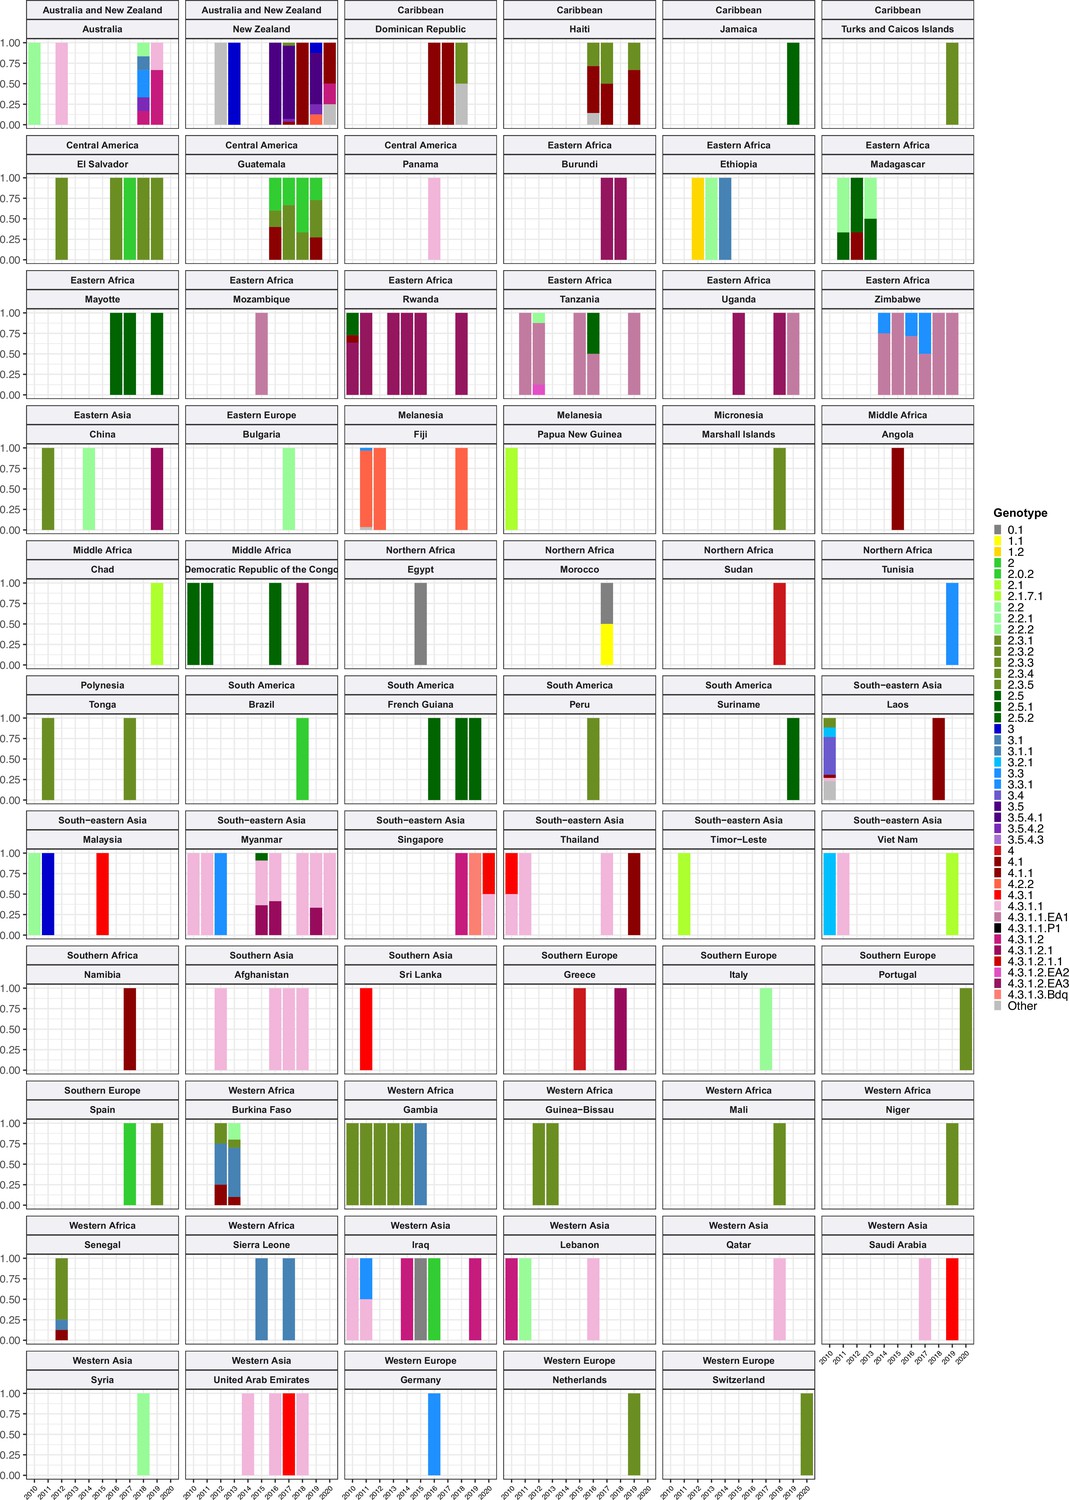
Annual breakdown of genotypes per country, for countries with <50 representative genomes between 2010 and 2020.
(Note plots for countries with ≥50 genomes are shown in Figure 1b, full data including raw counts, proportions, and 95% confidence intervals, are in Supplementary file 6). Bars show genotype prevalence rates observed per annum, coloured as per inset legend. Genotypes present at ≥20% frequency in any country are indicated separately, rare genotypes are aggregated as ‘other’.
Figure 1—figure supplement 4
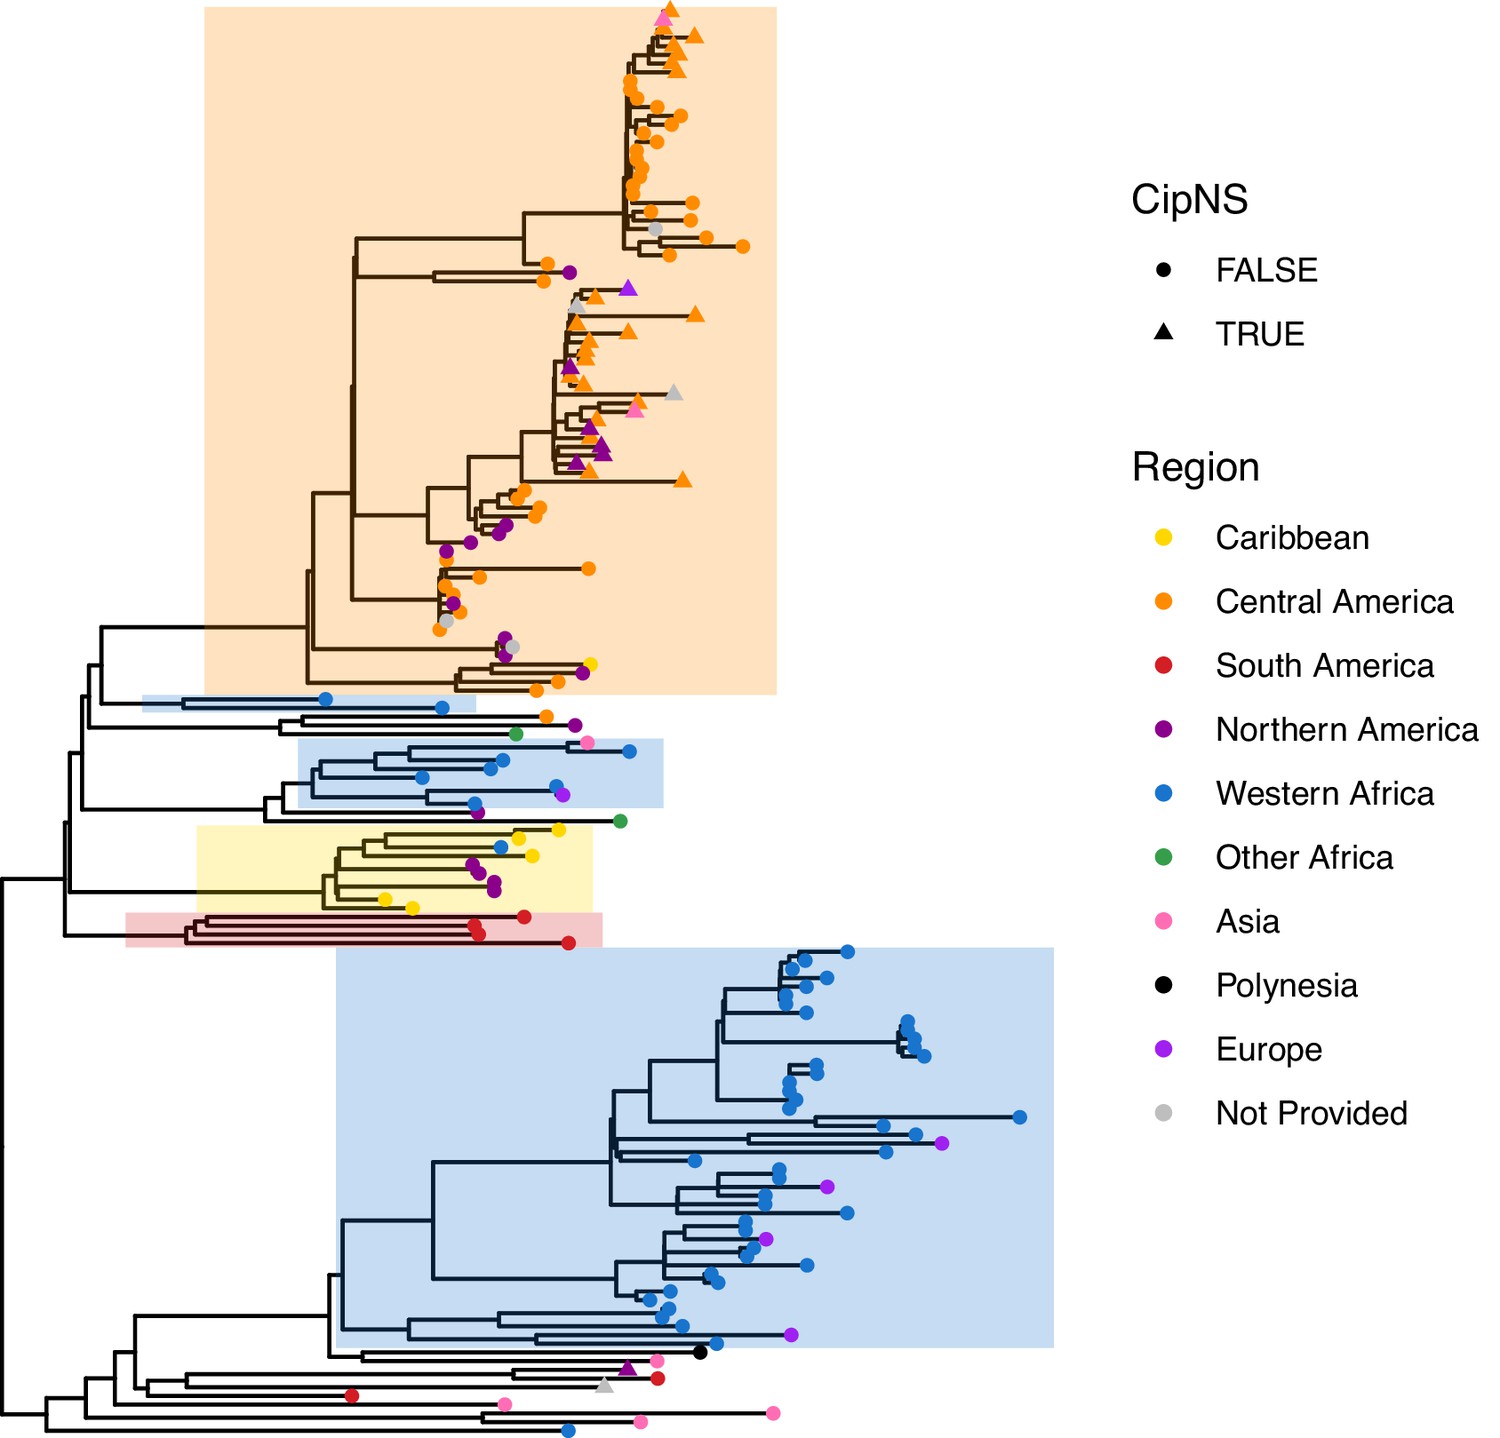
Phylogenetic tree showing relationships amongst genotype 2.3.2 genomes.
The tree is a core-genome distance-based neighbour-joining tree generated from assemblies using Pathogenwatch, including n=164 genotype 2.3.2 genomes, outgroup rooted using a diverse set of genomes from Ingle et al., 2021 (n=115 genomes from 16 genotypes). Tips are coloured by world region, according to inset legend; triangles indicate genomes harbouring QRDR mutations resulting in predicted non-susceptibility to ciprofloxacin (CipNS). Clades representing putative local clonal expansions are shaded.
Figure 2 with 5 supplements
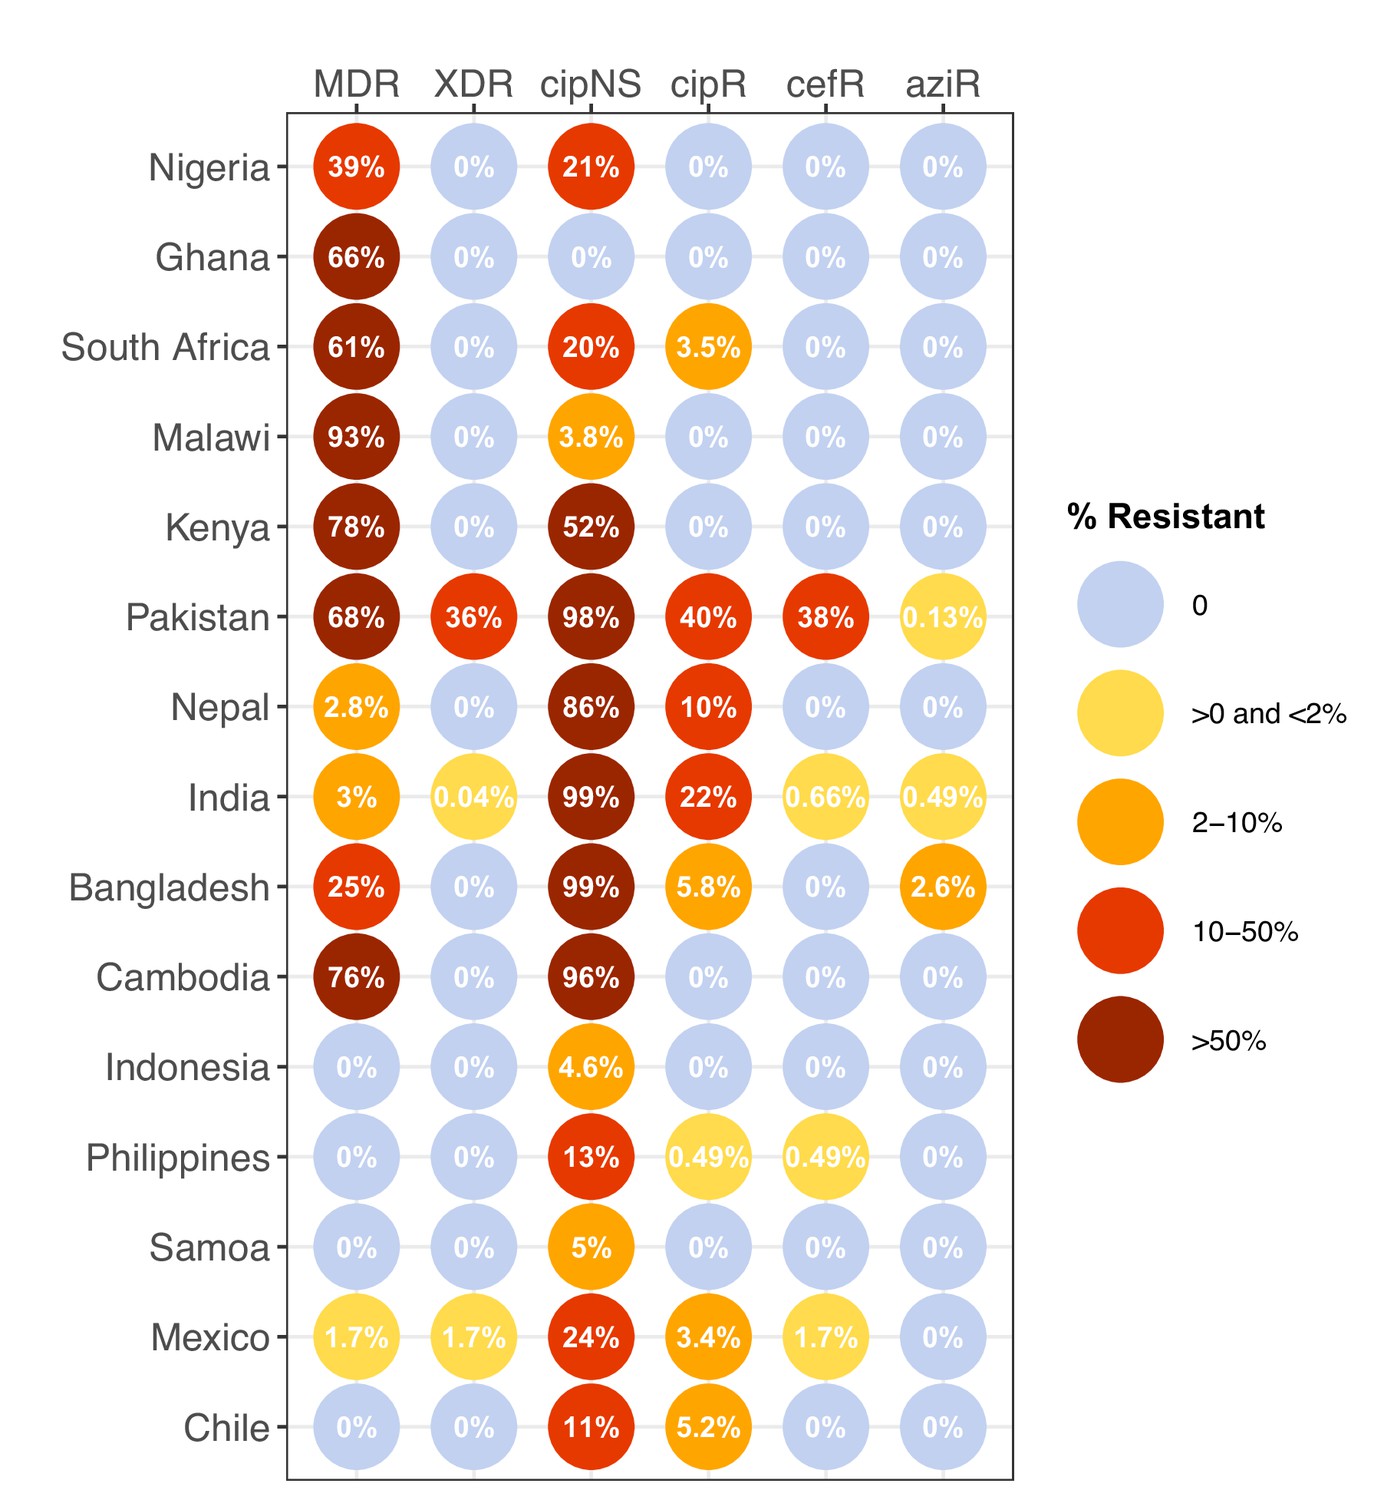
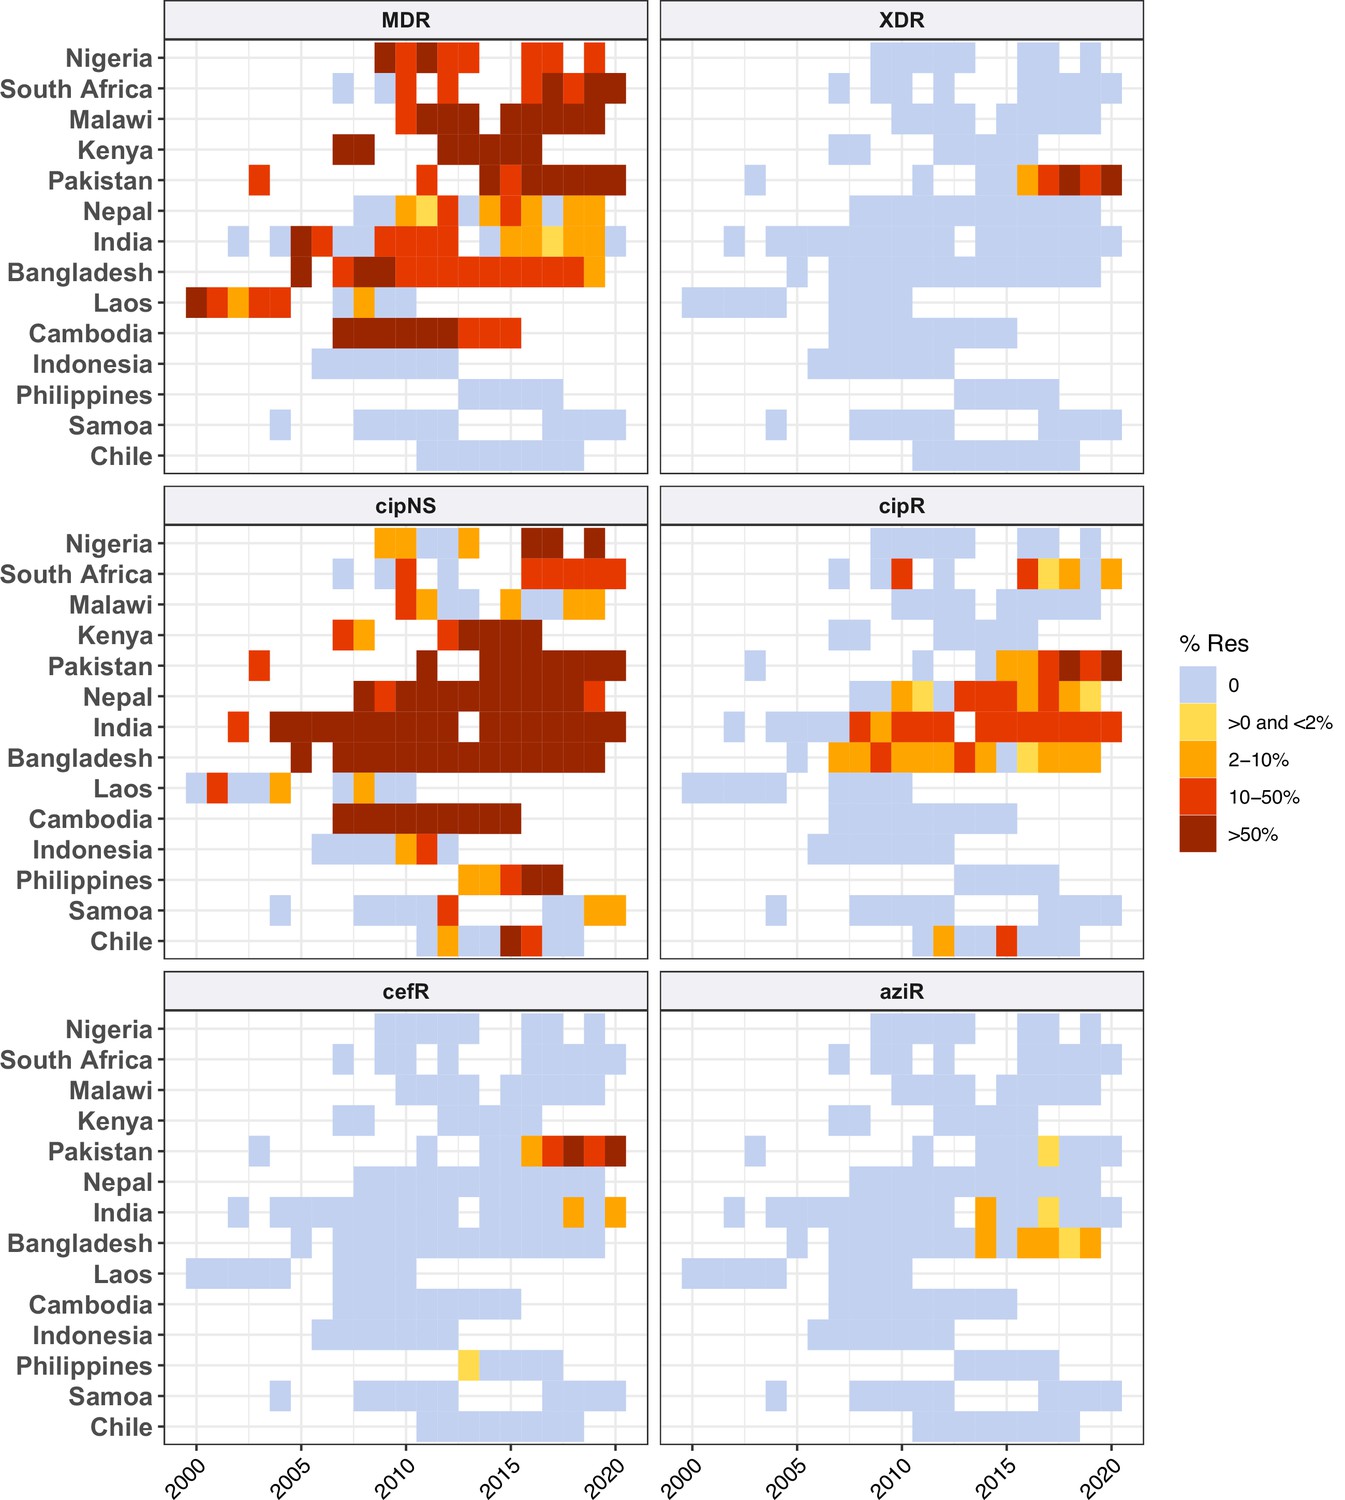
Prevalence of key antimicrobial resistance (AMR) genotype profiles by country.
For all countries with ≥50 representative genomes (untargeted, assumed acute cases) from 2010 to 2020, where typhoid is endemic. Percentage resistance values are printed for each country/drug combination, and are coloured by categorical ranges to reflect escalating levels of concern for empirical antimicrobial use: (i) 0: no resistance detected; (ii) >0 and ≤2%: resistance present but rare; (iii) 2–10%: emerging resistance; (iv) 10–50%: resistance common; (v) >50%: established resistance. Annual rates underlying these summary rates are shown in Figure 3 and Supplementary file 8. Full data including counts and confidence intervals are included in Supplementary file 8. MDR, multidrug resistant; XDR, extensively drug resistant; CipNS, ciprofloxacin non-susceptible; CipR, ciprofloxacin resistant; CefR, ceftriaxone resistant; AziR, azithromycin resistant. Countries are grouped by geographical region.
Figure 2—figure supplement 1
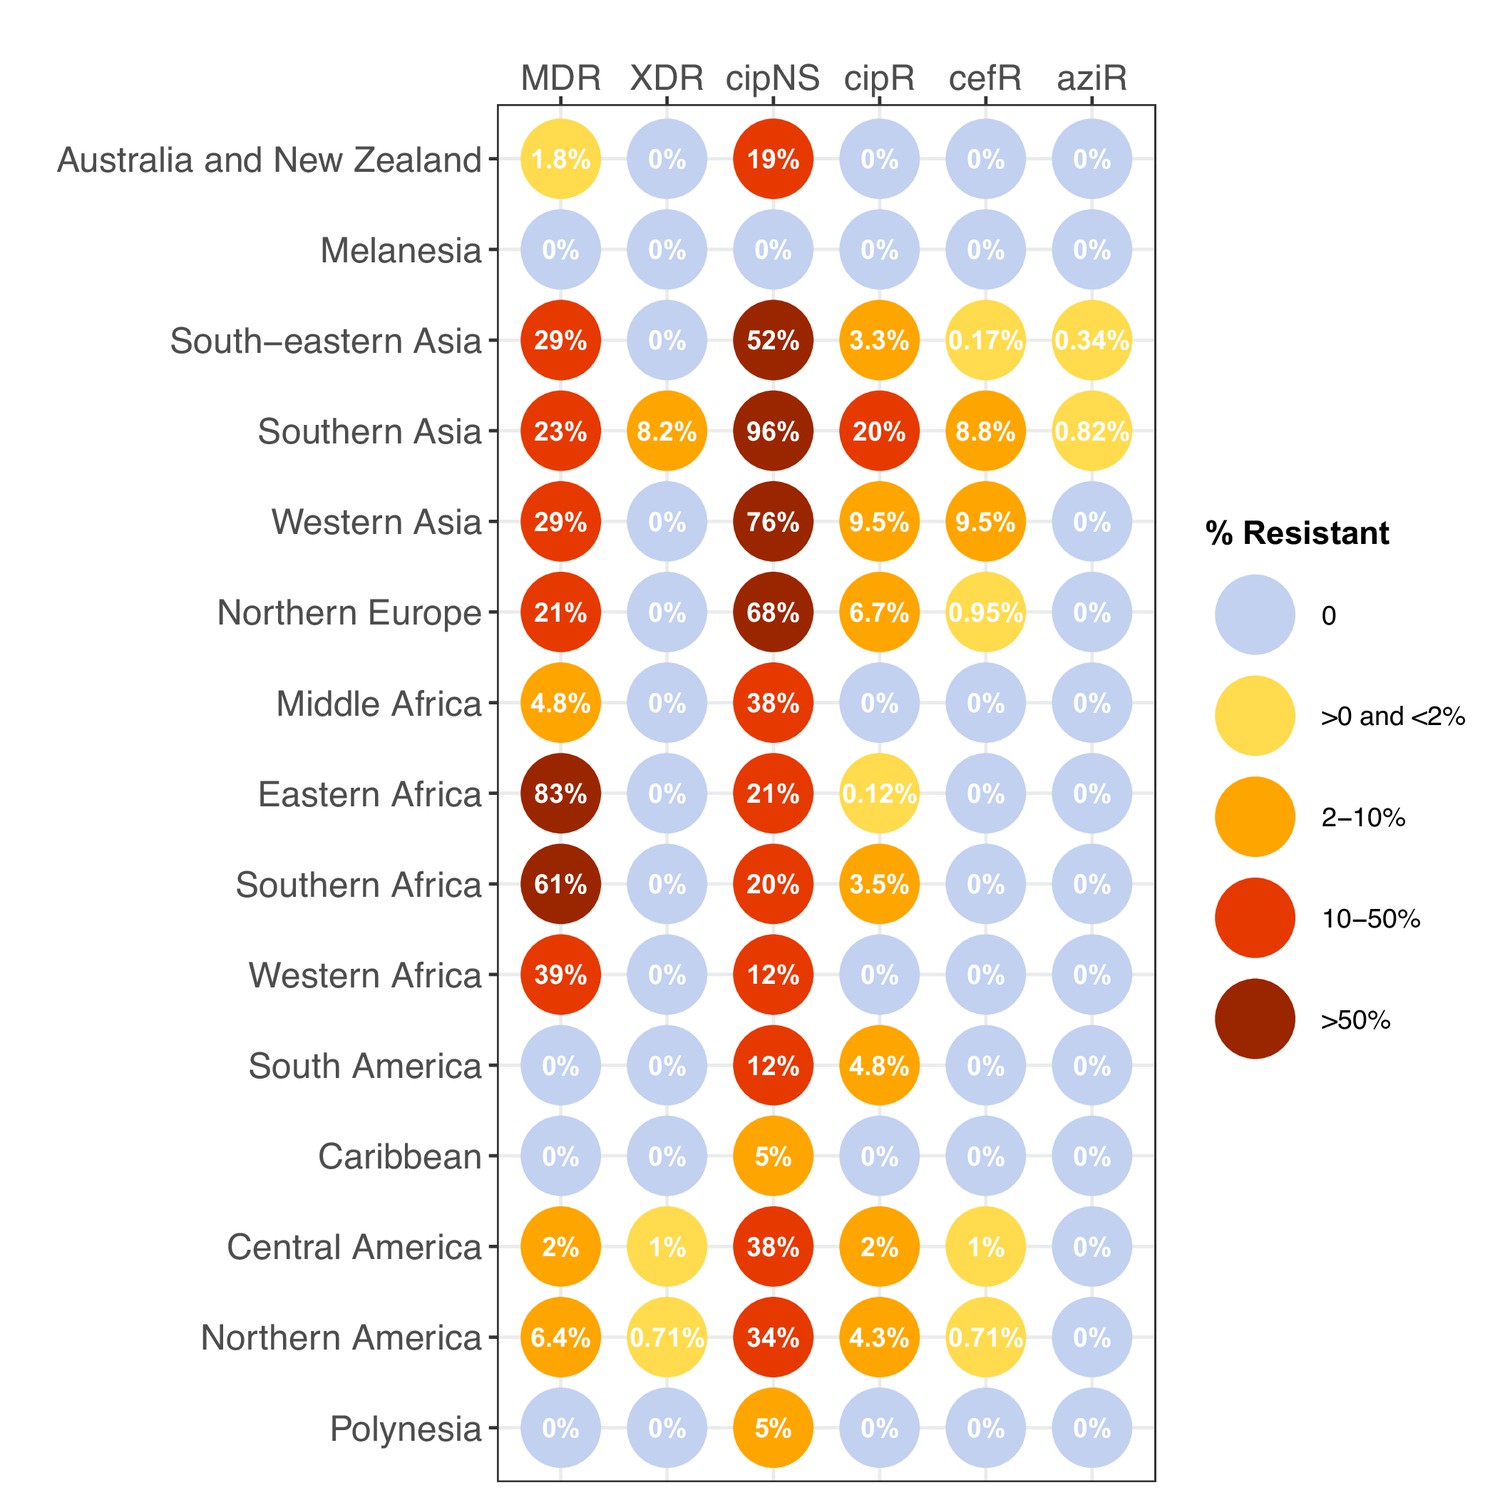
Prevalence of key antimicrobial resistance (AMR) genotype profiles by world region, for non-targeted samples, 2010–2020.
Percentage resistance values are printed for each region/drug combination, and are coloured by categorical ranges to reflect escalating levels of concern for empirical antimicrobial use: (i) 0: no resistance detected; (ii) >0 and ≤2%: resistance present but rare; (iii) 2–10%: emerging resistance; (iv) 10–50%: resistance common; (v) >50%: established resistance. Full data including counts and confidence intervals are in Supplementary file 7. MDR, multidrug resistant; XDR, extensively drug resistant; CipNS, ciprofloxacin non-susceptible; CipR, ciprofloxacin resistant; CefR, ceftriaxone resistant; AziR, azithromycin resistant.
Figure 2—figure supplement 2
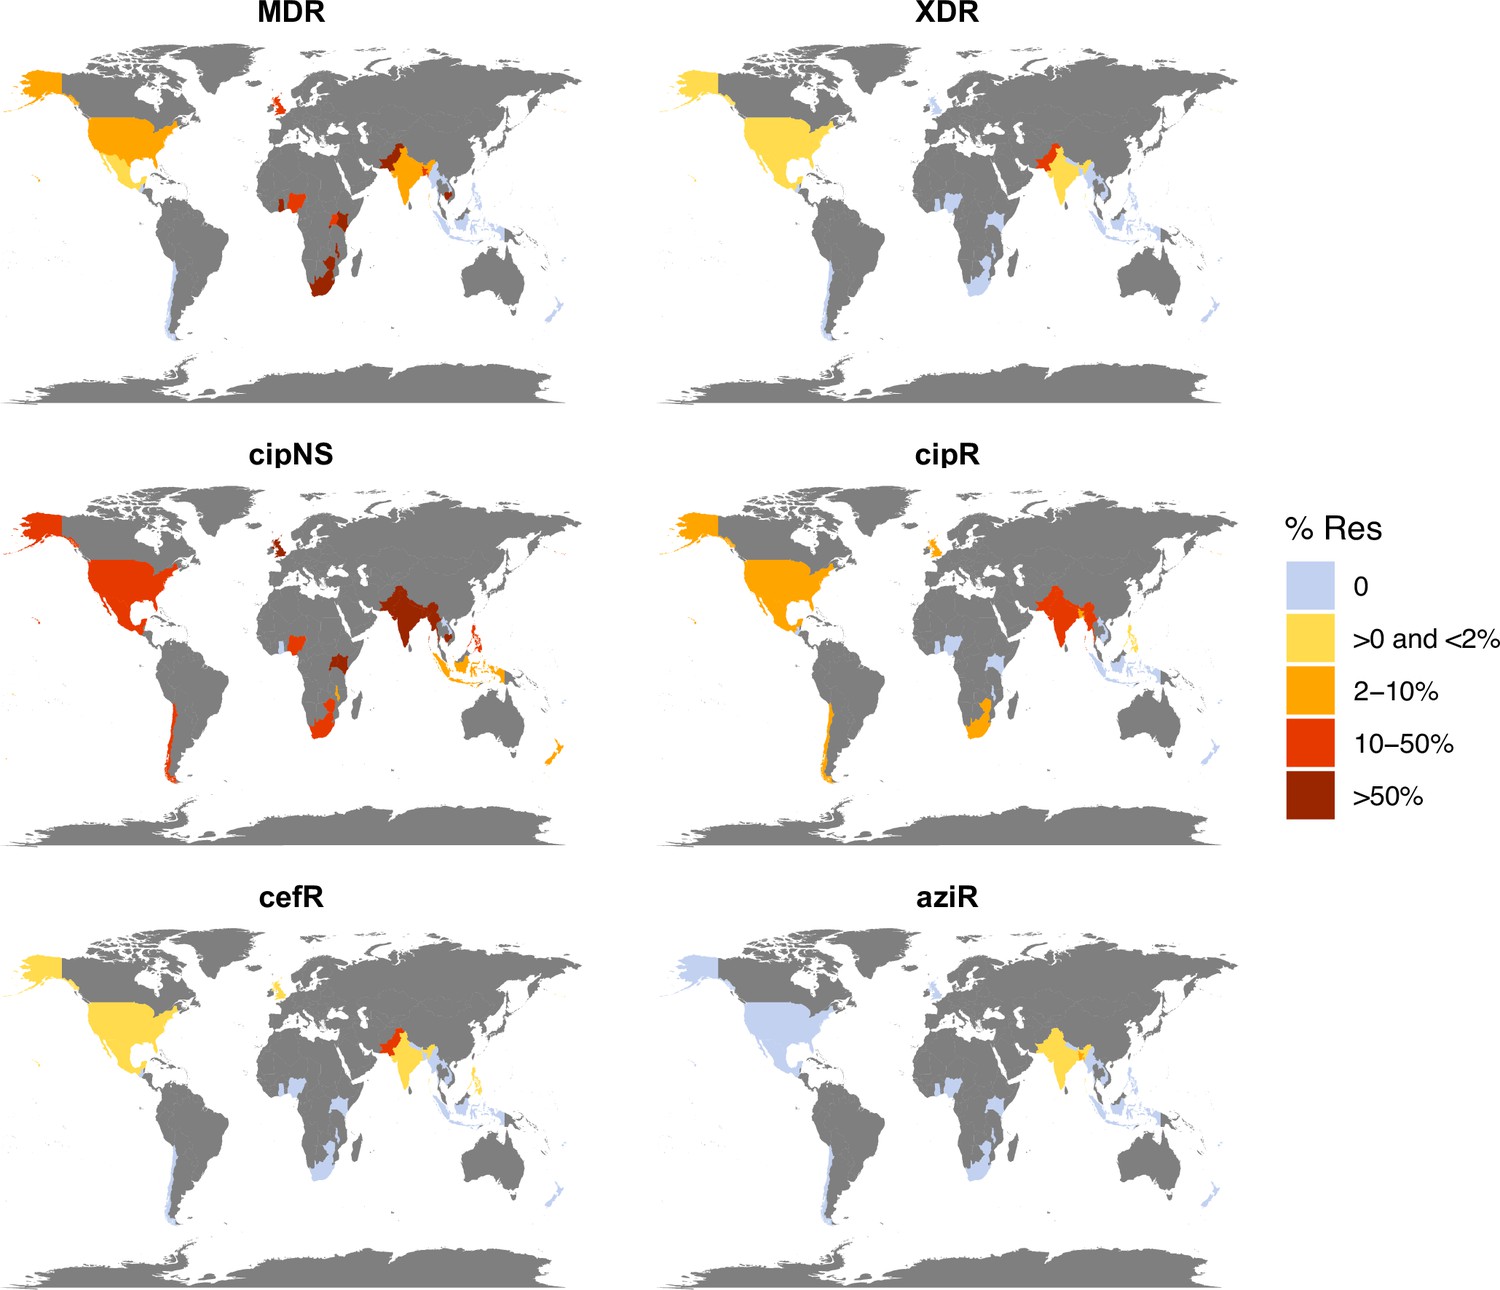
Antimicrobial resistance (AMR) prevalence for non-targeted samples, 2010–2020.
Data are shown only for countries with N≥20 isolates (others are coloured grey). Countries are coloured by the prevalence of resistance per country, as per the inset legend. MDR, multidrug resistant; XDR, extensively drug resistant; CipNS, ciprofloxacin non-susceptible; CipR, ciprofloxacin resistant; CefR, ceftriaxone resistant; AziR, azithromycin resistant.
Figure 2—figure supplement 3
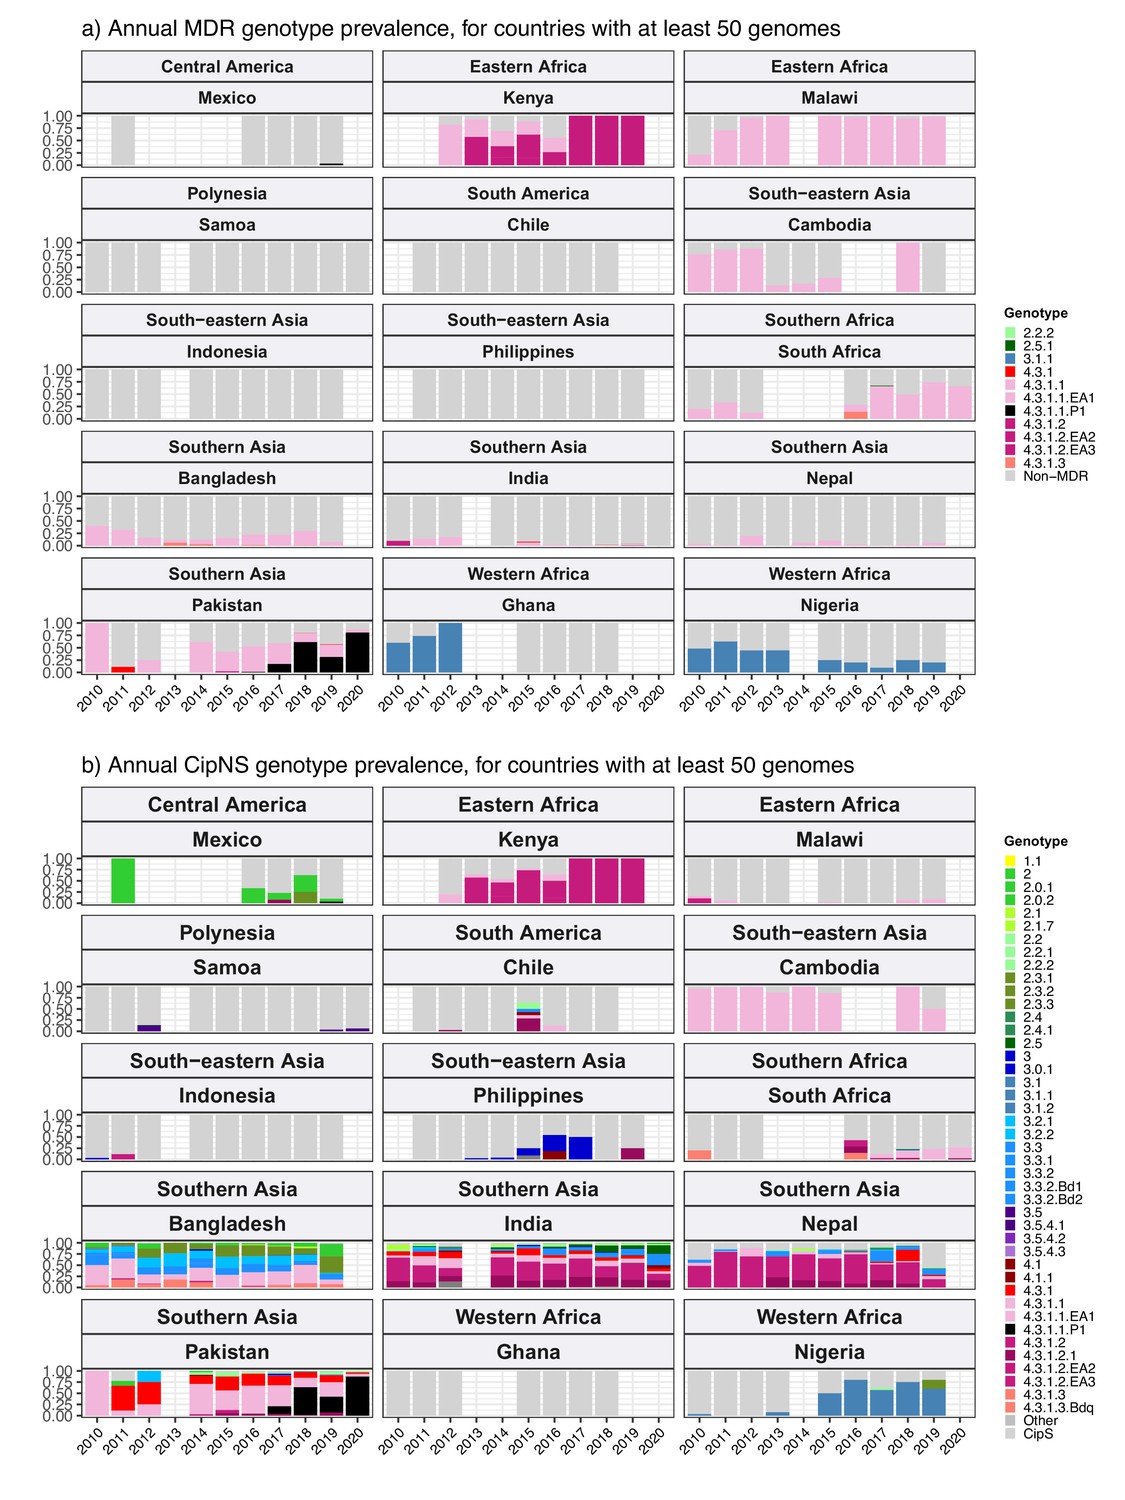
Annual genotype prevalence amongst multidrug-resistant (MDR) and ciprofloxacin non-susceptible (CipNS) genomes.
For countries with ≥50 representative genomes between 2010 and 2020 and endemic typhoid. Genotypes for (a) MDR and (b) CipNS genomes are coloured according to the inset legends; sensitive genomes of all genotypes are aggregated and coloured grey.
Figure 2—figure supplement 4
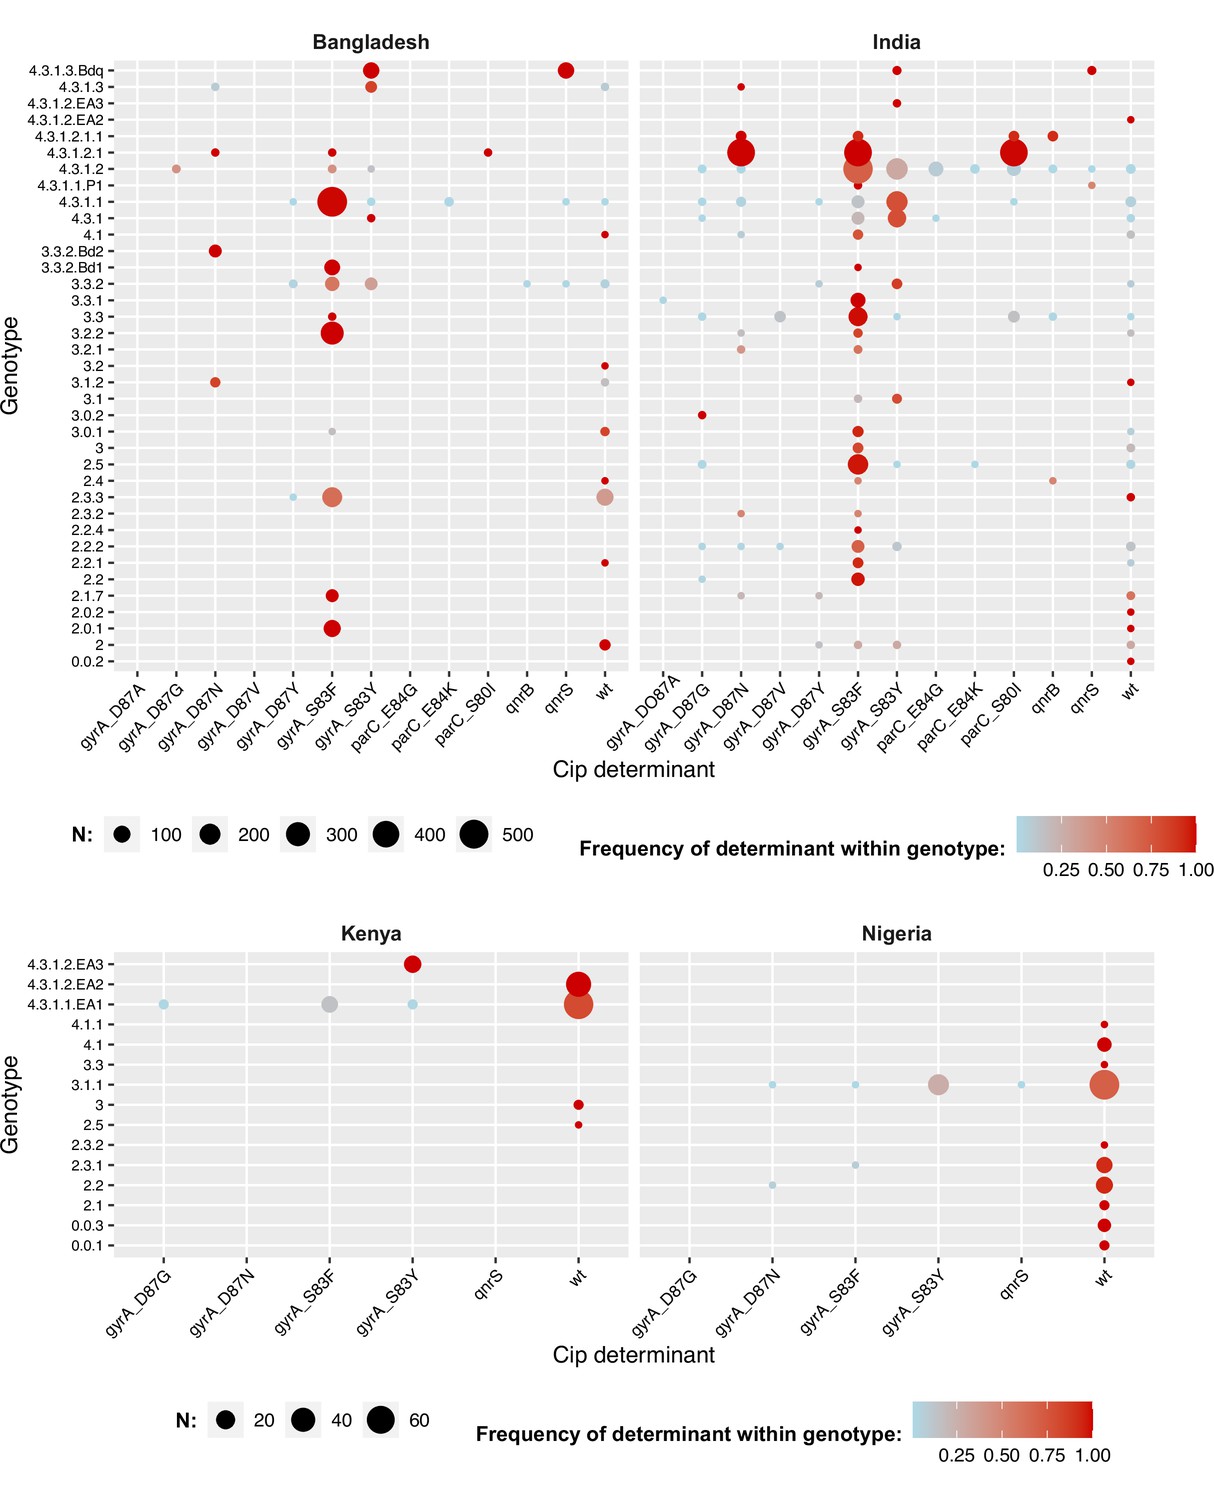
Distribution of fluoroquinolone resistance determinants by genotype.
For selected countries discussed in text. Node size indicates total number of isolates for a given combination of genotype (row) and determinant (column); nodes are coloured to indicate the frequency of the determinant within that genotype. Wt = wildtype; that is, no quinolone resistance determining mutations was detected in gyrA or parC and no plasmid-borne quinolone resistance (qnr) genes were detected.
Figure 2—figure supplement 5
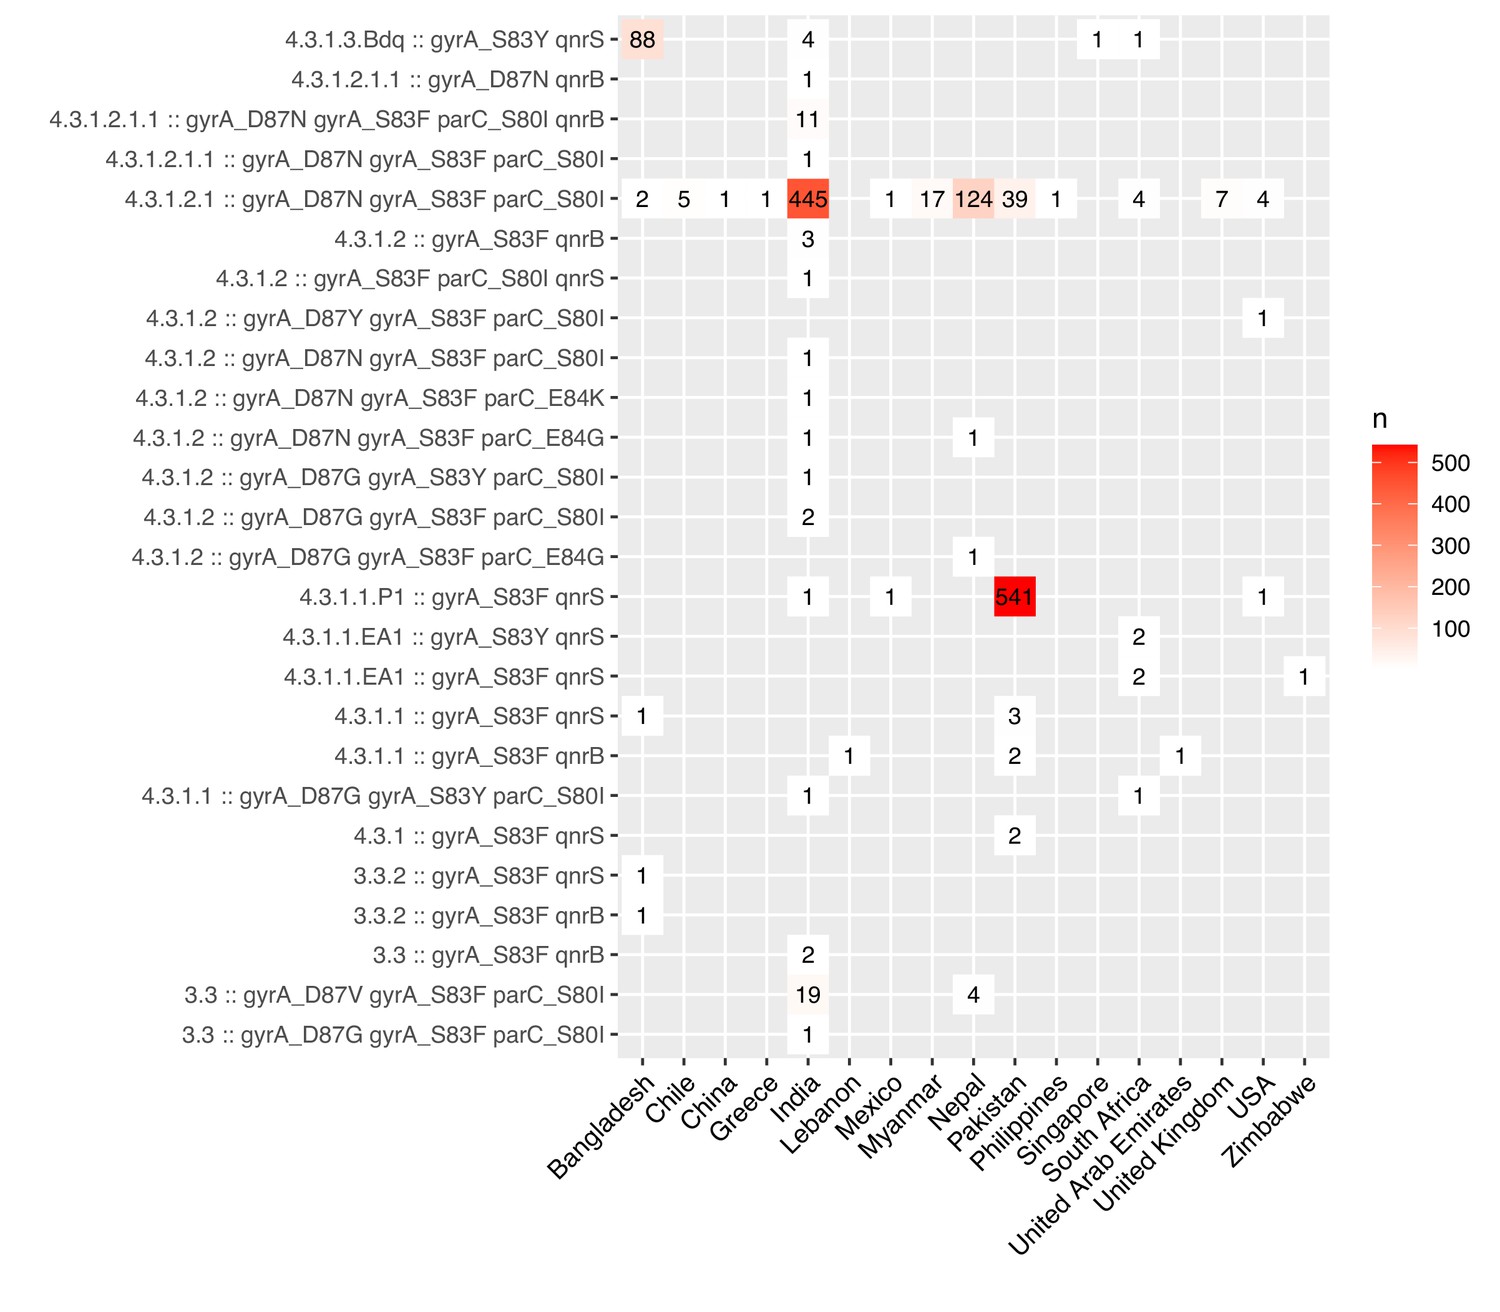
Ciprofloxacin-resistant genotypes identified.
Rows show all n=24 unique combinations of Typhi genotype, quinolone-resistance determining region (QRDR) mutations (in gyrA, gyrB, parC, see Methods) and acquired plasmid-mediated quinolone resistance (PMQR) genes (qnrB, qnrD, qnrS) identified in genomes that are predicted to result in ciprofloxacin resistance (presence of ≥1 QRDR mutation+≥1 PMQR gene, or presence of ≥3 QRDR mutations).
Figure 3 with 2 supplements
Annual prevalence of key antimicrobial resistance (AMR) profiles.
For countries with ≥3 years with ≥10 representative genomes (untargeted, assumed acute cases) from 2000 to 2020. Data are shown only for country/year combinations with N≥5 isolates. MDR, multidrug resistant; XDR, extensively drug resistant; CipNS, ciprofloxacin non-susceptible; CipR, ciprofloxacin resistant.
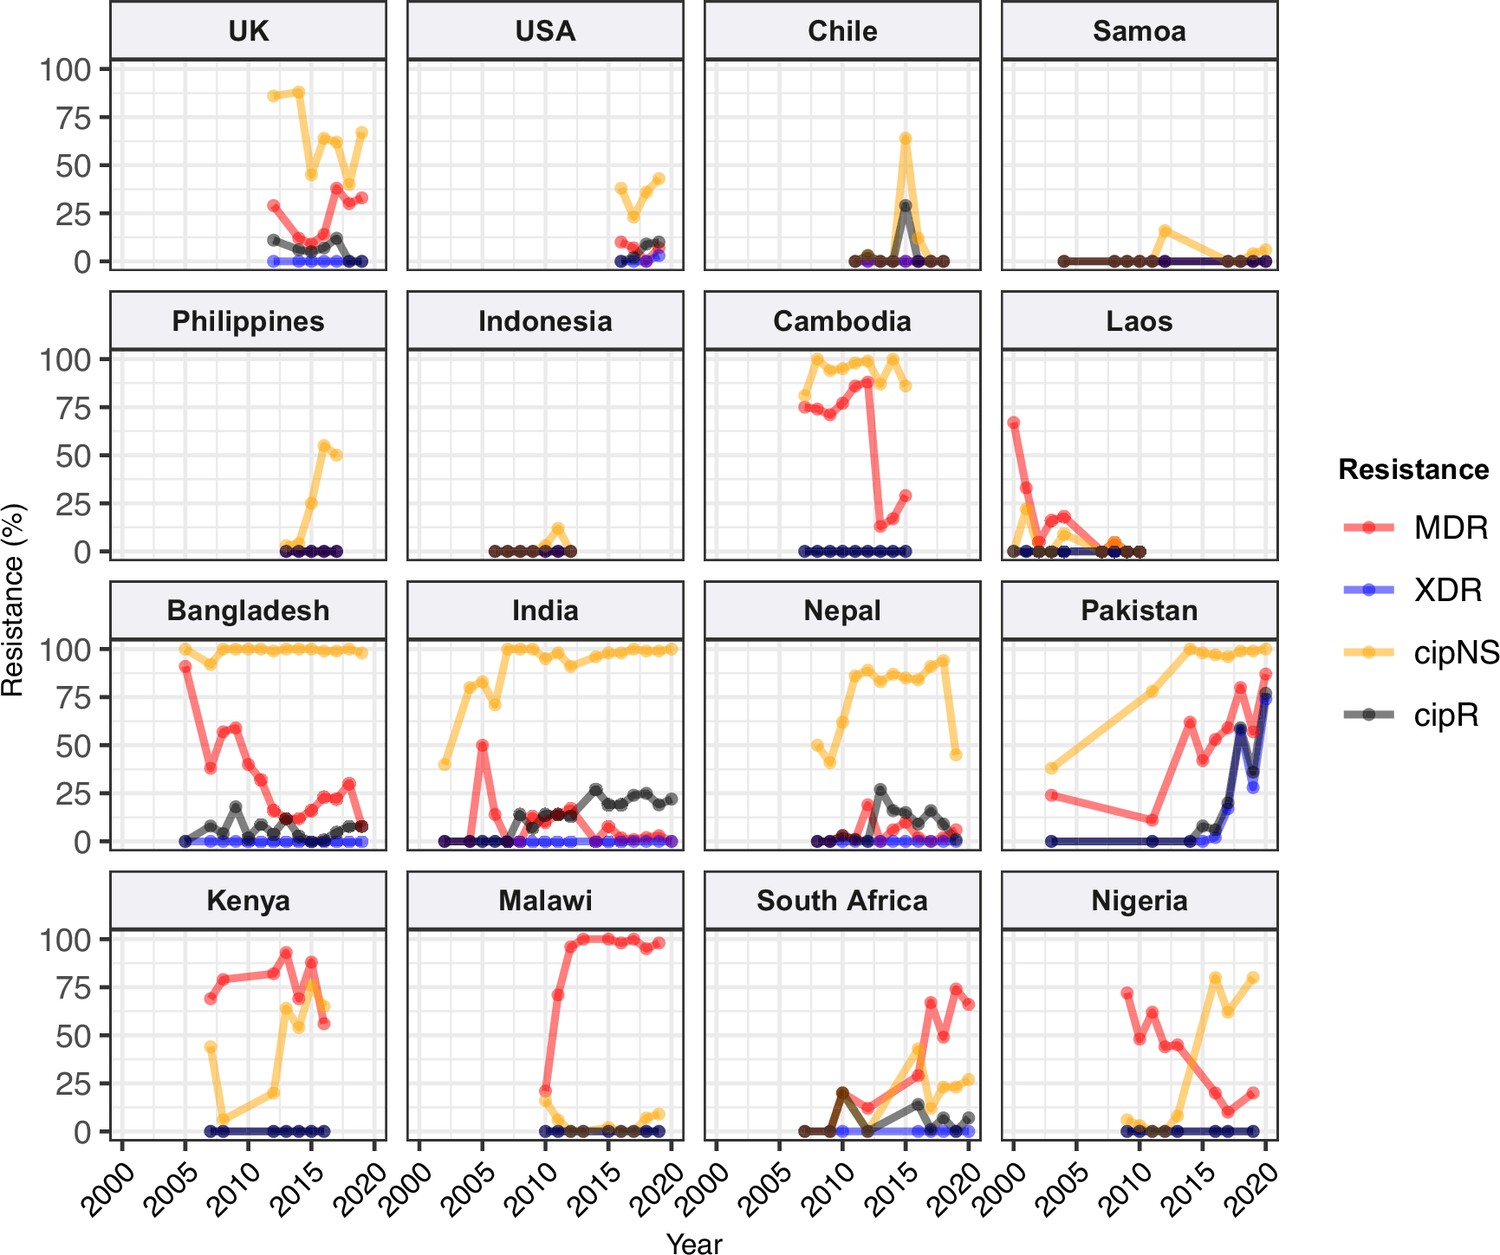
Figure 3—figure supplement 1
Annual prevalence of key antimicrobial resistance (AMR) profiles.
For countries with ≥3 years with ≥10 representative genomes (untargeted, assumed acute cases) from 2000 to 2020 and endemic typhoid. Data are shown only for country/year combinations with N≥5 isolates. MDR, multidrug resistant; XDR, extensively drug resistant; CipNS, ciprofloxacin non-susceptible; CipR, ciprofloxacin resistant; CefR, ceftriaxone resistant; AziR, azithromycin resistant.
Figure 3—figure supplement 2
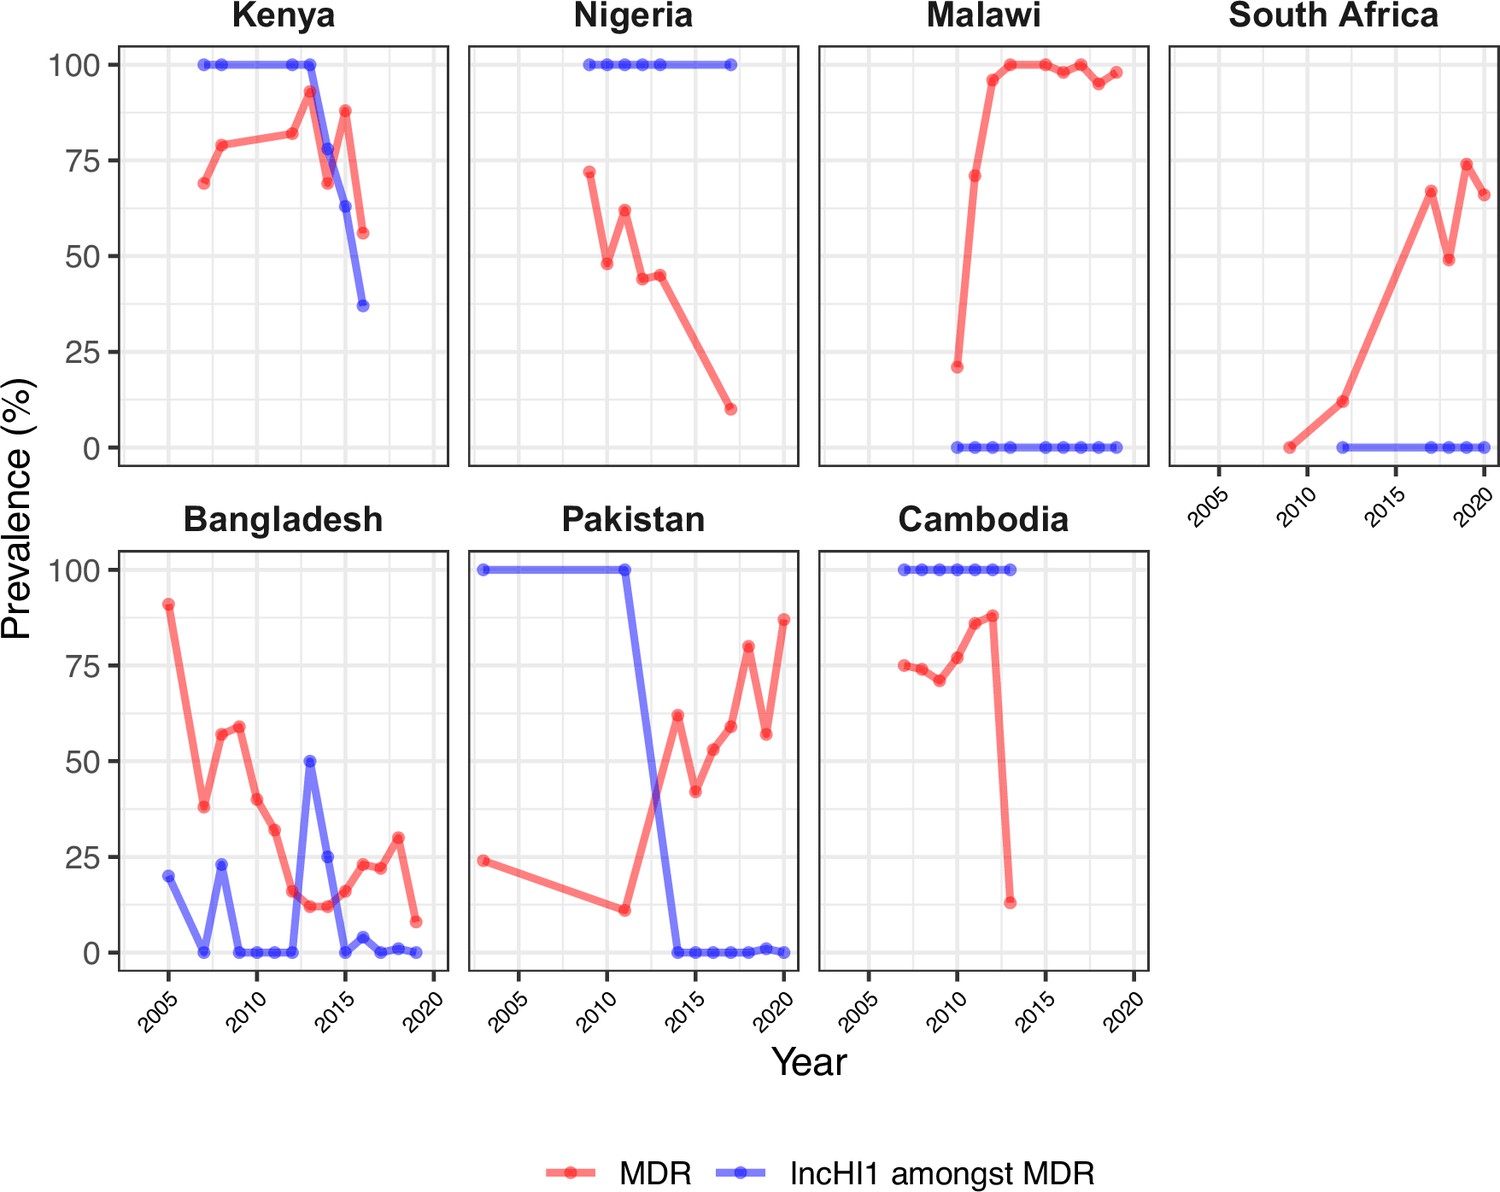
Trends in annual frequency of multidrug-resistant (MDR) genomes and proportion of MDR explained by IncHI1 plasmids.
For countries with endemic typhoid and ≥5% MDR prevalence between 2000 and 2020.
Figure 4
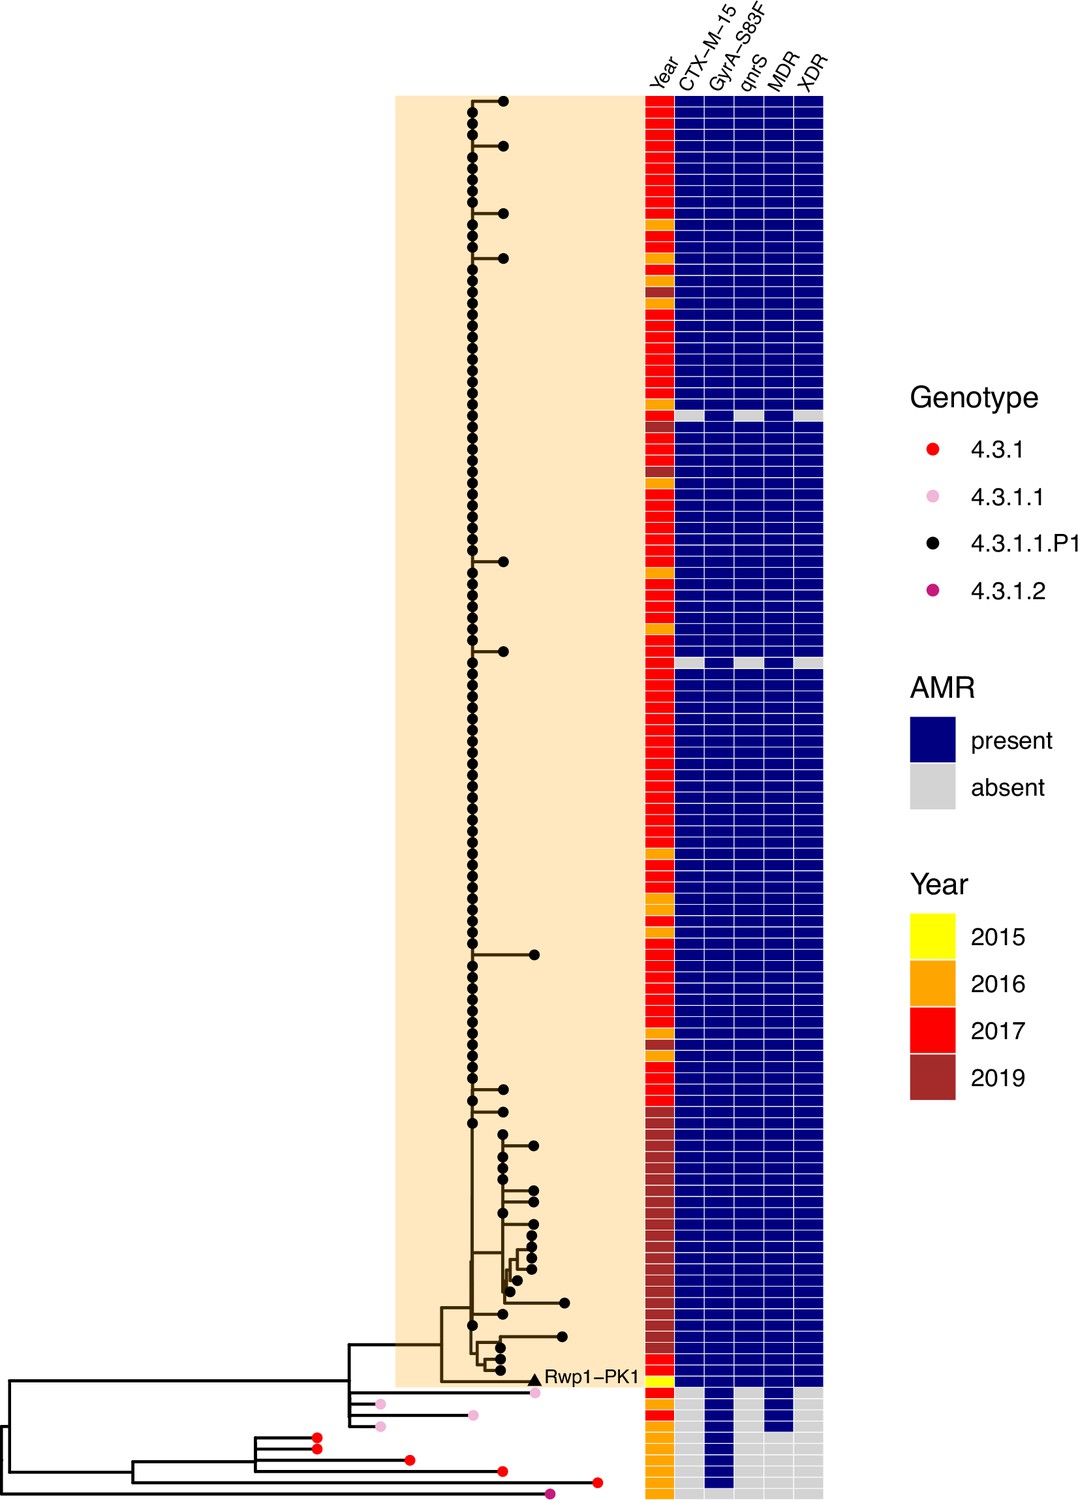
Phylogenetic tree showing position of 2015 Rwalpindi isolate, Rwp1-PK1, in context with other genomes from Pakistan.
Core-genome distance-based neighbour-joining tree generated in Pathogenwatch, using all genomes from Klemm et al., 2018 (the first genomic characterisation of the extensively drug-resistant [XDR] outbreak clade, including outbreak strains and local context strains from Sindh Province in 2016–2017) and Rasheed et al., 2020 (genomic report of XDR outbreak strains from Lahore in 2019). Tree tips are coloured by genotype, according to inset legend; the 2015 strain Rwp1-PK1 is labelled in the tree and indicated with a triangle. Year of isolation and presence of antimicrobial resistance (AMR) determinants are indicated in the heatmap, according to inset legend.
Figure 5
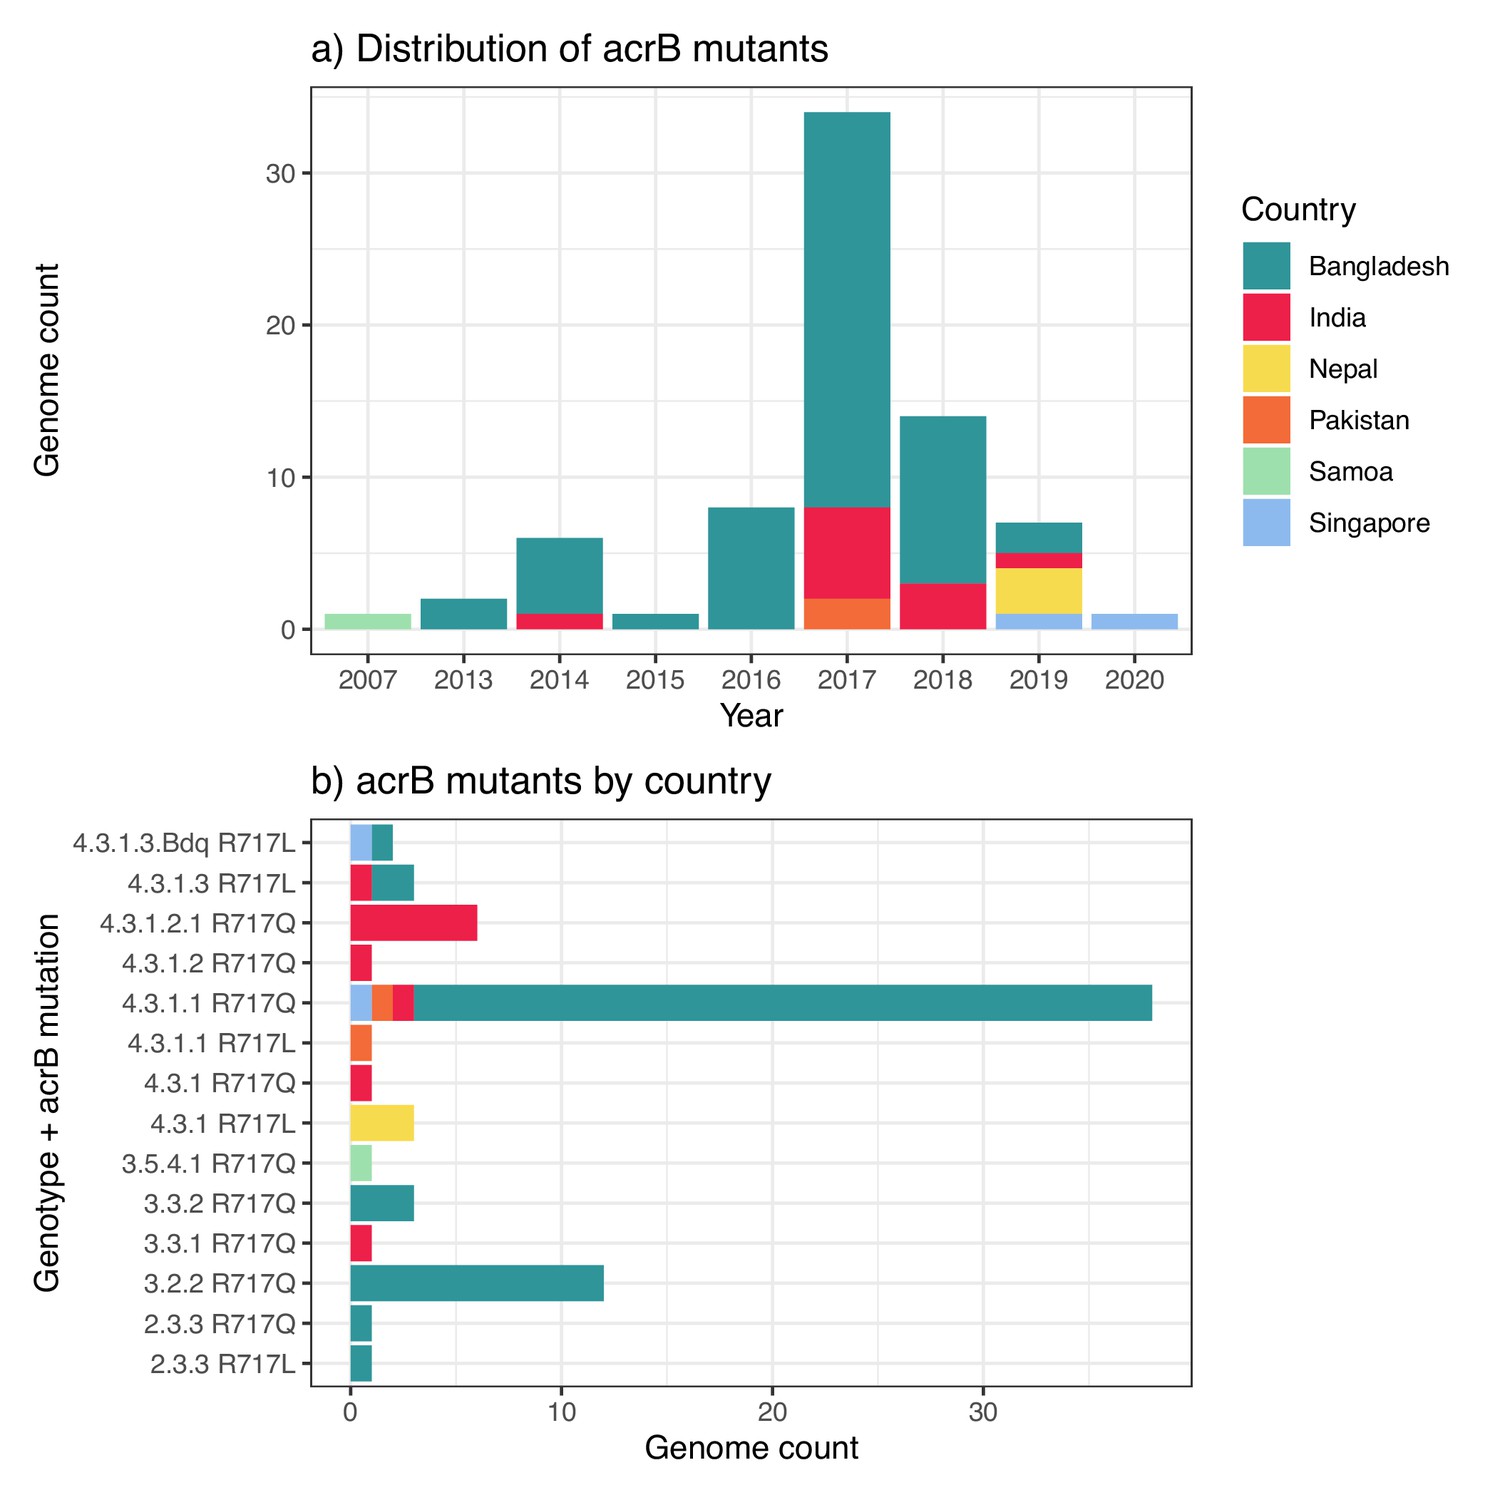
Distribution of azithromycin resistance-associated acrB mutations detected in Typhi genomes.
(a) Temporal distribution of acrB mutants. (b) Distribution of acrB mutants by genotype and mutation. The first acrB mutant appeared in Samoa in 2007. Other mutants have appeared independently across a range of genetic backgrounds, largely in South Asian countries, but remain at low prevalence levels overall (see Figure 2). Country of origin is coloured as per inset label.
Figure 6 with 2 supplements
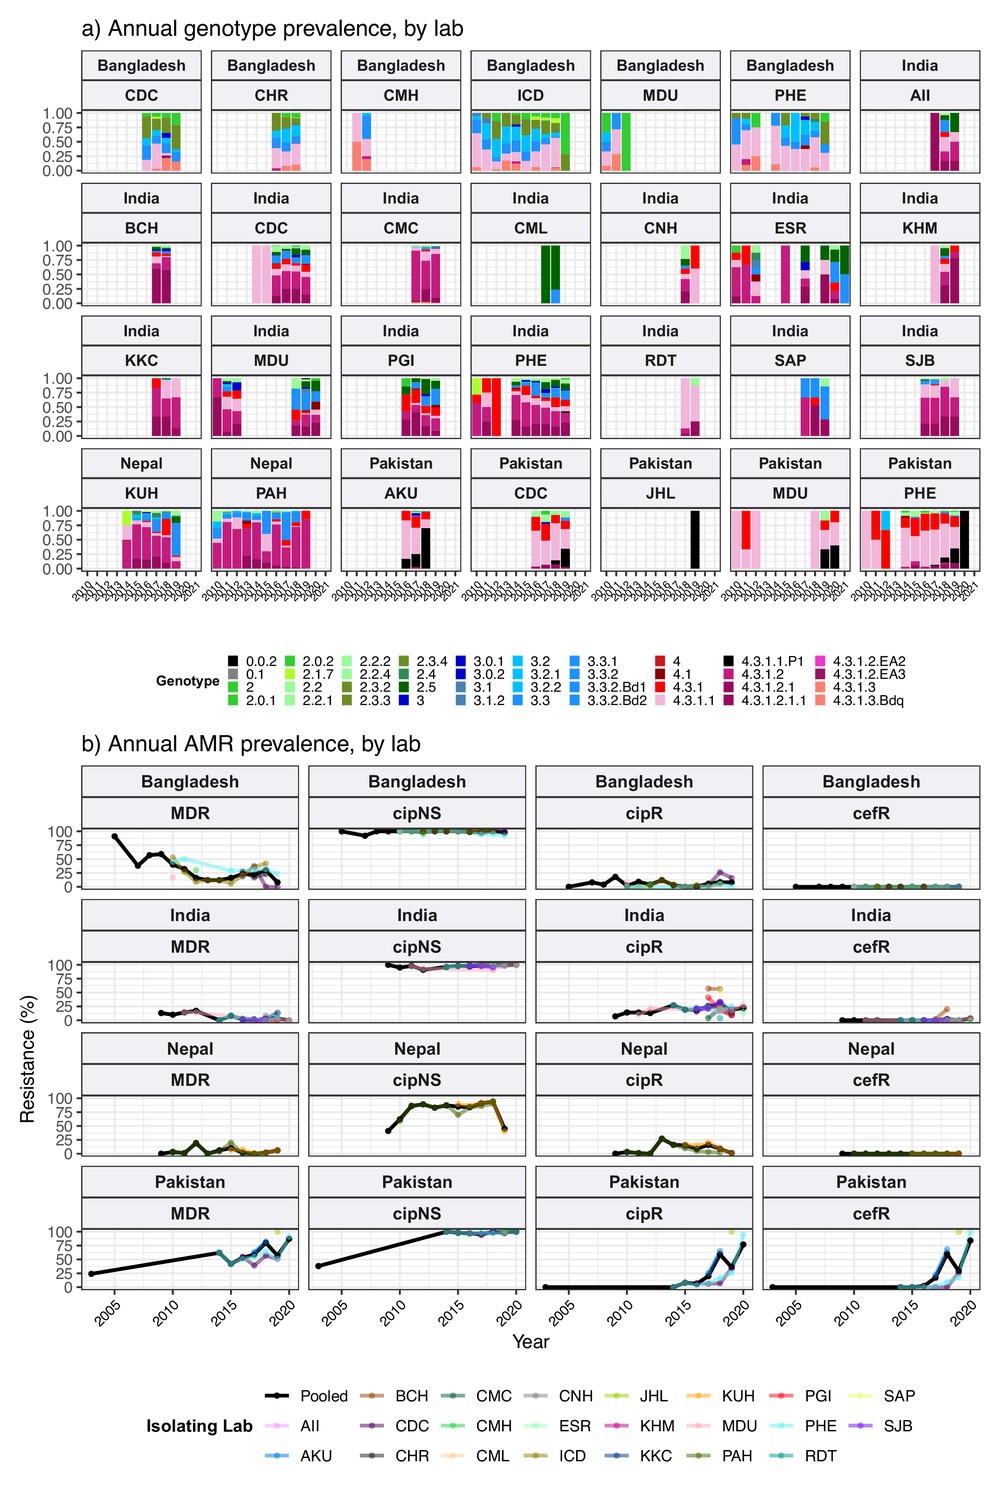
Annual genotype and antimicrobial resistance (AMR) frequencies by isolating lab, for South Asian countries with multiple data sources.
Labs shown are those with ≥20 isolates; and years shown for each lab are those with N≥5 isolates from that year. (a) Bars are coloured to indicate annual genotype prevalence, as per inset legend. (b) Lines indicate annual frequencies of key AMR profiles, coloured by isolating laboratory as per inset legend. MDR, multidrug resistant; XDR, extensively drug resistant; CipNS, ciprofloxacin non-susceptible; CipR, ciprofloxacin resistant; CefR, ceftriaxone resistant. See Supplementary file 9 for three-letter laboratory code master list.
Figure 6—figure supplement 1
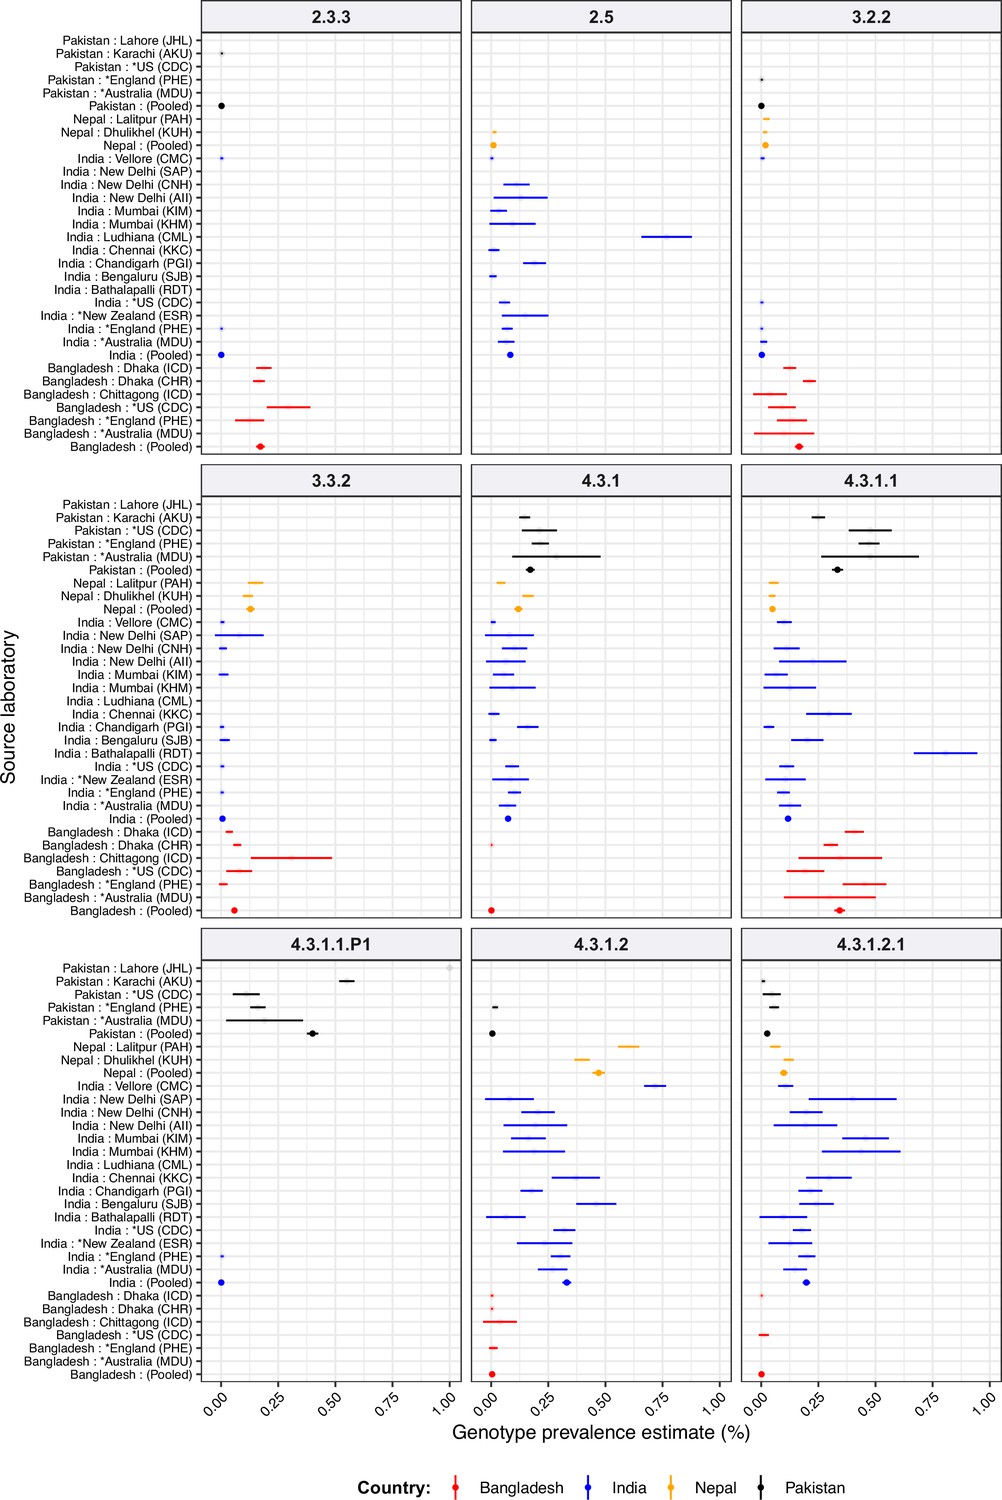
Genotype prevalence estimated from different data sources, for South Asian countries.
For source laboratories with N≥20 isolates. Lines show 95% confidence interval for each proportion (prevalence) estimate; solid circles highlight the pooled point estimate for national prevalence in each country. Lines are coloured by country as per the inset legend. See Supplementary file 9 for three-letter laboratory code master list.
Figure 6—figure supplement 2
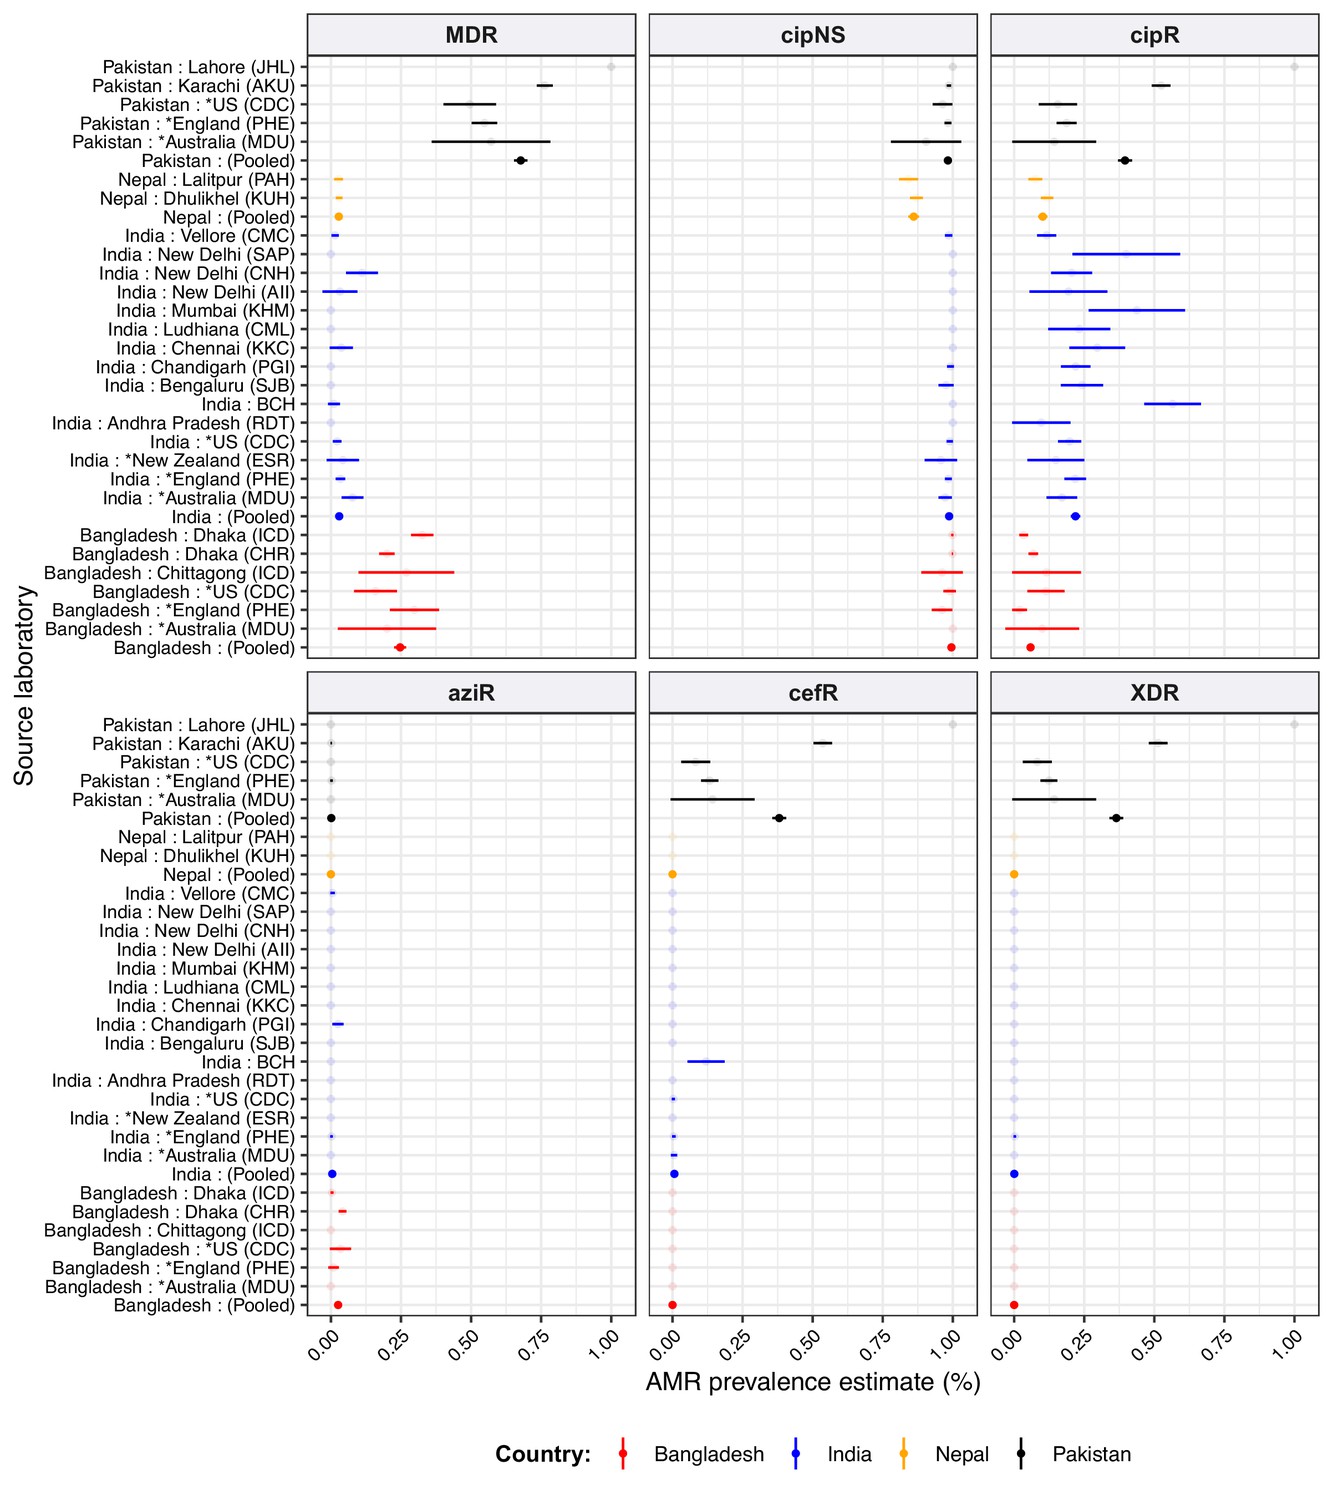
Antimicrobial resistance (AMR) prevalence estimated from different sources, for South Asian countries.
For source laboratories with N≥20 isolates from which to estimate prevalence. Lines show 95% confidence interval for each proportion (prevalence) estimate; solid circles highlight the pooled point estimate for national prevalence in each country. Lines are coloured by country as per the inset legend. See Supplementary file 9 for three-letter laboratory code master list.
Figure 7
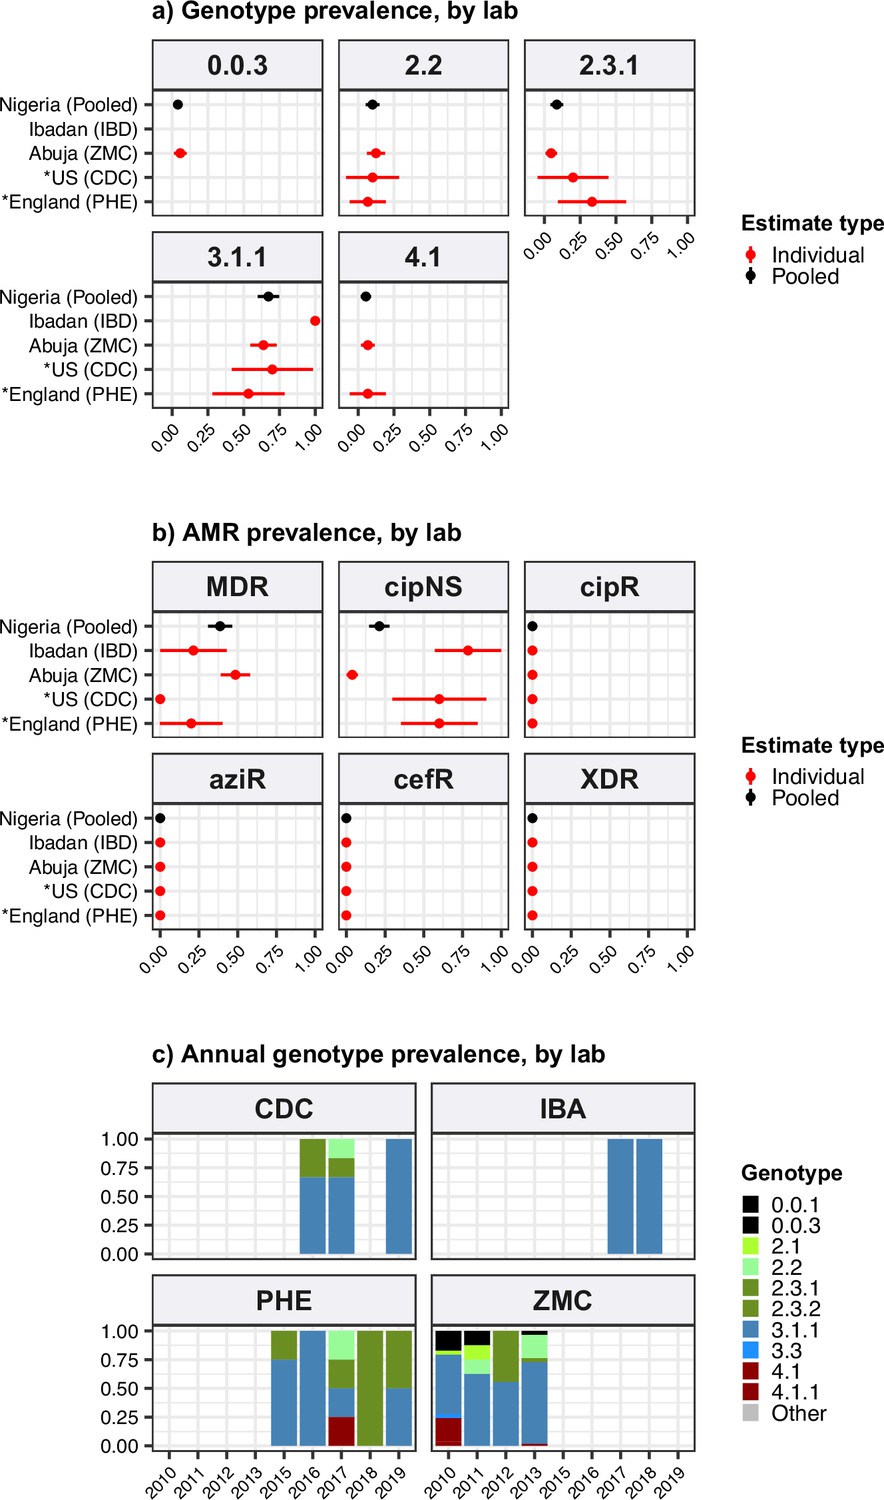
Genotype and antimicrobial resistance (AMR) prevalence rates estimated for Nigeria from different data sources.
Data are shown only for source labs with N≥10 isolates from which to estimate prevalence. (a) Genotype prevalence and (b) AMR prevalence, using all available isolates per lab, 2010–2020. Lines show 95% confidence interval for each proportion (prevalence) estimate. Red indicates estimates based on data from individual labs, black indicates pooled estimates (i.e. from all labs), as per inset legend. (c) Annual genotype frequencies. Bars are coloured by genotype as per inset legend. Lab abbreviations are shown in y-axis labels for panels (a–b). MDR, multidrug resistant; XDR, extensively drug resistant; CipNS, ciprofloxacin non-susceptible; CipR, ciprofloxacin resistant; CefR, ceftriaxone resistant; AziR, azithromycin resistant. See Supplementary file 9 for three-letter laboratory code master list.
Tables
Table 1
Summary of published studies and other data sources.
Details of research studies and public health laboratory data aggregated in this study.
| Published studiesPubMed ID or DOI (citation as per reference list) | Total genomes | *Representative cases 2010–2020 | †Travel associated |
|---|---|---|---|
| 11677608 (Parkhill et al., 2001) | 1 | 0 | 0 |
| 12644504 (Deng et al., 2003) | 1 | 0 | 0 |
| 18660809 (Holt et al., 2008) | 4 | 0 | 0 |
| 25392358 (Hendriksen et al., 2015a) | 22 | 0 | 0 |
| 25428145 (Hendriksen et al., 2015b) | 2 | 0 | 0 |
| 25961941 (Wong et al., 2015) | 1736 | 733 | 248 |
| 26411565 (Baker et al., 2015) | 30 | 0 | 0 |
| 26974227 (Pham Thanh et al., 2016a) | 77 | 77 | 0 |
| 27069781 (Ashton et al., 2016) | 489 | 432 | 356 |
| 27331909 (Pham Thanh et al., 2016b) | 1 | 1 | 0 |
| 27657909 (Wong et al., 2016b) | 128 | 111 | 0 |
| 27703135 (Wong et al., 2016a) | 99 | 43 | 43 |
| 28060810 (Dyson et al., 2017) | 44 | 0 | 0 |
| 28280021 (Rodrigues et al., 2017) | 3 | 0 | 0 |
| 28705963 (Kong et al., 2017) | 2 | 0 | 0 |
| 28931025 (Kuijpers et al., 2017) | 64 | 59 | 0 |
| 29051234 (Gul et al., 2017) | 1 | 0 | 0 |
| 29136410 (Phoba et al., 2017) | 1 | 0 | 0 |
| 29216342 (Day et al., 2018) | 5 | 4 | 3 |
| 29255729 (Matono et al., 2017) | 107 | 0 | 0 |
| 29463654 (Klemm et al., 2018) | 100 | 0 | 0 |
| 29616895 (Djeghout et al., 2018) | 1 | 0 | 0 |
| 29684021 (Britto et al., 2018) | 192 | 169 | 0 |
| 30425150 (Tanmoy et al., 2018) | 536 | 0 | 0 |
| 30504848 (Park et al., 2018) | 249 | 209 | 0 |
| 30236166 (Burnsed et al., 2018) | 30 | 0 | 0 |
| 31225619 (Oo et al., 2019) | 39 | 39 | 0 |
| 31513580 (Ingle et al., 2019) | 107 | 99 | 91 |
| 31730615 (Hooda et al., 2019) | 12 | 0 | 0 |
| 31872221 (Sah et al., 2019) | 2 | 0 | 0 |
| 31665304 (Britto et al., 2020) | 94 | 94 | 0 |
| 32003431 (Pragasam et al., 2020) | 194 | 0 | 0 |
| 32106221 (Rahman et al., 2020) | 202 | 147 | 0 |
| 32119918 (Chirico et al., 2020) | 1 | 0 | 0 |
| 32217683 (Tagg et al., 2020) | 5 | 0 | 0 |
| 32253142 (Liu et al., 2021) | 1 | 0 | 0 |
| 32732230 (Hao et al., 2020) | 1 | 0 | 0 |
| 32883020 (Rasheed et al., 2020) | 27 | 27 | 0 |
| 33079054 (Maes et al., 2020) | 7 | 7 | 0 |
| 33085725 (Thanh Duy et al., 2020) | 116 | 0 | 0 |
| 33347558 (Mashe et al., 2021) | 29 | 0 | 0 |
| 34223059 (Duy et al., 2020) | 4 | 0 | 0 |
| 33496224 (Octavia et al., 2021) | 15 | 15 | 12 |
| 33515460 (Carey et al., 2021) | 66 | 66 | 0 |
| 33593966 (Sajib et al., 2021) | 80 | 80 | 0 |
| 33651791 (Shin et al., 2021) | 8 | 0 | 0 |
| 33704480 (Nair et al., 2021) | 58 | 58 | 58 |
| 33965548 (Jacob et al., 2021) | 2 | 0 | 0 |
| 34370659 (Chattaway et al., 2021) | 631 | 604 | 584 |
| 34463736 (Gauld et al., 2022) | 262 | 262 | 0 |
| 34515028 (Kariuki et al., 2021) | 136 | 88 | 0 |
| 34529660 (Guevara et al., 2021) | 77 | 0 | 0 |
| 34543095 (Ingle et al., 2021) | 116 | 116 | 107 |
| 34626469 (Argimón et al., 2021b) | 92 | 92 | 0 |
| 34812716 (Kanteh et al., 2021) | 16 | 14 | 0 |
| 35344544 (Dyson et al., 2022) | 41 | 0 | 0 |
| 35750070 (da Silva et al., 2022) | 3402 | 3390 | 0 |
| 35767580 (Maes et al., 2022) | 203 | 90 | 0 |
| 35999186 (Lagrada et al., 2022) | 190 | 190 | 0 |
| 36026470 (Ikhimiukor et al., 2022a) | 22 | 14 | 0 |
| 36094088 (Sikorski et al., 2022) | 202 | 174 | 1 |
| 37327220 (Rutanga et al., 2023) | 51 | 26 | 0 |
| 37339282 (Smith et al., 2023) | 281 | 281 | 13 |
| DOI: 10.1101/2022.09.01.506167 (Thilliez et al., 2022) | 57 | 0 | 0 |
| DOI: 10.1101/2022.10.03.510628 (Carey et al., 2022) | 463 | 0 | 0 |
| DOI: 10.1101/2023.03.27.23287794 (Ashton et al., 2023) | 20 | 20 | 0 |
| DOI: 10.1101/2023.03.11.23286741 (Dyson et al., 2023) | 732 | 707 | 0 |
| Previously unpublished public health laboratory data | |||
| France (Institut Pasteur) | 23 | 23 | 17 |
| New Zealand (ESR) | 99 | 97 | 52 |
| USA (CDC) | 889 | 850 | 712 |
| Total | 13,000 | 9508 | 2297 |
-
*
-
†
Genomes recorded as travel-associated and with known travel to a specific country in this region, associated with assumed acute typhoid isolated from 2010 onwards from non-targeted sampling frames.
Table 2
Summary of genomes by region.
| Region | Total genomes | *Representative cases 2010–2020 | †Travel (%) amongst representative cases 2010–2020 |
|---|---|---|---|
| Australia and NZ | 57 | 57 | 0 (0%) |
| Caribbean | 20 | 20 | 20 (100%) |
| Central America | 103 | 100 | 100 (100%) |
| Eastern Africa | 1106 | 830 | 49 (5.9%) |
| Eastern Asia | 12 | 3 | 3 (100%) |
| Eastern Europe | 3 | 1 | 1 (100%) |
| Melanesia | 232 | 37 | 30 (81.1%) |
| Micronesia | 4 | 1 | 1 (100%) |
| Middle Africa | 59 | 21 | 6 (28.6%) |
| Northern Africa | 41 | 6 | 6 (100%) |
| Northern America | 167 | 140 | 2 (1.4%) |
| Northern Europe | 109 | 105 | 0 (0%) |
| Polynesia | 324 | 262 | 45 (17.2%) |
| South America | 367 | 105 | 5 (4.8%) |
| South-eastern Asia | 1140 | 584 | 72 (12.3%) |
| Southern Africa | 317 | 286 | 2 (0.7%) |
| Southern Asia | 8231 | 6623 | 1878 (28.4%) |
| Southern Europe | 10 | 6 | 6 (100%) |
| Western Africa | 384 | 267 | 34 (12.7%) |
| Western Asia | 47 | 21 | 21 (100%) |
| Western Europe | 7 | 3 | 3 (100%) |
| Unknown | 225 | 0 | 0 |
| Total | 12965 | 9478 | 2284 (24.1%) |
-
*
-
†
Genomes recorded as travel-associated and with known travel to a specific country in this region, associated with assumed acute typhoid isolated from 2010 onwards from non-targeted sampling frames. Countries were assigned to world regions based on the United Nations (UN) Statistics Division standard M49.
Table 3
Extended spectrum beta-lactamase (ESBL) genes detected in Typhi genomes.
| Genotype | ESBL | 3GCR | Country of origin | n | Years | Other plasmid/AMR markers |
|---|---|---|---|---|---|---|
| 2.5.1 | CTX-M-15 | Y | DRC Phoba et al., 2017 | 1 | 2015 | IncY‡; blaTEM-1, dfrA7, sul1 (gyrA-S83F) |
| 3 | CTX-M-15 | Y | Philippines Lagrada et al., 2022 | 1 | 2013 | – |
| SHV-12 | Y | Philippines Hendriksen et al., 2015a; Lagrada et al., 2022 | 2 | 2007 | IncHI2A*; blaTEM-1, dfrA18, tetA(D) | |
| 3.3 | CTX-M-15 | Y | UK | 1 | 2012 | (gyrA-S83F) |
| 3.3.2 | CTX-M-15 | Y | Bangladesh Djeghout et al., 2018; Tanmoy et al., 2018 | 2 | 2000 | IncI1*; blaTEM-1 |
| 3.5 | CTX-M-12 | Y | Colombia Guevara et al., 2021 | 1 | 2012 | IncL, IncFIB(pHCM2); blaTEM-1, sul1 |
| 4.3.1 | CTX-M-15 | Y | India Sah et al., 2019 | 1 | 2019 | IncY*; qnrS, blaTEM-1, dfrA14, sul2, (gyrA-S83Y) |
| Y/N | Pakistan da Silva et al., 2022; Klemm et al., 2018 | 2 | 2018 | IncY ‡; qnrS, blaTEM-1, sul2, catA1, dfrA7, sul1, tetA(A); (gyrA-S83F) | ||
| 4.3.1.1 | CTX-M-15 | N | Pakistan da Silva et al., 2022 | 1 | 2016 | IncY; qnrS, blaTEM-1, sul2, catA1, dfrA7, sul1, tetA(A); (gyrA-S83F) |
| 4.3.1.1.P1 | CTX-M-15 | Y | India Klemm et al., 2018; Nair et al., 2021 | 1 | 2019 | IncY*†qnrS, blaTEM-1, sul2, catA1, dfrA7, sul1 (gyrA-S83F) |
| Y | Mexico https://wwwn.cdc.gov/narmsnow/ | 1 | 2019 | |||
| Y | Pakistan Klemm et al., 2018; Munir et al., 2016; Rasheed et al., 2020 | 656 | 2015–20 | |||
| Y | USA https://wwwn.cdc.gov/narmsnow/ | 1 | 2019 | |||
| CTX-M-55 | Y | Pakistan Nair et al., 2021 | 1 | 2018 | ||
| 4.3.1.2 | CTX-M-15 | Y | Iraq Nair et al., 2021 | 2 | 2019 | IncY; (gyrA-S83F) |
| 4.3.1.2.1 | SHV-12 | Y | India Argimón et al., 2021a; Chattaway et al., 2021; Ingle et al., 2021; Jacob et al., 2021 | 18 | 2015–20 | IncX3*; qnrB (gyrA-S83F, gyrA-D87N, parC-S80I) |
-
‘Other plasmid/AMR markers’ column includes: (i) plasmid replicons (Inc types) identified in the genome (in bold); (ii) other acquired AMR genes; (iii) chromosomal AMR mutations (in brackets). n.a. indicates susceptibility data not available.
-
*
indicates this plasmid is the reported location of the ESBL gene in the genome assembly.
-
†
n=31 4.3.1.1 .P1 isolates from Pakistan lacked plasmid replicons.
-
‡
the ESBL 4.3.1. isolate from Klemm et al., 2018, was phenotypically third-generation cephalosporin resistant (3GCR), but the one from da Silva et al., 2022, was phenotypically 3GC sensitive.
Additional files
-
Supplementary file 1
Details of local ethical approvals provided for studies that were unpublished at the time of contributing data to this consortium project.
Most data are now published, and the citations for the original studies are provided here. National surveillance programs in Chile (Maes et al., 2022), Colombia (Guevara et al., 2021), France, New Zealand, and Nigeria (Ikhimiukor et al., 2022b) were exempt from local ethical approvals as these countries allow sharing of non-identifiable pathogen sequence data for surveillance purposes. The US CDC Internal Review Board confirmed their approval was not required for use in this project (#NCEZID-ARLT-10/20/21-fa687).
- https://cdn.elifesciences.org/articles/85867/elife-85867-supp1-v1.zip
-
Supplementary file 2
Line list of 13,000 genomes included in the study.
- https://cdn.elifesciences.org/articles/85867/elife-85867-supp2-v1.zip
-
Supplementary file 3
Source information recorded for genomes included in the study.
^Indicates cases included in the definition of ‘assumed acute illness’.
- https://cdn.elifesciences.org/articles/85867/elife-85867-supp3-v1.zip
-
Supplementary file 4
Summary of genomes by country.
- https://cdn.elifesciences.org/articles/85867/elife-85867-supp4-v1.zip
-
Supplementary file 5
Genotype frequencies per region (N, %, 95% confidence interval; annual and aggregated, 2010–2020).
- https://cdn.elifesciences.org/articles/85867/elife-85867-supp5-v1.zip
-
Supplementary file 6
Genotype frequencies per country (N, %, 95% confidence interval; annual and aggregated, 2010–2020).
- https://cdn.elifesciences.org/articles/85867/elife-85867-supp6-v1.zip
-
Supplementary file 7
Antimicrobial resistance (AMR) frequencies per region (N, %, 95% confidence interval; aggregated 2010–2020).
- https://cdn.elifesciences.org/articles/85867/elife-85867-supp7-v1.zip
-
Supplementary file 8
Antimicrobial resistance (AMR) frequencies per country (N, %, 95% confidence interval; annual and aggregated, 2010–2020).
- https://cdn.elifesciences.org/articles/85867/elife-85867-supp8-v1.zip
-
Supplementary file 9
Laboratory code master list.
Three letter laboratory codes assigned by the consortium.
- https://cdn.elifesciences.org/articles/85867/elife-85867-supp9-v1.zip
-
MDAR checklist
- https://cdn.elifesciences.org/articles/85867/elife-85867-mdarchecklist1-v1.pdf
Download links
A two-part list of links to download the article, or parts of the article, in various formats.
Downloads (link to download the article as PDF)
Open citations (links to open the citations from this article in various online reference manager services)
Cite this article (links to download the citations from this article in formats compatible with various reference manager tools)
Global diversity and antimicrobial resistance of typhoid fever pathogens: Insights from a meta-analysis of 13,000 Salmonella Typhi genomes
eLife 12:e85867.
https://doi.org/10.7554/eLife.85867


