Short-range interactions between fibrocytes and CD8+ T cells in COPD bronchial inflammatory response
- Univ-Bordeaux, Centre de Recherche Cardio-thoracique de Bordeaux, U1045, Département de Pharmacologie, CIC1401, Proteomics Facility, France
- INSERM, Centre de Recherche Cardio-thoracique de Bordeaux, U1045, France
- Univ-Lorraine, Institut Elie Cartan de Lorraine, France
- Helmholtz Institute for RNA-based Infection Research (HIRI), Helmholtz-Center for Infection Research (HZI), Germany
- CHU de Bordeaux, Service d’exploration fonctionnelle respiratoire, France
- Univ. Bordeaux, CNRS, INSERM, Bordeaux Imaging Center, France
- Univ. Bordeaux, CNRS, Interdisciplinary Institute for Neuroscience, France
- CNRS, UMR5164 ImmunoConcEpT, Université de Bordeaux, France
- CHU de Bordeaux, Laboratoire d’Immunologie et Immunogénétique, France
Figures
Figure 1 with 4 supplements

Increased interactions between CD8+ T cells, CD45+ FSP1+ cells in distal airways of chronic obstructive pulmonary disease (COPD) patients.
(A, B) Representative stainings of CD8 (brown, A), CD45 (red, B), and FSP1 (green, B) in distal bronchial tissue specimens from a control subject (left) and a COPD patient (right). The yellow arrowheads indicate fibrocytes, defined as CD45+ FSP1+ cells. (C) Quantification of CD8+ T cells and fibrocyte densities (normalized by the sub-epithelial area) in one specimen/patient (n=20 control subjects, n=12 patients with COPD). (D) Merged segmented images for CD8 and CD45-FSP1 staining, showing CD8+ T cells and CD45+ FSP1+ cells, respectively, in magenta and yellow. The white arrows indicate interacting cells, detected by dilatation of CD8 positive particles. (E) Table showing the correspondence between dilatations in pixels and µm. (F) Quantification of interacting cell densities (normalized by the sub-epithelial area) in one specimen/patient, using the different dilatations sizes (E). (G) Distance maps built from the binary image produced from CD8 staining, with FSP1+ CD45+ cells (blue outlines). (H) Quantification of the mean minimal distances between fibrocyte and CD8+ T cells in one specimen/patient. (I) Cluster analysis performed by Delaunay triangulation on segmented images for CD8 and CD45-FSP1 staining, followed by the application of a threshold value (40 μm) above which connections are not kept. CD8+ T cells and fibrocytes appear, respectively, with green and red dots, connections are shown in blue. (J) First row: densities of clusters containing exclusively CD8+ T cells (‘CD8 clusters’), fibrocytes (‘Fib clusters’), and both cell types (‘CD8-Fib clusters’) normalized by the sub-epithelial area in one specimen/patient. Second row: mean number of cells by cluster. (C, F, H, J) The medians are represented as horizontal lines, n=20 specimens from control subjects, n=12 specimens from patients with COPD. *p<0.05, **p<0.01; ***p<0.001. unpaired t-tests or Mann-Whitney tests.
Figure 1—figure supplement 1

Detection of CD8+ T cells, CD45+ FSP1+ cells, and quantification of interacting cells, and the minimal distances between the two cell types.
(A) CD8 (brown) staining of a representative bronchus. (B) CD45 (red) and fibroblast-specific protein 1 (FSP1, green) stainings of the same bronchus. (C, D) The left panels show a higher magnification image (indicated by the boxed regions) of the images in A and B. The lamina propria is shown in light blue. (C) Middle panel: image for CD8 staining obtained after color deconvolution. Right panel: image obtained after segmentation by a binary threshold followed by a watershed transformation to the segmented image. CD8+ T cells are shown in magenta. (D) Middle panels: images for CD45 (top) and FSP1 (bottom) stainings and images obtained after segmentation by a binary threshold. Right panel: segmented image obtained after the combination of CD45 and FSP1 segmented images to select cells dual positive for FSP1 and CD45 double staining, followed by a watershed transformation to separate potential neighboring cells. CD45+ FSP1+ cells are shown in yellow. (E) Top panels: dilatation of each CD8 positive particle with an area greater than 64 µm2. Bottom panels: combination of these modified images with segmented image for dual CD45 FSP1 positive staining (B) to automatically select overlapping dilated CD8+ T cells with CD45+ FSP1+ cells. The white arrow indicates interacting cells. (F) Top panels: a CD8 distance map is built from the binary image produced from CD8 staining. Bottom panels: each area corresponding to a FSP1+ CD45+ cell was reported on the CD8 distance map (blue outlines), and the minimal gray value in each area is measured and converted to a distance, allowing to measure the minimal distance between the CD45+ FSP1+ cell and neighboring CD8+ T cells.
Figure 1—figure supplement 2

Spatial distributions of CD8+ T cells and fibrocytes in the peribronchial area.
(A, B) Quantification of the mean minimal distances between CD8+ T cells (A) and between fibrocytes (B) in one specimen/patient. (C, D) Quantification of the mean minimal distances between CD8+ T cells and the basal membrane (C), and between fibrocytes and the basal membrane (D) in one specimen/patient. (A–D) The medians are represented as horizontal lines, n=20 specimens from control subjects, n=12 specimens from patients with chronic obstructive pulmonary disease (COPD). Mann-Whitney tests. (E, F) Mean frequency distribution of minimal distances (with 5 μm binning) between CD8+ T cells and the basal membrane (E) and between fibrocytes and the basal membrane (F) for control subjects (white) and COPD patients (brown/orange). Error bars indicate the standard error of the mean. Two-way ANOVA for repeated measures: F(23, 696)=0.48, p=0.98 (E), F(23, 696)=1.10, p=0.34 (F).
Figure 1—figure supplement 3

Principle of the use of Delaunay triangulation for cluster analysis.
(A) Binary images for CD8 (left panel) and double CD45-FSP1 (right panel) stainings were obtained after segmentation. (B) Images after Delaunay triangulation, were performed on the centers of mass of CD8+ T cells and fibrocytes and on the points defining area edges. CD8+ T cells and fibrocytes appear, respectively, with red and green dots. The right panel is a higher magnification of the peribronchial area (indicated by the boxed purple region on the left panel). The connections including the points defining area edges are shown in red, all the other connections are shown in blue. (C) Left panel: image with Delaunay triangulation after elimination of the connections including the points defining area edges. The lamina propria is shown in blue. Right panel: image shown on the left panel, after applying a threshold value (40 µm) above which connections are not kept.
Figure 1—figure supplement 4

Relationships between the forced expiratory volume in 1 second (FEV1)/forced vital capacity (FVC) ratio, the density of fibrocytes, the density of interacting cells, the mean minimal distance between fibrocytes and CD8+ T cells, and the density of fibrocytes-CD8+ T cells clusters.
Relationships between the density of CD45+ FSP1+ cells (A), the density of interacting cells (B), the mean minimal distance between fibrocytes and CD8+ T cells (C), the density of mixed cell clusters (D) and the FEV1/FVC ratio measured in control subjects (open circles) and chronic obstructive pulmonary disease (COPD) patients (black circles). The correlation coefficient (R) and significance level (p value) were obtained by using nonparametric Spearman analysis. n=20 specimens from control subjects, n=12 specimens from patients with COPD.
Figure 2 with 1 supplement

CD8+ T cells from chronic obstructive pulmonary disease (COPD) tissue have increased chemoattractive properties for fibrocytes.
(A) Heatmaps showing the expression of differentially expressed genes with p-value <0.05 of chemokines and chemokine receptors in resting tissular tissue-resident memory T-cells (TRM) and effector memory T-cells (TEM) from patients with COPD (n=2 independent samples) in comparison with control subjects (n=2 independent samples) (GEO accession GSE61397). Expression values are expressed as Z-score transformed transcript count. (B) Migration experiment design. (C) Migration of fibrocytes from patients with COPD in response to CD8+ T cells supernatants from control subjects (CtlNS) or COPD patients (COPD). n=6 independent experiments (D) CCL2, CXCL2, and CXCL8 levels in CD8+ T cells supernatants from non-smoking control subjects (CtlNS) or patients with COPD (COPD) using BioPlex (CCL2, CXCL2) or ELISA (CXCL1, 3, 5, 6, 8). n=4 CtlNS samples, n=4 COPD samples. *p<0.05, Mann-Whitney test. (E–F), Migration of fibrocytes from patients with COPD in response to CD8+ T cells supernatants from control subjects (CtlNS) or COPD patients (COPD), in the presence of 200 nM Reparixin (+) or corresponding vehicle (−) (E), and in the presence of 1 µg/mL blocking antibody for CXCL8 (+) or control antibody (−) (F). n=6 independent experiments *p<0.05, Wilcoxon matched pairs test.
Figure 2—figure supplement 1

Transcript levels of adhesion genes in CD8+ T cells from chronic obstructive pulmonary disease (COPD) tissues compared to control tissues.
Heatmaps showing the expression of differentially expressed genes with p-value <0.05 of adhesion molecules and adhesion receptors in resting tissular tissue-resident memory T-cells (TRM) and effector memory T-cells (TEM) from patients with COPD (n=2 independent samples) in comparison with control subjects (n=2 independent samples) (GEO accession GSE61397). Expression values are expressed as Z-score transformed transcript count.
Figure 3 with 5 supplements

CD8+ T cells repeatedly contacts fibrocytes and this contact greatly enhances CD8+ T cell proliferation.
Prior to co-culture, CD8+ T cells have been either non-activated (‘CD8NA’) or activated (‘CD8A’). (A) Representative brightfield images of co-culture between CD8+ T cells and fibrocytes at the initial state of the acquisition (t0) and after 12 hr (t12hr) in both conditions of activation. The orange arrowheads indicate CD8+ T cells (bright round-shaped cells) in contact with fibrocytes (elongated adherent cells). (B) Quantifications of the proportion of fibrocyte-interacting CD8+ T cells at t0 and t12hrin both conditions of activation. (C) Top panel: typical CD8+ T cells trajectory (blue) relative to a fibrocyte (elongated adherent cell) for a period of 140 min. Bottom panel: speed (µm/min) over time for the tracked CD8+ T cell. Short-lived (<12 min, n=4) and longer-lived (>32 min, n=1) contacts are represented, respectively, in light and dark orange. (D) Comparison of the mean speed of individual CD8+ T cells measured in the absence (‘Vfree’) or presence (‘Vcont’) of contact with fibrocytes in both conditions of activation. (E) Mean frequency distributions of contact time duration (with 4 min binning) between CD8+ T cells and fibrocytes for CD8NA (black) and CD8A (gray). Error bars indicate the standard error of the mean. Two-way ANOVA (F–H) Dot plots representing spatiotemporal variables measured for each individual CD8+ T cell tracked over 12 hr. Each dot represents one cell. (F) Contact coefficient. (G) Mean speed of CD8+ T cells measured in the absence of contact with fibrocytes (‘Mean free speed’). (H) Mean speed of CD8+ T cells measured in the presence of contact with fibrocytes (‘Mean contact speed’). (A–H) n=2 independent experiments, n=10 videos by experiments, n=10 CD8+T cells tracked by videos. (I, J, M, N) Representative gating strategy for identification of CD8+ T cells without (w/o) fibrocytes (I, M) or with (w) fibrocytes (J, N) in indirect (I, J) or direct (M, N) co-culture. Left panels: dot plots represent representative CD8-PerCP-Cy5-5 fluorescence (y-axis) versus side scatter (SSC, x-axis) of non-adherent cells removed from the culture. Right panels: histograms represent representative cell count (y-axis) versus Cell Trace-Pacific Blue fluorescence (x-axis). The distinct fluorescence peaks correspond to the different generations of CD8+ T cells. The gate and the percentage indicate cells that have proliferated. (K, O) Comparison of the manual count of non-adherent cells removed from co-culture without fibrocyte (‘CD8’) and with fibrocyte (‘CD8 +F’). L, (P) Comparison of quantifications of CD8+ T cells that have proliferated, removed from co-culture without fibrocyte (‘CD8’) and with fibrocyte (‘CD8 +F’). (I–P) n=6 independent experiments. (B, D, F, G, H, K, L, O, P) Medians are represented as horizontal lines. *p<0.05, *pP<0.01, ***p<0.001. (B, D, K, L, O, P) Wilcoxon matched pairs test. (F, G, H) Mann-Whitney tests.
Figure 3—figure supplement 1

Direct contact between fibrocytes and CD8+ T cells preferentially increases proliferation of naïve CD8+ T cells subset.
Prior to co-culture, CD8+ T cells have been either non-activated (‘CD8NA’) or activated (‘CD8A’). (A, B, C, D) Representative gating strategy for identification of naïve CD8+CD45RA+ cells and memory CD8+CD45RA- CD8+ T cells without (w/o) fibrocytes or with (w) fibrocytes in indirect (A, C) or direct (B, D) co-culture. Dot plots represent representative CD8-PerCP-Cy5-5 fluorescence (y-axis) versus CD45RA-FITC fluorescence (x-axis) of non-adherent cells removed from the culture. (E, G, I, K) Histograms represent representative cell count (y-axis) versus Cell Trace-Pacific Blue fluorescence (x-axis) in naïve CD8+CD45RA+ cells (E, I) and memory CD8+CD45RA- cells (G, K) in co-culture without (w/o) fibrocytes or with (w) fibrocytes in indirect (E, G) or direct (I, K) co-culture. The distinct fluorescence peaks correspond to the different generations of CD8+ T cells. The gate and the percentage indicate cells that have proliferated. (F, H, J, L) Comparison of quantifications of naïve (F, J) and memory (H, L) CD8+ T cells that have proliferated, removed co-culture without fibrocyte (‘CD8’) and with fibrocyte (‘CD8 +F’). n=6 independent experiments. Medians are represented as horizontal lines. *p<0.05, Wilcoxon matched pairs test.
Figure 3—figure supplement 2

CD4+ T cells death and proliferation after 6 days in direct co-culture with fibrocytes.
Prior to co-culture, CD4+ T cells have been either non-activated (‘CD4NA’) or activated (‘CD4A’). (A, B) Representative gating strategy for identification of CD4+ T cells without (w/o) fibrocytes (A) or with (w) fibrocytes (B) in direct co-culture. Left panels: dot plots represent representative CD4-PerCP-Cy5-5 fluorescence (y-axis) versus side scatter (SSC, x-axis) of non-adherent cells removed from the culture. Mid panels: histograms represent representative cell count (y-axis) versus ZombieNIR-APC-Cy7 fluorescence (x-axis). Right panels: histograms represent representative cell count (y-axis) versus Cell Trace-Pacific Blue fluorescence (x-axis). The distinct fluorescence peaks correspond to the different generations of CD4+ T cells. The gate and the percentage indicate cells that have proliferated. (C) Comparison of quantifications of dead CD4+ T cells removed from co-culture without fibrocyte (‘CD4’) and with fibrocyte (‘CD4 +F’). (D) Comparison of quantifications of CD4+ T cells that have proliferated, removed from co-culture. *p<0.05, Wilcoxon matched paired tests.
Figure 3—figure supplement 3

CD8+ T cells death after 6 days of co-culture with fibrocytes.
Prior to co-culture, CD8+ T cells have been either non-activated (‘CD8NA’) or activated (‘CD8A’). (A, C) Representative gating strategy for identification of dead CD8+ T cells without (w/o) fibrocytes (left panels) or with (w) fibrocytes (right panels) in indirect (A) or direct (C) co-culture. Histograms represent representative cell count (y-axis) versus Zombie NIR fluorescence (x-axis). (B, D) Comparison of quantifications of dead CD8+ T cells removed from co-culture without fibrocyte (‘CD8’) and with fibrocyte (‘CD8 +F’) in indirect (B) or direct (D) co-culture. Medians are represented as horizontal lines. *p<0.05, Wilcoxon matched paired tests.
Figure 3—figure supplement 4

Direct contact between fibrocytes and CD8+ T cells promotes phenotypic differences in CD8 expression.
Prior to co-culture, CD8+ T cells have been either non-activated (‘CD8NA’) or activated (‘CD8A’). (A, B, D, E) Representative gating strategy for identification of different CD8+ T cells sub-types without (w/o) fibrocytes (A, D) or with (w) fibrocytes (B, E) in indirect (A, B) or direct (D, E) co-culture. Left panels: dot plots represent representative CD8-PerCP-Cy5-5 fluorescence (y-axis) versus CD45RA-FITC fluorescence (x-axis) of non-adherent cells removed from the culture. CD8+ T cells that express, respectively, low and high levels of CD8 are gated, respectively, in pink (CD8low) and blue (CD8high). Middle panels: histograms represent the proportion of the two different sub-types (CD8low and CD8high) in the total population. Right histograms represent representative cell count (y-axis) versus Cell Trace-Pacific Blue fluorescence (x-axis) for the CD8low population sub-type. The distinct fluorescence peaks correspond to the different generations of CD8+ T cells. The gate and the percentage indicate cells that have proliferated. (C, F) Quantifications of CD8low T cells expressing IFN-γ, TNF-α, Granzyme, IL-10, IL-17 for indirect co-culture (C) and direct co-culture (F) and without (CD8NA or CD8A) or with (CD8NA+F or CD8A+F) fibrocytes. n=6 independent experiments. *p<0.05, Wilcoxon matched pairs test.
Figure 3—figure supplement 5

The CD8low population appears in co-culture and is distinct from the CD45+ Collagen I+ population.
Prior to co-culture, CD8+ T cells have been activated. (A, B, C, D) Experiment design. Pure CD8+ T cells were characterized by flow cytometry for CD8 expression (A) before being were cultured either alone (B) or with fibrocytes (D). Fibrocytes were either cultured alone (C) or with CD8+ T cells (D). (E, F, G, H) Dot plots represent representative CD8-PerCP-Cy5-5 fluorescence (y-axis) versus granularity (Side Scatter, SSC) (x-axis) of cells removed either without trypsinization (E, G) or with trypsinization (F, H) after 6 days in culture/co-culture. (I, J, K, L) Dot plots represent representative Collagen Type I (Coll)-FITC fluorescence (y-axis) versus CD45-APC fluorescence (x-axis) of cells removed either without trypsinization (I, K) or with trypsinization (J, L) after 6 days in culture/co-culture. For conditions with CD8+ T cells only (I), fibrocytes only (J), and adherent cells removed from co-culture (K), the cytographs were generated by gating the total cell population. For non-adherent cells removed from co-culture (L), the cytograph was generated by gating the CD8low population (pink).
Figure 4 with 1 supplement
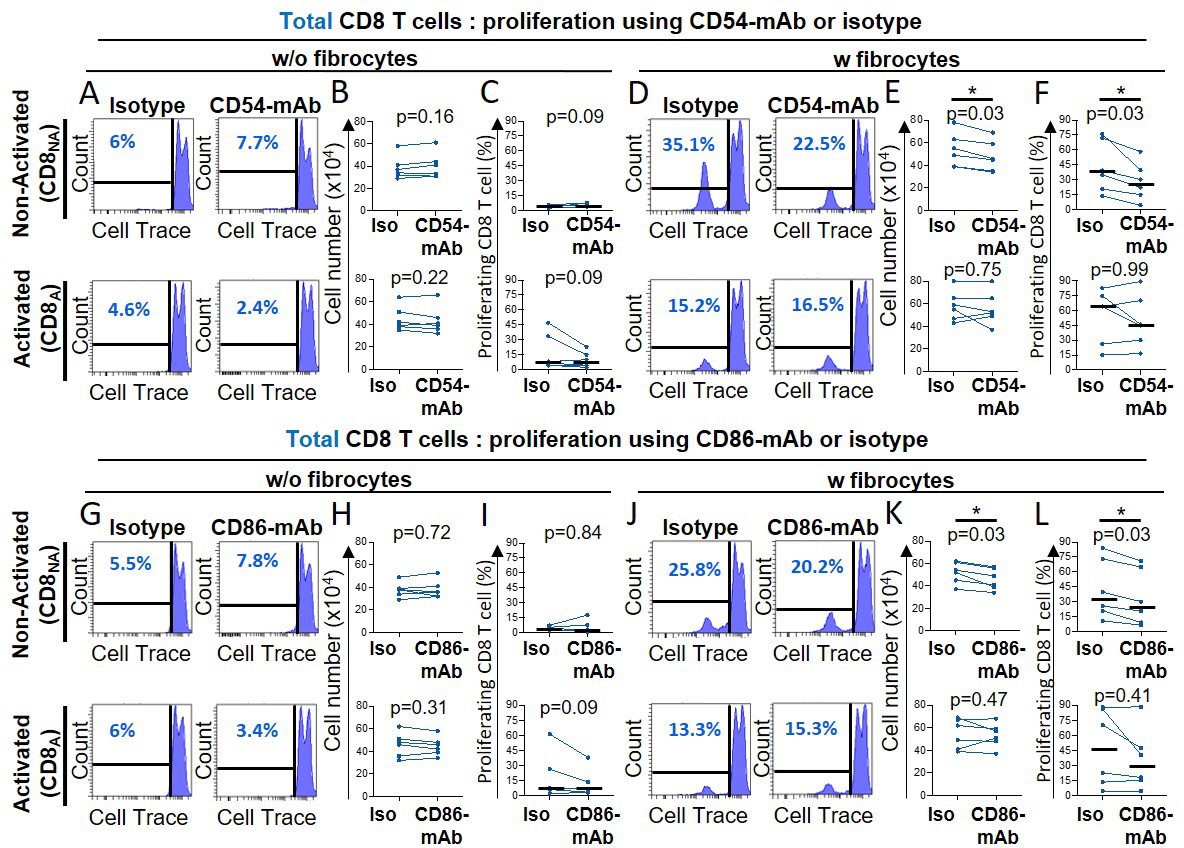
Fibrocytes act as a major promoter of CD8+ T cell proliferation in a CD54 and CD86-dependent manner.
Prior to co-culture, CD8+ T cells have been either non-activated (‘CD8NA’) or activated (‘CD8A’). (A, D, G, J) Representative gating strategy for identification of proliferating CD8+ T cells without (w/o) fibrocytes (A, G) or with (w) fibrocytes (D, J) using neutralizing CD54-mAb (A, D) or neutralizing CD86-mAb (G, J) and respective control isotype. Histograms represent representative cell count (y-axis) versus Cell Trace-Pacific Blue fluorescence (x-axis). The distinct fluorescence peaks correspond to the different generations of CD8+ T cells. The gate and the percentage indicate cells that have proliferated. (B, E, H, K) Comparison of the manual count of non-adherent cells removed from co-culture treated with neutralizing CD54-mAb or control isotype (Iso) (B, E) and neutralizing CD86-mAb or control isotype (Iso) (H, K). (C, F, I, L) Comparison of quantifications of CD8+ T cells that have proliferated, removed from co-culture treated with neutralizing CD54-mAb (C, F) or neutralizing CD86-mAb (I, L) and respective control isotype. n=6 independent experiments. Medians are represented as horizontal lines. *p<0.05, Wilcoxon matched paired tests.
Figure 4—figure supplement 1

LFA-1 or CD44 blockade is not sufficient to decrease CD8+ T cells proliferation induction.
Prior to co-culture, CD8+ T cells have been either non-activated (‘CD8NA’) or activated (‘CD8A’). (A, C, E, G) Representative gating strategy for identification of proliferating CD8+ T cells without (w/o) fibrocytes (A, E) or with (w) fibrocytes (C, G) using neutralizing LFA-1-mAb (A, C) or neutralizing CD44-mAb (E, G) and respective control isotype. Histograms represent representative cell count (y-axis) versus Cell Trace-Pacific Blue fluorescence (x-axis). The distinct fluorescence peaks correspond to the different generations of CD8+ T cells. The gate and the percentage indicate cells that have proliferated. (B, D, F, H) Comparison of quantifications of CD8+ T cells that have proliferated, removed from co-culture treated with neutralizing LFA-1-mAb (B, D) or neutralizing CD44-mAb (F, H) and respective control isotype. (A–D) n=6 independent experiments. *p<0.05, Wilcoxon matched pairs test. (E–H) n=4 independent experiments.
Figure 5 with 1 supplement

Fibrocyte-CD8+ T cell interactions alter cytokine production.
Prior to co-culture, CD8+ T cells have been either non-activated (‘CD8NA’) or activated (‘CD8A’). (A, C) Representative gating strategy for identification of CD8+ T cells expressing IFN- γ, TNF-α, granzyme, IL-10, and IL17 without (w/o) fibrocytes (left panel) or with (w) fibrocytes (right panel) in indirect (A) or direct (C) co-culture. (B, D) Quantifications of CD8+ T cells expressing IFN-γ, TNF- α, both, granzyme and IL-10 after co-culture without fibrocytes (CD8NA/CD8A) or with fibrocytes (CD8NA/CD8A +F) in indirect (B) or direct (D) co-culture. (E) TNF-α concentrations in supernatants from co-cultures without fibrocytes (CD8NA/CD8A), with fibrocyte (CD8NA/CD8A +F), and only with fibrocytes (F) as control, for direct co-cultures. n=6 independent experiments. *p<0.05, Wilcoxon matched paired tests or Friedman tests.
Figure 5—figure supplement 1

Glucocorticoid drugs significantly decrease fibrocyte-induced TNF-α secretion by CD8+ T cells but not the proliferation induction.
Prior to co-culture, CD8+ T cells have been either non-activated or activated. (A, B, C, D) Comparison of quantifications of CD8+ T cells that have proliferated, removed from co-culture without fibrocytes (w/o fibrocytes) (A, C) and with fibrocytes (w fibrocytes) (B, D) for non-activated CD8+ T cells (A, B) or activated ones (C, D) and using fluticasone propionate (Fluti), budesonide (Bud) or vehicle. (E, F, G, H) Secreted TNF-α concentrations in supernatants from co-cultures without fibrocytes (w/o fibrocytes) (E, G) and with fibrocyte (w fibrocytes) (F, H) for non-activated CD8+ T cells (E, F) or activated ones (G, H) and using fluticasone propionate (Fluti), budesonide (Bud) or vehicle. Values below the detection limit were counted as zero. n=6 independent experiments. *p<0.05, Friedman test.
Figure 6

Direct contact between fibrocytes and CD8+ T cells triggers CD8+ T cell cytotoxicity against primary bronchial basal epithelial cells.
(A) Experiment design: CD8+ T cells have been either non-activated (‘CD8NA’) or activated (‘CD8A’) before being co-cultured with fibrocytes. Six days after fibrocytes co-culture, CD8+ T cells were transferred and cultured with primary bronchial basal epithelial cells for 6 hr. (B, C) Representative gating strategy for identification of CD8 T cells expressing CD107a without (w/o) fibrocytes (left panels) or with (w) fibrocytes (right panels). Histograms represent representative cell count (y-axis) versus CD107a fluorescence (x-axis) for total (B) and extracellular expression (C). (D, E) Comparison of quantifications of CD8+ T cells expressing the CD107a, removed from co-culture without fibrocyte (‘CD8’) and with fibrocyte (‘CD8 +F’) for total (D) and extracellular (E) expressions. (F) Representative brightfield images of primary basal epithelial cells co-cultured with CD8+ T cells for 6 hr, following their previous co-culture without (CD8) or with fibrocytes (CD8 +F) for 6 days. (G) Representative gating strategy for identification of apoptotic primary bronchial epithelial basal cells exposed to CD8+ T cells which were previously co-cultured without (CD8, left panel) or with fibrocytes (CD8 +F, right panel). Dot plots represent representative Propidium iodure fluorescence (y-axis) versus Annexin fluorescence (x-axis). (H) Comparison of quantifications of apoptotic primary bronchial epithelial basal cells exposed to CD8 T cells which were previously co-cultured without (CD8) or with fibrocytes (CD8 +F). (D, E, H) Medians are represented as horizontal lines. *p<0.05, Wilcoxon matched paired tests.
Figure 7

Direct contact between fibrocytes and CD8+ T cells favors the acquisition of fibrocyte immune properties.
(A) Experiment design: fibrocytes have been either cultured alone, or with CD8+ T cells that have been previously non-activated (‘CD8NA’) or activated (‘CD8A’). After 6 days of (co)-culture, fibrocyte proteins have been extracted for proteomic analyses. (B) Top 10 Canonical Ingenuity Pathways significantly altered in fibrocytes co-cultured with non-activated CD8+ T cells or activated CD8+ T cells vs fibrocytes cultured alone (‘FNA versus F,’ left graph, ‘FA versus F,’ right graph, respectively, n=4 for each condition), ranked by Z-score, obtained by Gene Set Enrichment Analysis. (C) Heatmaps of significantly differentially regulated proteins in FNA versus F and FA versus F, including proteins related to antigen presentation, co-stimulation and adhesion, remodeling, IFN-γ signaling, and differentiation. The color scale indicates the log2 fold changes of abundance for each protein.
Figure 8 with 2 supplements

A probabilistic cellular automata-type model captures the features of the normal and pathological patterns of cell organization observed in the tissues.
(A) Schematic representation of the probabilities associated with CD8+ T cells (left panel) and fibrocytes (right panel). For each CD8+ T cell, we define a ‘basal’ probability of dying, an increased probability of dying when the CD8+ T cell has many other CD8+ T cells in its neighborhood, a ‘basal’ probability of dividing, an increased probability of dividing when the CD8+ T cell has fibrocytes in its neighborhood, a probability of moving from a site s to a neighboring site s’, a probability to be infiltrated at the stable state and a probability to be infiltrated during exacerbation. For each fibrocyte, we define a probability of dying, a probability of dividing, a probability of moving from a site s to a neighboring site s’, a probability to be infiltrated at the stable state and a probability to be infiltrated during exacerbation. The ≠ symbol indicates parameters whose numerical value differs from control to COPD situation. (B) Selected representative pictures for initial state and final states after 20 years of control and COPD dynamics. Images surrounded by black squares: higher magnifications of peribronchial area. CD8+ T cells and fibrocytes are represented, respectively, by pink and green squares. (C) CD8+ T cells (left) and fibrocyte (right) densities. (D) Interacting cells densities of interacting cells. (E) Mean minimal distances between fibrocyte and CD8+ T cells. (F) CD8+ T cells-fibrocytes-containing clusters (‘CD8-Fib clusters’) densities. (G) mean number of cells by CD8-Fib clusters. (C–G), n=160 simulations for each situation. The medians are represented as horizontal lines. The equivalent measurements measured on the patient’s tissues are represented by gray boxes (25th to the 75th percentile) and whiskers (min to max). ***p<0.001. unpaired t-tests or Mann-Whitney tests. (H, I) Mean kinetics of the populations of CD8+ T cells and fibrocytes in control and COPD situation in silico. Standard deviations are indicated in gray, n=160 simulations. Left panels: and are the number of CD8+ T cells (resp. fibrocytes) that have infiltrated the peribronchial area for the month , relatively to the surface of interest. For fibrocytes, the infiltration at the stable state and during exacerbation are indicated, respectively, in green and light green. For the control situation, there is no infiltration by exacerbation. Midde panels: is the number of CD8+ T cells that have proliferated for the month , relatively to the surface of interest. Basal duplication, fibrocyte-induced duplication and total duplication are indicated, respectively, in pink, light pink, and black. Right panels: and are the number of CD8+ T cells (resp. fibrocytes) that have died for the month , relatively to the surface of interest. For CD8+ T cells, basal death, T cell-induced death, and total death are indicated, respectively, in pink, light pink, and black. (J) Graphs showing the variations of the mean densities of CD8-Fib clusters over time in control (light purple) and COPD situation (dark purple).
Figure 8—figure supplement 1

Minimal intercellular distance distributions are similar between in situ analyses and simulations.
Mean frequency distributions of minimal distances (with 7 μm binning) between fibrocytes and CD8+ T cells for control subjects (white) and patients with chronic obstructive pulmonary disease (COPD) (black), built from in situ analyses (A) and final state of simulations (B). Error bars indicate the standard error of the mean. Two-way ANOVA for repeated measures with Bonferroni post-tests. F(16, 493)=3.2, p<0.0001 (A); F(16, 5406)=140, p<0.0001 (B). p-values of with Bonferroni post-tests are indicated on the figure with the following symbols: **p<0.01, ***p<0.001.
Figure 8—figure supplement 2

Spatial cellular repartition of cells obtained at the final state of simulations are distinct from random distributions.
Final states of the simulations obtained after 20 years of control dynamics and chronic obstructive pulmonary disease (COPD) dynamics are compared to random distributions with indicated fibrocyte and CD8+ T cells numbers. (A) Selected representative picture of the peribronchial area with 118 CD8+ T cells and 19 fibrocytes randomly seeded (initial state for simulations). (B) Selected representative pictures of the peribronchial area with = 136 CD8+ T cells and = 20 fibrocytes. Left panel: random distribution. Right panel: example of distribution obtained after 20 years of control dynamics. (C) Selected representative pictures of the peribronchial area with = 214 CD8+ T cells and = 37 fibrocytes. Left panel: random distribution. Right panel: example of distribution obtained after 20 years of COPD dynamics. (A–C), Images surrounded by black squares: higher magnifications of peribronchial area. CD8+ T cells and fibrocytes are represented, respectively, by pink and green squares. (D), CD8+ T cells (left) and fibrocyte (right) densities. (E) Interacting cells densities of interacting cells. (F) Mean minimal distances between fibrocyte and CD8+ T cells. (G) CD8+ T cells-fibrocytes-containing clusters (‘CD8-Fib clusters’) densities. (H) Mean number of cells by CD8-Fib clusters. (C–G) n=160 simulations for each situation. The medians are represented as horizontal lines. *p<0.05, ***p<0.001. unpaired t-tests or Mann-Whitney tests.
Figure 9

The outcomes of therapeutic interventions are predicted by simulations.
(A) Schematic representation of the design used to test therapeutic strategies. Chronic obstructive pulmonary disease (COPD) states were first generated by applying COPD dynamics for 20 years (n=144 simulations). Then, different dynamics were applied for 7 years: COPD dynamics (corresponding to the placebo condition), control dynamics (corresponding to an ideal treatment able to restore all cellular processes, ‘Total inhibition’), and modified COPD dynamics (corresponding to CD54, CXCR1/2, and dual inhibitions with alterations of the probability of dividing when the CD8+ T cell has fibrocytes in its neighborhood, the probability for a fibrocyte to move, and both, respectively). (B) CD8+ T cells (left), fibrocyte (middle), and CD8+ T cells-fibrocytes-containing clusters (‘CD8-Fib clusters,’ right) densities at the final state (t=7 years). The medians are represented as horizontal lines. One-way ANOVA with Tukey’s post-tests. p-values below 0.05 with Tukey’s post-tests are indicated on the graphs, except for the comparisons between the condition ‘Total inhibition’ and the other conditions of inhibition, that are not indicated. (C–D) Mean kinetics of the populations of CD8+ T cells and fibrocytes in the different conditions (t=0–7 years). Left panels: and are the number of CD8+ T cells (resp. fibrocytes) that have infiltrated the peribronchial area for the month , relatively to the surface of interest. For fibrocytes, the infiltration at the stable state and during exacerbation are indicated, respectively, in green and light green. For the total inhibition situation, there is no infiltration by exacerbation. Midde panels: is the number of CD8+ T cells that have proliferated for the month , relatively to the surface of interest. Basal duplication, fibrocyte-induced duplication, and total duplication are indicated, respectively, in pink, light pink, and black. Right panels: and are the number of CD8+ T cells (resp. fibrocytes) that have died for the month , relatively to the surface of interest. For CD8+ T cells, basal death, T cell-induced death, and total death are indicated, respectively, in pink, light pink, and black. (E) Mean kinetics of the densities of CD8-Fib clusters in the different conditions (t=0–7 years). (C–E) Standard deviations are indicated in gray, n=144 simulations.
Figure 10

Proposed model of how fibrocytes interact with CD8+ T cells in the context of chronic obstructive pulmonary disease (COPD).
Fibrocyte chemotaxis towards CD8+ T cells is mainly due to an increased CXCL8 secretion by CD8+ T cells in COPD lungs, and promotes direct contact between both cell types. This interaction triggers CD8+ T cell proliferation, cytokine production, and cytotoxic activity. The interaction and its consequences might be further increased by a reinforcement of IFN-γ signaling and expression of molecules belonging to the immune synapse, from the fibrocyte side.
Appendix 1—figure 1

The lamina propria forms two 2-dimensional crown shapes in the bronchial wall, between the bronchial epithelium and the smooth muscle layer.
Adapted from Dupin et al., 2023.
Appendix 1—figure 2

Schematic representation showing the neighborhood at the site s (shaded blue).
Appendix 1—figure 3

Cell death rules.
σ has to be taken equal to three neighbors. F and C cells are indicated by, respectively, green and pink squares. Adapted from Dupin et al., 2023.
Appendix 1—figure 4

The different cases for C cell proliferation rules.
λ has to be taken equal to three neighbors. F and C cells are indicated by, respectively, green and pink squares. Adapted from Dupin et al., 2023.
Appendix 1—figure 5

C and F cell infiltration rules at the stable state.
F and C cells are indicated by, respectively, green and purple squares. Adapted from Dupin et al., 2023.
Appendix 1—figure 6
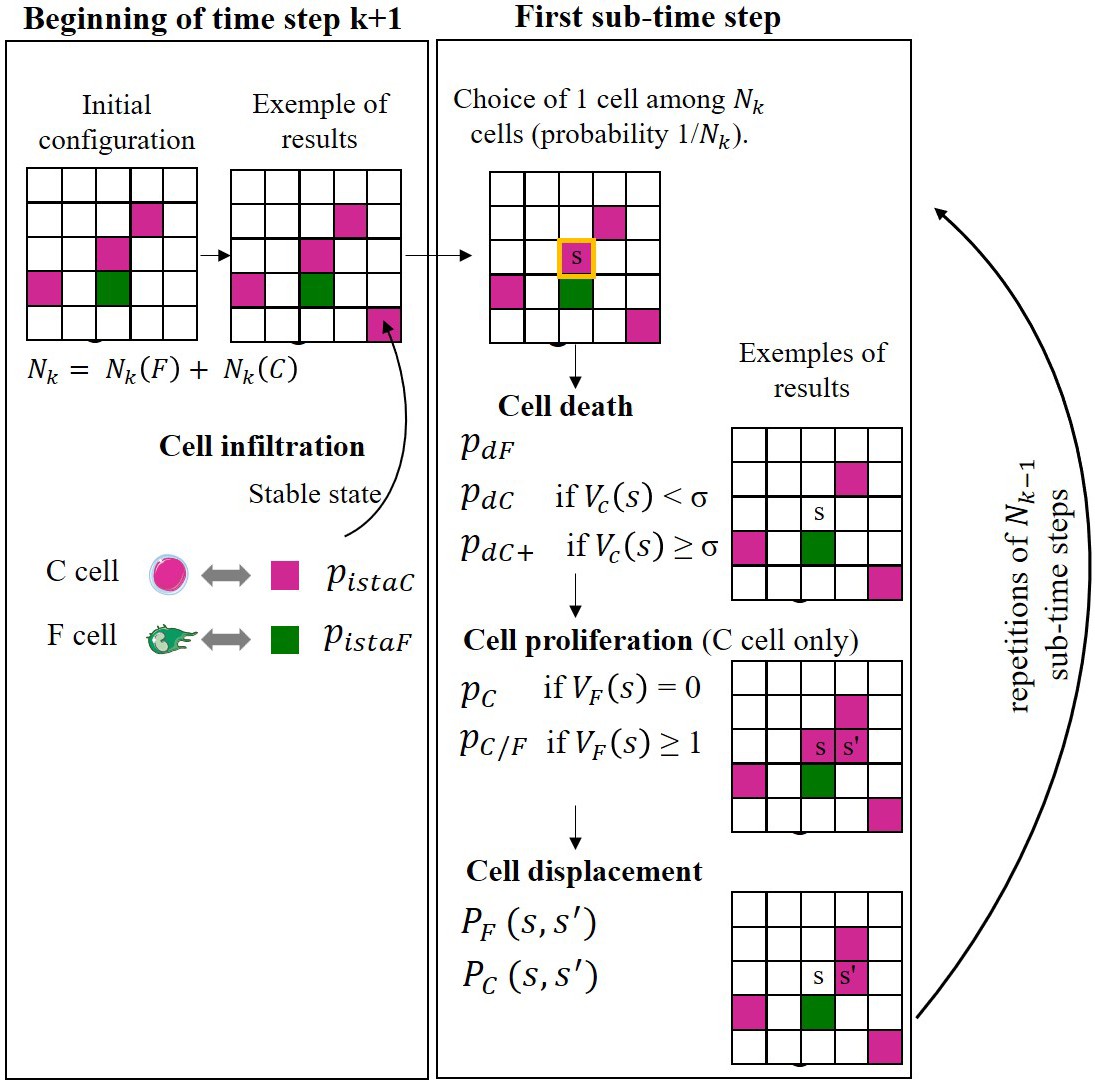
Examples of cell infiltration, death, proliferation, and displacement of cells at each time step.
We consider the beginning of the time step . This period is divided into sub-time steps, where is the number of cells at the beginning of period . F and C cells are indicated by, respectively, green and purple squares. Adapted from Dupin et al., 2023.
Appendix 1—figure 7

F Cell displacement rules.
F and C cells are indicated by, respectively, green and pink squares. has been taken equal to 10–3.
Appendix 1—figure 8

C Cell displacement rules.
F and C cells are indicated by, respectively, green and pink squares. has been taken equal to 10–3. Adapted from Dupin et al., 2023.
Author response image 1

Expression of CXC chemokines in lung CD8+ CD103+ and CD8+ CD103- T cells from patients with COPD (n=18 independent samples) in comparison with healthy control subjects (n=29 independent samples) under resting conditions by Single-Cell RNA sequencing analysis (GEO accession GSE136831).
The heatmaps show the normalized expression of genes (horizontal axes) encoding CXC chemokines. PF4=CXCL4, PPBP = CXCL7.
Videos
Video 1
Two days after adding non-activated CD8+ T cells (bright round cells) on fibrocytes (adherent elongated cells), phase-contrast images of co-culture taken were recorded every 2 min.
A tracked lymphocyte is indicated by a blue dot and its trajectory is shown by a blue line dot (Manual Tracking plugin, Fiji software).
Video 2
Cell dynamics within the peribronchial area, 2 years after the initial time, with control dynamics.
Images of the simulations were recorded every 3 min for 24 hr. CD8+ T cells and fibrocytes are represented, respectively, by pink and green squares. control (resp. COPD) situation.
Video 3
Cell dynamics within the peribronchial area, 2 years after the initial time, with chronic obstructive pulmonary disease (COPD) dynamics.
Images of the simulations were recorded every 3 min for 24 hr. CD8+ T cells and fibrocytes are represented, respectively, by pink and green squares. control (resp. COPD) situation.
Video 4
Cell dynamics within the peribronchial area, 7 years after the initial time, with control dynamics.
Images of the simulations were recorded every 3 min for 24 hr. CD8+ T cells and fibrocytes are represented, respectively, by pink and green squares. control (resp. COPD) situation.
Video 5
Cell dynamics within the peribronchial area, 7 years after the initial time, with chronic obstructive pulmonary disease (COPD) dynamics.
Images of the simulations were recorded every 3 min for 24 hr. CD8+ T cells and fibrocytes are represented, respectively, by pink and green squares. control (resp. COPD) situation.
Tables
Key resources table
| Reagent type (species) or resource | Designation | Source or reference | Identifiers | Additional information |
|---|---|---|---|---|
| Antibody | Anti-CD8 (rabbit monoclonal) | Fisher Scientific | Cat. #:MA5-14548, RRID:AB_10984334 | IHC (1:200) |
| Antibody | Anti-rabbit-HRP (goat polyclonal) | Nichirei Biosciences | Cat. #:414141 F, RRID:N/A | IHC (1:200) |
| Antibody | Anti-CD45 (mouse monoclonal) | BD Biosciences | Cat. #:555480, RRID: AB_395872 | IHC (1:50) |
| Antibody | Anti-FSP1 (rabbit polyclonal) | Agilent | Cat. #:A5114, RRID: AB_2335679 | IHC (1:200) |
| Antibody | Anti-mouse-Alexa568 (goat polyclonal) | Fisher Scientific | Cat. #:A-11004, RRID:AB_2534072 | IHC (1:50) |
| Antibody | Anti-rabbit-Alexa488 (goat polyclonal) | Fisher Scientific | Cat. #:A-11008, RRID:AB_143165 | IHC (1:200) |
| Antibody | Anti-LFA-1 (mouse monoclonal) | BioLegend | Cat. #:301233, RRID:AB_2832576 | Blocking experiment (1 µg/mL) |
| Antibody | Anti-CD54 (mouse monoclonal) | Fisher Scientific | Cat. #:15247027, RRID:N/A | Blocking experiment (10 µg/mL) |
| Antibody | Anti-CD86 (mouse monoclonal) | Fisher Scientific | Cat. #:15297097, RRID:N/A | Blocking experiment (10 µg/mL) |
| Antibody | Anti-CD44 (rabbit monoclonal) | Fisher Scientific | Cat. #:15266957, RRID:N/A | Blocking experiment (10 µg/mL) |
| Antibody | Anti-CXCL8 (mouse monoclonal) | BioTechne | Cat. #:MAB208-100, RRID:N/A | Blocking experiment (1 µg/mL) |
| Antibody | Anti-CD4-PerCP-Vio700 (human recombinant monoclonal) | Miltenyi Biotec | Cat. #:130-113-228, RRID:AB_2726039 | FC (1:50) |
| Antibody | Anti-CD8-PerCP-Vio700 (human recombinant monoclonal) | Miltenyi Biotec | Cat. #:130-110-682, RRID:AB_2659249 | FC (1:50) |
| Antibody | Anti-CD45RA-FITC (human recombinant monoclonal) | Miltenyi Biotec | Cat. #:130-113-365, RRID:AB_2726135 | FC (1:50) |
| Antibody | Anti-granzyme-APC (human recombinant monoclonal) | Miltenyi Biotec | Cat. #:130-099-780, RRID:AB_2651900 | FC (1:20) |
| Antibody | Anti-TNF- α-PE (human recombinant monoclonal) | Miltenyi Biotec | Cat. #:130-110-066, RRID:AB_2654213 | FC (1:20) |
| Antibody | Anti IFN- γ-APC (human recombinant monoclonal) | Miltenyi Biotec | Cat. #:130-113-496, RRID:AB_2751119 | FC (1:20) |
| Antibody | Anti-IL-17-PE-Cy7 (mouse monoclonal) | Miltenyi Biotec | Cat. #:130-120-413, RRID:AB_2752086 | FC (1:20) |
| Antibody | Anti-IL-10-PE (human recombinant monoclonal) | Miltenyi Biotec | Cat. #:130-112-728, RRID:AB_2652318 | FC (1:20) |
| Antibody | Anti-Collagen Type I-FITC (mouse monoclonal) | Sigma Aldrich | Cat. #:FCMAB412F, RRID:AB_11204160 | FC (1:50) |
| Antibody | Anti-CD45-APC (mouse monoclonal) | BD Pharmingen | Cat. #:555485, RRID:AB_398600 | FC (1:10) |
| Antibody | Anti-CXCR1-PE (human recombinant monoclonal) | Miltenyi Biotec | Cat. #:130-115-879, RRID:AB_2727234 | FC (1:50) |
| Antibody | Anti-CXCR2-APC-Cy7 (human recombinant monoclonal) | Miltenyi Biotec | Cat. #:130-119-571, RRID:AB_2733103 | FC (1:50) |
Additional files
-
Supplementary file 1
Association between the density of fibrocytes and clinical characteristics.
FEV1, forced expiratory volume in 1 s; FVC, forced vital capacity; LFT, lung function test; RV, residual volume; TLCO, Transfer Lung capacity of Carbon monoxide, PaO2, partial arterial oxygen pressure, PaCO2, partial arterial carbon dioxide pressure; WA, mean wall area; LA, mean lumen area, WA%, mean wall area percentage; WT, wall thickness; LAA, low-attenuation area; MLA E or I, mean lung attenuation value during expiration or inspiration. MLA I-E, the difference between inspiratory and expiratory mean lung attenuation value. %CSA<5, percentage of total lung area taken up by the cross-sectional area of pulmonary vessels less than 5 mm2; %CSA5–10, percentage of total lung area taken up by the cross-sectional area of pulmonary vessels between 5 and 10 mm2; CSN<5, number of vessels less than 5 mm2 normalized by total lung area; CSN5-10, number of vessels between 5 and 10 mm2 normalized by total lung area; NR: not relevant. The correlation coefficient (r), 95% confidence interval, and significance level (p value), were obtained by using nonparametric Spearman analysis.
- https://cdn.elifesciences.org/articles/85875/elife-85875-supp1-v1.docx
-
Supplementary file 2
Association between the density of CD8+ T cells and clinical characteristics.
FEV1, forced expiratory volume in 1 second; FVC, forced vital capacity; LFT, lung function test; RV, residual volume; TLCO, Transfer Lung capacity of Carbon monoxide, PaO2, partial arterial oxygen pressure, PaCO2, partial arterial carbon dioxide pressure; WA, mean wall area; LA, mean lumen area, WA%, mean wall area percentage; WT, wall thickness; LAA, low-attenuation area; MLA E or I, mean lung attenuation value during expiration or inspiration. MLA I-E, the difference between inspiratory and expiratory mean lung attenuation value. %CSA<5, percentage of total lung area taken up by the cross-sectional area of pulmonary vessels less than 5 mm2; %CSA5–10, percentage of total lung area taken up by the cross-sectional area of pulmonary vessels between 5 and 10 mm2; CSN<5, number of vessels less than 5 mm2 normalized by total lung area; CSN5-10, number of vessels between 5 and 10 mm2 normalized by total lung area; NR: not relevant. The correlation coefficient (r), 95% confidence interval, and significance level (p value), were obtained by using nonparametric Spearman analysis.
- https://cdn.elifesciences.org/articles/85875/elife-85875-supp2-v1.docx
-
Supplementary file 3
Association between interacting cell density and clinical characteristics.
FEV1, forced expiratory volume in 1 s; FVC, forced vital capacity; LFT, lung function test; RV, residual volume; TLCO, Transfer Lung capacity of Carbon monoxide, PaO2, partial arterial oxygen pressure, PaCO2, partial arterial carbon dioxide pressure; WA, mean wall area; LA, mean lumen area, WA%, mean wall area percentage; WT, wall thickness; LAA, low-attenuation area; MLA E or I, mean lung attenuation value during expiration or inspiration. MLA I-E, the difference between inspiratory and expiratory mean lung attenuation value. %CSA<5, percentage of total lung area taken up by the cross-sectional area of pulmonary vessels less than 5 mm2; %CSA5–10, percentage of total lung area taken up by the cross-sectional area of pulmonary vessels between 5 and 10 mm2; CSN<5, number of vessels less than 5 mm2 normalized by total lung area; CSN5-10, number of vessels between 5 and 10 mm2 normalized by total lung area; NR: not relevant. The correlation coefficient (r), 95% confidence interval, and significance level (p value), were obtained by using nonparametric Spearman analysis.
- https://cdn.elifesciences.org/articles/85875/elife-85875-supp3-v1.docx
-
Supplementary file 4
Association between the mean minimal distance between fibrocytes and CD8+ T cells and clinical characteristics.
FEV1, forced expiratory volume in 1 s; FVC, forced vital capacity; LFT, lung function test; RV, residual volume; TLCO, Transfer Lung capacity of Carbon monoxide, PaO2, partial arterial oxygen pressure, PaCO2, partial arterial carbon dioxide pressure; WA, mean wall area; LA, mean lumen area, WA%, mean wall area percentage; WT, wall thickness; LAA, low-attenuation area; MLA E or I, mean lung attenuation value during expiration or inspiration. MLA I-E, the difference between inspiratory and expiratory mean lung attenuation value. %CSA<5, percentage of total lung area taken up by the cross-sectional area of pulmonary vessels less than 5 mm2; %CSA5–10, percentage of total lung area taken up by the cross-sectional area of pulmonary vessels between 5 and 10 mm2; CSN<5, number of vessels less than 5 mm2 normalized by total lung area; CSN5-10, number of vessels between 5 and 10 mm2 normalized by total lung area; NR: not relevant. The correlation coefficient (r), 95% confidence interval, and significance level (p value), were obtained by using nonparametric Spearman analysis.
- https://cdn.elifesciences.org/articles/85875/elife-85875-supp4-v1.docx
-
Supplementary file 5
Association between the density of mixed cell clusters and clinical characteristics.
FEV1, forced expiratory volume in 1 s; FVC, forced vital capacity; LFT, lung function test; RV, residual volume; TLCO, Transfer Lung capacity of Carbon monoxide, PaO2, partial arterial oxygen pressure, PaCO2, partial arterial carbon dioxide pressure; WA, mean wall area; LA, mean lumen area, WA%, mean wall area percentage; WT, wall thickness; LAA, low-attenuation area; MLA E or I, mean lung attenuation value during expiration or inspiration. MLA I-E, the difference between inspiratory and expiratory mean lung attenuation value. %CSA<5, percentage of total lung area taken up by the cross-sectional area of pulmonary vessels less than 5 mm2; %CSA5–10, percentage of total lung area taken up by the cross-sectional area of pulmonary vessels between 5 and 10 mm2; CSN<5, number of vessels less than 5 mm2 normalized by total lung area; CSN5-10, number of vessels between 5 and 10 mm2 normalized by total lung area; NR: not relevant. The correlation coefficient (r), 95% confidence interval, and significance level (p value), were obtained by using nonparametric Spearman analysis.
- https://cdn.elifesciences.org/articles/85875/elife-85875-supp5-v1.docx
-
Supplementary file 6
Multivariate analysis of FEV1/FVC.
FEV1, forced expiratory volume in 1 s; FVC, forced vital capacity.
- https://cdn.elifesciences.org/articles/85875/elife-85875-supp6-v1.docx
-
Supplementary file 7
Patient characteristics (for tissular CD8+ T cells purification).
Plus–minus values are means ± SD. PFT, pulmonary function test; FEV1, forced expiratory volume in 1 s; FVC, forced vital capacity.
- https://cdn.elifesciences.org/articles/85875/elife-85875-supp7-v1.docx
-
Supplementary file 8
Patient characteristics (for circulating CD8+/CD4+ T cells and fibrocyte precursors purification).
Plus–minus values are means ± SD. PFT, pulmonary function test; FEV1, forced expiratory volume in 1 s; FVC, forced vital capacity; PaO2, partial arterial oxygen pressure, PaCO2, partial arterial carbon dioxide pressure.
- https://cdn.elifesciences.org/articles/85875/elife-85875-supp8-v1.docx
-
Supplementary file 9
Patient characteristics (for basal bronchial epithelial cell purification).
Plus–minus values are means ± SD. PFT, pulmonary function test; FEV1, forced expiratory volume in 1 s; FVC, forced vital capacity.
- https://cdn.elifesciences.org/articles/85875/elife-85875-supp9-v1.docx
-
Supplementary file 10
Definition of the notations and parameters of the mathematical model.
- https://cdn.elifesciences.org/articles/85875/elife-85875-supp10-v1.docx
-
Supplementary file 11
Numerical values of parameters depending in control and COPD situations.
- https://cdn.elifesciences.org/articles/85875/elife-85875-supp11-v1.docx
-
MDAR checklist
- https://cdn.elifesciences.org/articles/85875/elife-85875-mdarchecklist1-v1.pdf
-
Source code 1
Program to simulate CD8+ T cells and fibrocytes evolution in the peribronchial area.
- https://cdn.elifesciences.org/articles/85875/elife-85875-code1-v1.zip
Download links
A two-part list of links to download the article, or parts of the article, in various formats.
Downloads (link to download the article as PDF)
Open citations (links to open the citations from this article in various online reference manager services)
Cite this article (links to download the citations from this article in formats compatible with various reference manager tools)
Short-range interactions between fibrocytes and CD8+ T cells in COPD bronchial inflammatory response
eLife 12:RP85875.
https://doi.org/10.7554/eLife.85875.3


