Id2 GABAergic interneurons comprise a neglected fourth major group of cortical inhibitory cells
- Neuroscience Institute, New York University Grossman School of Medicine, United States
- Center for Neural Science, New York University, United States
- Department of Neuroscience and Physiology, New York University Grossman School of Medicine, United States
- Department of Anesthesiology, Perioperative Care and Pain Medicine, New York University Grossman School of Medicine, United States
Figures
Figure 1 with 5 supplements
Id2 expression delineates a fourth major group of INs.
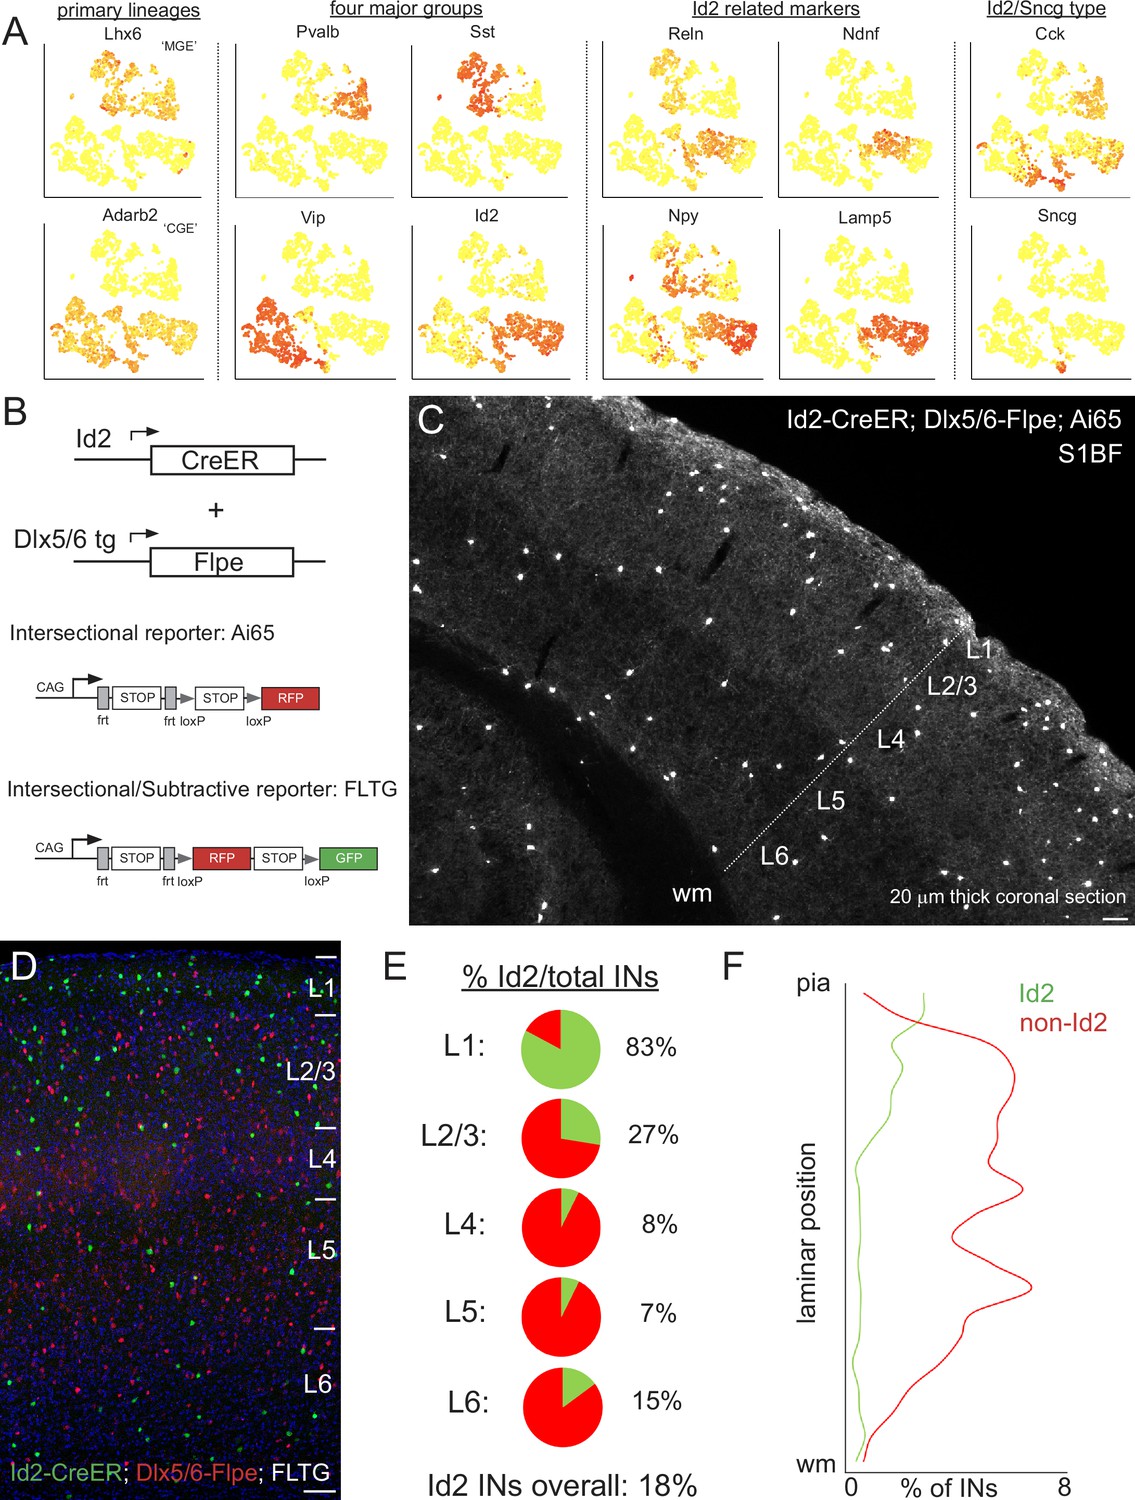
(A) Public scRNAseq data (from Tasic et al., 2016; comprised of ~3000 INs purified from the visual cortex, with transcriptome diversity represented as tSNE plots; see Mayer et al., 2018) underlying the hypothesis that the non-VIP CGE-derived IN population can be distinguished by the expression of Id2. Primary IN lineages originating from the medial (MGE) and caudal (CGE) ganglionic eminences express Lhx6 and Adarb2, respectively. To a first approximation, MGE-derived INs are comprised of parvalbumin (Pvalb) and somatostatin (Sst) subtypes, whereas CGE-derived INs consist of vasoactive intestinal peptide (Vip) and inhibitor of DNA binding 2 (Id2) subtypes. Expression of the marker genes Reelin (Reln), neuron-derived neurotrophic factor (Ndnf), neuropeptide Y (Npy) and cholecystokinin (Cck) is evident within the Id2 population, which roughly corresponds to the lysosomal associated membrane protein 5 (Lamp5) plus synuclein-γ (Sncg) IN categories in Tasic et al., 2016. (B) Intersectional genetic strategies for targeting Id2 INs. The Id2-CreER knock in driver line combined with the Dlx5/6-Flpe transgenic line allows for labeling of Id2 INs with tdTomato when crossed with the Ai65 intersectional reporter (or the channelrhodopsin CatCh when crossed with Ai80). The use of the intersectional/subtractive reporter FLTG enables the dual color labeling of Id2 and non-Id2 INs. (C) Image of a coronal cryosection (20 μm thick) of an Id2-CreER; Dlx5/6-Flpe; Ai65 labeled brain (P30) reveals the distribution of Id2 INs throughout the layers of the cortical S1 barrel field (S1BF). (D) Image of a coronal field in S1BF of Id2-CreER; Dlx5/6-Flpe; FLTG labeled brain with Id2 INs in green and non-Id2 INs in red. (E) Proportion of Id2 vs. non-Id2 INs across the layers of S1BF determined from cell counts of the cross in (D). Id2 INs comprise 18% of the overall IN population (3812 cells counted across 4 brains; see also Figure 1—source data 1). (F) Distribution of Id2 and non-Id2 IN somas across S1BF lamina. Scale bars in panels C and D represent 100 μm.
-
Figure 1—source data 1
Id2 vs. non-Id2 cell counts in S1BF.
Counts of Id2 (green) and non-Id2 (red) cells from pia to white matter in Id2-CreER; Dlx5/6-Flpe; FLTG S1BF sections (n=4 brains). Each of the 20 bins used for counting were assigned to 6 layers based on the corresponding depth for the pie charts presented in the main figure.
- https://cdn.elifesciences.org/articles/85893/elife-85893-fig1-data1-v2.xlsx
Figure 1—figure supplement 1
IN scRNAseq gene expression heat maps.
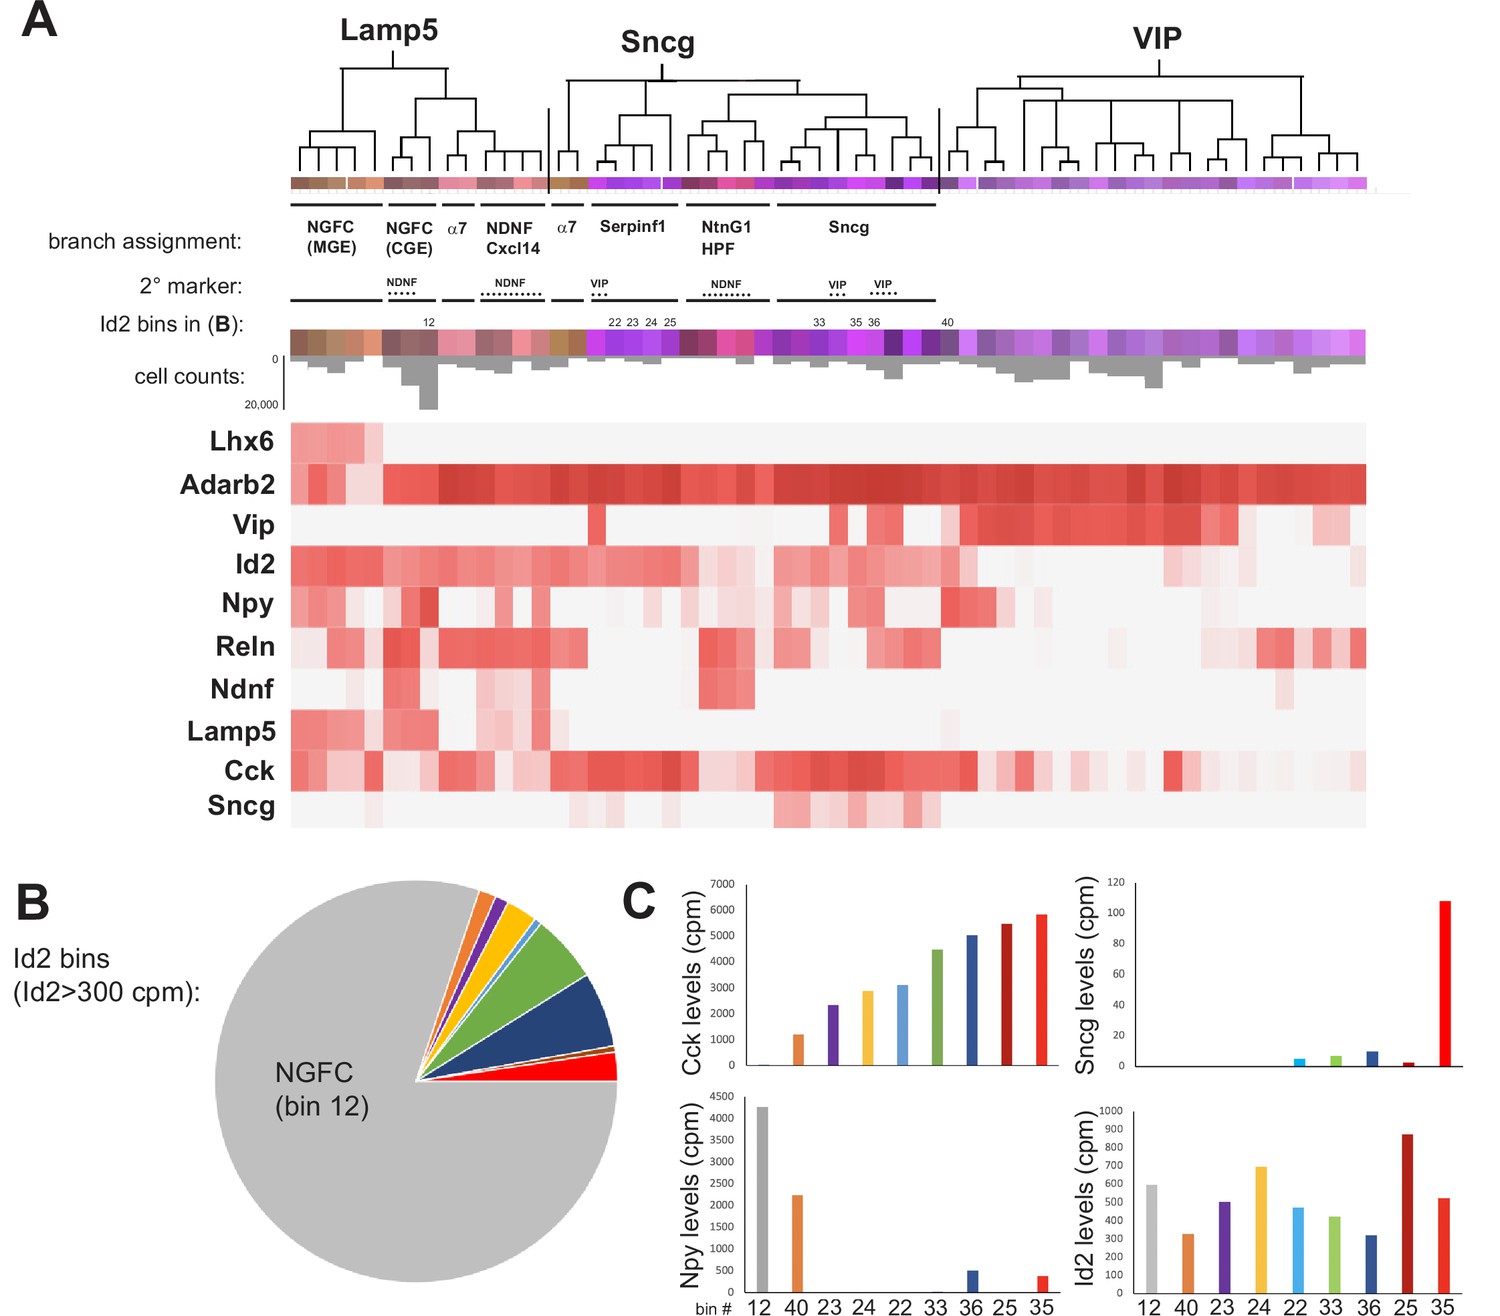
(A) Annotated dendrogram and gene expression heat maps based on combined cortical and hippocampal IN scRNAseq data published by the Allen Institute (Yao et al., 2021; portal.brain-map.org/atlases-and-data/rnaseq). Heat maps illustrate mRNA expression levels (trimmed mean (25%–75%) LOG2(CPM + 1)) for each gene listed: Lhx6 (pan-MGE), Adarb2 (pan-CGE), Vip, Id2, Npy, Reln, Ndnf, Lamp5, Cck, and Sncg. Based on our interpretation of these and other gene expression patterns, we added assignments beneath the major branches of the dendrogram to indicate the putative IN subtypes that correspond with each set of color-coded bins. The annotated dendrogram has been adapted from Figure 2A from Yao et al., 2021. The heat maps are reproduced from the Allen Institute for Brain Science, Allen Brain Map, available from https://portal.brain-map.org/atlases-and-data/rnaseq, scRNAseq portal https://celltypes.brain-map.org/rnaseq/mouse_ctx-hpf_10x. (B) Pie chart of the nine IN bins (numbered in (A)) where trimmed mean Id2 mRNA levels are >300 counts per million illustrates the main populations in L2-6 that are expected to be labeled in the Id2-CreER; Dlx5/6-Flpe; Ai65 intersectional cross. NDNF and α7 bins were excluded since these cells are primarily located in L1. Cells in the NGFC (MGE) branch (i.e. Lamp5/Lhx6) and NtnG1 HPF branch were also excluded since these cells are almost entirely located in the hippocampus. The number of cells in each bin was obtained from the Allen scRNAseq data portal (portal.brain-map.org/altlases-and-data/rnaseq) and includes cells isolated from throughout the cortex and hippocampus. (C) Plots of expression levels (counts per million) of Cck, Sncg, Npy, and Id2 transcripts across the nine Id2 IN bins shown in (B). Cck exhibits variable levels of expression across the non-NGFC bins, with the highest levels in bin 35. Sncg is weakly expressed or absent in all but bin 35. Bin 12 (NGFC) shows the highest Npy level, as expected. See also Figure 1—figure supplement 1—source data 1.
© 2023, Allen Institute for Brain Science. The heat maps in panel A are reproduced from the Allen Institute for Brain Science, Allen Brain Map, available from https://portal.brain-map.org/atlases-and-data/rnaseq, scRNAseq portal https://celltypes.brain-map.org/rnaseq/mouse_ctx-hpf_10x. All rights reserved. Further reproduction of this panel would need permission from the copyright holder.
-
Figure 1—figure supplement 1—source data 1
mRNA counts in Id2 cells.
Transcriptome data represented as trimmed mean (25–75%) LOG2(CPM +1) from the Allen Institute (https://portal.brain-map.org/atlases-and-data/rnaseq) was used to calculate raw mRNA levels (cpm) from each Id2 bin (Id2 mRNA levels >300 cpm) for the genes indicated. The number of cells in each bin from their analysis was used to generate the pie chart in the figure. The main NGFC bin (bin 12) is highlighted in the excel file.
- https://cdn.elifesciences.org/articles/85893/elife-85893-fig1-figsupp1-data1-v2.xlsx
Figure 1—figure supplement 2
Prevalence and distribution of Id2 INs in prelimbic cortex.
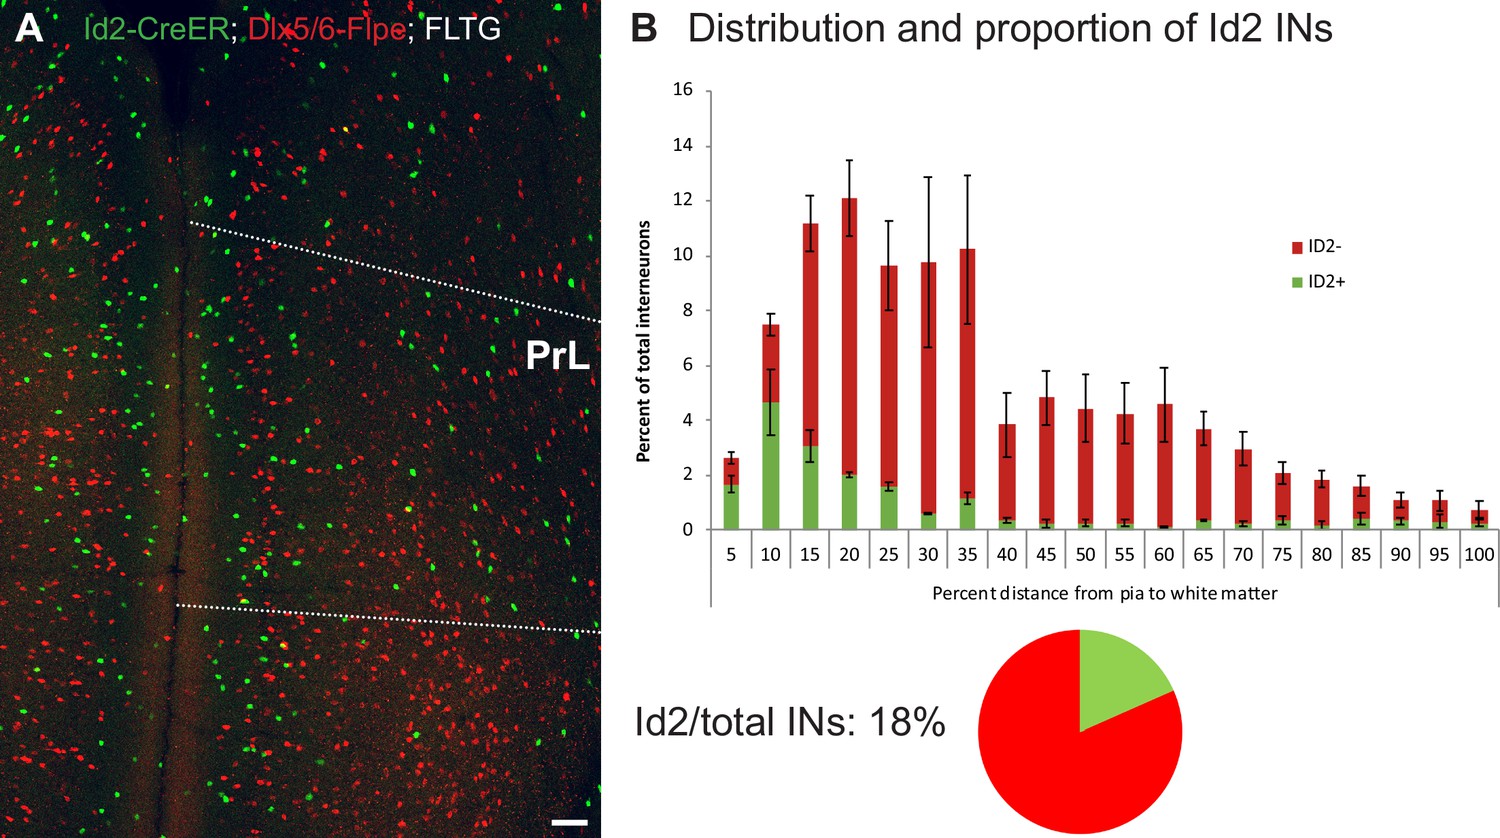
(A) Representative image of dual color labeling of Id2 INs (green) and non-Id2 INs (red) in the mPFC of the Id2-CreER; Dlx5/6-Flpe; FLTG cross. The prelimbic area (PrL) is denoted by the white dotted lines. The scale bar indicates 100 μm. (B) Quantification of the distribution and proportion of Id2 INs in PrL. Due to the difficulty in identifying precise layer boundaries in PrL, green and red cells were counted across 20 equally spaced bins across the pia to the white matter (438/2424 cells counted; n=3 brains; error bars indicate SEM). The overall fraction of Id2 INs/total INs was 18% (represented as a pie chart). See also Figure 1—figure supplement 2—source data 1.
-
Figure 1—figure supplement 2—source data 1
Id2 vs. non-Id2 cell counts in PrL.
Counts of Id2 (green) and non-Id2 (red) cells from pia to white matter in Id2-CreER; Dlx5/6-Flpe; FLTG PrL sections (n=4 brains), across 20 evenly spaced bins.
- https://cdn.elifesciences.org/articles/85893/elife-85893-fig1-figsupp2-data1-v2.xlsx
Figure 1—figure supplement 3
Id2 INs show little overlap with Nkx2.1-lineage or VIP cells.
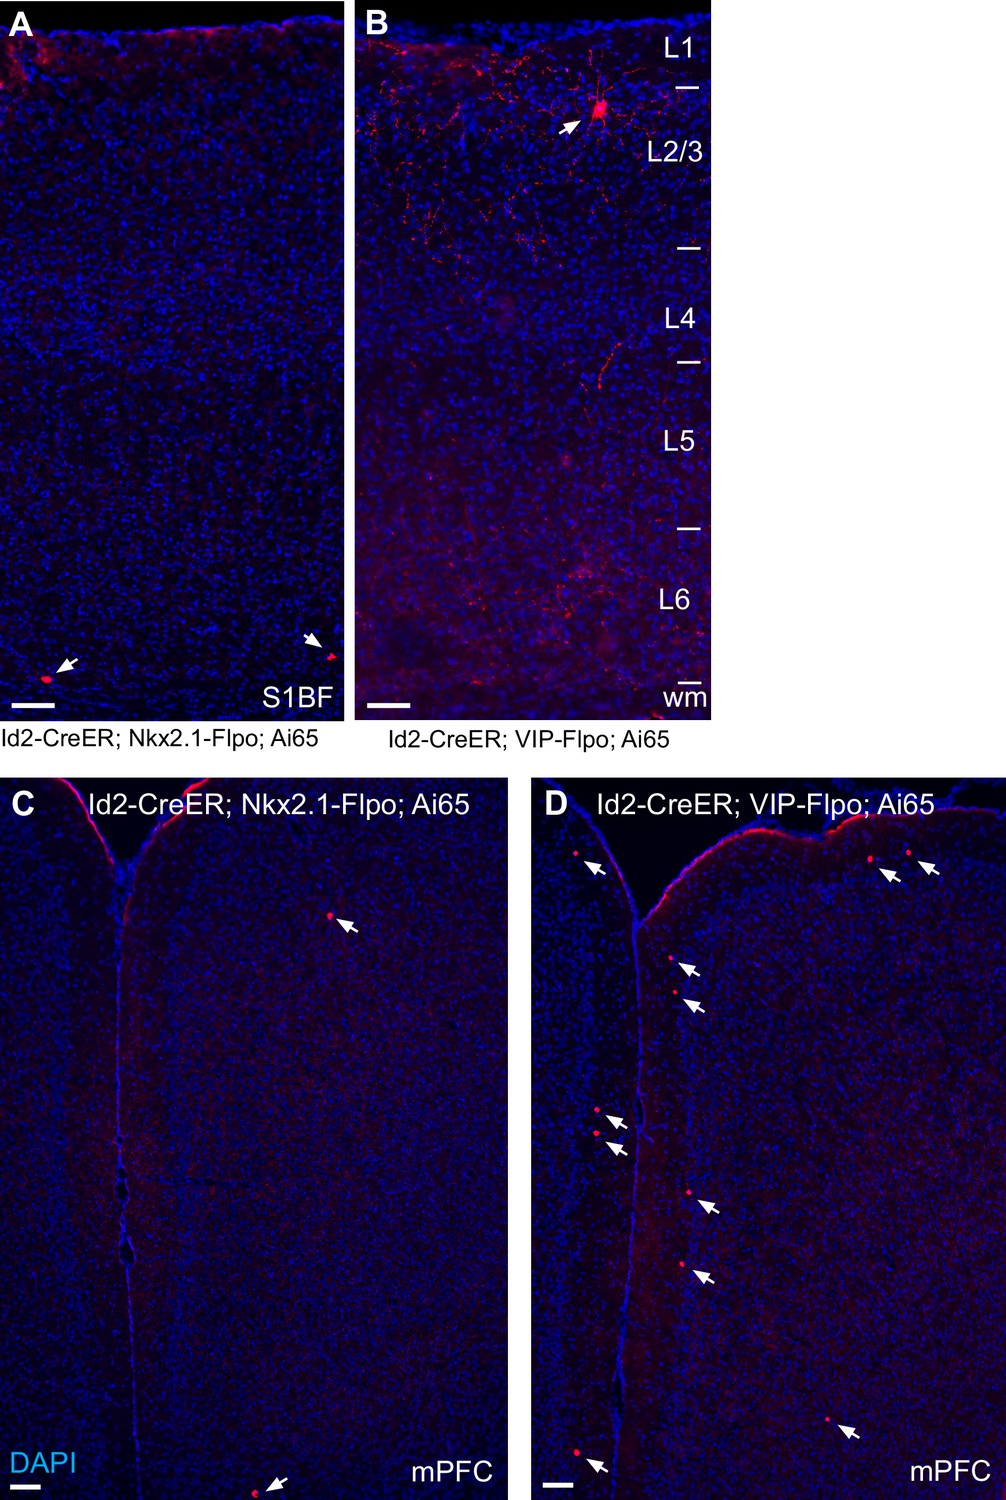
(A) Tissue section of the cortical column in S1BF of an Id2-CreER; Nkx2.1-Flpo; Ai65 brain. Arrows point to the two labeled cells in this field, both located in L6. (B) Tissue section of the cortical column in S1BF of an Id2-CreER; VIP-Flpo; Ai65 brain. The white arrow indicates the one labeled cell in this field, located in upper L2/3. Cell labeling was extremely sparse in both crosses. (C) Tissue section of the mPFC of an Id2-CreER; Nkx2.1-Flpo; Ai65 brain. Arrows point to the two labeled cells in this field. (D) Tissue section of the mPFC of an Id2-CreER; VIP-Flpo; Ai65 brain. The white arrows indicate the labeled cells in this field, mostly located along the L1/L2 border. DAPI counterstain (blue) is present in all images. All tissue sections are 20 μm thick. Scale bars indicate 100 μm.
Figure 1—figure supplement 4
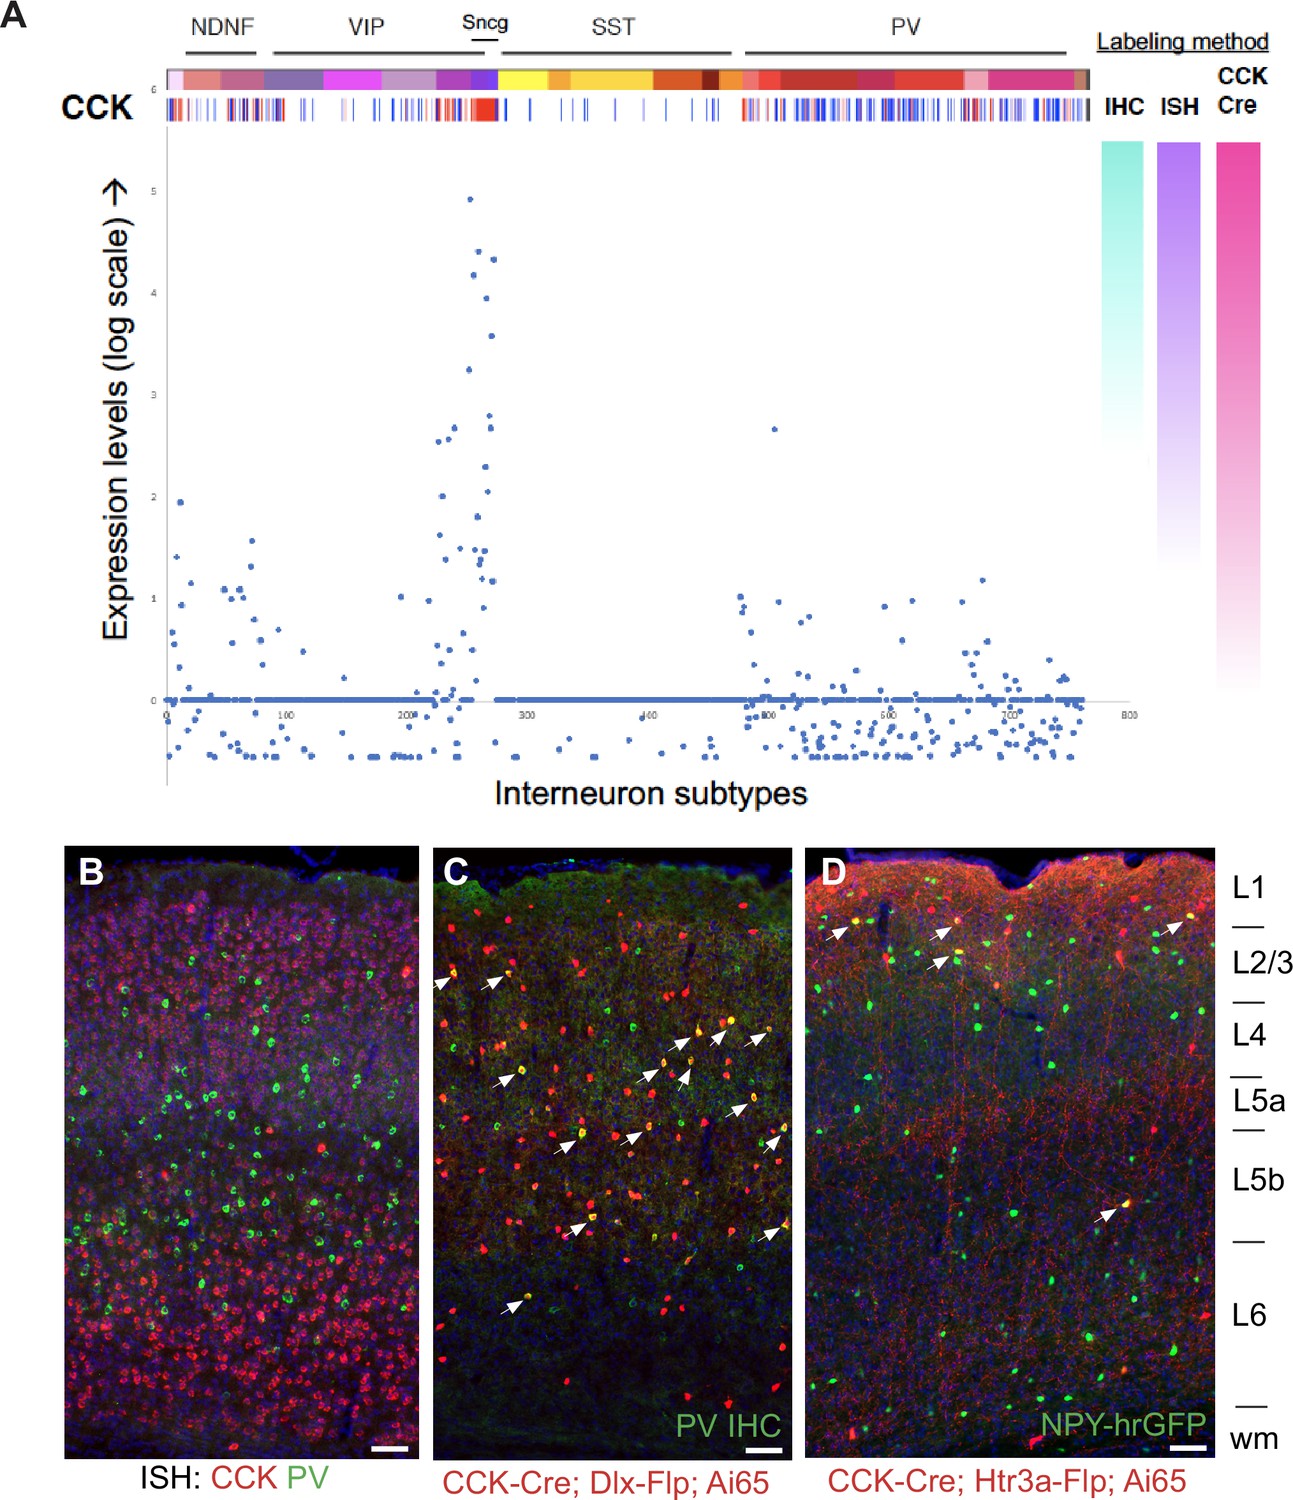
Methodological considerations for assessing gene expression (the cautionary tale of CCK).
(A) Expression levels of Cck mRNA across all GABAergic INs from Tasic et al., 2016 (~3000 INs individually purified from V1), represented on a log scale. The top bar shows the IN subtype categories described in Tasic et al., 2016, with a heat map for Cck mRNA shown underneath. On the right, a schematic depiction of the hypothetical extent of cell labeling using immunohistochemistry (IHC), in situ hybridization (ISH), or CCK-Cre cumulative reporter labeling (e.g. Cck-Cre; Ai14) is shown. (B) Dual fluorescence in situ hybridization (FISH) for Cck (red) and Pvalb (green) on a brain tissue section (S1BF; 20 μm thick) does not indicate substantial overlap between these markers. However, as shown in (C), the use of CCK-Cre with a tdTomato reporter (in this case, CCK-Cre; Dlx5/6-Flpe; Ai65) in combination with IHC for PV (green) results in substantial labeling of PV INs (white arrows). (D) CCK-Cre cumulative recombination can also label putative NGFC (NPY+), as shown in an intersectional CCK-Cre; Htr3a-Flpo; Ai65; NPY-hrGFP cross (white arrows indicate tdTomato/NPY + cells). Scale bars indicate 100 μm.
Figure 1—figure supplement 5
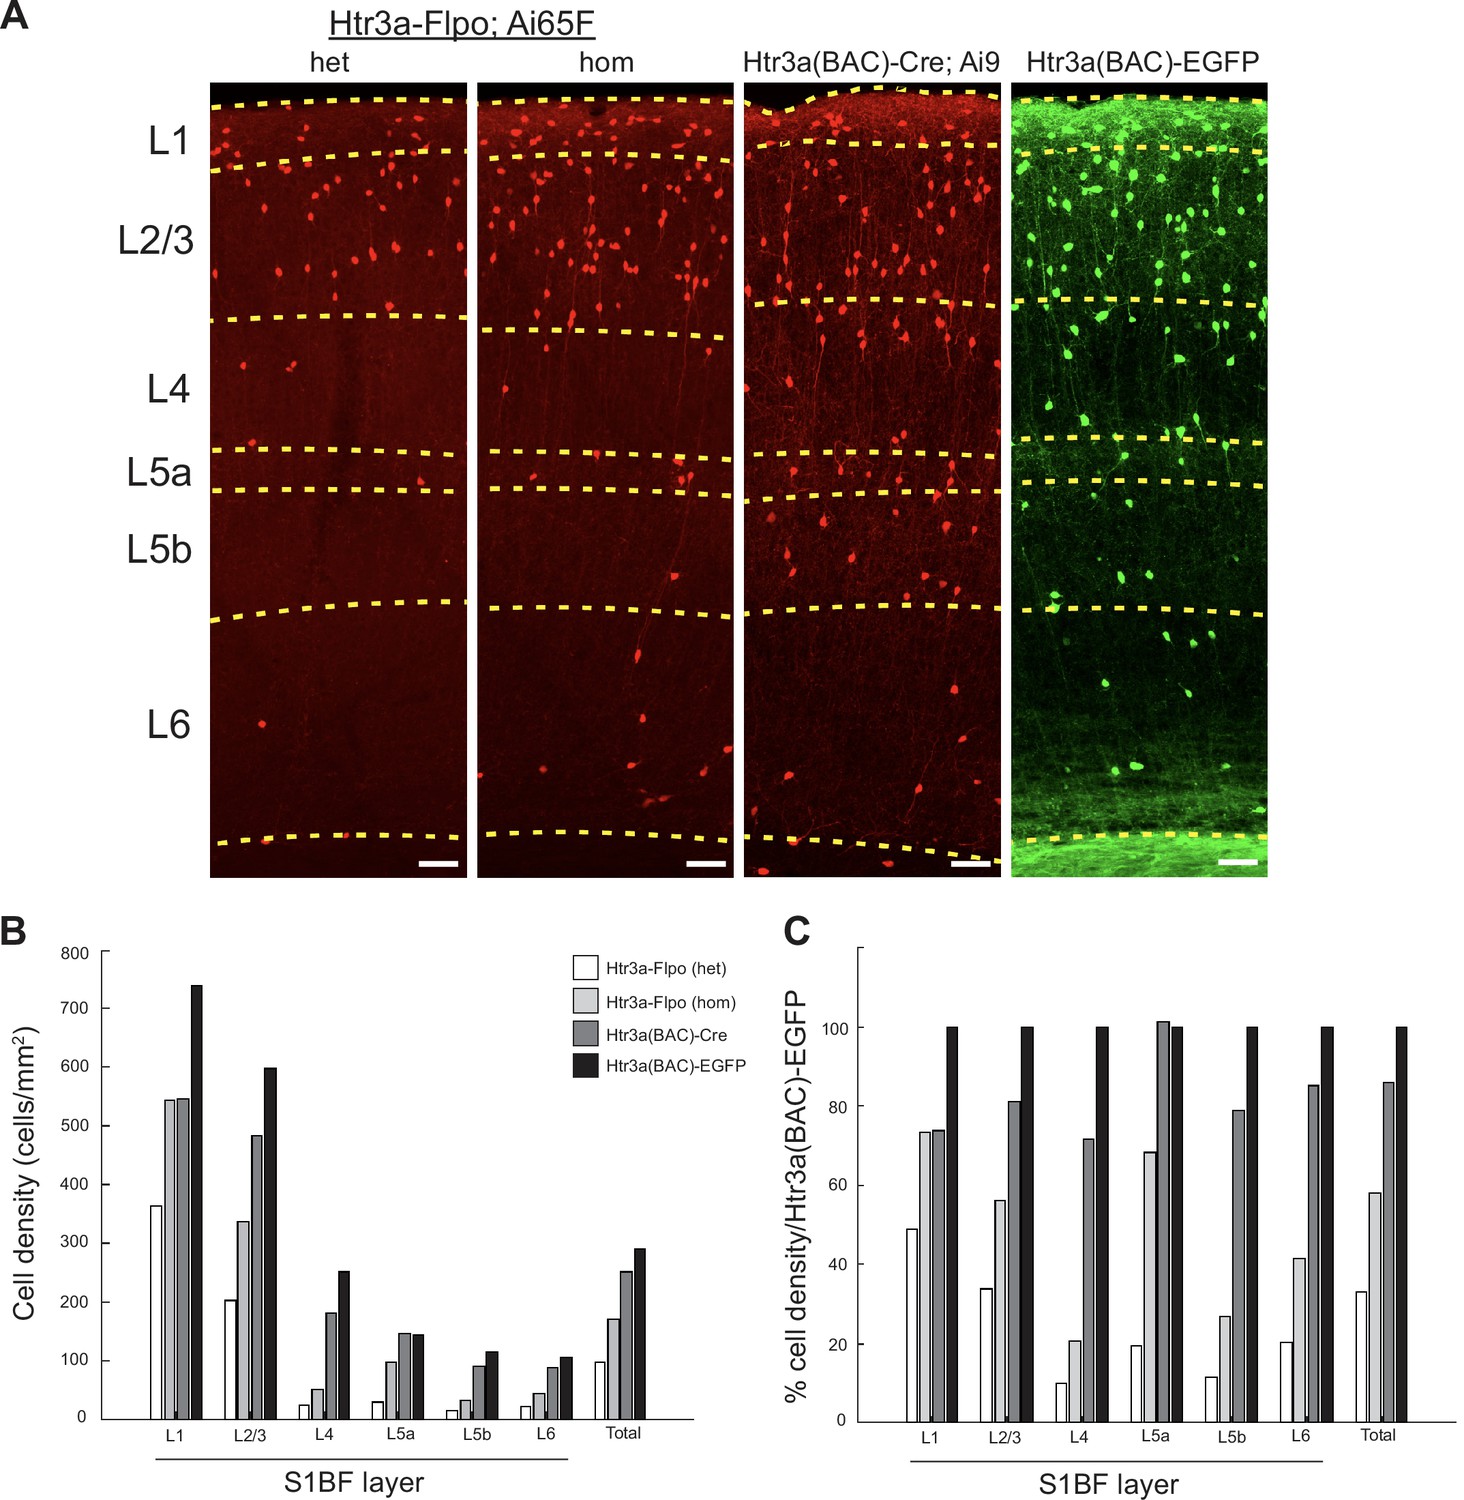
Comparison of 5HT3aR lines in S1BF.
(A) Images of cell labeling in S1BF obtained with one copy of Htr3a-Flpo (het: Htr3a-Flpo/+; Ai65F/+) or two copies (hom: Htr3a-Flpo/Htr3a-Flpo; Ai65F/+), compared with Htr3a(BAC)-Cre; Ai9 and Htr3a(BAC)-EGFP. Dashed lines indicate approximate layer boundaries. (B) The density of cell labeling (cells/mm2) obtained from the four Htr3a transgenic labeling strategies across all layers in S1BF. (C) The comparative density of cell labeling obtained from the four Htr3a transgenic labeling strategies across all layers in S1BF, normalized to Htr3a(BAC)-EGFP (100%). Overall, one copy of Htr3a-Flpo yielded about 30% of the cell labeling as that seen in Htr3a(BAC)-EGFP animals, with two copies of Htr3a-Flpo doubling this labeling. This observation is consistent with a broad but transient expression of Htr3a mRNA in most CGE INs during embryonic development. The ephemeral nature of Htr3a expression in many CGE INs limits the efficiency of labeling with Htr3a-Flpo, although this can be partially compensated for with two copies of the driver. The Htr3a(BAC)-Cre driver in combination with Ai9 labels ~80% of the cells of the Htr3a(BAC)-EGFP line. Scale bars indicate 100 μm.
Figure 2 with 1 supplement
Histological analysis of Id2 INs in S1BF.
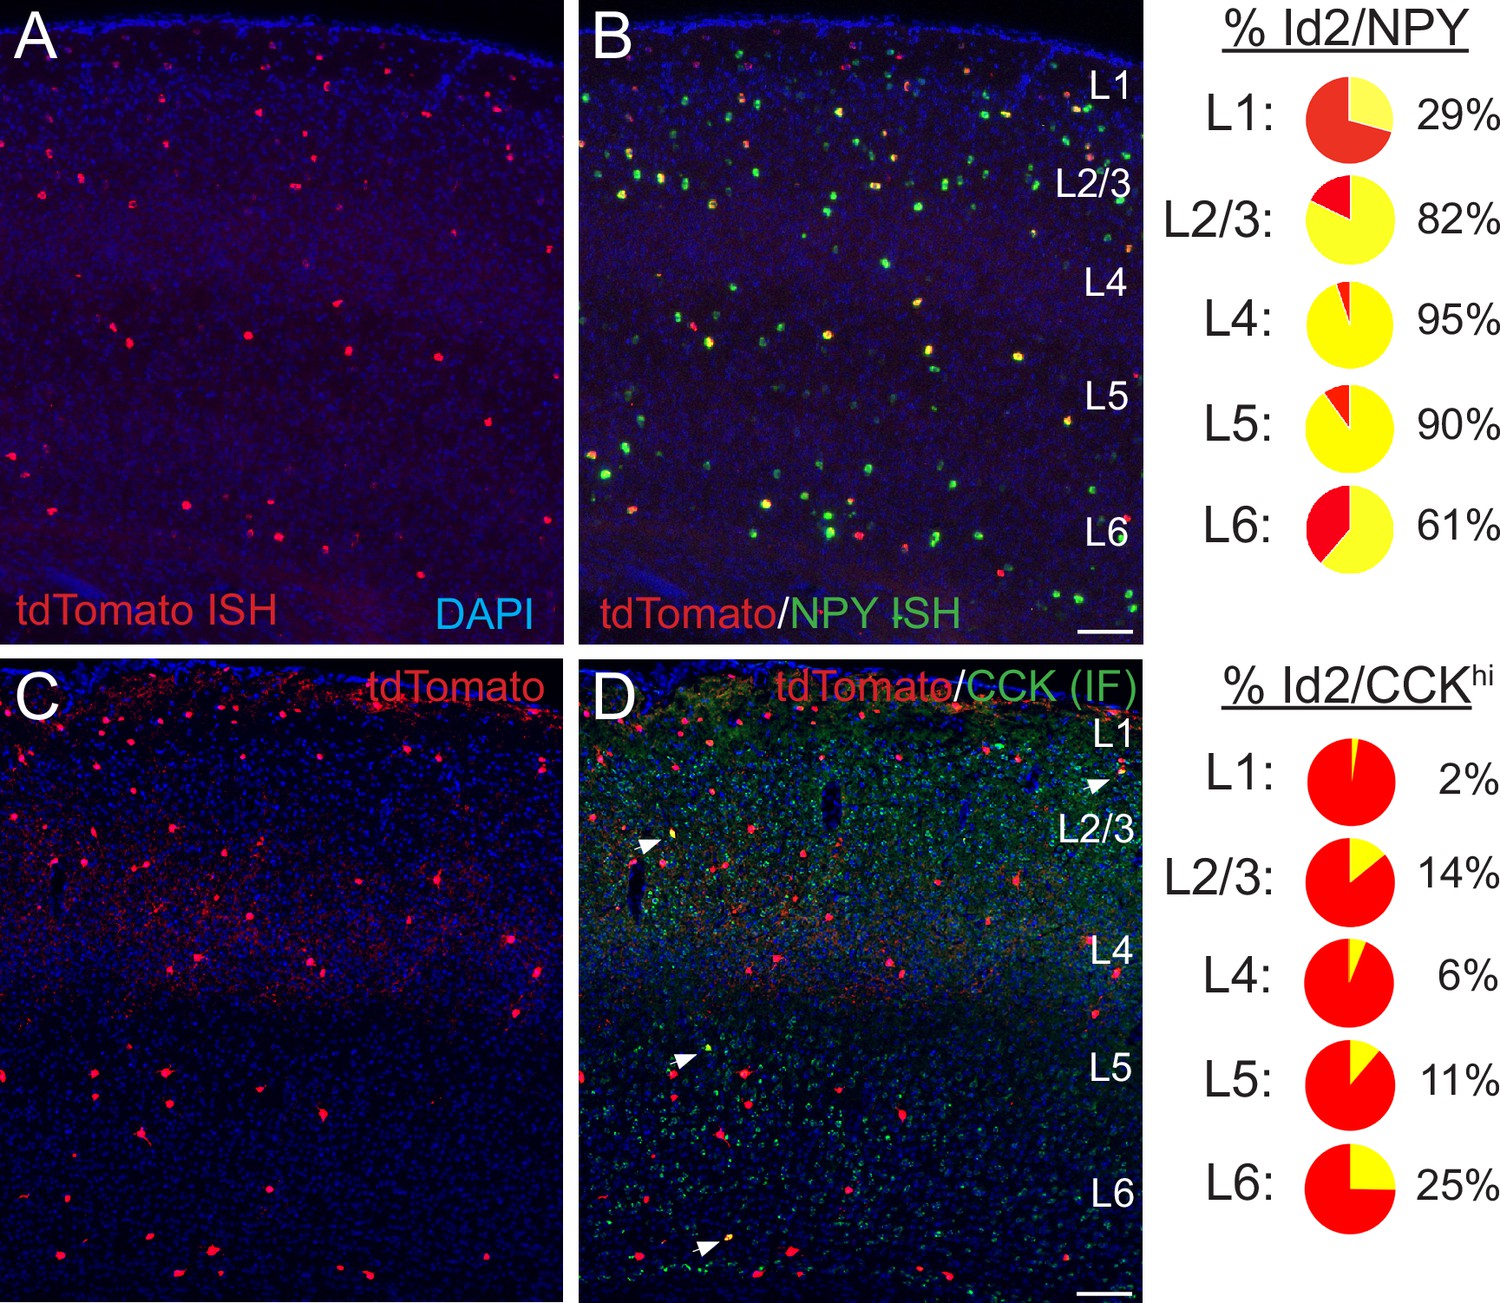
(A–B) Assessment of Npy expression in Id2 INs (Id2-CreER; Dlx5/6-Flpe; Ai65). Fluorescent in situ hybridization (FISH) with cRNA probes for tdTomato (red; panel A) and Npy (green; both red and green channels shown in panel B) mRNAs on brain cryosections (20 μm thick) reveals that outside of L1, the vast majority of Id2 INs express Npy (L2-5: 87%). The percentages of Id2/Npy cells (yellow) in each layer are represented as pie charts on the right. (C–D) Assessment of CCK expression in Id2 INs (Id2-CreER; Dlx5/6-Flpe; Ai65). Immunofluorescent histochemistry (IHC) for tdTomato (red; panel A) and CCK (green) reveals that a fraction (15%) of Id2 cells in L2-6 express high levels of CCK (CCKhi; white arrowheads), with the highest proportion of Id2/CCK cells observed in L2 and L6. The percentages of Id2/CCK cells (yellow) in each layer are represented as pie charts on the right. Scale bars in panels B and D represent 100 μm. See also Figure 2—source data 1.
-
Figure 2—source data 1
Id2 NPY CCK cell counts in S1BF.
To evaluate expression of NPY in Id2 cells, double FISH (NPY mRNA in green; tdTomato mRNA in red) was performed on thin tissue sections (20 μm) from Id2-CreER; Dlx5/6-Flpe; Ai65 brains (n=3). For cell counting, 11 sections were selected that exhibited both robust and consistent FISH signal across the S1BF area. To evaluate expression of CCK in Id2 cells, IHC for CCK was performed on thin tissue sections from Id2-CreER; Dlx5/6-Flpe; Ai65 brains (n=3). DAPI staining was included for assignment of layer identity in both staining experiments.
- https://cdn.elifesciences.org/articles/85893/elife-85893-fig2-data1-v2.xlsx
Figure 2—figure supplement 1
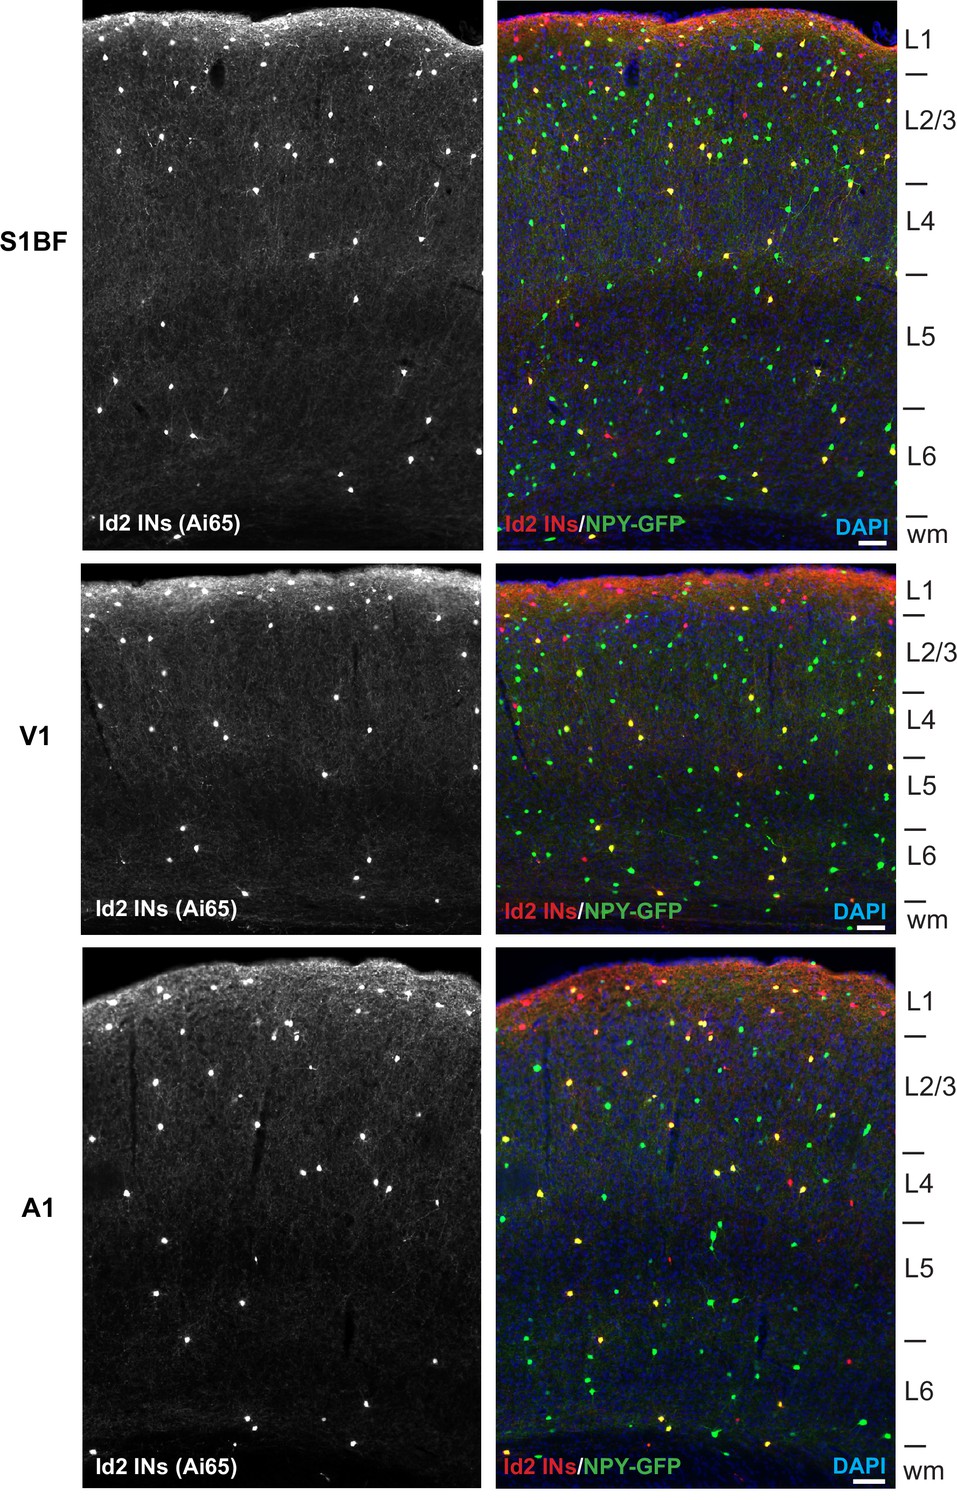
Id2 INs and NPY expression in S1BF, V1, and A1.
Examples of Id2 IN labeling and NPY expression (tdTomato and NPY-hrGFP expression in Id2-CreER; Dlx5/6-Flpe; Ai65; NPY-hrGFP animals) in brain tissue sections from S1BF, V1 and A1. Id2 INs labeled with tdTomato are shown on the left panels, with the NPY-hrGFP signal included in the right panels from each cortical area. Red cells indicate Id2 INs without NPY expression, and yellow cells indicate Id2/NPY INs. The approximate locations of layer boundaries are labeled on the right. DAPI counterstain (blue) is present in all images. All tissue sections are 20 μm thick. Scale bars indicate 100 μm.
Figure 3 with 1 supplement
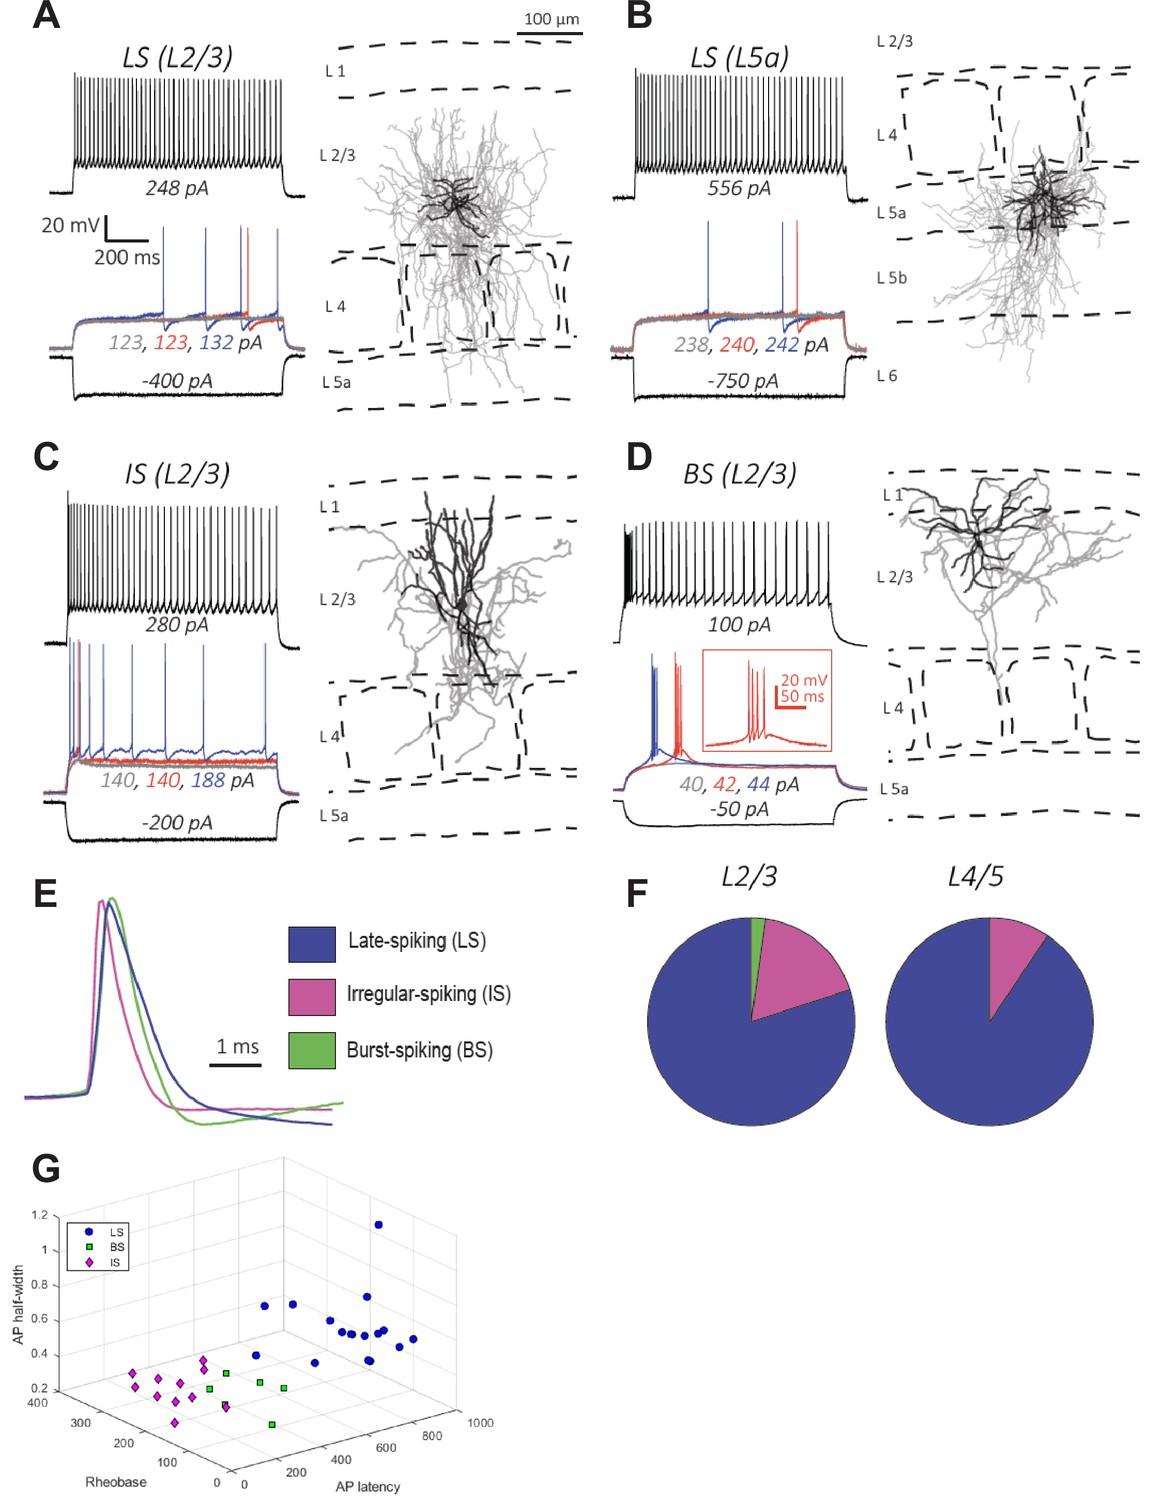
Electrophysiology and morphology of Id2 INs in S1BF.
(A–D) Four examples of the types of cells encountered in this survey and their respective locations in the cortical column: (A–B) Late-spiking (LS), (C) Irregular-spiking (IS), and (D) Burst-spiking (BS). For electrophysiological characterization, cells were injected with current to bring them to –70 mV. Each voltage trace shows the response of the cell to a 1 s long current injection at the indicated levels which are: (i) a negative current to hyperpolarize the cell to –100 mV [black-lower trace], (ii) current steps just below [grey trace], at [blue trace], and just above rheobase [red trace], and (iii) current at roughly double the rheobase [black-upper trace]. To the right of each cell’s voltage traces is the morphological reconstruction from biocytin fills of the same recorded cell with the cortical layers and barrel fields indicated with dashed lines. Dendrites are shown in black and axons are shown in gray. (E) Overlay of first action potential waveforms at rheobase from the three described cell types. (F) Proportions of the three main cell types encountered in L2/3 and L4/5. For L2/3, 45 randomly selected cells were patched and characterized electrophysiologically. The proportions of the cell types were: 80% LS, 18% IS, and 2% BS. For L4/5, 31 randomly selected cells were characterized, and the proportions of the cell types were: 90% LS, 10% IS, and 0% BS. (G) 3D plot of LS, BS, and IS Id2 INs resolved by AP half-width, rheobase, and AP latency.
Figure 3—figure supplement 1

Additional morphologies of Id2 INs.
(A) Reconstructions of three additional Id2 late-spiking (LS) INs and one Id2 α7 IN in L2-4 of S1BF. Approximate layer boundaries and barrel locations are indicated by dashed lines. (B) Images of ten filled Id2 LS INs aligned to their respective laminar locations. (C) Images of four filled Id2 irregular spiking (IS) INs and pyramidal cell recorded pairs located in L2/3. (D) Images of three filled Id2 burst spiking (BS) INs and pyramidal cell recorded pairs located in L2/3. (E) Image of an α7 IN and pyramidal cell recorded pair. Arrows in (C–E) indicate cell soma of the respective filled Id2 cells. Note: neuronal images are better appreciated by zooming in (especially axonal arbors).
Figure 4
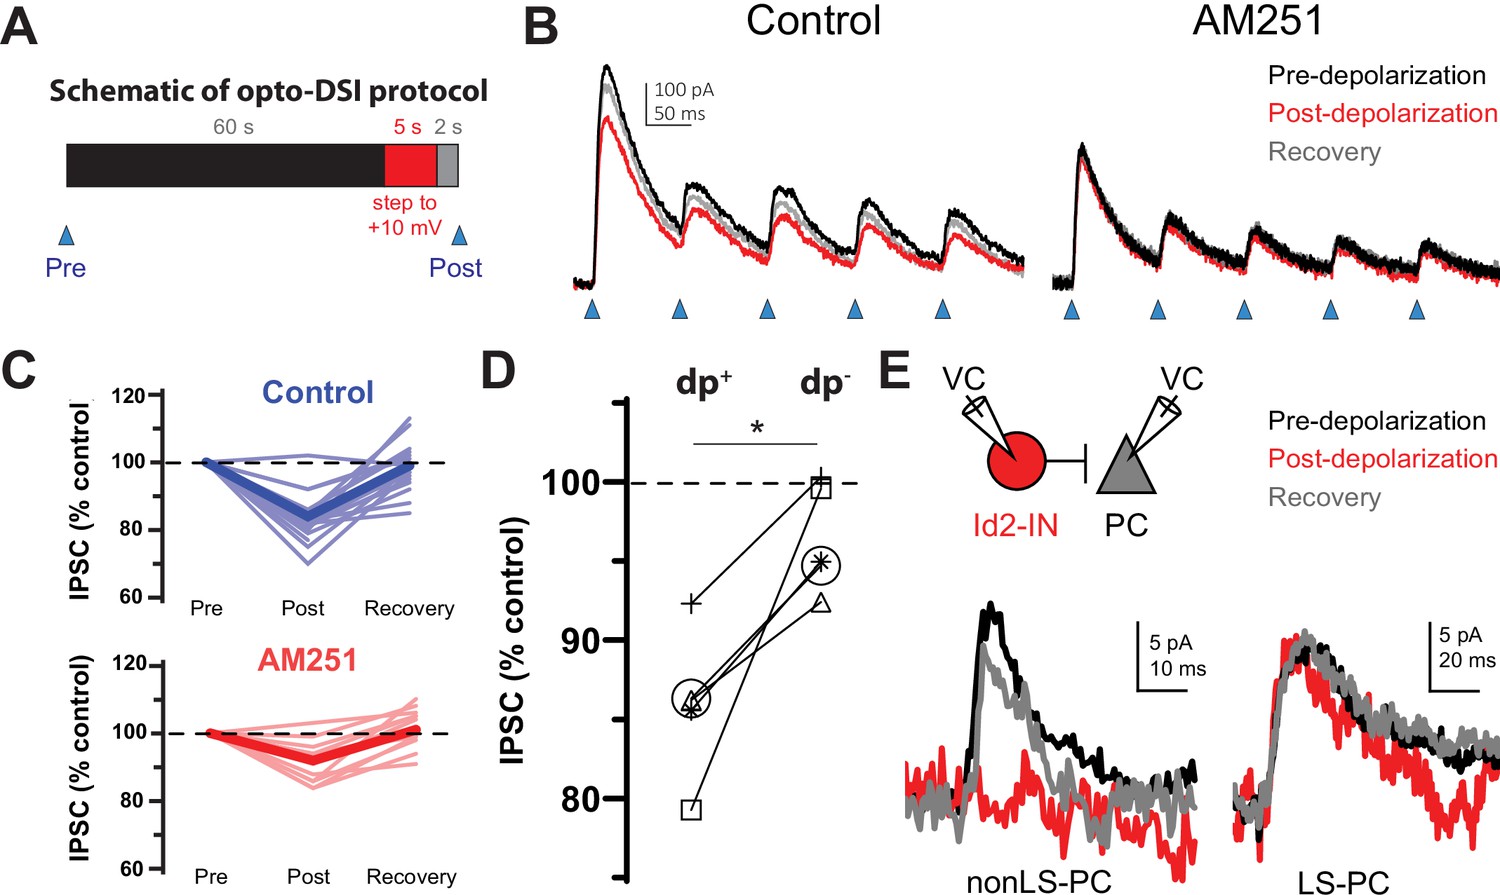
The non-LS Id2 population exhibits DSI.
(A) Protocol used for revealing depolarization-induced suppression of inhibition (DSI). DSI was first assessed via optogenetics in L2/3 pyramidal cells (PCs) in the following manner: PCs were recorded in voltage-clamp mode in cortical slices from Id2-CreER; Dlx5/6-Flpe; Ai80 animals, in which the channelrhodopsin CatCh is widely expressed in the Id2 IN population. Control IPSCs were elicited by light pulses of 2ms in duration. Then, after a 60 s interval, the PC was stepped to +10 mV for 5 s, and after a 2 s recovery, another IPSC was elicited in the same manner. (B) Sample traces from optogenetic experiments. In the drug-free condition (left panel), the peak current decreases slightly but noticeably and recovers by the next stim 60 s later. However, in the presence of the CB1 receptor antagonist AM251 (10 µM) [right panel], this decrease was not observed. (C) Summary data from all cells tested as in (B). Thin, faint lines are the averages for each cell across three or more repetitions. Dark, solid lines are the averages across all cells. The average decrease in IPSC amplitude in the control condition was 16 ± 2% (n=18 cells, N=8 animals). Two-tailed paired t-tests of Post vs. Pre and Recovery vs. Post were significant (p=1e-6, p=6e-6). The average decrease in IPSC amplitude in the AM251 condition was 8 ± 1% (n=11 cells, N=4 animals). Also, the average decrease post-depolarization in Control vs. AM251 was significant by a two-tailed unpaired t-test (p=0.002). (D) A subset of five cells was tested in which the DSI protocol was carried out with (dp+) or without (dp-) a depolarization to +10 mV to control for variability or rundown of the synaptic current. Trials that incorporated the depolarization step exhibited significantly greater decreases in IPSC amplitude than those that lacked it (p=0.014, two-tailed paired t-test). (E) DSI was also detected in nonLS-PC pairs but not in LS-PC pairs. Recording configuration and sample current traces from two PCs: a post-synaptic PC to a nonLS cell (left) and a post-synaptic PC to an LS cell (right). Current traces represent a DSI experiment. Several probe stimuli were given to obtain a baseline average (black trace), then the depolarization step to +10 mV was delivered to the PC, and 1–2 s later, the PC was probed again (red trace). The cell was then probed several times afterwards to assess recovery (grey trace). The mouse lines used for these experiments were Id2-CreER; Dlx5/6-Flpe; Ai65 or the same with the addition of an NPY-hrGFP allele to facilitate the identification of nonLS cells. Out of 46 nonLS-PC pairs tested, only 9 (20%) were connected (compared to 24% for CB1IS→P in Galarreta et al., 2008). Out of 27 LS-PC pairs tested, 19 (70%) were connected. DSI was assessed in 9 LS-PC pairs and not observed in any of them, whereas out of 5 nonLS-PC pairs tested for DSI, 3 pairs exhibited it. See also Figure 4—source data 1.
-
Figure 4—source data 1
DSI source data.
This excel file consists of three workbooks, ‘Figure 4C (opto; AM251)’, ‘Figure 4D (opto; dp +-)’, and ‘Figure 4E (paired recordings)’. ‘dp’ refers to the 5 s depolarization step to +10 mV delivered to the PC to induce DSI. Cells discarded from the final data set are not listed. For optogenetics experiments, traces were discarded if the series resistance was too high (>40 MΩ), or if the holding current was too negative (<-100 pA). Cells were discarded if there were fewer than three acceptable traces, if the cell patched was clearly not a PC, or if the recording parameters deviated from the standard protocol (e.g. non-standard internal, interstim interval not 60 s, etc.).
- https://cdn.elifesciences.org/articles/85893/elife-85893-fig4-data1-v2.xlsx
Figure 5
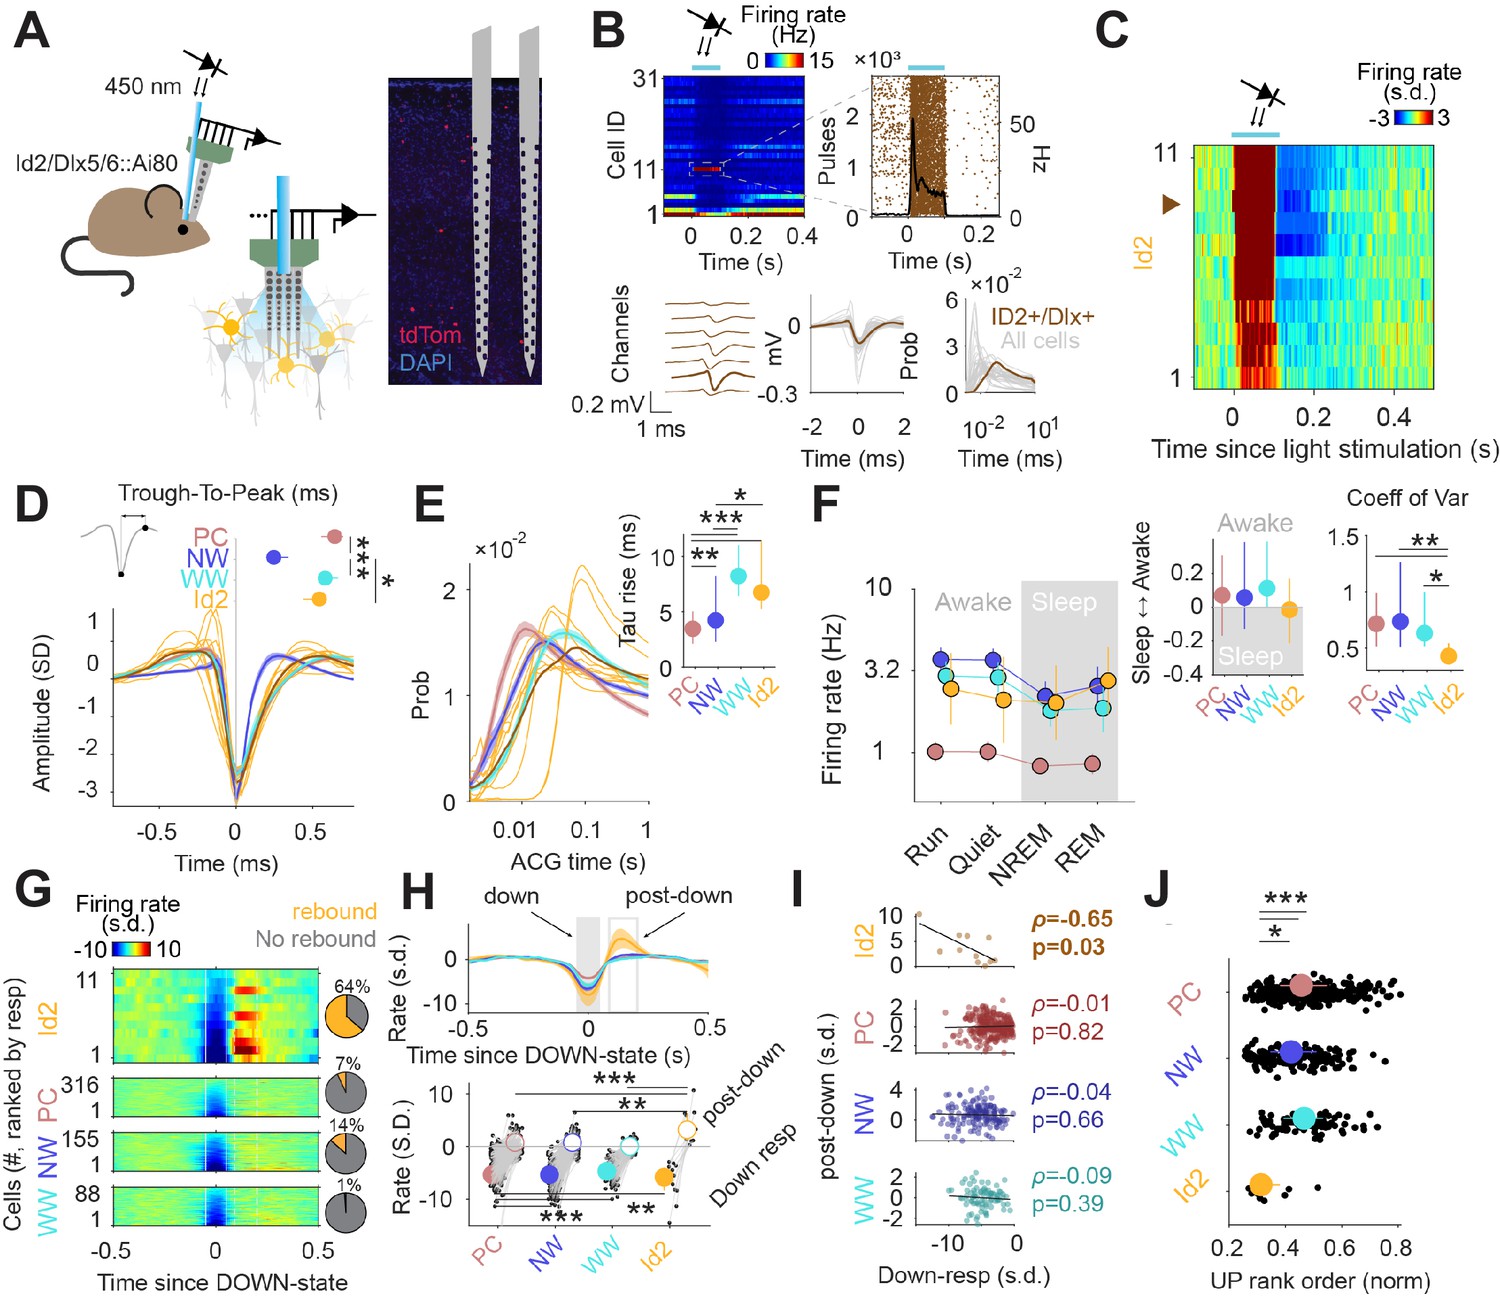
Activity of Id2 INs in vivo.
(A) Schematic of the opto-tagging experiments that were used to identify Id2 INs in freely behaving mice. Combined light fiber-recording probes were implanted in Id2-CreER; Dlx5/6-Flpe; Ai80 mice. (B) Peristimulus time histogram (PSTH) from 31 isolated neurons from a single recording session. Note one light-responsive neuron in position 11. The peristimulus raster plot, waveform and auto-correlogram for that light-responsive Id2 IN-light responsive unit are shown in brown. All remaining cells from this session are shown in clear gray for comparison. (C) Peristimulus histogram (PSTH) for all isolated units classified as Id2 IN-light responsive neurons (from n=5 mice). (D) Average spike waveform (mean ± 95% confidence interval (CI95)) and through-to-peak spike duration (inset; p<10–61, Kruskal-Wallis test) for PCs, NW INs, WW neurons and Id2 INs (n=317 PCs, 155 NW INs and 88 WW neurons). The average waveform from all Id2 IN-light responsive neurons are overlayed in yellow. (E) Same as in (D) but for the average firing auto-correlogram (ACG) in log scale and time constant of the rising phase of the ACG (inset; p<10–24). (F) Median firing rates of PCs, NW INs, WW neurons, and light responsive-Id2 INs (Cell type: F3,2261 = 151.44, p<10–89; State: F3,2261 = 10.74, p=0.035; Interaction: F9,2261 = 0.97, p=0.46). Sleep to Awake index (p=0.051, Kruskal-Wallis test) and coefficient of variance of the firing rate (p=0.034, Kruskal-Wallis test) as insets. Sleep to Awake index was near zero only for the Id2 IN group (PC: Z=2.55, p=0.010; NW: Z=3.16, p=0.002; WW: Z=0.08, p=0.98; one-sample Wilcoxon signed rank test). (G) Peri-down-state Z-scored firing histogram for light-responsive-Id2 INs (top), and all PCs, NW INs, WW neurons (middle to bottom), as ranked according to their magnitude of event response. Solid lines delimit the ±50 ms window used to estimate the unit responses during down-states. Dashed lines delimit the +90 ms to +200 ms window used to estimate the post-down-state responses. Pie charts show the fraction of units exhibiting an early increase in firing rate during the post-down epoch above 2 standard deviations (s.d.). (H) Temporal dynamics of the Z-scored peri-down-state responses across all groups (top; mean ± IC95). Contrary to what was observed in PCs, NW INs and WW neurons, Id2 neurons significatively increased their firing rate above baseline levels during the post-down epoch (post-down: p<10–8; down: p<10–15). (I) The magnitude of the post-down-state response as a function of the activity during the down-state events. Only Id2 neurons show a significant correlation (Spearman correlation). (J) Group differences of the average rank position during up-state epochs (P<10–5, Kruskal-Wallis test). Id2 INs lead the up-state sequences.
Figure 6
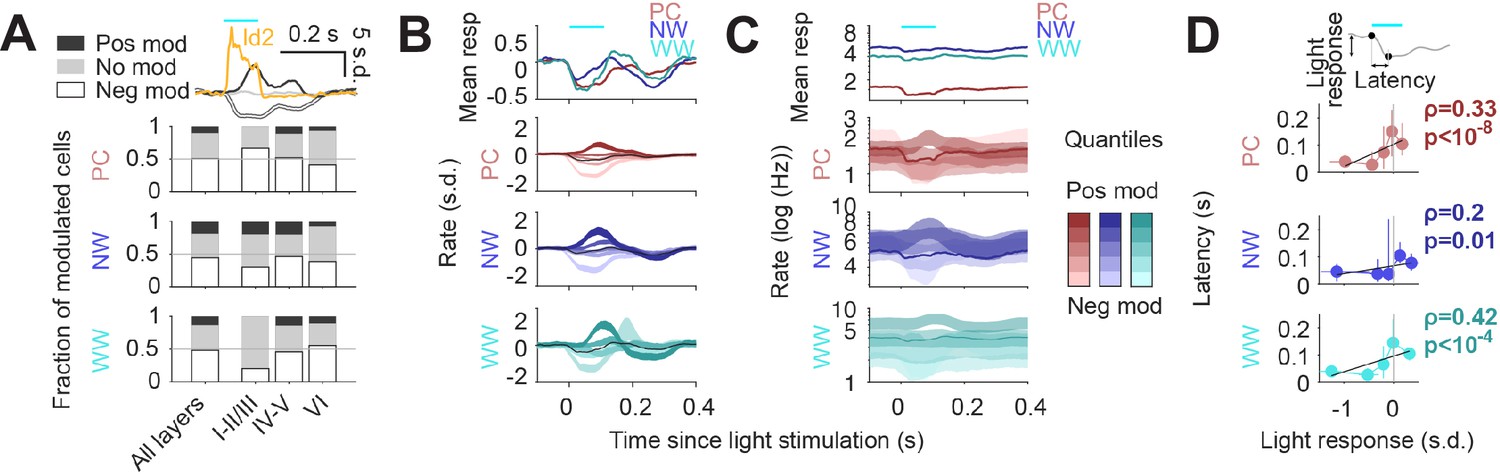
Circuit effects of Id2 IN stimulation in vivo.
(A) Fraction of negatively modulated (neg mod), positively modulated (pos mod), and unmodulated neurons (no mod) in the PC, NW and WW groups across cortical layers. Average peristimulus histogram for all three modes of response (pos mod, neg mod, and no mod) is shown in the top inset. (B–C) Peristimulus histograms for PCs, NW INs, and WW neurons, each separated into 5 quantiles based on their + 0 ms to +100 ms average firing rate response (light to dark shades). Changes in firing rates are shown as s.d. in (B) and Hz (log10 scale) in (C). (D) Peak latency for the light-evoked responses in all neuron groups as a function of the +0 ms to +100 ms rate response. Positively modulated responses peaked consistently later than negative responses (Spearman correlation).
Tables
Table 1
Electrophysiological properties of Id2 INs in S1BF.
| Electrophysiological property | LS in L2/3(n≥15) | LS in L4-5(n≥5) | IS in L2/3(n≥5) | BS in L2/3(n≥5) |
|---|---|---|---|---|
| First AP latency (ms) | 805±22 | 827±32 | 53±4 | 143±37 |
| Input Resistance (MΩ) | 188±7 | 130±11*** | 199±32 | 301±32*** |
| Membrane τ (ms) | 12±0.5 | 11±0.8 | 13±1.2 | 17±1.4** |
| AP half-width (ms) | 0.70±0.02 | 0.63±0.08 | 0.48±0.04*** | 0.57±0.05* |
| AP threshold (mV) | 35±1 | 33±2 | 38±2 | 41±2* |
| AP rise slope (mV/ms) | 283±15 | 367±61 | 404±60 | 322±46 |
| AP fall slope (mV/ms) | 84±4 | 108±20 | 150±19*** | 135±29* |
| AHP amplitude (mV) | 14.4±0.5 | 12.9±1.1 | 9.9±0.9*** | 6.6±1.3*** |
| Rheobase (pA) | 139±14 | 205±44 | 155±18 | 51±7*** |
| Firing rate (Hz) (at 2 x rheobase) | 38±3 | 29±4 | 40±6 | 31±7 |
| Firing Regularity (at 2 x rheobase) | 0.053±0.004 | 0.050±0.008 | 0.112±0.029** | 0.262±0.124** |
| Adaptation Index (near rheobase) | 1.14±0.08 | 1.06±0.11 | - | - |
| Adaptation Index (at 2 x rheobase) | 0.76±0.03 | 0.72±0.03 | 0.26±0.05*** | 0.24±0.14** |
-
Table 1—source data 1
Electrophysiological parameters source data.
This excel spreadsheet lists all of the cells patched alongside their electrophysiological parameters. The file consists of two workbooks, ‘tabulation’ containing the parameters for each cell, and ‘summary’ containing the summary data (average, sem, n) for each cell type. For some cells, no values are reported for some parameters and these cells are marked ‘n/a.’ A small number of cells were patched with an internal solution different than that reported in the methods. Electrophysiology parameters for these cells were not reported, as differences in internal solution can have significant impacts on electrophysiological parameters, but the cells were counted alongside the rest for the proportions reported in Figure 3. These cells were marked as ‘0’ in the ‘Internal’ column or ‘1’ otherwise. Several cells categorized as LS do not have a value for the AP latency as for these cells a voltage trace bearing a single AP was not obtained. Nevertheless, these cells were confidently labeled LS as the late-onset of the APs is evident even in multiple AP traces. Cells patched in slices with NPY-GFP (i.e. Id2-CreER; Dlx5/6-Flpe; Ai65; NPY-hrGFP) are not listed in this file as the parameters summarized in Table 1 were only taken from the unbiased cross (i.e. Id2-CreER; Dlx5/6-Flpe; Ai65).
- https://cdn.elifesciences.org/articles/85893/elife-85893-table1-data1-v2.xlsx
Key resources table
| Reagent type (species) or resource | Designation | Source or reference | Identifiers | Additional information |
|---|---|---|---|---|
| Genetic reagent (mouse) | Id2-CreER | Jax | 016222 | |
| Genetic reagent (mouse) | Dlx5/6-Flpe | Jax | 010815 | |
| Genetic reagent (mouse) | NPY-hrGFP | Jax | 006417 | |
| Genetic reagent (mouse) | Nkx2.1-Flpo | Jax | 028577 | |
| Genetic reagent (mouse) | VIP-Flpo | Jax | 028578 | |
| Genetic reagent (mouse) | Ai65 | Jax | 021875 | |
| Genetic reagent (mouse) | Ai80 | Jax | 025109 | |
| Genetic reagent (mouse) | FLTG | Jax | 026932 | |
| Antibody | Rabbit polyclonal anti-CCK | Frontier Institute | Af350 | 1:500 dilution |
| Antibody | Donkey polyclonal anti-rabbit AlexaFluor-488 | Invitrogen | A-21206 | 1:1000 dilution |
| Sequence-based reagent | Cre primer (fwd) | Invitrogen | custom | caacgagtgatgaggttcgca |
| Sequence-based reagent | Cre primer (rev) | Invitrogen | custom | cgccgcataaccagtgaaaca |
| Sequence-based reagent | Flpe primer (fwd) | Invitrogen | custom | tctttagcgcaaggggtagga |
| Sequence-based reagent | Flpe primer (rev) | Invitrogen | custom | aagcacgcttatcgctccaa |
| Sequence-based reagent | Flpo primer (fwd) | Invitrogen | custom | ccacattcatcaactgcggc |
| Sequence-based reagent | Flpo primer (rev) | Invitrogen | custom | gggccgttcttgatagcgaa |
| Sequence-based reagent | NPY-hrGFP primer (fwd) | Invitrogen | custom | atgtggacggggcagaagatc |
| Sequence-based reagent | NPY-hrGFP primer (rev) | Invitrogen | custom | gtgcggttgccgtactgga |
| Sequence-based reagent | NPY cRNA antisense probe primer (fwd) | Invitrogen | custom | tcacagaggcacccagagc |
| Sequence-based reagent | NPY cRNA antisense probe primer (rev +T7) | Invitrogen | custom | attaatacgactcactatag cggagtccagcctagtggtg |
| Sequence-based reagent | tdTomato cRNA antisense probe primer (fwd) | Invitrogen | custom | atcaaagagttcatgcgcttc |
| Sequence-based reagent | tdTomato cRNA antisense probe primer (rev +T7) | Invitrogen | custom | cattaatacgactcactataggg ttccacgatggtgtagtcctc |
| Chemical compound, drug | tamoxifen | Sigma | T5648 | Prepare 20 mg/ml stock in corn oil |
Additional files
Download links
A two-part list of links to download the article, or parts of the article, in various formats.
Downloads (link to download the article as PDF)
Open citations (links to open the citations from this article in various online reference manager services)
Cite this article (links to download the citations from this article in formats compatible with various reference manager tools)
Id2 GABAergic interneurons comprise a neglected fourth major group of cortical inhibitory cells
eLife 12:e85893.
https://doi.org/10.7554/eLife.85893


