RNA-binding deficient TDP-43 drives cognitive decline in a mouse model of TDP-43 proteinopathy
- Department of Cell Biology and Physiology, University of North Carolina, United States
- Department of Neurology, University of North Carolina, United States
- UNC Neuroscience Center, University of North Carolina, United States
- Carolina Institute for Developmental Disabilities, University of North Carolina, United States
- Department of Genetics, University of North Carolina, United States
- Human Pluripotent Stem Cell Core, University of North Carolina, United States
- Department of Biostatistics, University of North Carolina, United States
- Department of Psychiatry, The University of North Carolina, United States
- Department of Cell Biology & Physiology, Histology Research Core Facility, University of North Carolina, United States
- Department of Pharmacology, University of North Carolina, United States
- Department of Biochemistry and Biophysics, University of North Carolina, United States
Figures
Figure 1
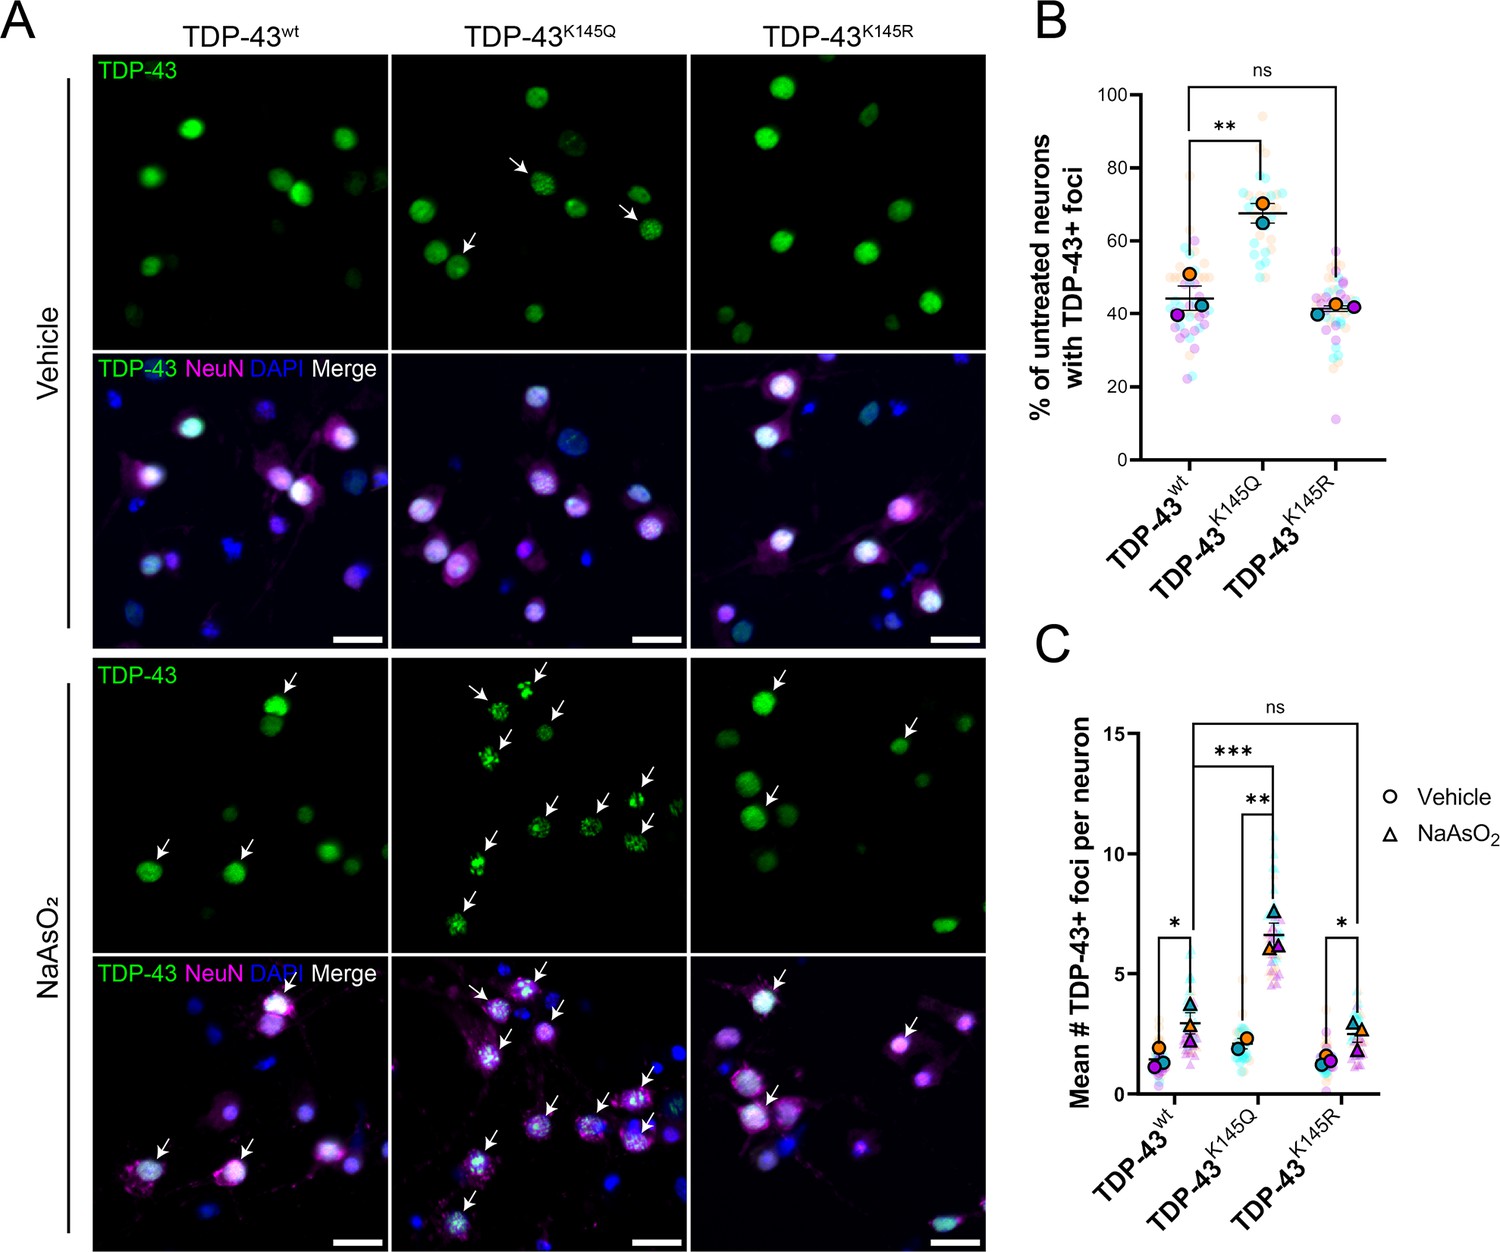
Ectopic expression of acetylation-mimic TDP-43K145Q, an RNA-binding deficient mutant, shows accelerated formation of stress-induced nuclear TDP-43 foci.
(A) Representative immunofluorescence images of TDP-43 in DIV14 mouse primary cortical neurons overexpressing TDP-43wt, TDP-43K145Q, or TDP-43K145R after vehicle or 200 µM NaAsO2 treatment followed by labeling of TDP-43 (green), NeuN (magenta), and DAPI (blue). Arrows highlight nuclei with TDP-43+ foci. Scale bar = 20 µm. (B) Quantification of percentage of neurons with TDP-43+ foci in vehicle-treated neurons. (C) Quantification of the average number of TDP-43+ foci per neuron. Data shown as Superplots (Lord et al., 2020); solid color bordered symbols and error bars indicate mean value of each biological replicate ± standard error of the mean (SEM); semi-transparent datapoints represent the average value per neuron in a single field of view, 10–110 neurons per field, 48 fields across n = 2–4 biological replicates. Statistical analysis completed using a linear mixed-effect model. Statistical significance is represented by asterisks *p < 0.05, **p < 0.01, ***p < 0.001. DIV = day in vitro.
Figure 2 with 1 supplement
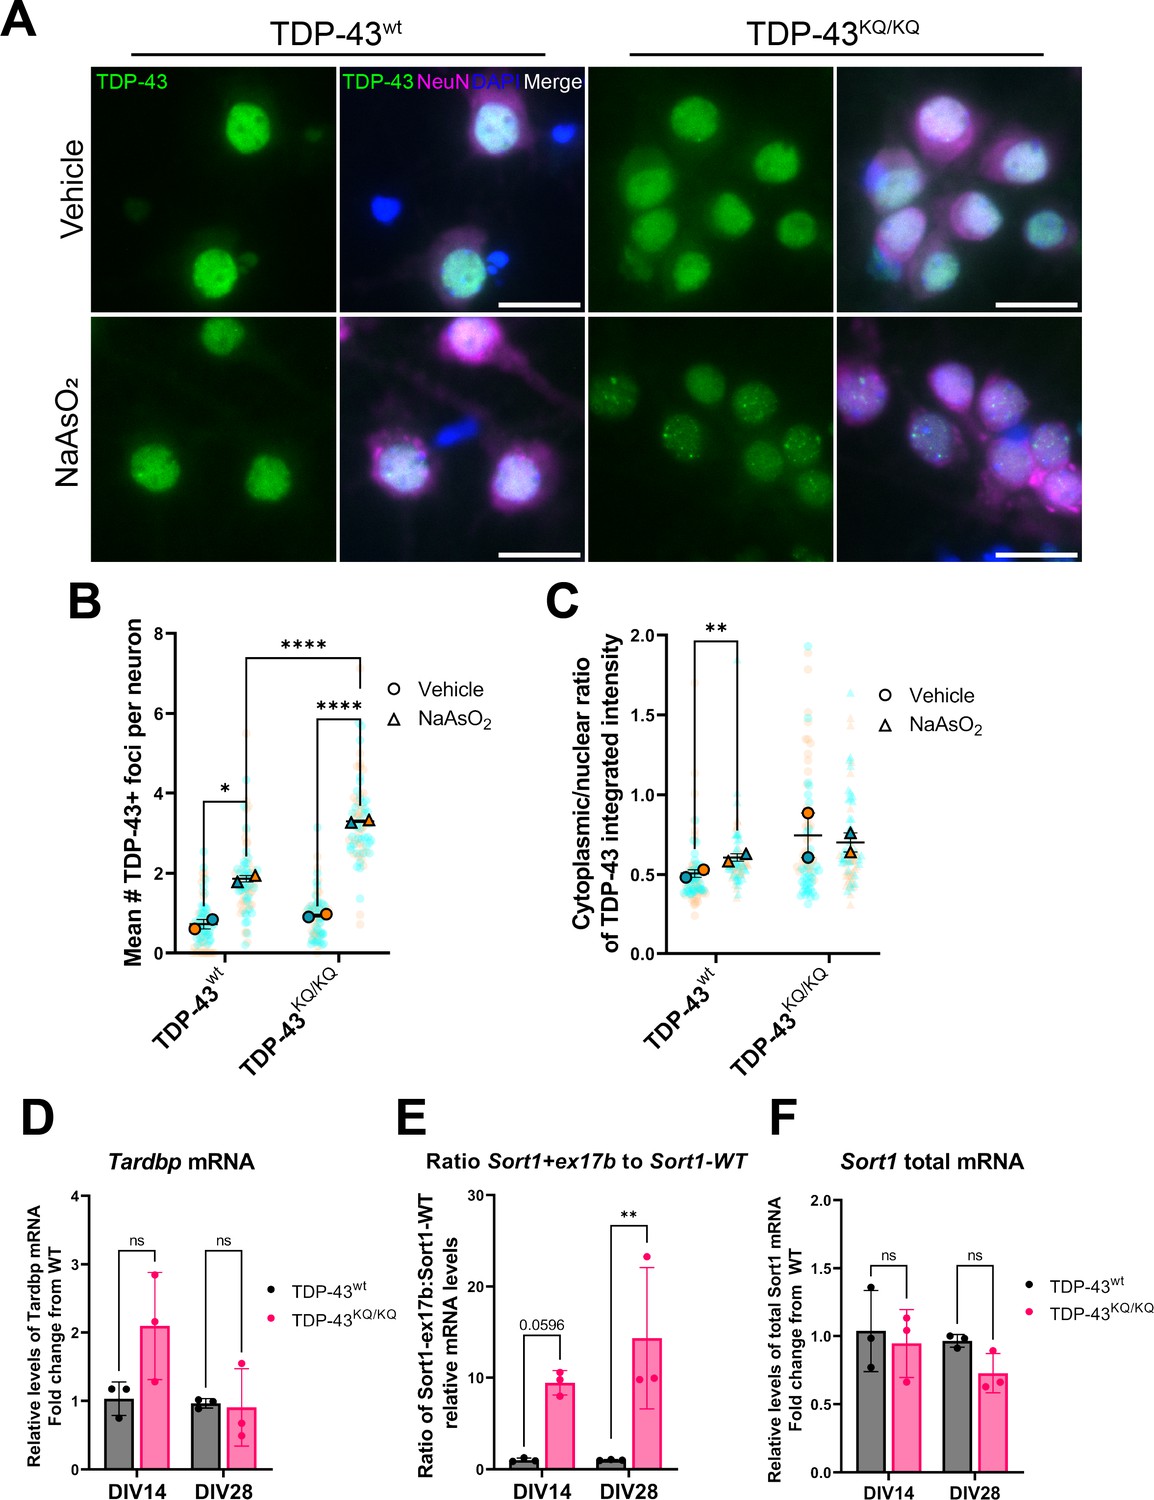
An endogenously encoded acetylation-mimic TDP-43K145Q mutation causes altered TDP-43 localization and functional splicing deficits in mouse primary cortical neurons.
(A) Representative images of primary cortical neurons derived from TDP-43wt or TDP-43KQ/KQ mice that were treated with vehicle or 200 µM NaAsO2 at DIV14 and immunolabeled for endogenous TDP-43 (green), NeuN (magenta), and DAPI (blue). Quantification of the number of TDP-43+ foci (B) and the cytoplasmic:nuclear ratio of TDP-43 fluorescence intensity (C) in TDP-43KQ/KQ compared to TDP-43wt neurons. RT-qPCR analysis of DIV14 and DIV28 untreated mouse primary cortical neurons using primers specific for mouse (D) Tardbp [F(1,8) = 3.034, p = 0.1197]; and Sort1 splice variants: (E) ratio Sort1+ex17b:Sort1-WT [F(1,8) = 23.02, p = 0.0014] and (F) total Sort1 mRNA [F(1,8) = 5.086, p = 0.0541]. (B, C) Data shown as Superplots (Lord et al., 2020); solid color bordered symbols and error bars indicate mean value of each biological replicate ± standard error of the mean (SEM); semi-transparent datapoints represent the average value per neuron in a single field of view, 10–110 neurons per field, 72 fields across n = 2–4 biological replicates; one color represents one biological replicate. Statistical analysis performed using a linear mixed-effect model. (D–F) Analysis by two-way analysis of variance (ANOVA) followed by Šídák’s multiple comparisons testing. F statistics represent main effect of genotype. Statistical significance is represented by asterisks, *p < 0.05, **p < 0.01, ****p < 0.0001, ns = not significant.
Figure 2—figure supplement 1
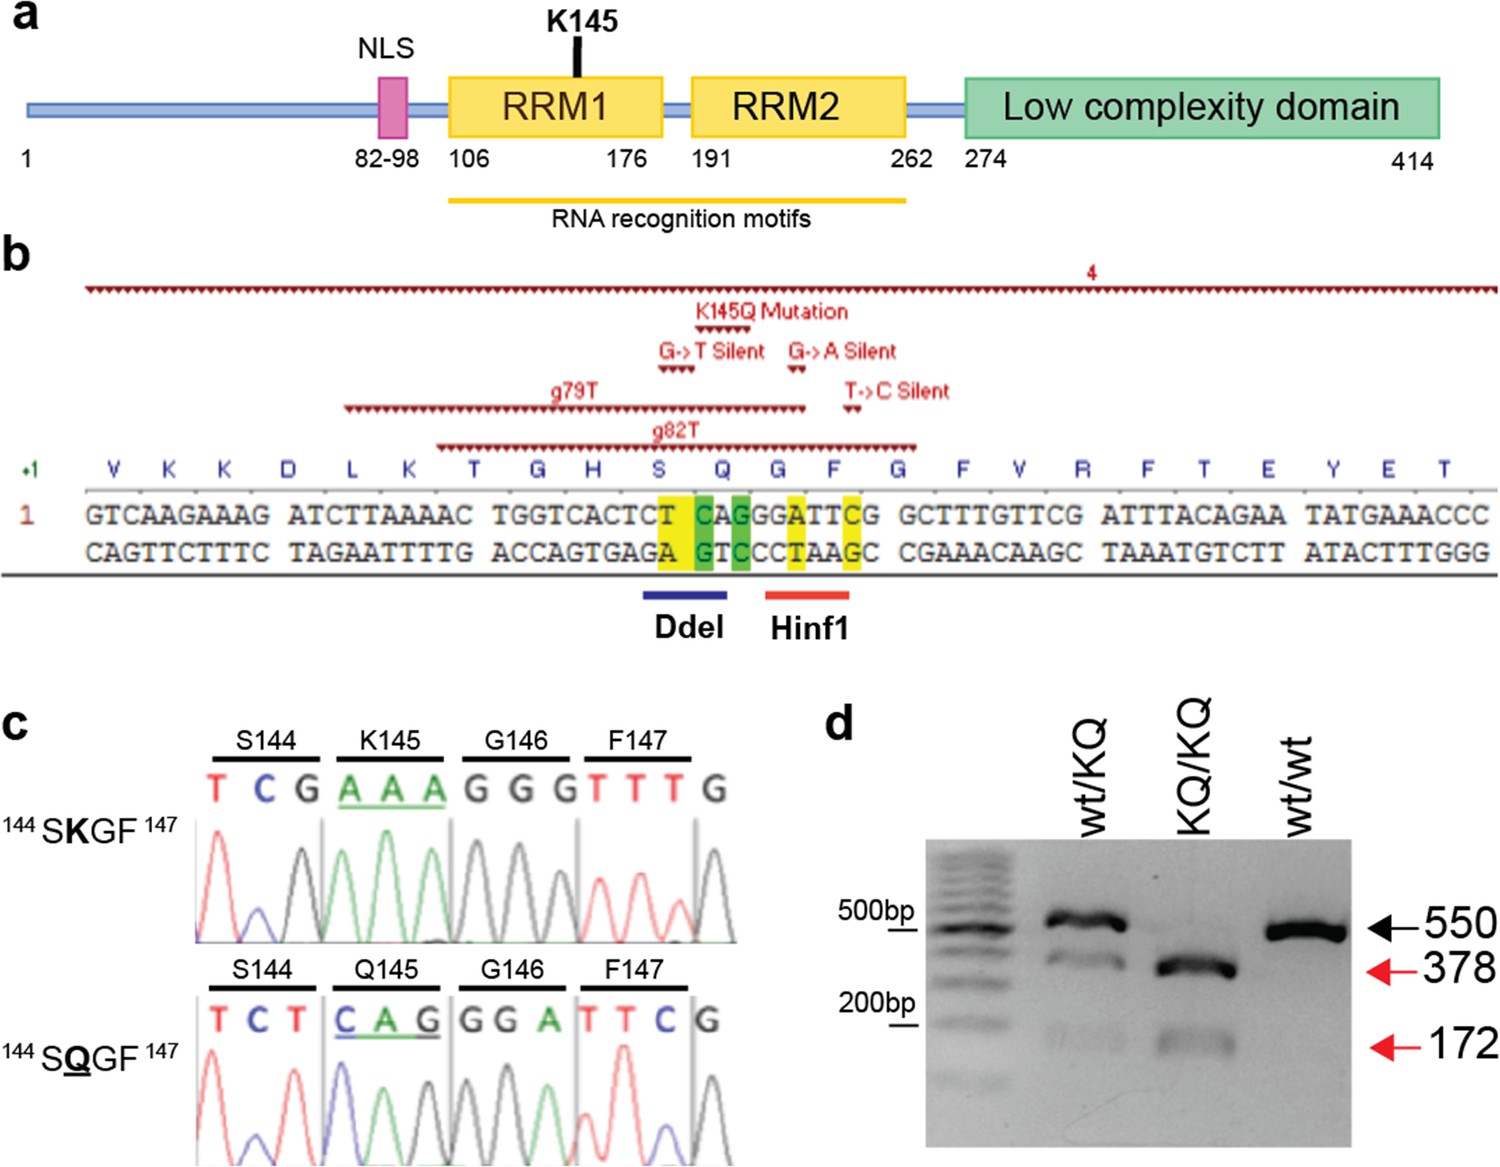
Generation, characterization, and genotyping of TDP-43K145Q knock-in mice.
(a) A schematic of the TDP-43 protein and its functional domains highlights the location of lysine 145 (K145) in the TDP-43 RNA-binding domain (RRM1). (b) Schematic of mouse Tardbp gene targeted with a validated guide RNA, g79T above, along with donor nucleotides to insert the K145Q mutation. Two silent mutations were included to create a Hinf1 enzyme digestion site to facilitate genotyping. (c) Chromatograph following Sanger sequencing confirms the inserted K145Q mutation in founder animals and subsequently propagated generations. (d) Gel electrophoresis of DNA fragments produced following PCR amplification of the modified Tardbp region and subsequent incubation of the PCR product with Hinf1 enzyme, which yielded a 550-bp band in TDP-43wt animals (wt/wt), both 378 and 172 bp bands in TDP-43KQ/KQ (KQ/KQ) animals, and all three bands in heterozygous animals (wt/KQ). Figures showing uncropped DNA gel blot images are available in Figure 2—figure supplement 1—source data 1 files.
-
Figure 2—figure supplement 1—source data 1
Figures showing labeled and unlabeled versions of the uncropped DNA gel image presented in Figure 2—figure supplement 1.
- https://cdn.elifesciences.org/articles/85921/elife-85921-fig2-figsupp1-data1-v1.zip
Figure 3 with 2 supplements
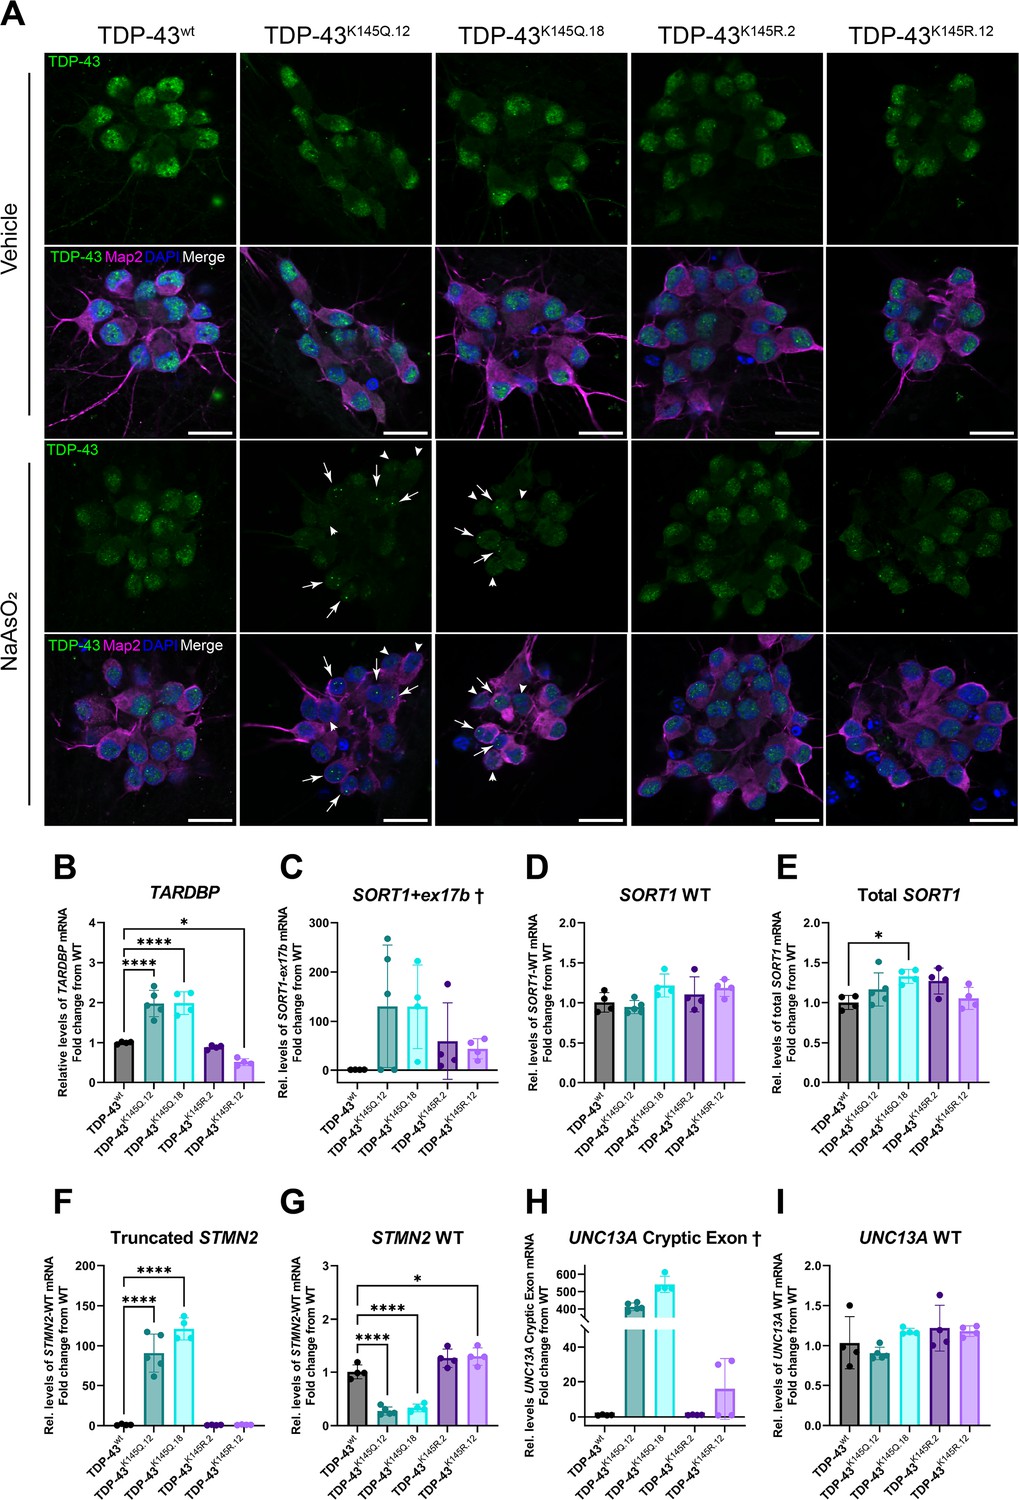
RNA-binding deficient TDP-43K145Q in human-induced pluripotent stem cell (iPSC)-derived mature cortical neurons alters TDP-43 distribution and causes disease-relevant splicing dysregulation.
(A) Representative confocal images of CRISPR-modified human iPSC-derived cortical neurons harboring homozygous TDP-43K145Q (clonal lines 12, 18) or TDP-43K145R (clonal lines 2, 12) knock-in mutations or an isogenic wild-type TDP-43wt control lacking TARDBP modifications. Differentiated cortical neurons were treated with vehicle or 200 µM NaAsO2 and then immunolabeled for endogenous TDP-43 (green), Map2 (magenta), and DAPI (blue). Scale bars = 20 µm. Arrows highlight nuclei with few, bright TDP-43+ foci. Arrowheads highlight nuclei with relative depletion of TDP-43 intensity. RT-qPCR analysis of hiPSC-derived mature cortical neuron samples using primers specific for (B) human Tardbp [F = 43.79, p < 0.0001], (C) SORT1+ex17b, (D) SORT1-WT [F = 2.975, p = 0.0516], (E) total SORT1 mRNA [F = 3.461, p = 0.0321], (F) truncated STMN2 [F = 79.06, p < 0.0001], (G) STMN2 WT [F = 63.93, p < 0.0001], (H) UNC13A cryptic exon, and (I) UNC13A WT mRNA [F = 2.116, p = 0.1262]. RT-qPCR results compared via ordinary one-way analysis of variance (ANOVA) (F statistics and p-values shown in brackets above) followed by Tukey’s multiple comparisons testing. Statistical significance of multiple comparisons testing is represented by asterisks *p < 0.05, ****p < 0.0001. †Graphs are provided for visualization purposes only, because non-detectable levels of UNC13A cryptic exon- and SORT1-ex17b-containing transcripts in some or all control TDP-43wt and TDP-43K145R neurons prevented statistical comparisons among groups and therefore no statistical significance was reported.
Figure 3—figure supplement 1
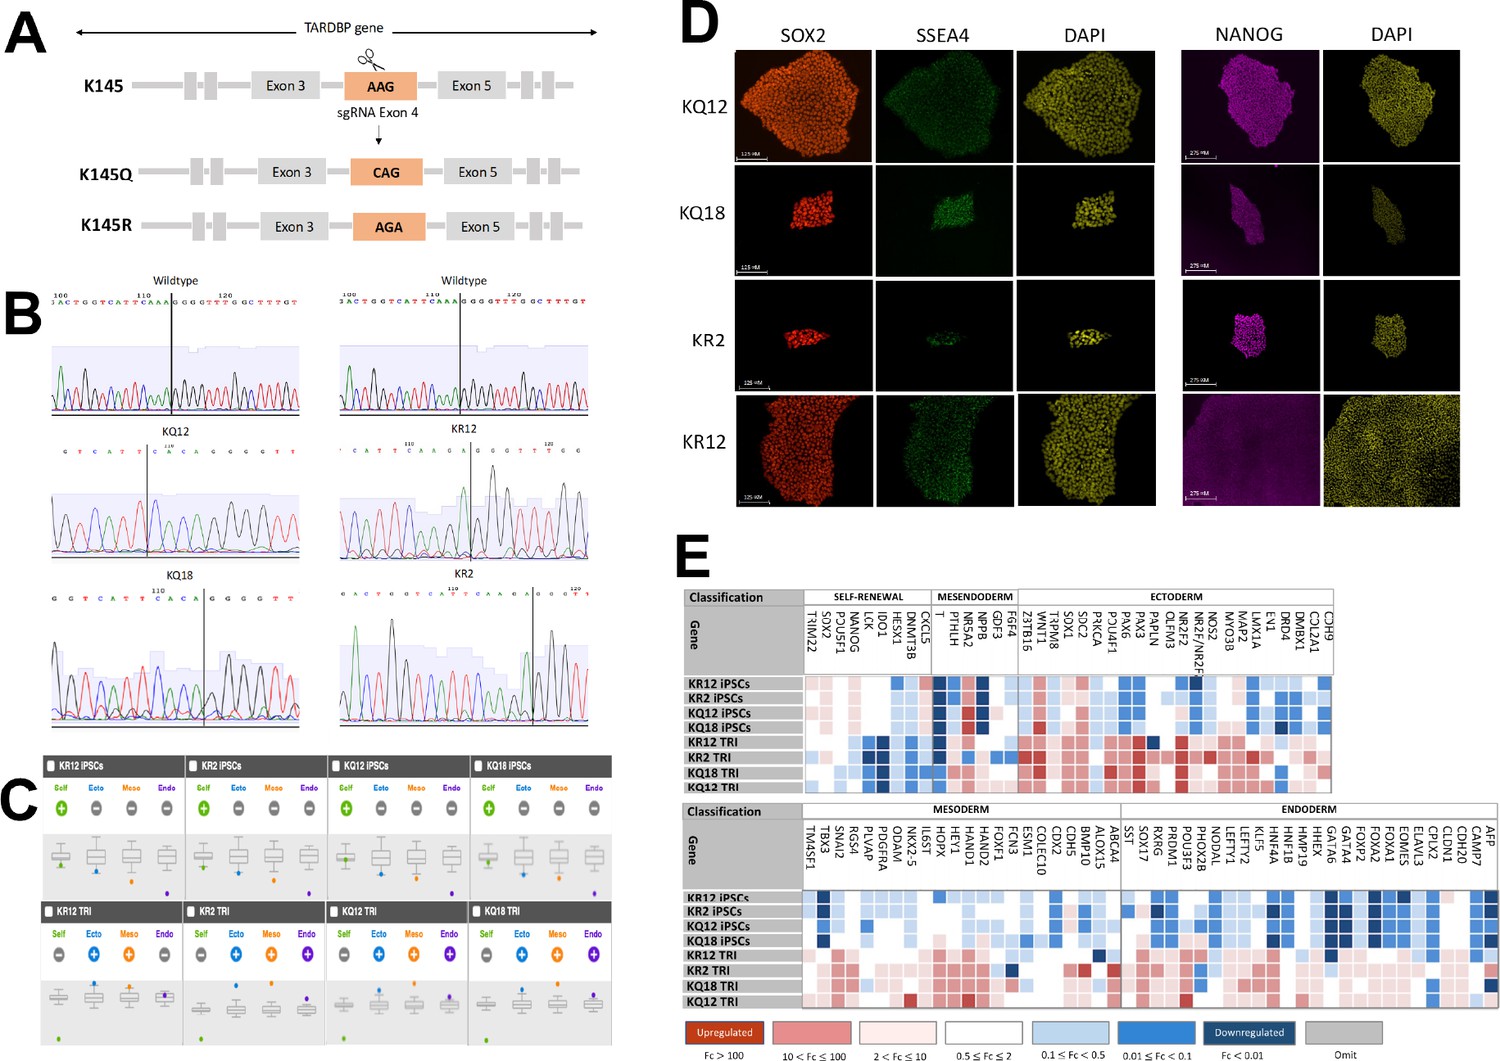
Development of endogenously encoded acetylation-mimic and acetylation-deficient TARDBP-induced pluripotent stem cell (iPSC) lines.
(A) Schematic representation of the nucleotide modifications introduced into exon 4 of the TARDBP locus to generate the K145Q and K145R substitutions. (B) Chromatograms following Sanger sequencing depicting the wild-type sequence and confirming the lysine modifications in two different subclones for each modification. (C) Immunofluorescence staining for pluripotency markers SOX2 (red), SSEA4 (green), and Nanog (magenta). Nuclear staining is shown in yellow. Scale bars = 125 µm (left) and 275 µm (right). (D, E) TaqMan human-induced pluripotent stem cell (hiPSC) Scorecard comparing the pluripotency and differentiated capacity to the three germ layers of K145Q and K145R edited clones. Panel (D) shows the differentiation index plots of self-renewal genes (green) and differentiation genes for ectoderm (blue), mesoderm (orange), and endoderm (purple) on undifferentiated (top) and day 7 differentiated cells (bottom). Panel (E) compares the gene expression profile of the undifferentiated and differentiated cells as a heatmap of the genes that are upregulated (red), have the same expression level (white), or are downregulated (blue). Color legends indicate the fold change in expression of the indicated gene from day 7 of differentiation into the three germ layers relative to the undifferentiated.
Figure 3—figure supplement 2

Human-induced pluripotent stem cell (iPSC)-derived cortical neuron differentiation.
(A) Schematic representation of the timeline of neuronal differentiation detailing culture conditions and identity markers at each cell stage. (B) Brightfield images illustrating cell morphology during the differentiation process on day 2 (top), day 12 (middle), and day 45 (bottom). Scale bars = 650 μm (top and middle) and 125 μm (bottom). (C) Immunofluorescence staining of SOX1 (green) and PAX6 (green) in neural progenitor cells (NPCs) at day 12, as well as MAP2 (red), SATB2 (cyan), GABA (green), and B-III tubulin (red) in mature cortical neurons at day 46. DAPI (blue) is used to label the nucleus. Scale bars = 125 μm.
Figure 4 with 3 supplements
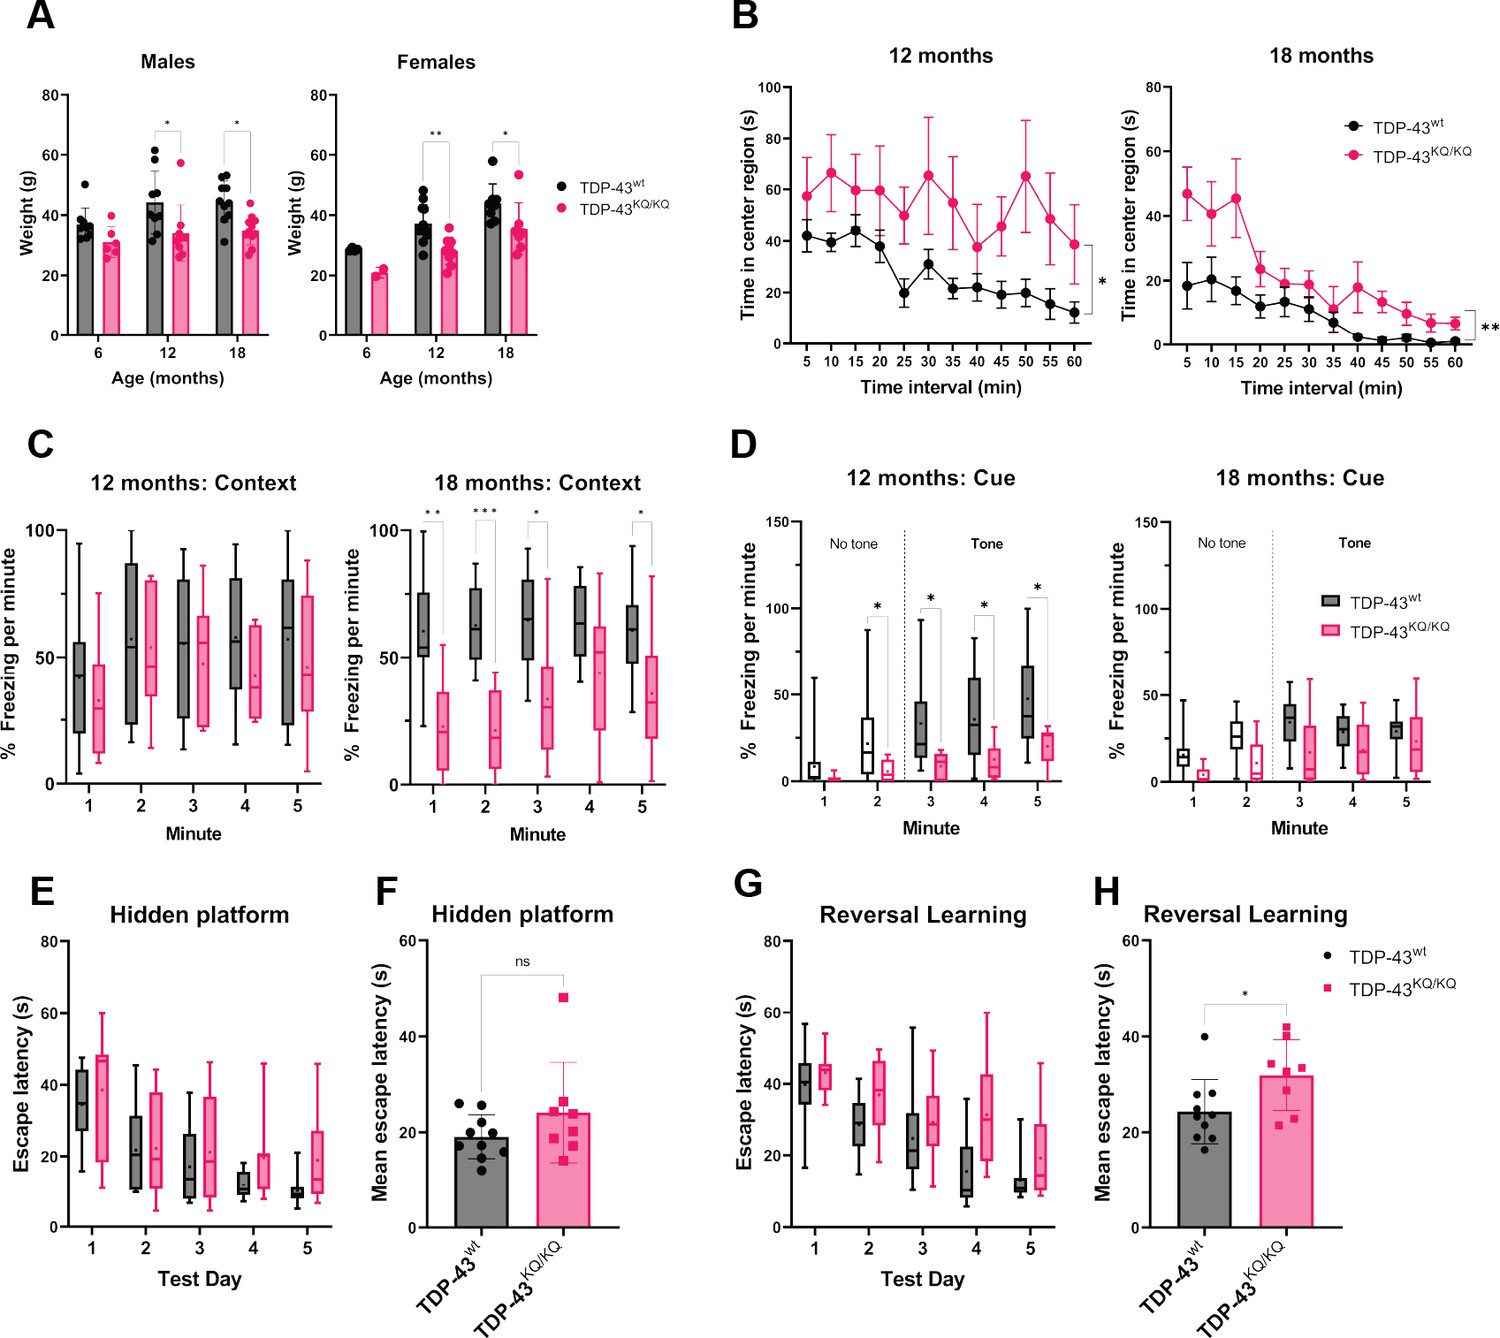
TDP-43KQ/KQ mice develop age-dependent cognitive and behavioral defects.
(A) Body weight of TDP-43wt and TDP-43KQ/KQ mice in males [left panel; F(1,48) = 17.52, p = 0.0001] and females [right panel; F(1,36) = 14.17, p = 0 .0006] at different ages. (B) Quantification of time in the center region of an open field in mice at 12 months [left panel; F(1,20) = 6.118, p = 0.0225] and 18 months [right panel; F(1,17) = 9.622, p = 0.0065]. (C) Quantification of time spent frozen (immobile) following context-dependent conditioned fear testing at 18 months old [right panel; F(1,17) = 5.402, p = 0.0328]. (D) Quantification of time spent frozen following cue-dependent conditioned fear testing at 12 months old [left panel; F(1,20) = 6.136, p = 0.0223] and 18 months old. Filled bars represent presence of auditory cue (tone) and period of statistical analysis. Morris Water Maze (MWM) analysis displaying time to find a hidden platform (escape latency), quantified as daily trial means per animal (E) or average across all days (F). Quantification of escape latencies during MWM reversal learning trials in daily trials (G) [F(1,16) = 5.273, p = 0.0355] and comparing averages per mouse across all days (H). Bar and scatter plots shown as mean ± standard deviation (SD). Box and whiskers show line at median, ‘+’ at mean, and whiskers run min to max. (A) Two-way analysis of variance (ANOVA) followed by Šídák’s multiple comparisons test. (B–D, E, G) Two-way repeated measures ANOVA followed by Holm–Šídák’s multiple comparisons tests; F statistics and p-values in legend represent main effect of genotype. (F, H) Unpaired Student’s t-test. Sample sizes as follows unless otherwise indicated: 12-month TDP-43wt n = 15; 12-month TDP-43KQ/KQ n = 7; 1-month TDP-43wt n = 10; 18-month TDP-43KQ/KQ n = 9; one 18-month TDP-43KQ/KQ extreme outlier removed for MWM analysis (E, F). Statistical significance is represented by asterisks *p < 0.05, **p < 0.01, ***p < 0.001; ns = not significant. Further statistical information is located in Figure 4—source data 1 file.
-
Figure 4—source data 1
Complete statistical results and information for quantitative elements shown in Figure 4.
- https://cdn.elifesciences.org/articles/85921/elife-85921-fig4-data1-v1.xlsx
Figure 4—figure supplement 1
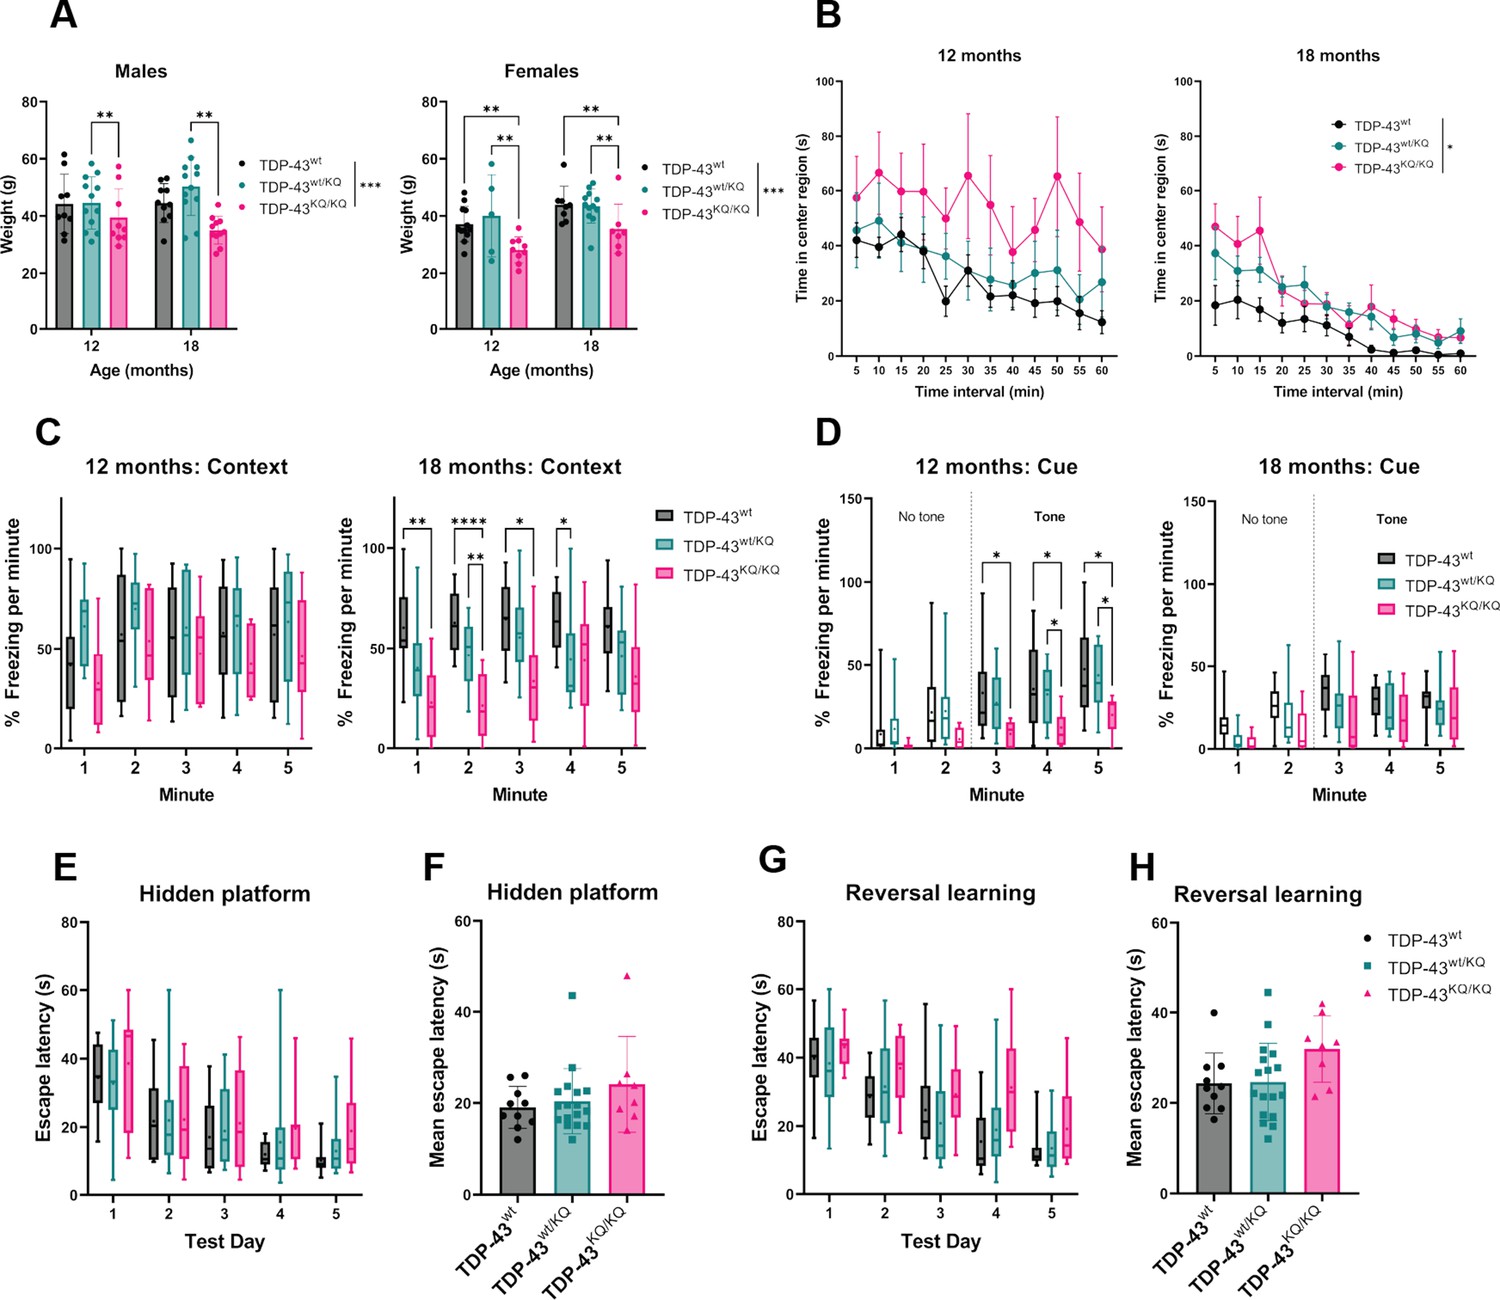
Heterozygous TDP-43wt/KQ animals exhibit mild cognitive and behavioral deficits at levels intermediate to TDP-43wt and TDP-43KQ/KQ mice.
(A) Body weight of TDP-43wt, TDP-43wt/KQ, and TDP-43KQ/KQ mice in males [left panel; F(2,59) = 7.794, p = 0.001] and females [right panel; F(2,59) = 8.744, p = 0.0006] at different ages. (B) Quantification of time in the center region of an open field in mice at 12 months [left panel; F(2,28) = 2.54, p = 0.0964] and 18 months [right panel; F(2,32) = 3.79, p = 0.0329]. (C) Quantification of time spent frozen (immobile) following context-dependent conditioned fear testing at 12 months old [left panel; F(2,28) = 1.43, p = 0.255] and 18 months old [right panel; F(2,33) = 9.13, p = 0.0007]. (D) Quantification of time spent frozen following cue-dependent conditioned fear testing at 12 months old [left panel; F(2,28) = 3.624, p = 0.0398] and 18 months old. Filled bars represent presence of auditory cue (tone) and period of statistical analysis. Morris Water Maze (MWM) analysis displaying time to find a hidden platform (escape latency), quantified as daily trial means per animal (E) or average across all days (F). Quantification of escape latencies during MWM reversal learning trials in daily trials (G) [F(2,32) = 2.788, p = 0.0765] and comparing averages per mouse across all days (H). Bar and scatter plots shown as mean ± standard deviation (SD). Box and whiskers show line at median, ‘+’ at mean, and whiskers run min to max. (A) Two-way analysis of variance (ANOVA) followed by Tukey’s multiple comparisons tests. (B–D, E, G) Two-way repeated measures ANOVA followed by Tukey’s multiple comparisons tests. (F, H) One-way ANOVA followed by Tukey’s multiple comparisons testing. F statistics and p-values in legend represent main effect of genotype. Sample sizes as follows unless otherwise indicated: 12-month TDP-43wt n = 15; 12-month TDP-43wt/KQ n = 9; 12-month TDP-43KQ/KQ n = 7; 18-month TDP-43wt n = 10; 18-month TDP-43wt/KQ n = 17; 18-month TDP-43KQ/KQ n = 9; one 18-month TDP-43KQ/KQ extreme outlier removed for MWM analysis (E, F). Statistical significance is represented by asterisks *p < 0.05, **p < 0.01, ***p < 0.001, ****p < 0.0001; ns = not significant. Further statistical information is available in Figure 4—figure supplement 1—source data 1 file.
-
Figure 4—figure supplement 1—source data 1
Complete statistical results and information for quantitative elements shown in Figure 4—figure supplement 1.
- https://cdn.elifesciences.org/articles/85921/elife-85921-fig4-figsupp1-data1-v1.xlsx
Figure 4—figure supplement 2
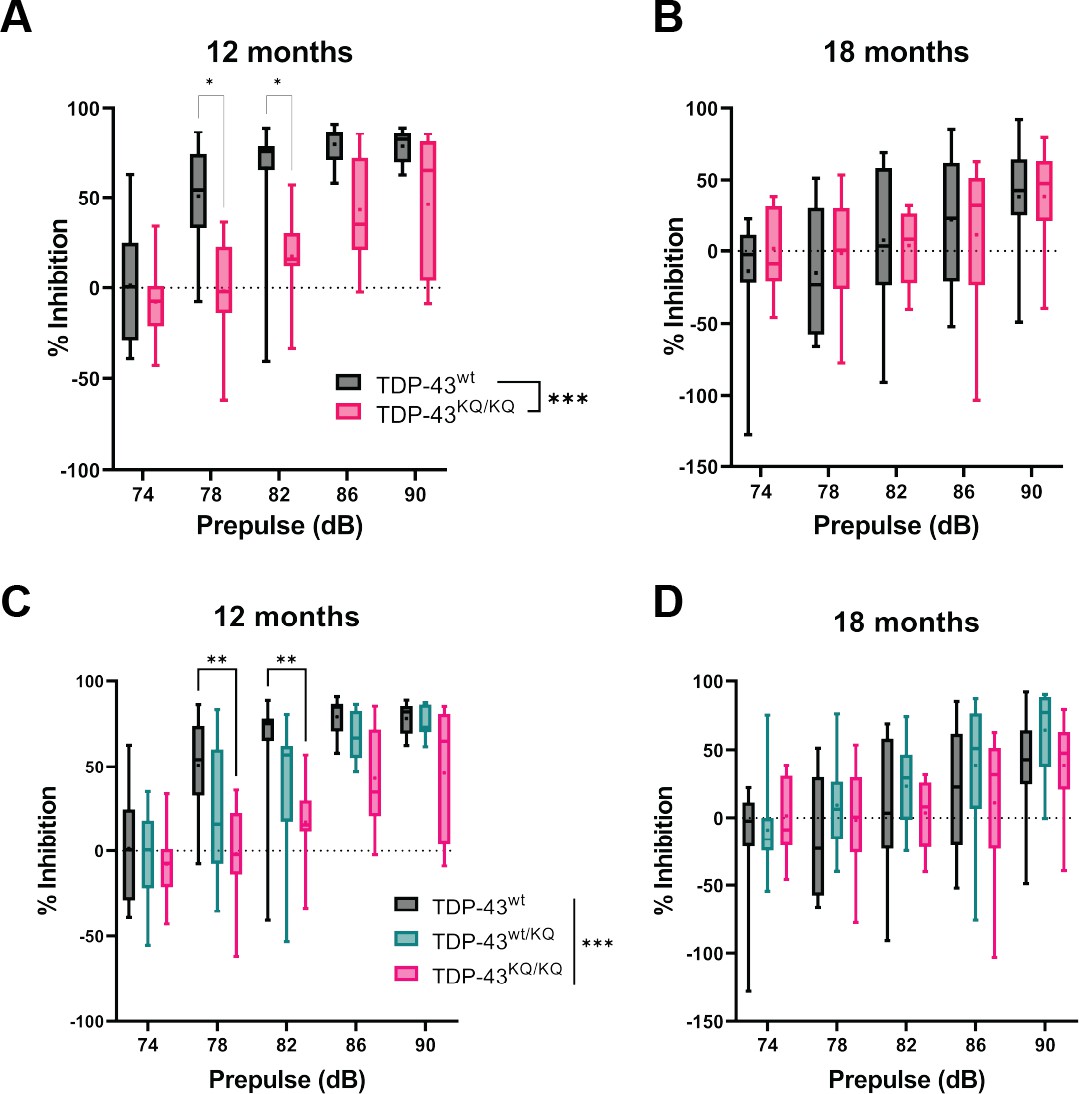
Altered sensorimotor gating and impaired prepulse inhibition (PPI) in TDP-43KQ/KQ mice.
Measurement of PPI during acoustic stimulus testing in TDP-43KQ/KQ and TDP-43wt mice showed significantly reduced PPI at (A) 12 months [F(1,20) = 19.90, p = 0.0002] but not at (B) 18 months old. (C, D) Inclusion of heterozygous TDP-43wt/KQ animals in analysis of PPI during acoustic stimulus testing demonstrates significantly reduced PPI in TDP-43KQ/KQ animals and an intermediate phenotype in TDP-43wt/KQ mice at 12 months [F(2,28) = 10.77, p = 0.0003] but not 18 months old. Box and whiskers show line at median, ‘+’ at mean, and whiskers run min to max. 12-month TDP-43wt n = 15; 12-month TDP-43wt/KQ n = 9; 12-month TDP-43KQ/KQ n = 7; 18-month TDP-43wt n = 10; 18-month TDP-43wt/KQ n = 17; 18-month TDP-43KQ/KQ n = 9. Two-way repeated measures analysis of variance (ANOVA) followed by Šídák’s multiple comparisons tests (A, B) or Tukey’s multiple comparisons tests (C, D). F statistics represent main effect of genotype. Statistical significance is indicated by asterisks *p < 0.05; **p < 0.01; ***p < 0.001. Further statistical information is located in Figure 4—figure supplement 2—source data 1 file.
-
Figure 4—figure supplement 2—source data 1
Complete statistical results and information for quantitative elements shown in Figure 4—figure supplement 2.
- https://cdn.elifesciences.org/articles/85921/elife-85921-fig4-figsupp2-data1-v1.xlsx
Figure 4—figure supplement 3

Lack of overt motor deficits in TDP-43KQ/KQ mice up to 18 months of age.
(A) Quantification of distance traveled by TDP-43wt and TDP-43KQ/KQ mice during open-field assays at 12 and 18 months of age. (B) Quantification of swim velocity during Morris Water Maze testing in mice at 18 months old. Assessment of latency to fall off an accelerating rotarod in TDP-43wt compared to TDP-43KQ/KQ mice at 18-month-old quantifying five individual trials (C) and the average latency to fall over all five trials at 6, 9, or 18 months old (D). (E) Grip strength in forepaws and all paws measured by digital force meters shows no genotype differences in grip strength at 18 months old. Scatter plots shown as mean ± standard deviation (SD). Box and whiskers show line at median, ‘+’ at mean, and whiskers run min to max. (A, C) Two-way repeated measures analysis of variance (ANOVA) followed by Holm–Šídák’s multiple comparisons tests; (B, D, E) two-way ANOVA followed by Holm–Šídák’s multiple comparisons tests. Sample sizes as follows: 6- and 9-month TDP-43wt n = 10; 6- and 9-month TDP-43KQ/KQ n = 8; 12-month TDP-43wt n = 15; 12-month TDP-43KQ/KQ n = 7; 18-month TDP-43wt n = 10; 18 month TDP-43KQ/KQ n = 9; one extreme outlier from 18-month TDP-43KQ/KQ group removed for open-field analysis (A). Further statistical information is located in Figure 4—figure supplement 2—source data 1 file.
-
Figure 4—figure supplement 3—source data 1
Complete statistical results and information for quantitative elements shown in Figure 4—figure supplement 3.
- https://cdn.elifesciences.org/articles/85921/elife-85921-fig4-figsupp3-data1-v1.xlsx
Figure 5 with 1 supplement
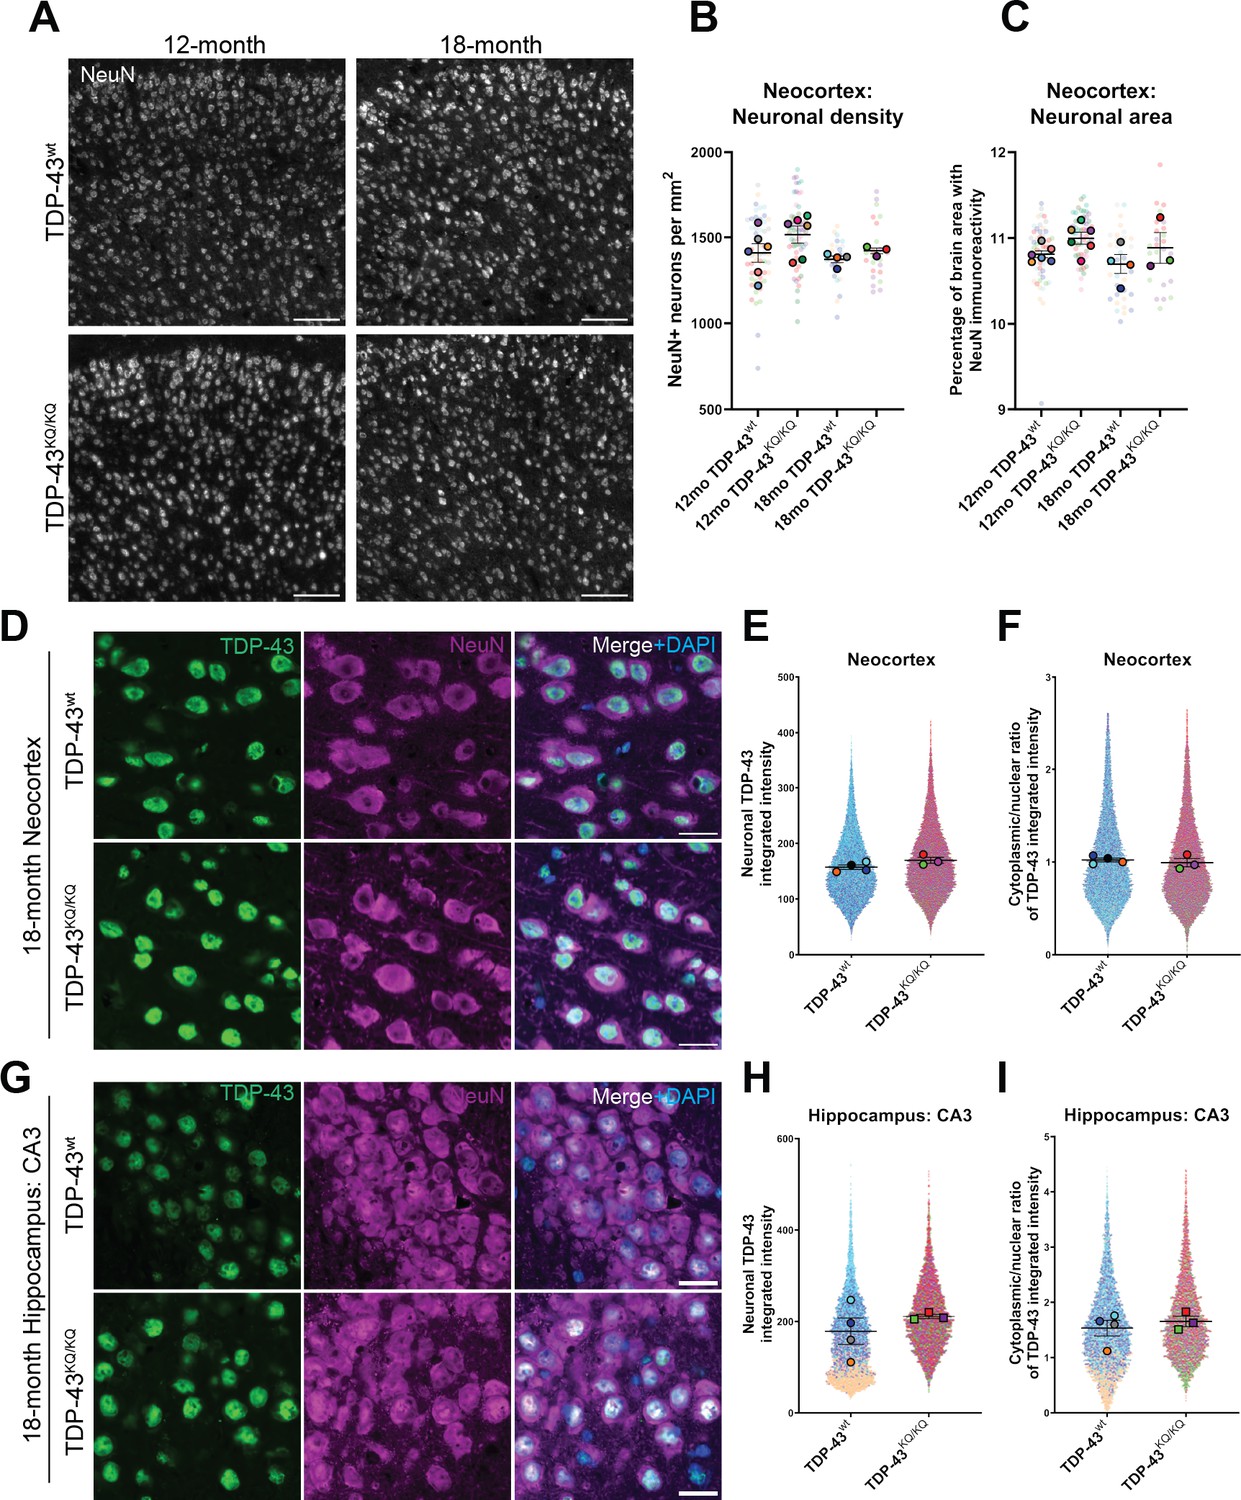
No evidence of neuronal loss in aged TDP-43KQ/KQ mice with retention of predominantly nuclear TDP-43.
(A) Representative confocal immunofluorescence images of NeuN+ neurons in the neocortex of 12- and 18-month TDP-43wt or TDP-43KQ/KQ mice. (B) Quantification of NeuN+ neurons per square millimeter (mm) in TDP-43wt and TDP-43KQ/KQ mice neocortex. (C) Quantification of the percent of neocortex area that is occupied by cells with NeuN immunoreactivity. Representative confocal images of neocortex (D) and hippocampus (G) sections from 18-month-old TDP-43wt and TDP-43KQ/KQ mice immunolabeled with TDP-43 (green), NeuN (magenta), and DAPI (blue). (E, H) Quantification of TDP-43 fluorescence intensity within NeuN+ neurons in the neocortex (F) or hippocampal CA3 region (H). (F, I) Quantification of the nuclear:cytoplasmic ratio of TDP-43 fluorescence intensity within NeuN+ neurons in the neocortex (F) and hippocampus (I). Scale bars = 100 µm (A), 20 µm (D, G). SuperPlots (Lord et al., 2020) show average value per animal in solid color bordered symbol (as mean ± standard error of the mean [SEM]) over top of semi-transparent individual values from each animal. One color represents one animal. Individual datapoints in (B) and (C) represent density in a single field of view, with 10–16 fields across 4 brain sections per animal, n = 3–4 mice per genotype of 18-month-old animals and n = 6 mice per genotype of 12-month-old animals. Individual datapoints in E, F and H, I represent values from a single neuron within one field of view, with 1000–5000 neurons per animal across 12–16 fields from 4 (neocortex) or 2 (hippocampus) brain sections of n = 3–4 mice per genotype of 18-month-old animals. Statistical analyses performed using linear mixed-effect models. Omission of asterisks indicates no statistical significance.
Figure 5—figure supplement 1
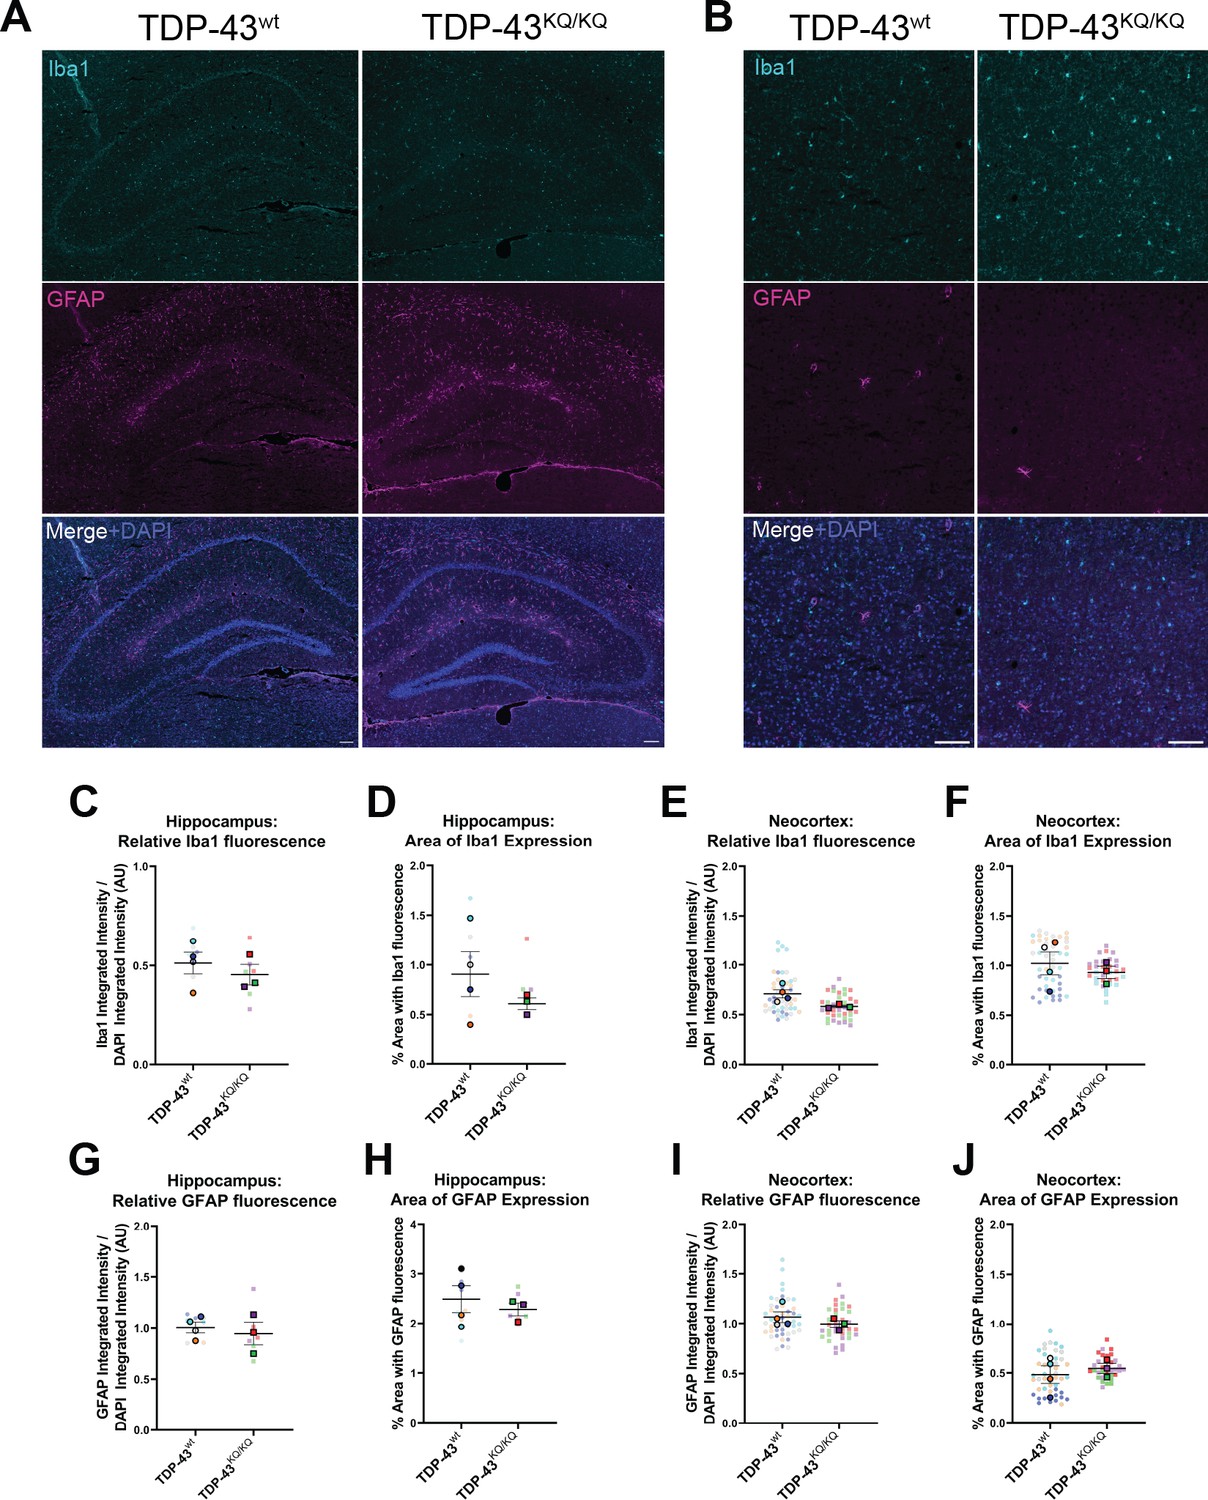
No evidence of astrogliosis or microgliosis in the hippocampus or neocortex of 18-month-old TDP-43KQ/KQ mice.
Representative widefield microscopy images of immunofluorescent labeling of microglia (Iba1+ cells, top panel), astrocytes (GFAP+ cells, middle panel) and a DAPI counterstain (merged image, bottom panel) of 18-month TDP-43wt or TDP-43KQ/KQ mouse hippocampus (A) and neocortex (B). Quantification of Iba1 protein expression as measured by the integrated intensity of Iba1 fluorescence relative to DAPI fluorescence in the hippocampus (C) and neocortex (E), and by the percent of the brain region occupied by Iba1 fluorescence in the hippocampus (D) and neocortex (F). (G–J) Quantification of GFAP protein expression as measured by the integrated intensity of GFAP fluorescence relative to DAPI fluorescence in the hippocampus (C) and neocortex (E), and by the percent of the brain region occupied by GFAP fluorescence in the hippocampus (D) and neocortex (F). SuperPlots (Lord et al., 2020) show average value per animal in a solid color bordered symbol (as mean ± standard error of the mean [SEM]) over top of semi-transparent individual values from each animal. One color represents one animal. Individual datapoints in C, D, G, H represent one image of bilateral hippocampi from a coronal brain section (two sections per animal). Individual datapoints in E, F, I, J represent one image of a unilateral segment of neocortex from a coronal brain section (6 sections per animal, total of 12 cortical regions imaged). For statistical analyses in C–J, average values from n = 4 TDP-43wt and n = 3 TDP-43KQ/KQ 18month mice were compared using unpaired student’s t-tests.
Figure 6 with 3 supplements
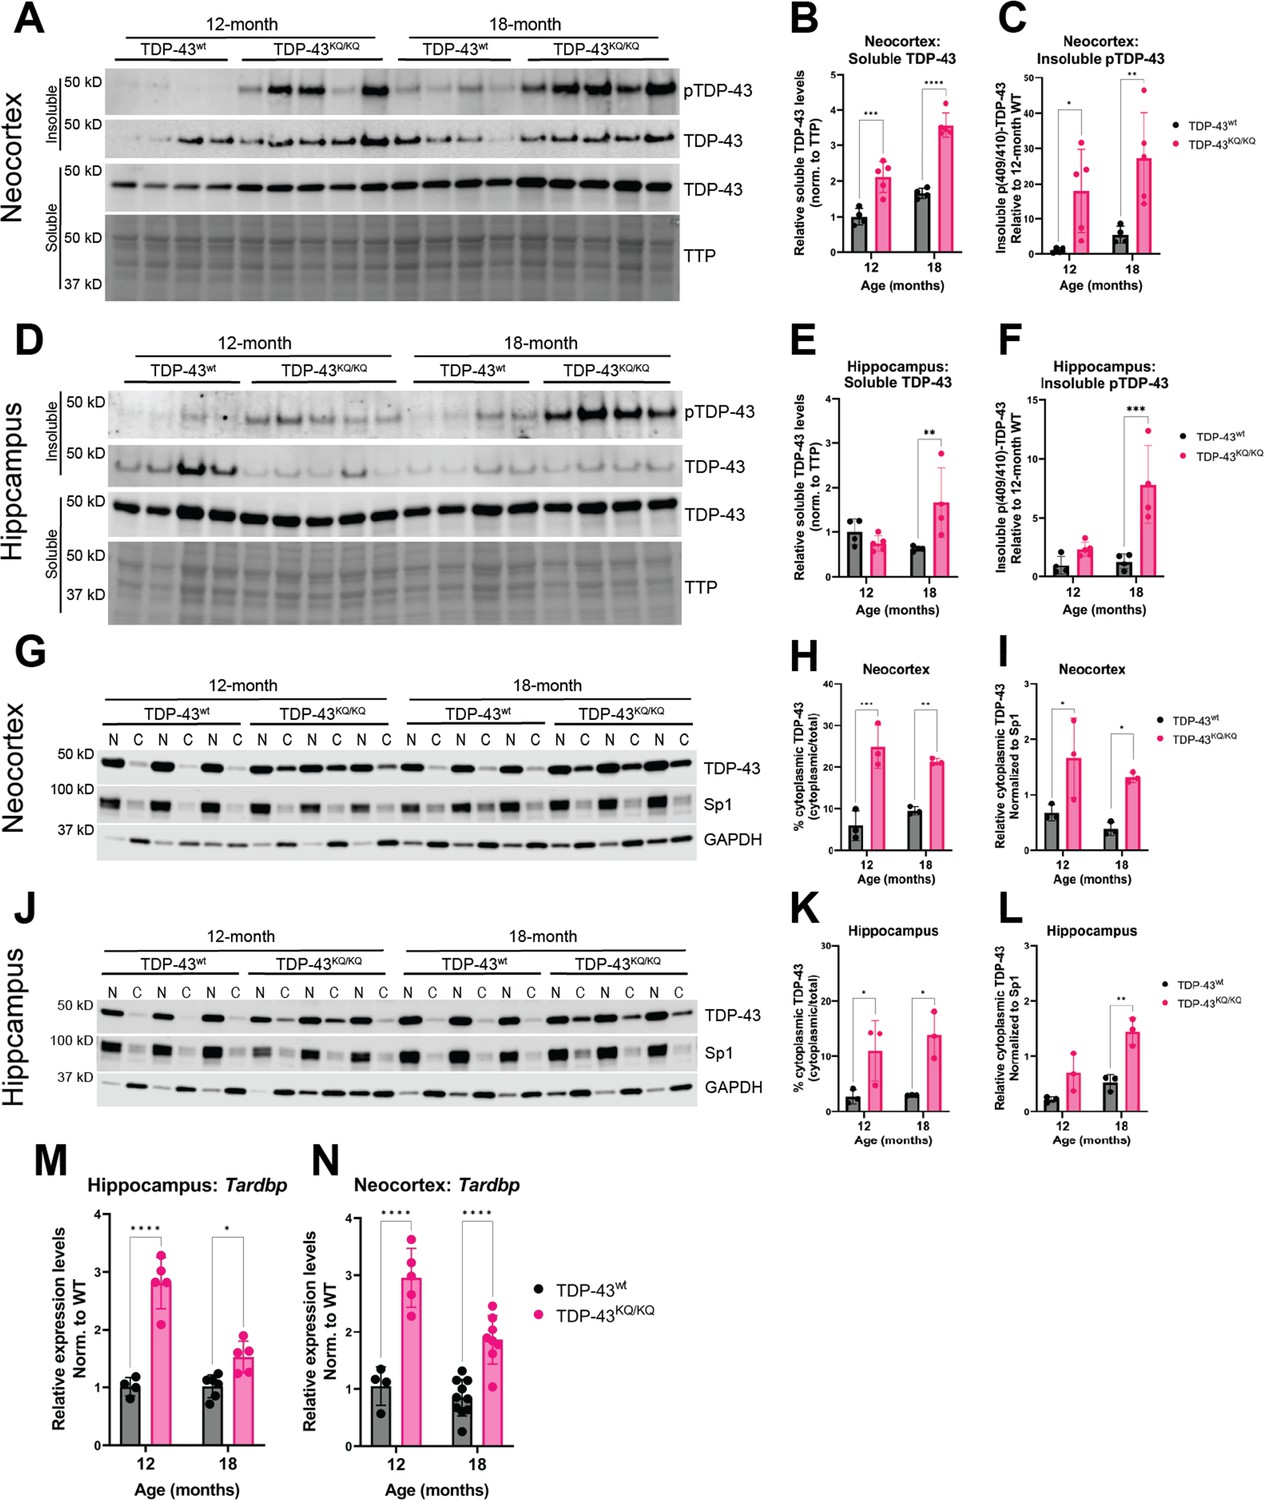
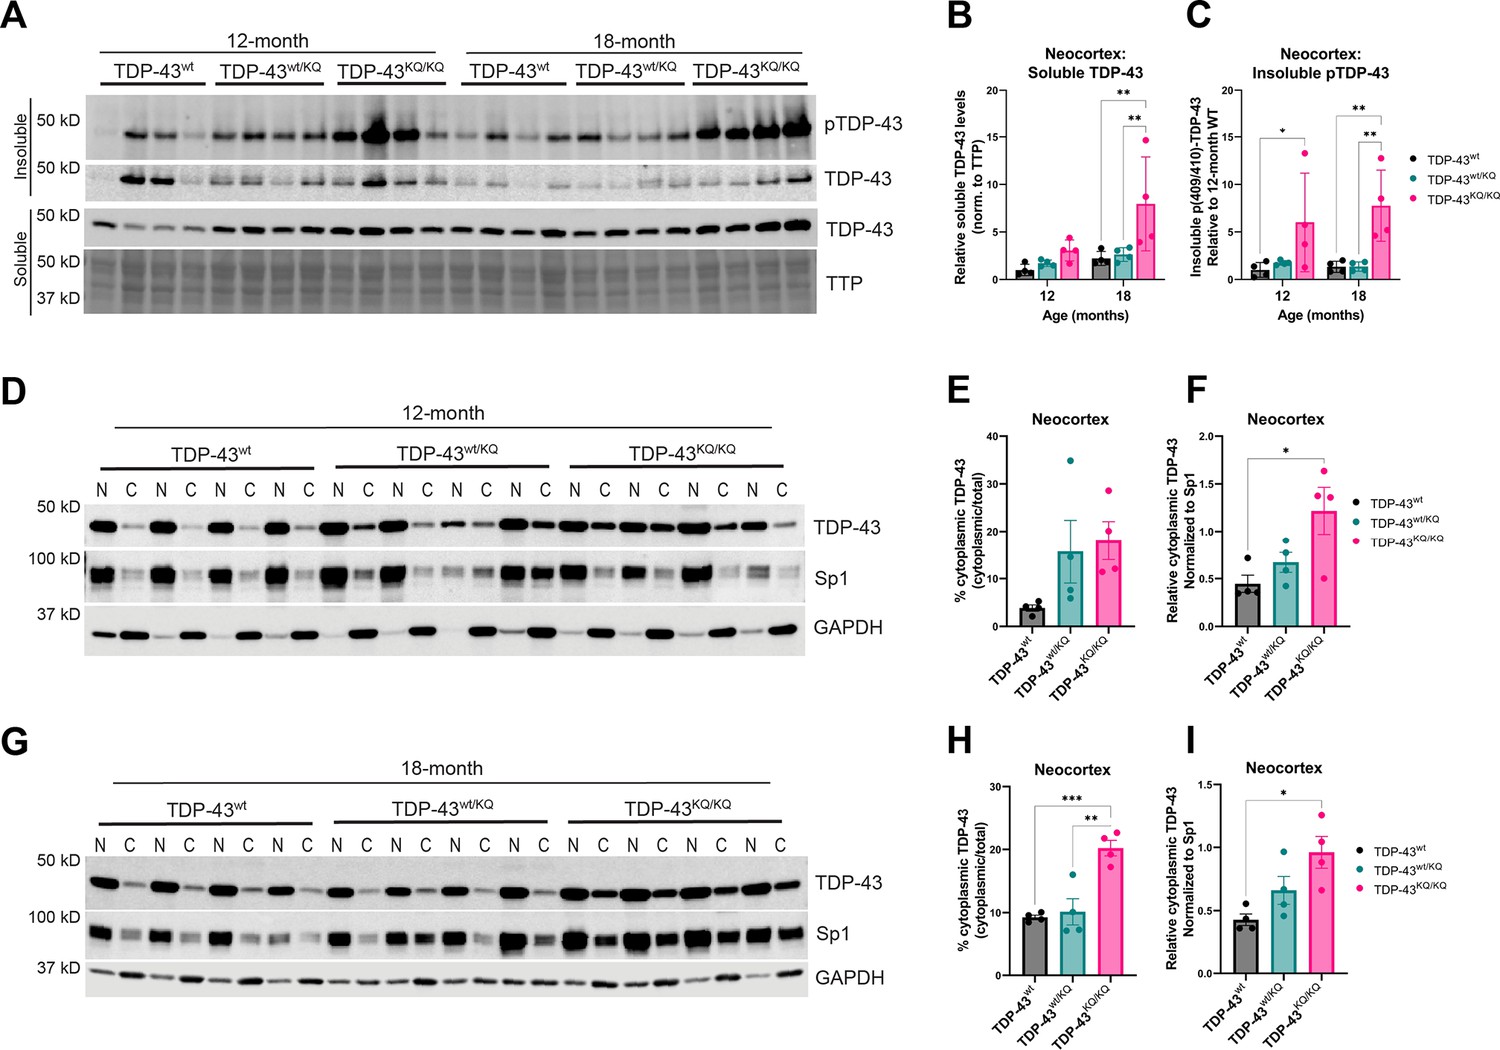
Hyperphosphorylated and mislocalized TDP-43 protein and autoregulated induction of the Tardbp transcript is found in the neocortex and hippocampus of aged TDP-43KQ/KQ mice.
(A–F) Western blot images comparing soluble and insoluble protein fractions in neocortex (A) and hippocampus (D) from TDP-43wt and TDP-43KQ/KQ mice at 12 and 18 months of age. Quantification of soluble TDP-43 protein levels in neocortex and hippocampus tissue relative to total transferred protein (TTP) (neocortex (B) F(1,14) = 97.67, p < 0.0001; hippocampus (E) main effect of genotype F(1,13) = 3.699, p = 0.0766 and main effect of genotype × age interaction F(1,13) = 10.21, p = 0.0070). Quantification of insoluble phosphorylated p(409/410)-TDP-43 levels in neocortex and hippocampus tissue [neocortex (C) F(1,14) = 18.81, p = 0.0007; hippocampus (F) F(1,13) = 23.07, p = 0.0003]. (G–I) Western blot images following isolation of soluble nuclear and cytoplasmic protein fractions from neocortex (G) and hippocampus (J) of TDP-43wt and TDP-43KQ/KQ mice at 12 and 18 months of age. (J–L) Quantification of cytoplasmic TDP-43 measured as percent of total TDP-43 in neocortex and hippocampus [neocortex (H) F(1,8) = 69.38, p < 0.0001; hippocampus (K) F(1,8) = 22.40, p = 0.0015] and relative cytoplasmic mislocalization of TDP-43 after normalizing to cytoplasmic/nuclear ratio of the nuclear Sp1 protein in neocortex and hippocampus (neocortex (I) F(1,8) = 19.79, p = 0.0021; hippocampus (L) F(1,8) = 29.94, p = 0.0006). Tardbp expression was analyzed by qPCR in the (M) hippocampus [F(1,16) = 76.86; p < 0.0001] and (N) neocortex [F(1,23) = 80.74; p < 0.0001] of TDP-43KQ/KQ and TDP-43wt mice at 12 and 18 months old. Relative expression (RQ) values in each sample were determined using the Plaff method and B-actin and Pgk1 as housekeeping genes. (A–F) n = 4 TDP-43wt and n = 5 TDP-43KQ/KQ at all ages and regions except 18-month hippocampus n = 4 TDP-43KQ/KQ. (F–L) n = 4 all ages and regions. (M) Neocortex n = 4 12-month TDP-43wt, n = 5 12-month TDP-43KQ/KQ, n = 10 18-month TDP-43wt, n = 9 18-month TDP-43KQ/KQ. (N) Hippocampus n = 4 12-month TDP-43wt, n = 5 12-month TDP-43KQ/KQ, n = 6 18-month TDP-43wt, n = 6 18-month TDP-43KQ/KQ. Data are presented as mean ± standard deviation (SD). Two-way analysis of variance (ANOVA) followed by Šídák’s multiple comparisons test. F statistics represent the main effect of genotype unless otherwise stated. Statistical significance represented by asterisks, *p < 0.05, **p < 0.01, ***p < 0.001, ****p < 0.0001. Further statistical information is available in Figure 6—source data 1 file. Figures showing uncropped western blot images are available in Figure 6—source data 2 files. Full images of western blots are available in Figure 6—source data 3 files.
-
Figure 6—source data 1
Complete statistical results and information for quantitative elements shown in Figure 6.
- https://cdn.elifesciences.org/articles/85921/elife-85921-fig6-data1-v1.xlsx
-
Figure 6—source data 2
Figures showing uncropped western blot images of those presented in Figure 6A,D,G,J.
- https://cdn.elifesciences.org/articles/85921/elife-85921-fig6-data2-v1.zip
-
Figure 6—source data 3
Full uncropped images of western blots shown in Figure 6.
- https://cdn.elifesciences.org/articles/85921/elife-85921-fig6-data3-v1.zip
Figure 6—figure supplement 1
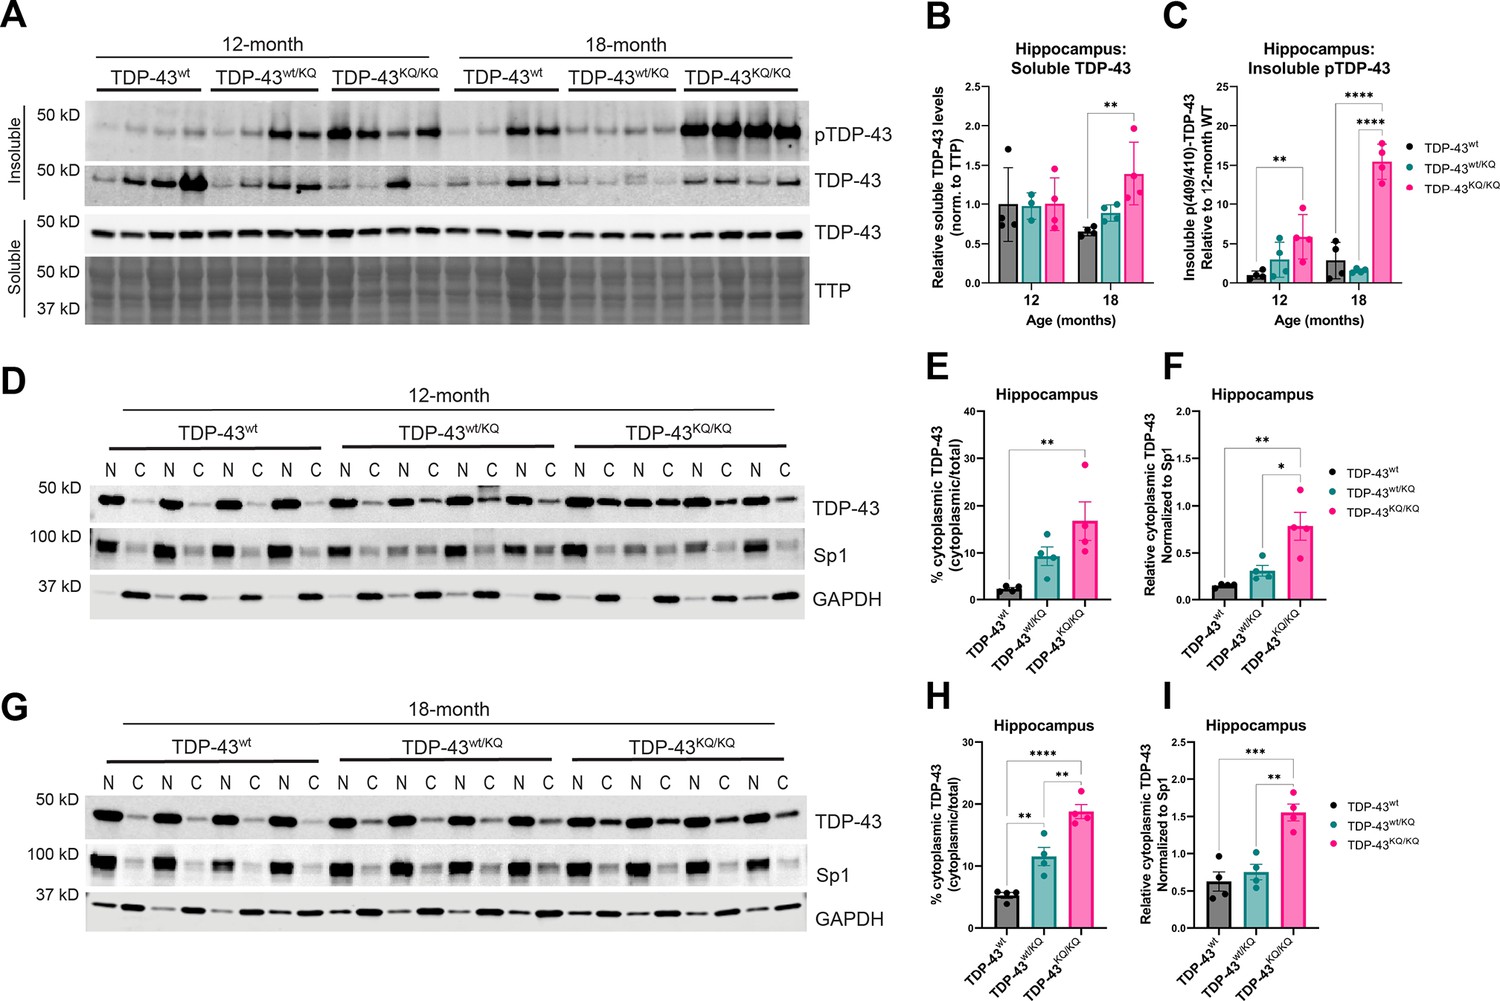
Intermediate levels of TDP-43 hyperphosphorylation and mislocalization in the hippocampus of aged heterozygous TDP-43wt/KQ compared to TDP-43wt and homozygous TDP-43KQ/KQ mice.
(A) Western blot images comparing soluble and insoluble protein fractions in the hippocampus from TDP-43wt, TDP-43wt/KQ, and TDP-43KQ/KQ mice at 12 and 18 months of age. (B) Quantification of soluble TDP-43 protein levels in hippocampus tissue relative to total transferred protein (TTP) [F(1,14) = 97.67, p < 0.0001 and main effect of genotype × age interaction F(1,13) = 10.21, p = 0.0070]. (C) Quantification of insoluble phosphorylated p(409/410)-TDP-43 levels in hippocampus [F(1,13) = 23.07, p = 0.0003]. (D) Western blot images following isolation of soluble nuclear and cytoplasmic protein fractions from the hippocampus of TDP-43wt, TDP-43wt/KQ, and TDP-43KQ/KQ mice at 12 months of age. Quantification of cytoplasmic TDP-43 measured as (E) a percent of total TDP-43 [F(1,8) = 22.40, p = 0.0015] and (F) relative cytoplasmic mislocalization of TDP-43 after normalizing to cytoplasmic/nuclear ratio of the nuclear Sp1 protein [F(1,8) = 29.94, p = 0.0006]. (G) Western blot images following isolation of soluble nuclear and cytoplasmic protein fractions from the hippocampus of TDP-43wt, TDP-43wt/KQ, and TDP-43KQ/KQ mice at 18 months of age. Quantification of cytoplasmic TDP-43 measured as (H) a percent of total TDP-43 [F(1,8) = 22.40, p = 0.0015] and (I) relative cytoplasmic mislocalization of TDP-43 after normalizing to cytoplasmic/nuclear ratio of the nuclear Sp1 protein [F(1,8) = 29.94, p = 0.0006]. (A–I) Hippocampus samples from n = 4 animals for each genotype and age tested. Data are presented as mean ± standard deviation (SD). (B, C) Two-way analysis of variance (ANOVA) followed by Tukey’s multiple comparisons testing. (E–H) One-way ANOVA followed by Tukey’s multiple comparisons testing. F statistics represent the main effect of genotype unless otherwise stated. Statistical significance represented by asterisks, *p < 0.05, **p < 0.01, ***p < 0.001, ****p < 0.0001. Further statistical information is located in Figure 6—figure supplement 1—source data 1 file. Figures showing uncropped western blot images are available in Figure 6—figure supplement 1—source data 2 files. Full images of western blots are available in Figure 6—figure supplement 1—source data 3 files.
-
Figure 6—figure supplement 1—source data 1
Complete statistical results and information for quantitative elements shown in Figure 6—figure supplement 1.
- https://cdn.elifesciences.org/articles/85921/elife-85921-fig6-figsupp1-data1-v1.xlsx
-
Figure 6—figure supplement 1—source data 2
Figures showing uncropped western blot images of those presented in Figure 6—figure supplement 1A,D,G.
- https://cdn.elifesciences.org/articles/85921/elife-85921-fig6-figsupp1-data2-v1.zip
-
Figure 6—figure supplement 1—source data 3
Full uncropped images of western blots shown in Figure 6—figure supplement 1.
- https://cdn.elifesciences.org/articles/85921/elife-85921-fig6-figsupp1-data3-v1.zip
Figure 6—figure supplement 2
Intermediate levels of TDP-43 hyperphosphorylation and mislocalization in the neocortex of aged heterozygous TDP-43wt/KQ compared to TDP-43wt and homozygous TDP-43KQ/KQ mice.
(A) Western blot images comparing soluble and insoluble protein fractions in the neocortex from TDP-43wt, TDP-43wt/KQ, and TDP-43KQ/KQ mice at 12 and 18 months of age. (B) Quantification of soluble TDP-43 protein levels in hippocampus tissue relative to total transferred protein (TTP) [F(2,17) = 3.110, p = 0.0706]. (C) Quantification of insoluble phosphorylated p(409/410)-TDP-43 levels in neocortex [F(2,18) = 49.76, p < 0.0001]. (D) Western blot images following isolation of soluble nuclear and cytoplasmic protein fractions from the neocortex of TDP-43wt, TDP-43wt/KQ, and TDP-43KQ/KQ mice at 12 months of age. Quantification of cytoplasmic TDP-43 measured as (E) a percent of total TDP-43 [F(2,9) = 7.617, p = 0.0116] and (F) relative cytoplasmic mislocalization of TDP-43 after normalizing to cytoplasmic/nuclear ratio of the nuclear Sp1 protein [F(2,9) = 12.91, p = 0.0023]. (G) Western blot images following isolation of soluble nuclear and cytoplasmic protein fractions from the neocortex of TDP-43wt, TDP-43wt/KQ, and TDP-43KQ/KQ mice at 18 months of age. Quantification of cytoplasmic TDP-43 measured as (H) a percent of total TDP-43 [F (2,9) = 37.88, p < 0.0001] and (I) relative cytoplasmic mislocalization of TDP-43 after normalizing to cytoplasmic/nuclear ratio of the nuclear Sp1 protein [F(2, 9) = 19.09, p = 0.0006]. (A–I) Neocortex samples from n = 4 animals for each genotype and age tested. Data are presented as mean ± standard deviation (SD). (B, C) Two-way analysis of variance (ANOVA) followed by Tukey’s multiple comparisons testing. (E–H) One-way ANOVA followed by Tukey’s multiple comparisons testing. F statistics represent the main effect of genotype unless otherwise stated. Statistical significance represented by asterisks, *p < 0.05, **p < 0.01, ***p < 0.001. Further statistical information is located in Figure 6—figure supplement 2—source data 1 file. Figures showing uncropped western blot images are available in Figure 6—figure supplement 2—source data 2 files. Full images of western blots are available in Figure 6—figure supplement 2—source data 3 files.
-
Figure 6—figure supplement 2—source data 1
Complete statistical results and information for quantitative elements shown in Figure 6—figure supplement 2.
- https://cdn.elifesciences.org/articles/85921/elife-85921-fig6-figsupp2-data1-v1.xlsx
-
Figure 6—figure supplement 2—source data 2
Figures showing uncropped western blot images of those presented in Figure 6—figure supplement 2A,D,G.
- https://cdn.elifesciences.org/articles/85921/elife-85921-fig6-figsupp2-data2-v1.zip
-
Figure 6—figure supplement 2—source data 3
Full uncropped images of western blots shown in Figure 6—figure supplement 2.
- https://cdn.elifesciences.org/articles/85921/elife-85921-fig6-figsupp2-data3-v1.zip
Figure 6—figure supplement 3
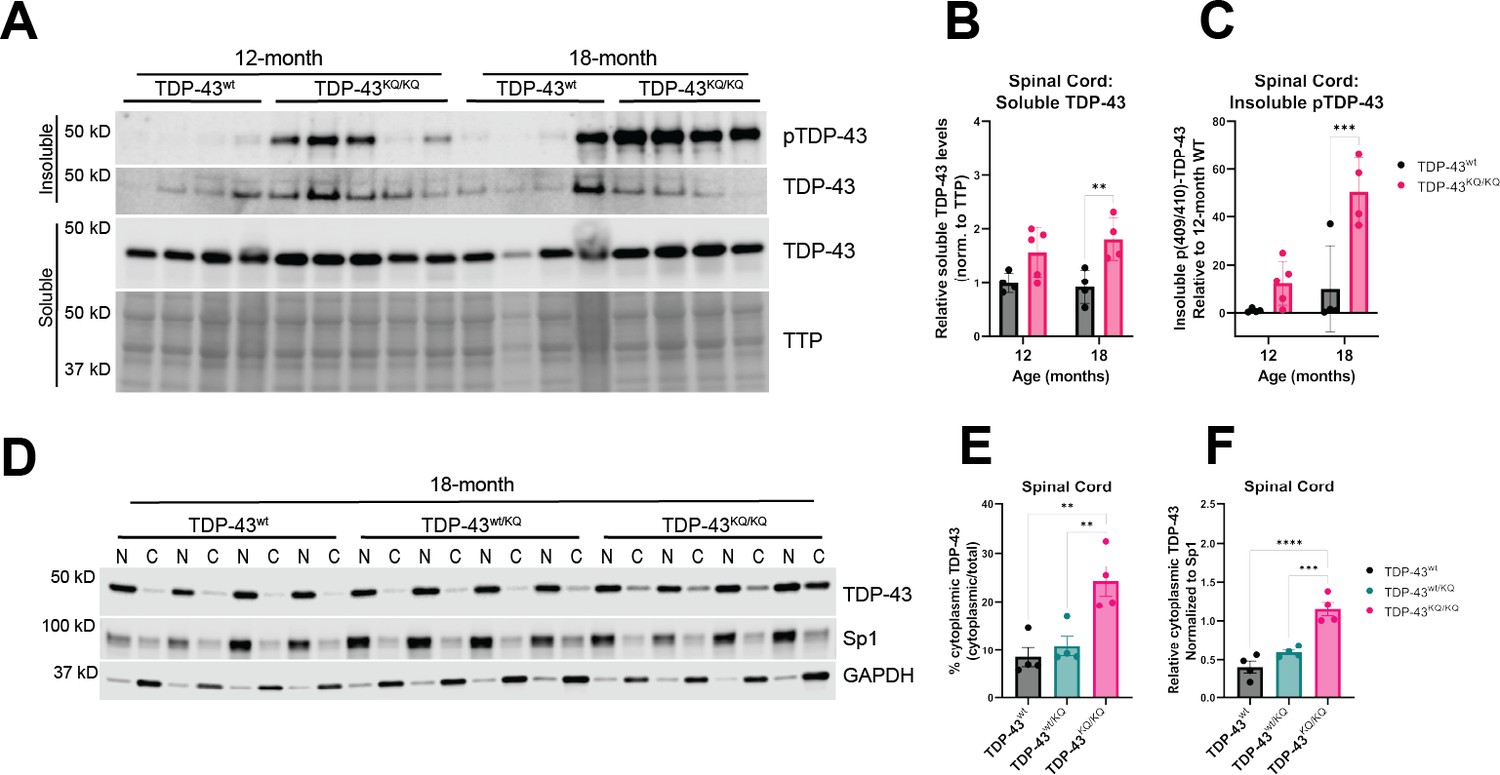
Spinal cord tissue from aged TDP-43KQ/KQ mice contains insoluble, hyperphosphorylated, and mislocalized TDP-43.
(A) Western blot images comparing soluble and insoluble protein fractions in spinal cord tissue from TDP-43wt and TDP-43KQ/KQ mice at 12 and 18 months of age. (B) Quantification of soluble TDP-43 protein levels in the spina cord relative to total transferred protein (TTP) [F(1,13) = 17.13, p = 0.0012]. (C) Quantification of insoluble phosphorylated p(409/410)-TDP-43 levels in spinal cord tissue [F (1,13) = 19.27, p = 0.0007]. (D) Western blot images following isolation of soluble nuclear and cytoplasmic protein fractions from the spinal cord of TDP-43wt, TDP-43wt/KQ, and TDP-43KQ/KQ mice at 18 months of age. Quantification of cytoplasmic TDP-43 measured as (E) a percent of total TDP-43 [F(2,9) = 12.02, p = 0.0029] and (F) relative cytoplasmic mislocalization of TDP-43 after normalizing to cytoplasmic/nuclear ratio of the nuclear Sp1 protein [F(2,9) = 30.53, p < 0.0001]. (B, C) Two-way ANOVA followed by Tukey's multiple comparisons testing. (E, F) One-way ANOVA followed by Tukey’s multiple comparisons testing. All F statistics represent the main effect of genotype unless otherwise stated. Statistical significance represented by asterisks, **p<0.01, ***p<0.001, ****p<0.0001. Further statistical information is located in Figure 6—figure supplement 3—source data 1 file. Figures showing uncropped western blot images are available in Figure 6—figure supplement 3—source data 2 files. Full images of western blots are available in Figure 6—figure supplement 3—source data 3 files.
-
Figure 6—figure supplement 3—source data 1
Complete statistical results and information for quantitative elements shown in Figure 6—figure supplement 3.
- https://cdn.elifesciences.org/articles/85921/elife-85921-fig6-figsupp3-data1-v1.xlsx
-
Figure 6—figure supplement 3—source data 2
Figures showing uncropped western blot images of those presented in Figure 6—figure supplement 3A,D.
- https://cdn.elifesciences.org/articles/85921/elife-85921-fig6-figsupp3-data2-v1.zip
-
Figure 6—figure supplement 3—source data 3
Full uncropped images of western blots shown in Figure 6—figure supplement 3.
- https://cdn.elifesciences.org/articles/85921/elife-85921-fig6-figsupp3-data3-v1.zip
Figure 7 with 2 supplements
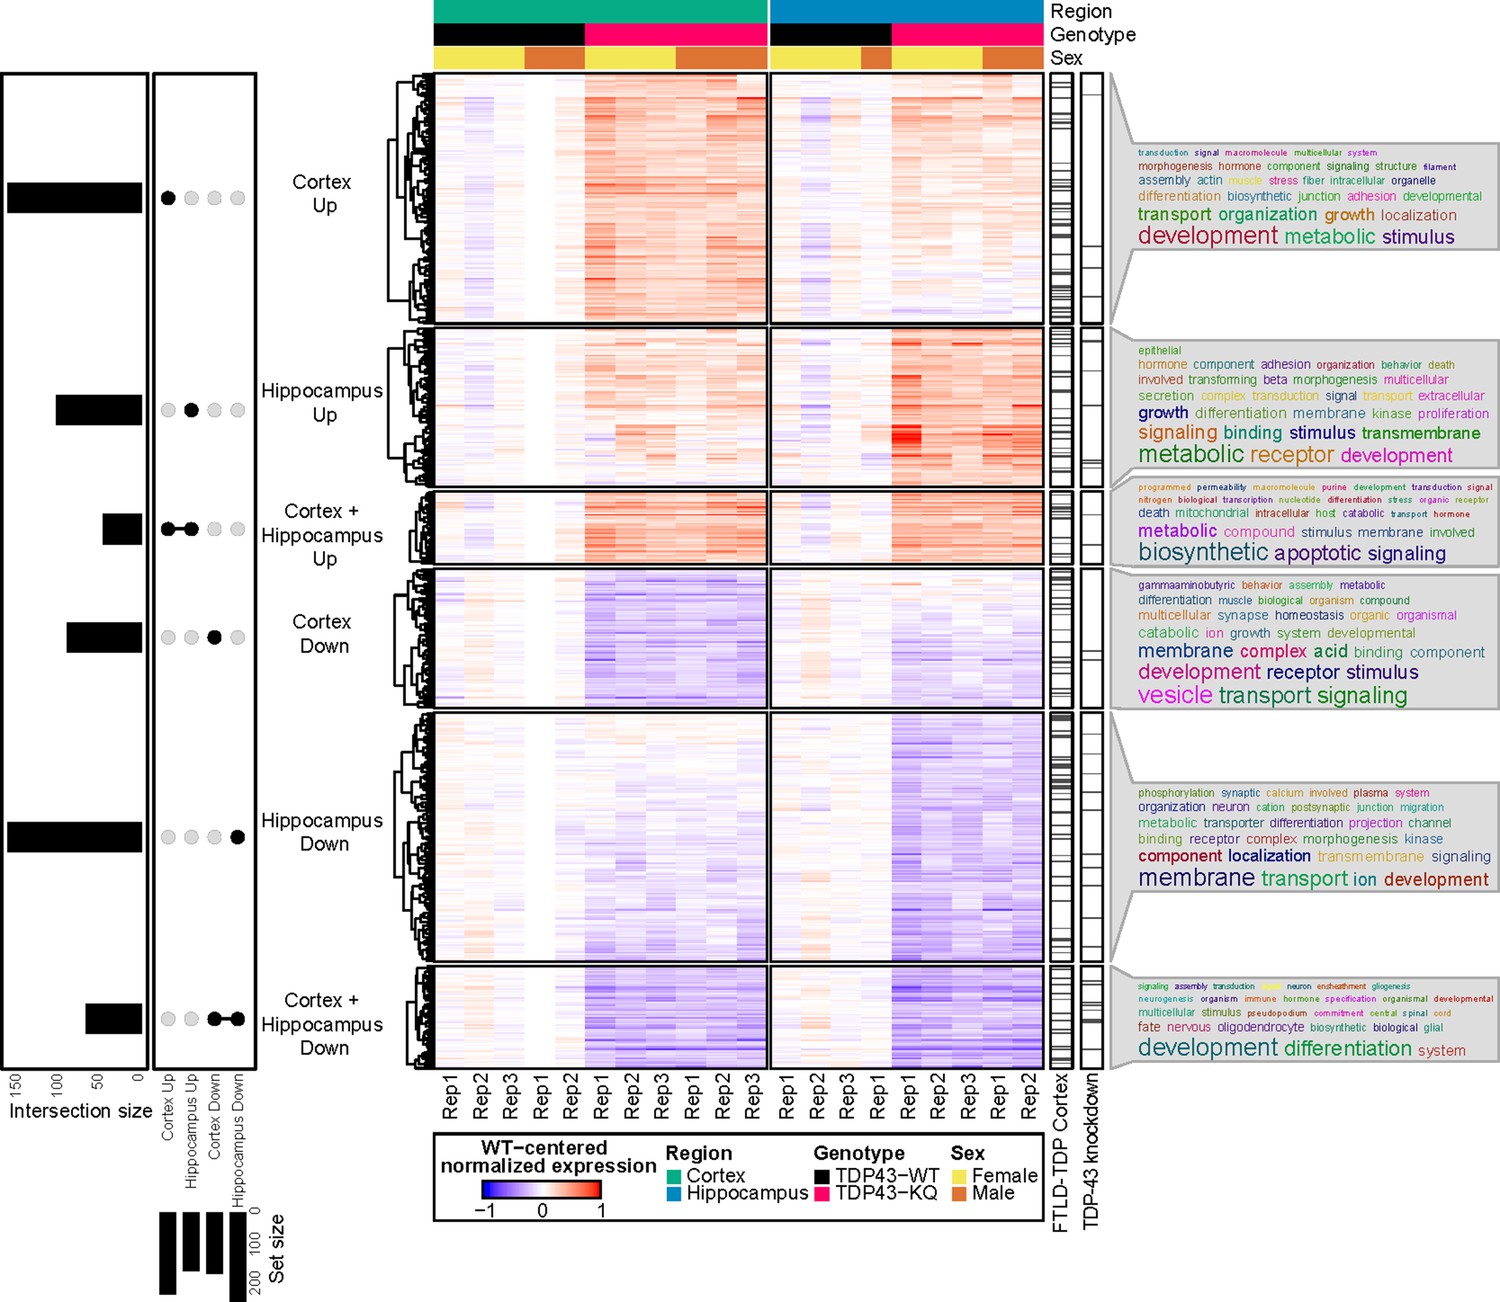
RNA sequencing of aged TDP-43KQ/KQ mouse brain reveals dysregulation of neurodegeneration and FTLD-TDP-associated pathways.
Genes differentially expressed between TDP-43KQ/KQ (TDP43-KQ) and TDP-43wt (TDP43-WT) cortex and hippocampus were compared and their intersections were defined as six gene groups, as represented by an UpSet plot (left). Normalized gene expression values, centered around the mean of TDP-43wt samples for each brain region, were then hierarchically clustered and plotted as a heatmap (center, red indicates expression higher than that of WT, blue indicates expression lower than WT). Genes that were significantly altered in human FTLD-TDP temporal and/or frontal cortex (Hasan et al., 2022, ‘FTLD-TDP Cortex’ bar), or striatal mouse brain TDP-43-knockdown (Polymenidou et al., 2011, ‘TDP-43 knockdown’ bar) were demarcated with tick marks. Each gene group was assessed for over-enrichment of Gene Ontology terms and these results were summarized as word clouds (right). Neocortex n = 5 TDP-43wt, n = 6 TDP-43KQ/KQ; hippocampus n = 4 TDP-43wt, n = 5 TDP-43KQ/KQ.
Figure 7—figure supplement 1
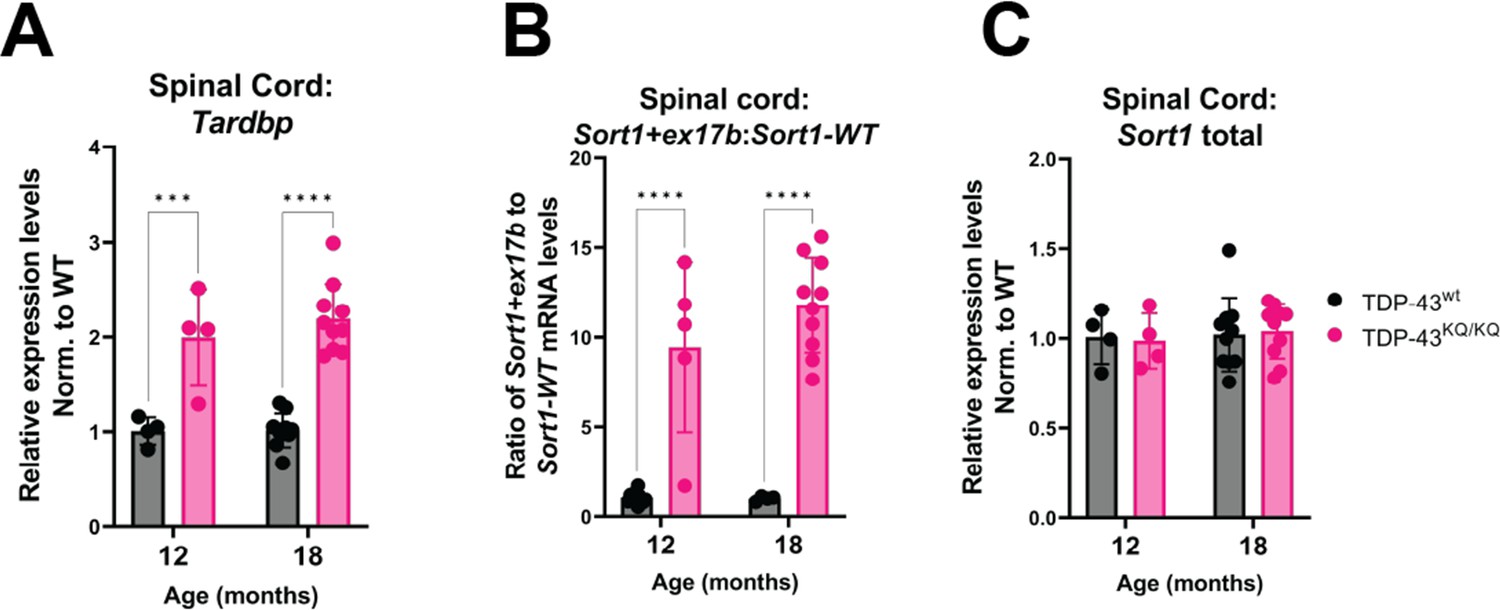
Spinal cord tissue from TDP-43KQ/KQ mice shows evidence of altered TDP-43 autoregulation and aberrant splicing of Sort1 compared to TDP-43wt.
(A) Tardbp expression was analyzed by qPCR in the spinal cord of TDP-43wt and TDP-43KQ/KQ animals at 12 and 18 months old [F(1,24) = 68.79, p < 0.0001]. qPCR analysis of WT and TDP-43KQ/KQ spinal cord tissue samples using primers specific for Sort1 splice variants to show (B) the ratio of Sort1-ex17b:Sort1-WT mRNA levels [F(1,25) = 92.18, p < 0.0001] and (C) total Sort1 mRNA levels. Relative expression (RQ) values in each sample were determined using the Plaff method and B-actin and Pgk1 as housekeeping genes. Data are presented as mean ± standard deviation (SD) and F statistic represents main effect of genotype, unless otherwise stated. Two-way analysis of variance (ANOVA) followed by Šídák’s multiple comparisons test. ***p <0 .001, ****p < 0.0001. Further statistical information is available in Figure 7—figure supplement 1—source data 1 file.
-
Figure 7—figure supplement 1—source data 1
Complete statistical results and information for quantitative elements shown in Figure 7—figure supplement 1.
- https://cdn.elifesciences.org/articles/85921/elife-85921-fig7-figsupp1-data1-v1.xlsx
Figure 7—figure supplement 2
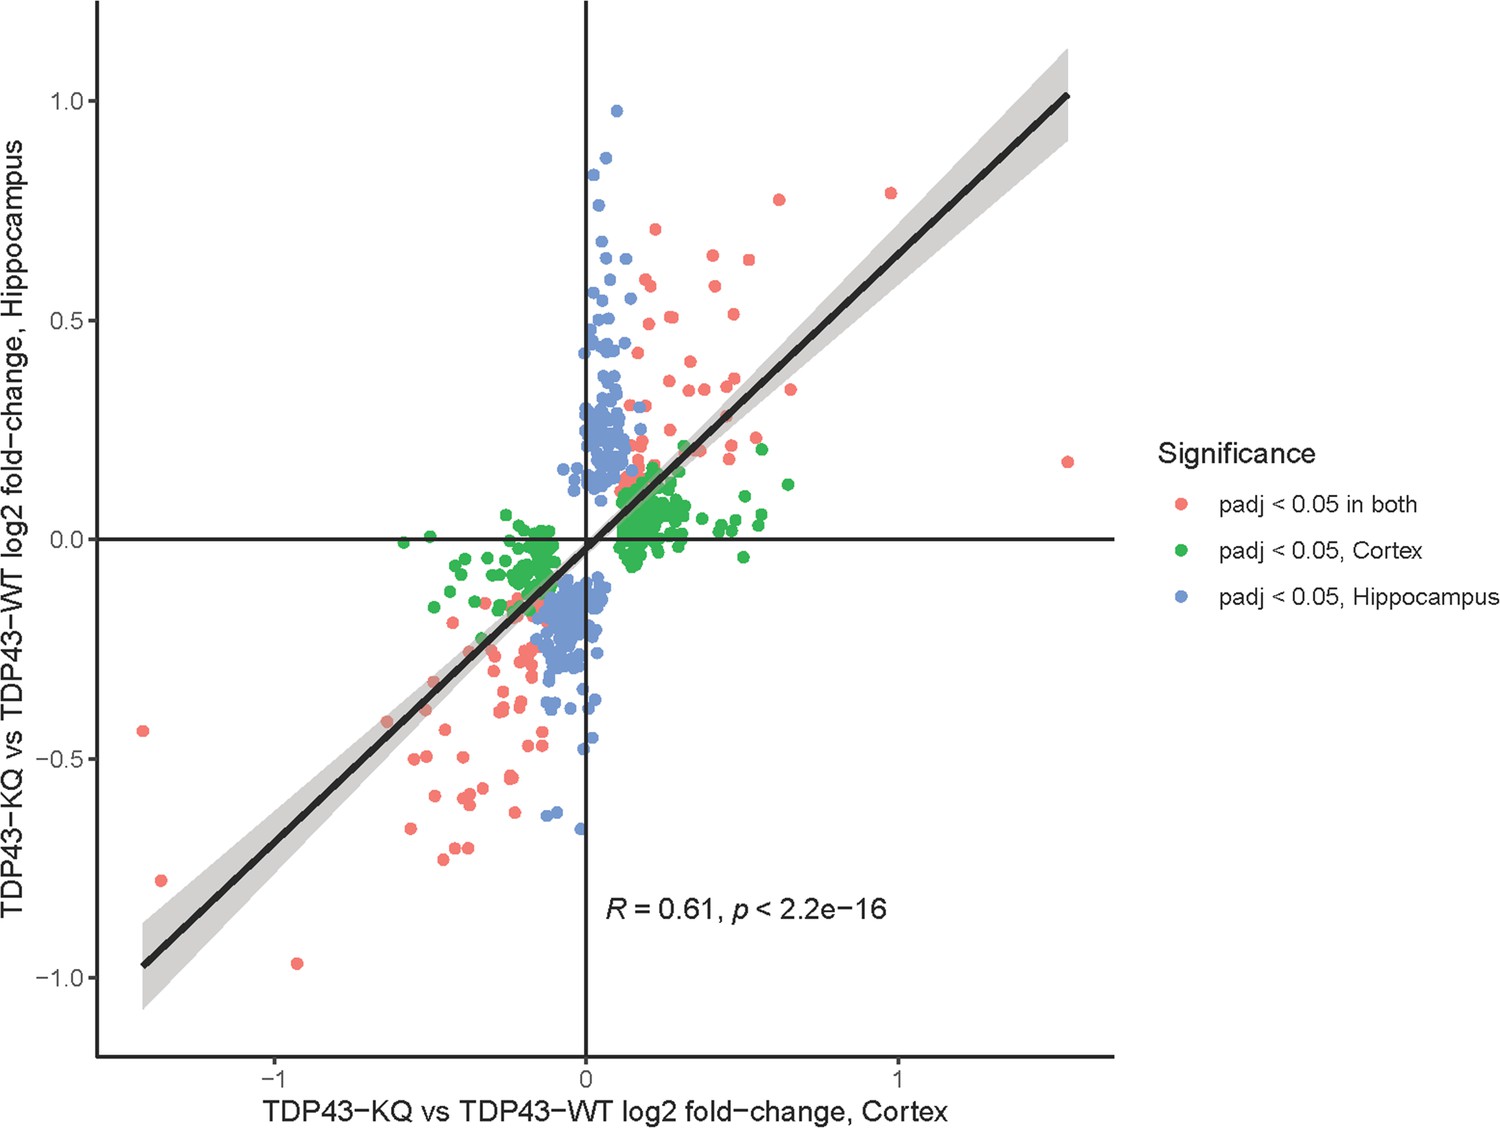
Significant correlation between differentially expressed genes (DEGs) in the neocortex and hippocampus of TDP-43KQ/KQ mice.
Scatterplot and smoothed linear model relating the log2 fold change of DEGs in the hippocampus and neocortex of TDP-43KQ/KQ (TDP43-KQ) compared to TDP-43wt (TDP43-WT) mice at 18 months old. DEGs that are only significant in the hippocampus are colored in blue, DEGs that are significant only in the neocortex are colored in green, and DEGs significant in both tissues are colored in pink. Log2 fold changes were moderately correlated (Pearson correlation coefficient R = 0.61) and the relationship was statistically significant (p < 0.0001).
Figure 8
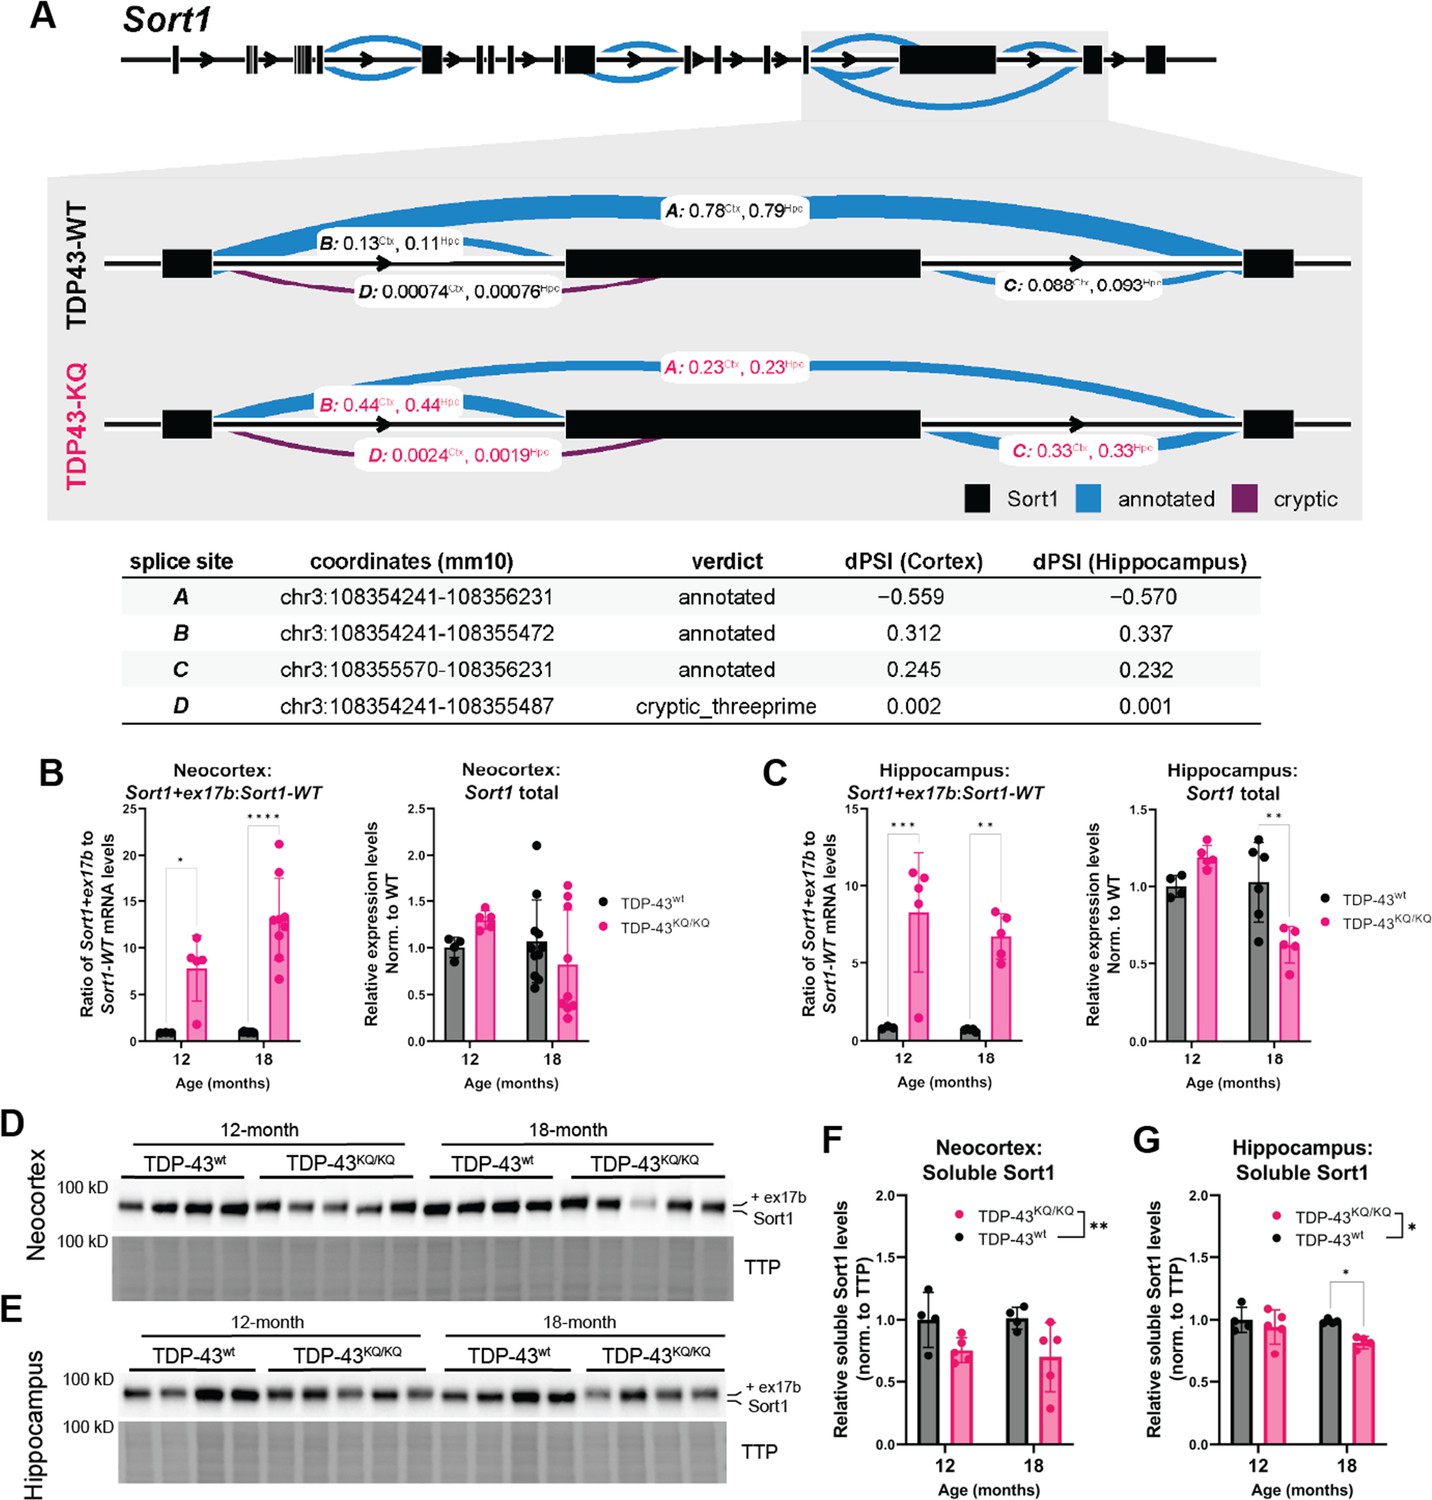
Dysfunctional splicing regulation of the Sort1 transcript in TDP-43KQ/KQ mice.
(A) Differential splicing analysis of TDP-43wt and TDP-43KQ/KQ neocortex (Ctx) and hippocampus (Hpc) using LeafCutter (Li et al., 2018) (visualized with LeafViz Knowles, 2022) demonstrates reduction in exclusion of a 3′ exon within the Sort1 transcript. Diagram in (A) shows full-length Sort1 gene in upper panel and highlights the differentially spliced region in gray. Chromosomal location, intron start and end points, annotation status, and Δ percent spliced in (dPSI) of the intronic region is listed in the lower table. qPCR analysis of additional WT and TDP-43KQ/KQ neocortex (B) and hippocampus (C) samples using primers specific for Sort1 splice variants to show the ratio of Sort1-ex17b:Sort1-WT mRNA levels and total Sort1 mRNA levels [B neocortex; Sort1-ex17b:Sort1-WT ratio, F(1,22) = 51.85, p < 0.0001; Sort1 total, F(1,25) = 0.01856, p = 0.8927; C hippocampus; Sort1-ex17b:Sort1-WT ratio, F(1,14) = 39.54, p < 0.0001, Sort1 total F(1,16) = 2.086, p = 0.1679]. (D–G) Images of western blots probed for Sort1 protein from neocortex (D) and hippocampus (E) lysates from 12- and 18-month-old mice. The Sort1 protein band intensity is plotted relative to total transferred protein (TTP) and quantified in F, G [neocortex, F(1,14) = 9.308, p = 0.0086; hippocampus, F(1,13) = 6.117, p = 0.0280]. (A) Neocortex n = 5 TDP-43wt, n = 6 TDP-43KQ/KQ; hippocampus n = 4 TDP-43wt, n = 5 TDP-43KQ/KQ. (B) Neocortex n = 3 12-month TDP-43wt, n = 5 12-month TDP-43KQ/KQ, n = 9 18-month TDP-43wt, n = 9 18-month TDP-43KQ/KQ. (C) Hippocampus n = 3 12-month TDP-43wt, n = 5 12-month TDP-43KQ/KQ, n = 5 18-month TDP-43wt, n = 5 18-month TDP-43KQ/KQ. (D–G) n = 4 12-month TDP-43wt, n = 5 12-month TDP-43KQ/KQ, n = 4 18-month TDP-43wt, n = 4 (hippocampus) or n = 5 (neocortex) 18-month TDP-43KQ/KQ. Data are presented as mean ± standard deviation (SD). Two-way analysis of variance (ANOVA) followed by Šídák’s multiple comparisons test. F statistics represent main effect of genotype, unless otherwise stated. Statistical significance is represented by asterisks, *p < 0.05, **p < 0.01, ***p < 0.001, ****p < 0.0001. Further statistical information is located in Figure 8—source data 1 file. Figures showing uncropped western blot images are available in Figure 8—source data 2 files. Full images of western blots are available in Figure 8—source data 3 files.
-
Figure 8—source data 1
Complete statistical results and information for quantitative elements shown in Figure 8.
- https://cdn.elifesciences.org/articles/85921/elife-85921-fig8-data1-v1.xlsx
-
Figure 8—source data 2
Figures showing uncropped western blot images of those presented in Figure 8D,E.
- https://cdn.elifesciences.org/articles/85921/elife-85921-fig8-data2-v1.zip
-
Figure 8—source data 3
Full uncropped images of western blots shown in Figure 8.
- https://cdn.elifesciences.org/articles/85921/elife-85921-fig8-data3-v1.zip
Additional files
-
Supplementary file 1
Detailed RNA sequencing results and analysis.
(a) Differentially expressed genes (DEGs) in the neocortex of 18-month TDP-43KQ/KQ mice compared to WT. (b) DEGs in the hippocampus of 18-month TDP-43KQ/KQ mice compared to WT. (c) Gene Ontology terms enriched in each of the six groups of DEGs in TDP-43KQ/KQ animals compared to TDP-43wt at 18 months old. (d) Intersections between DEGs in TDP-43KQ/KQ micec compared to DEGs in FTLD-TDP cortex and mouse TDP-43 knockdown. (e) List of clusters within differentially spliced genes (analysis by LeafCutter, LeafViz) in the cortex of TDP-43KQ/KQ mice compared to WT at 18 months of age. (f) List of clusters within differentially spliced genes (analysis by LeafCutter, LeafViz) in the hippocampus of TDP-43KQ/KQ mice compared to WT at 18 months of age.
- https://cdn.elifesciences.org/articles/85921/elife-85921-supp1-v1.xlsx
-
Supplementary file 2
Complete detailed results of linear mixed effects model statistical analyses.
- https://cdn.elifesciences.org/articles/85921/elife-85921-supp2-v1.xlsx
-
Supplementary file 3
Complete list of oligonucleotides used in the present study.
- https://cdn.elifesciences.org/articles/85921/elife-85921-supp3-v1.xlsx
-
Supplementary file 4
Complete list of primary and secondary antibodies used in the present study.
- https://cdn.elifesciences.org/articles/85921/elife-85921-supp4-v1.xlsx
-
MDAR checklist
- https://cdn.elifesciences.org/articles/85921/elife-85921-mdarchecklist1-v1.pdf
Download links
A two-part list of links to download the article, or parts of the article, in various formats.
Downloads (link to download the article as PDF)
Open citations (links to open the citations from this article in various online reference manager services)
Cite this article (links to download the citations from this article in formats compatible with various reference manager tools)
RNA-binding deficient TDP-43 drives cognitive decline in a mouse model of TDP-43 proteinopathy
eLife 12:RP85921.
https://doi.org/10.7554/eLife.85921.3


