Statin-mediated reduction in mitochondrial cholesterol primes an anti-inflammatory response in macrophages by upregulating Jmjd3
- Chronic Disease Program, Ottawa Hospital Research Institute, Canada
- College of Life Sciences, Wuhan University, China
- Departamento Química Física, Universidad Complutense de Madrid, Avda, Spain
- Instituto de Investigación Biomédica Hospital Doce de Octubre (imas12), Spain
- Sprott Center for Stem Cell Research, Regenerative Medicine Program, Ottawa Hospital Research Institute, Canada
- Department of Cell and Regenerative Biology, University of Wisconsin, United States
- Department of Molecular Genetics, The University of Texas Southwestern Medical Center, United States
- Department of Cellular and Molecular Medicine, University of Ottawa, Canada
- Departments of Medicine and of Biochemistry, Microbiology & Immunology, University of Ottawa, Canada
Figures
Figure 1 with 3 supplements
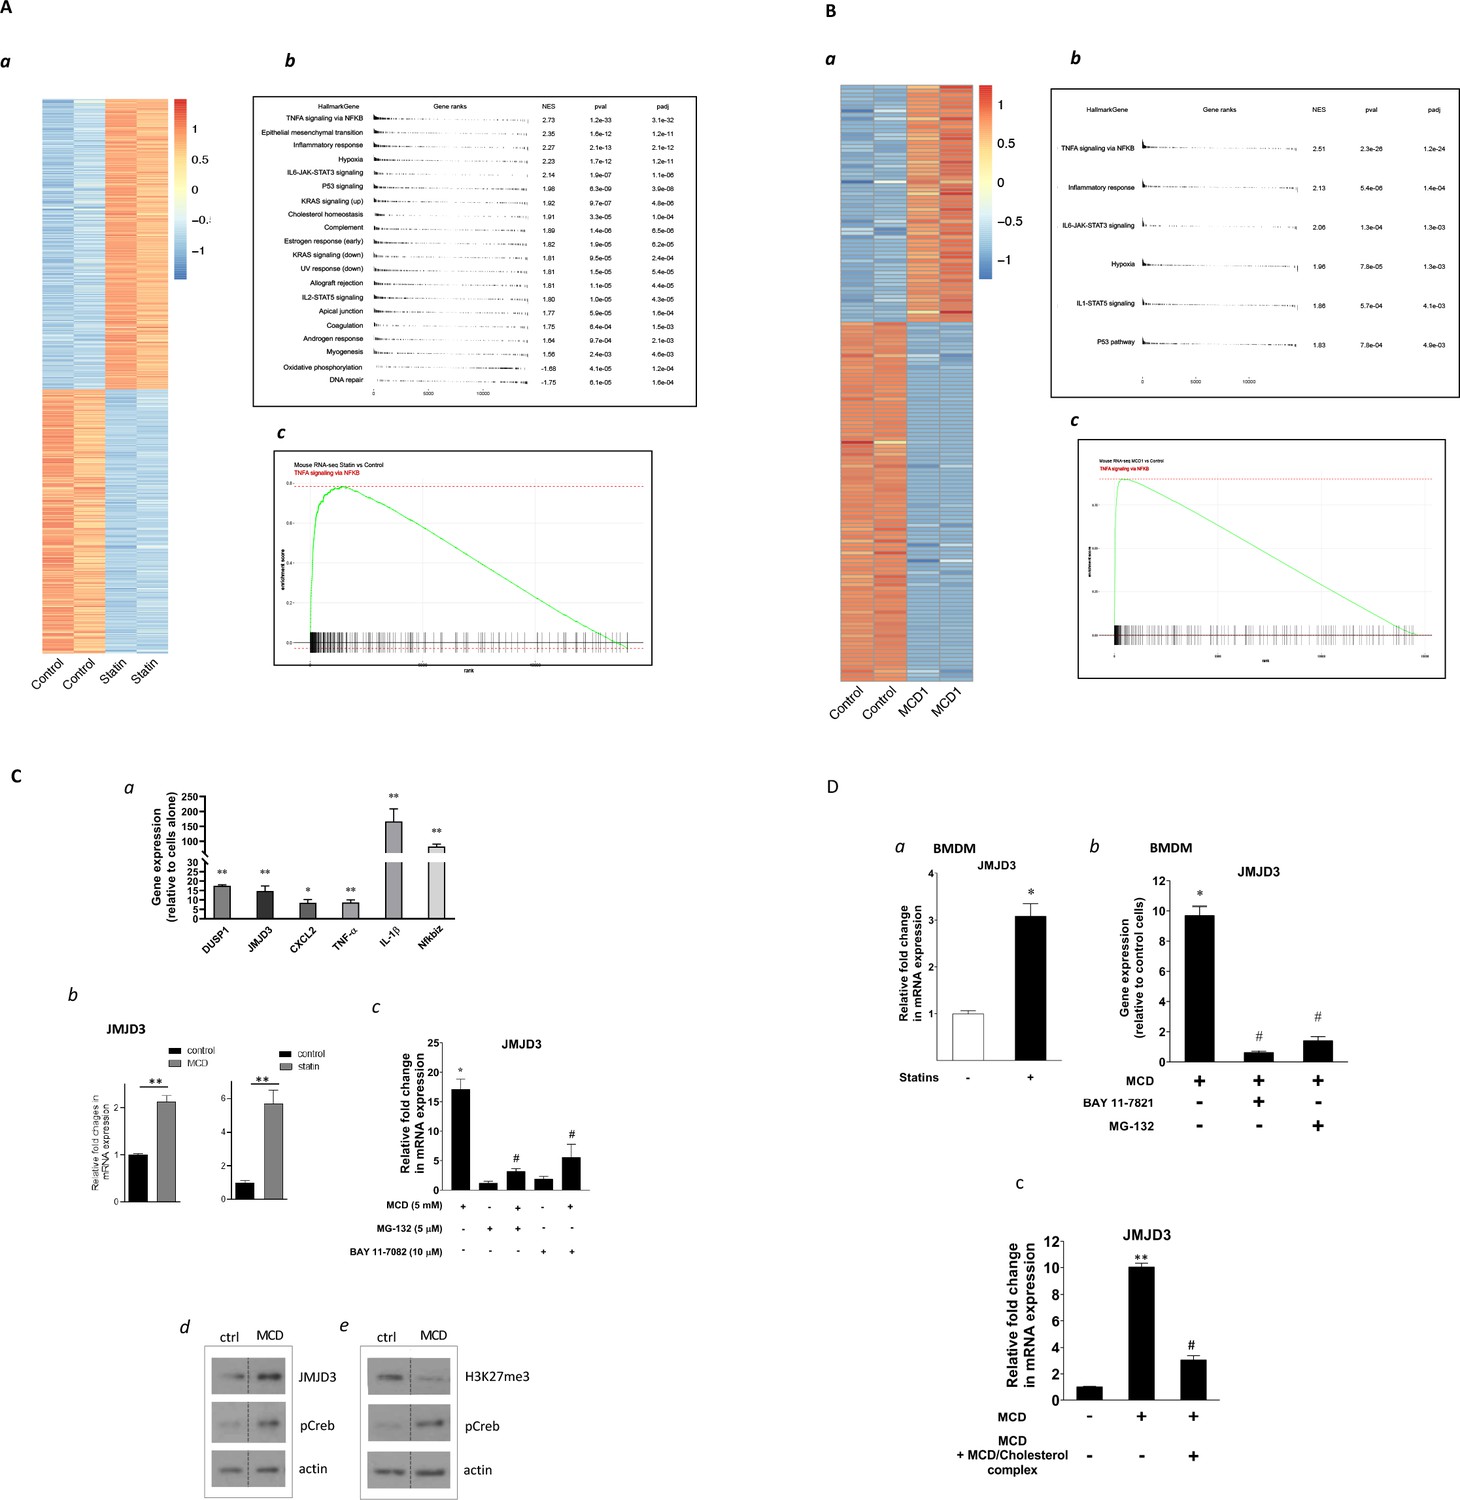
Satins upregulates the expression of Jmjd3 in macrophages through NF-κB.
(A) Statins activate NF-κB pathways in RAW 264.7 cells. (a) Heatmap of differentially expressed genes with or without statin (lovastatin, 7 + 200 µM mevalonate; 2 days). (b) Pathways identified by gene set enrichment analysis (GSEA) of differentially expressed genes in (a). (c) The details of most highly represented pathway, TNFA signaling vis NF-κB. (B) Methyl-β-cyclodextrin (MCD) activate NF-κB pathways in RAW 264.7 cells. (a) Heatmap of differentially expressed genes with or without MCD (5 mM, 1 hr). (b) Pathways identified by GSEA of differentially expressed genes in (a). (c) The details of most highly represented pathway, TNFA signaling vis NF-κB. (C) Statins and MCD upregulate Jmjd3 in RAW 264.7 cells. (a) Reverse transcriptase quantitative PCR (RT-qPCR) of genes with or without MCD (5 mM; 1 hr). (b) Jmjd3 gene expression in MCD- or statin-treated RAW 264.7 macrophages. (c) Effect of NF-κB inhibitors, MG-132 (5 µM) and BAY11-7082 (10 µM) on Jmjd3 expression in MCD-treated RAW macrophages. (d) Western blotting of JMJD3 protein expression and (e) levels of H3K27Me3 in macrophages treated with 5 mM MCD (1 hr). The pCREB was used as internal control for cholesterol depletion and actin a loading control. Original blots are in source data. (D) Statin/MCD upregulates Jmjd3 in bone marrow-derived macrophages (BMDMs). (a) Jmjd3 gene expression in statin-treated BMDMs (10 µM pravastatin + 200 µM mevalonate; 2 days). (b) Effect of NF-κB inhibitors, MG-132 [5 µM] and BAY11-7082 [10 µM], on Jmjd3 expression in MCD-treated BMDMs. (c) Jmjd3 expression in cholesterol repletes MCD-treated macrophages. Graphs are representative of 3 independent experiments with 3 replicates per condition and are presented as means ± standard deviation (SD). Statistical analysis was performed using unpaired, two-tailed Student’s t-test. An asterisk (*) or double asterisks (**) indicate a significant difference with p < 0.05 and p < 0.001, respectively. A hashtag (#) indicates a significant difference between MCD without or with inhibitors, p < 0.05.
-
Figure 1—source data 1
Original scanned films of western blots for Figure 1C,d.
- https://cdn.elifesciences.org/articles/85964/elife-85964-fig1-data1-v4.zip
-
Figure 1—source data 2
Original scanned films of western blots for Figure 1C,e.
- https://cdn.elifesciences.org/articles/85964/elife-85964-fig1-data2-v4.zip
Figure 1—figure supplement 1
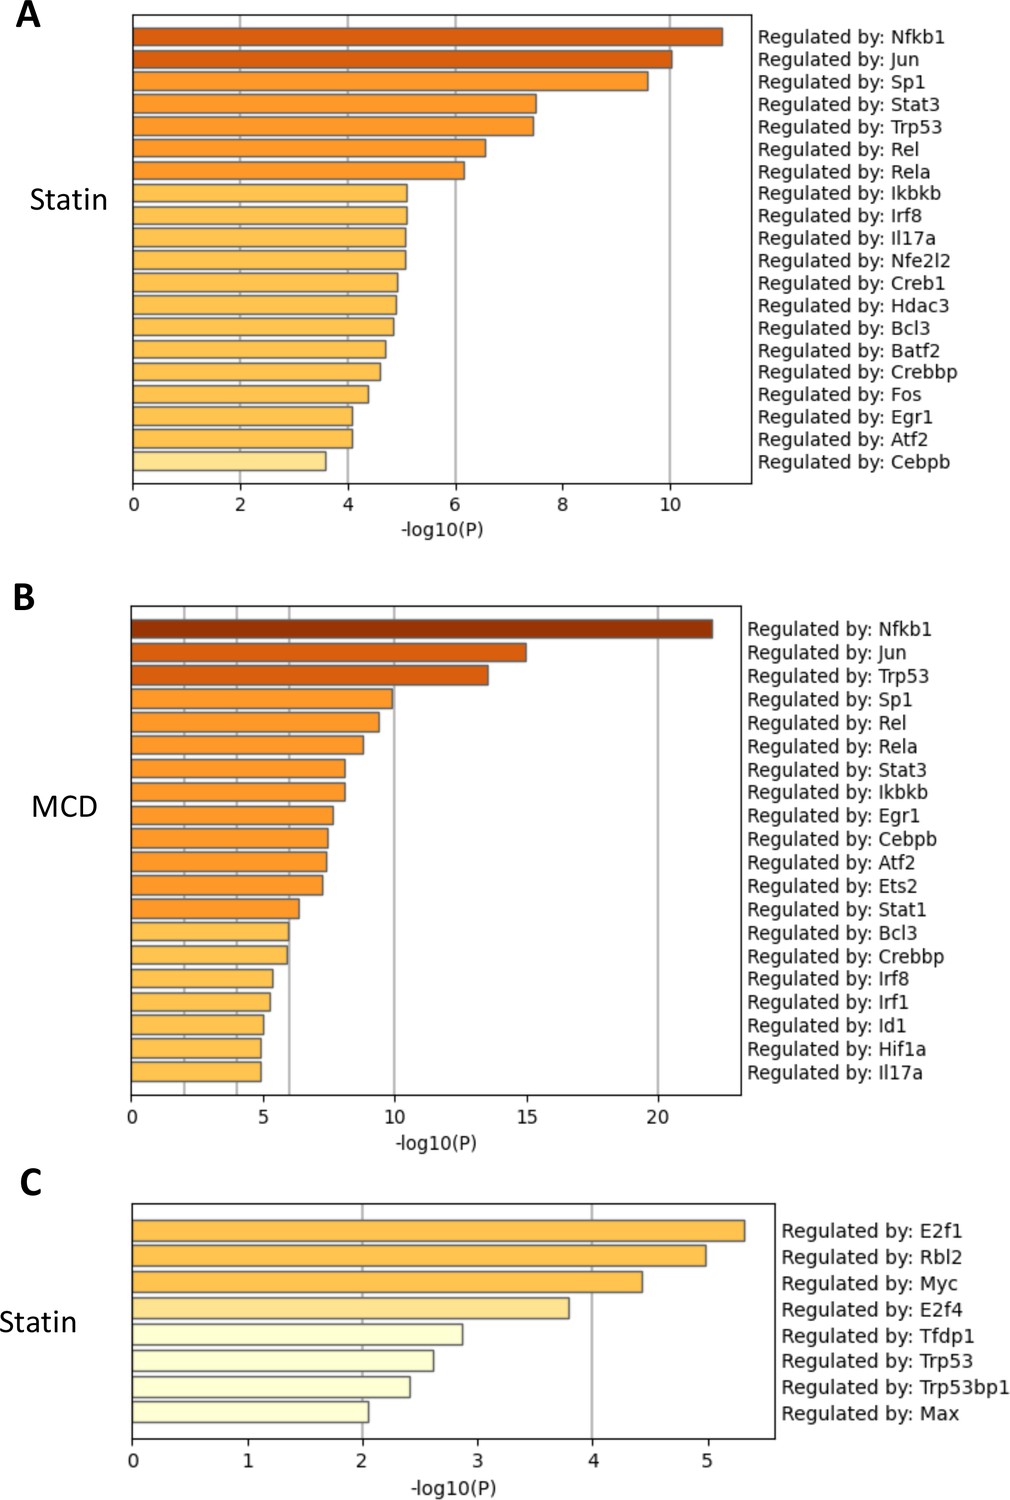
Cellular cholesterol contents regulate NF-κB pathway.
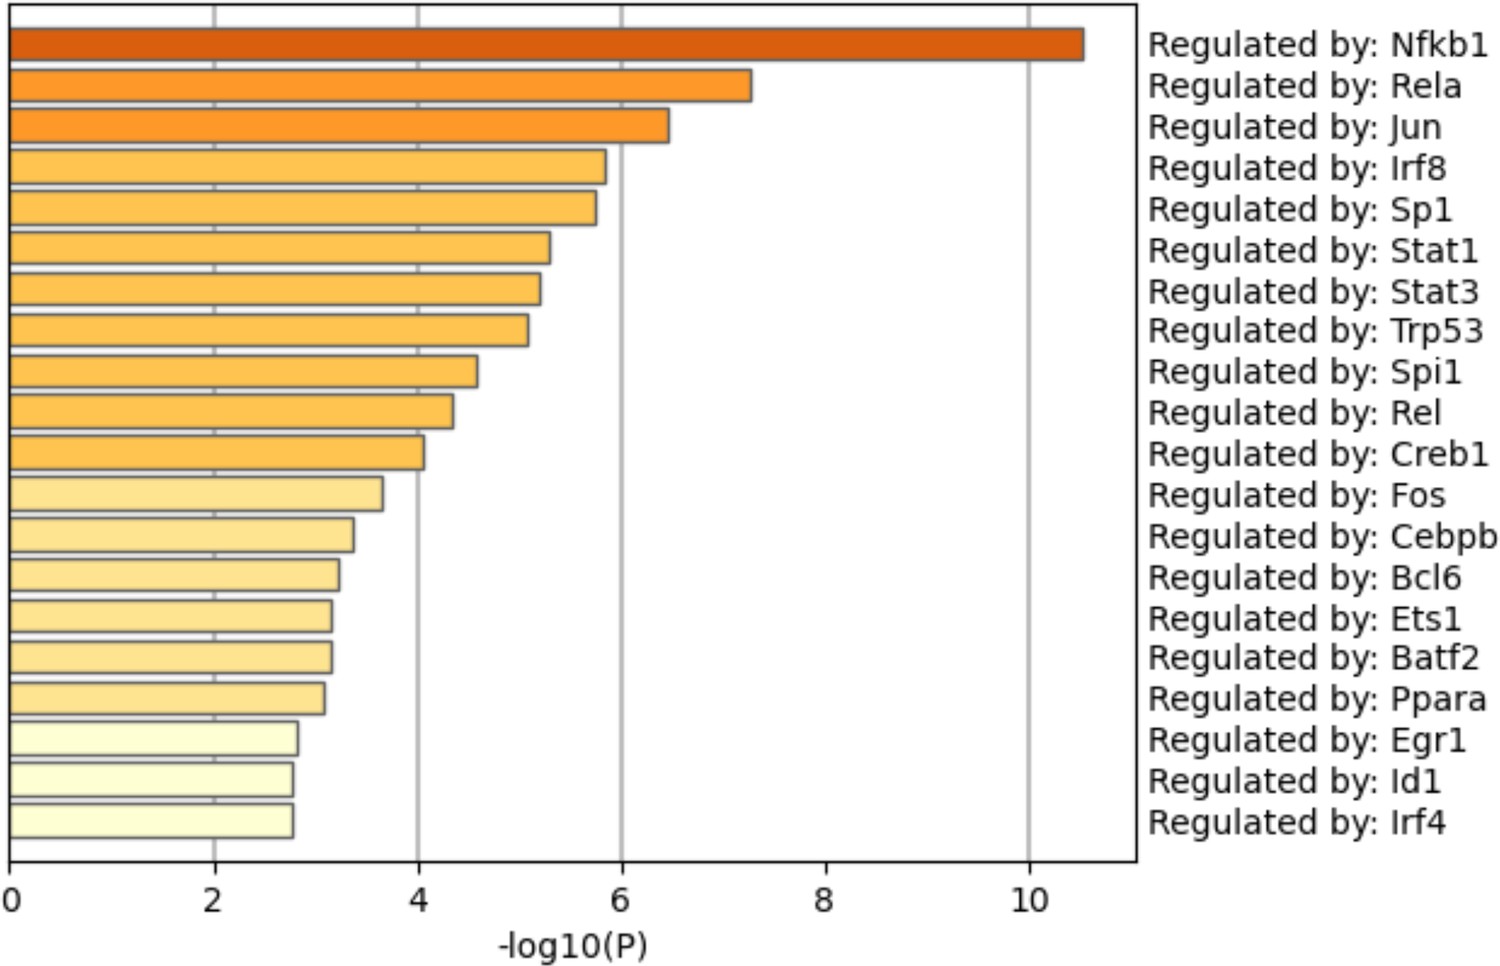
RAW macrophages were treated with methyl-β-cyclodextrin (MCD) or statins, and RNA-seq was performed as in Figure 1. TF regulatory pathways of activated genes were analyzed using Metascape; top TFs employed by either lovastatin (A) (7 + 200 µM mevalonate) or MCD (B) (5 mM, 1 hr). The genes downregulated by statin is analyzed in (C). No TF is identified in MCD downregulated genes.
Figure 1—figure supplement 2

The expression of Jmjd3 activated by methyl-β-cyclodextrin (MCD) requires NF-κB activity.
Effect of NF-κB inhibitors, JSH23 (10 µM) and SC514 (10 µM), on Jmjd3 expression in MCD-treated RAW macrophages. Graphs are representative of 3 independent experiments with 3 replicates per condition and are presented as means ± standard deviation (SD). Statistical analysis was performed using unpaired, two-tailed Student’s t-test. Double asterisks (**) indicates a significant difference p<0.001.
Figure 1—figure supplement 3

Levels of H3K27Me3 are decreased in macrophages treated with statin or methyl-β-cyclodextrin (MCD) (lovastatin, 7 + 200 µM mevalonate; 2 days) or MCD (5 mM, 1 hr).
The pCREB was used as internal control for cholesterol depletion and actin a loading control. Original blots are in source data.
-
Figure 1—figure supplement 3—source data 1
Original scanned films of western blots for Figure 1—figure supplement 3.
- https://cdn.elifesciences.org/articles/85964/elife-85964-fig1-figsupp3-data1-v4.zip
Figure 2
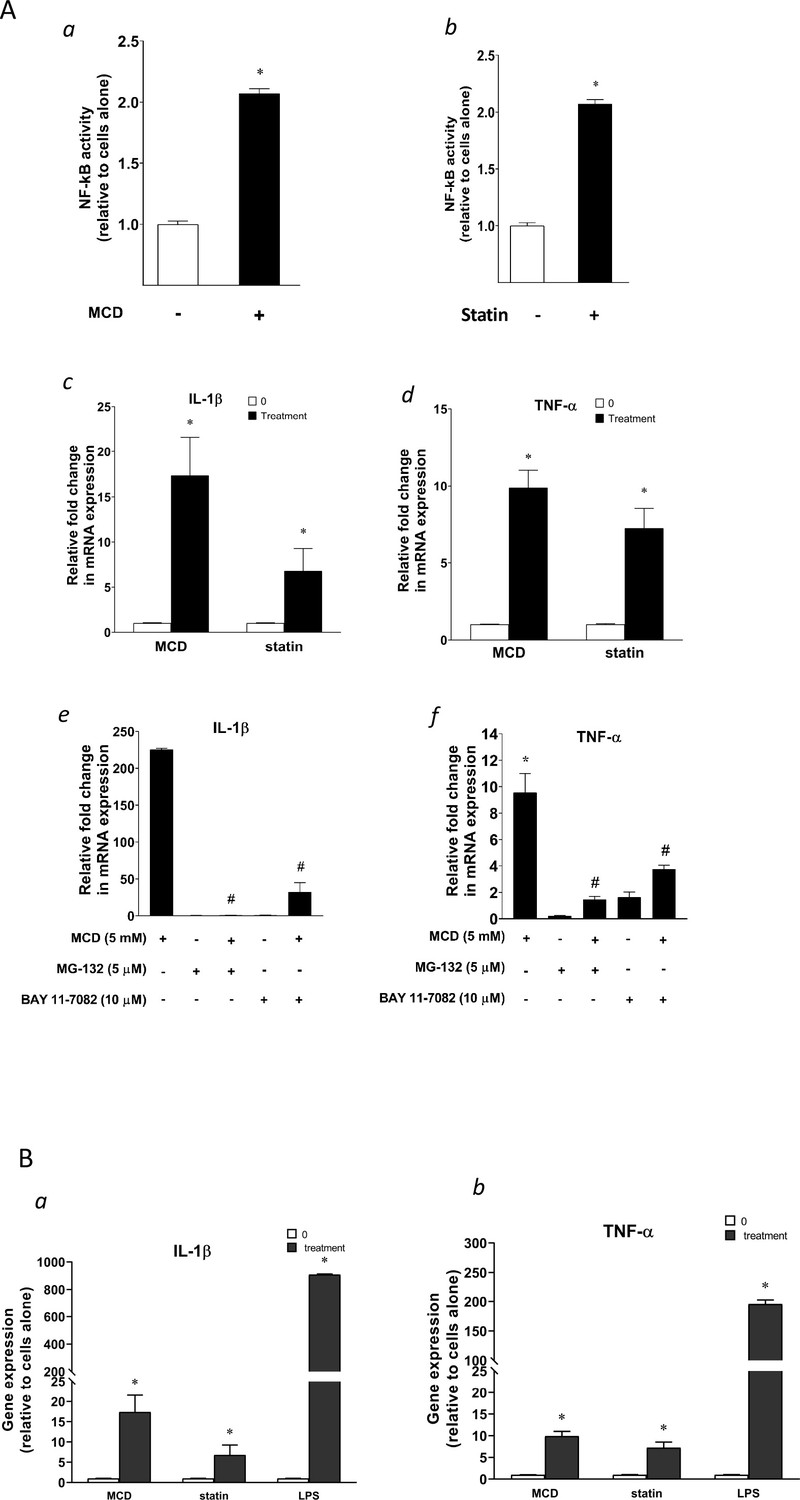
Cellular cholesterol contents regulate NF-κB pathway.
(A) NF-κB activation by methyl-β-cyclodextrin (MCD) (a) and statins (b) using RAW blue macrophages. Reverse transcriptase quantitative PCR (RT-qPCR) of Il1b (c) and Tnfa (d) in RAW 264.7 cells with or without MCD (5 mM; 1 hr), or with or without (10 µM compactin + 200 µM mevalonate; 2 days). Effect of NF-κB inhibitors (MG-132 [5 µM] and BAY11-7082 [10 µM]) on Il1b (e) and Tnfa (f) expression in MCD-treated RAW 264.7 macrophages. (B) The gene expression activated by MCD, statin, or lipopolysaccharide (LPS). RT-qPCR of Il1b (a) and Tnfa (b) in RAW 264.7 cells with or without MCD (5 mM; 1 hr), simvastatin (10 + 200 µM mevalonate; 2 days) or LPS (100 ng/ml; 3 hr). Graphs are representative of 3 independent experiments with 3 replicates per condition and are presented as means ± standard deviation (SD). Statistical analysis was performed using unpaired, two-tailed Student’s t-test. An asterisk (*) indicates a significant difference with p < 0.05. A hashtag (#) indicates a significant difference between MCD without or with inhibitors with p < 0.05.
Figure 3
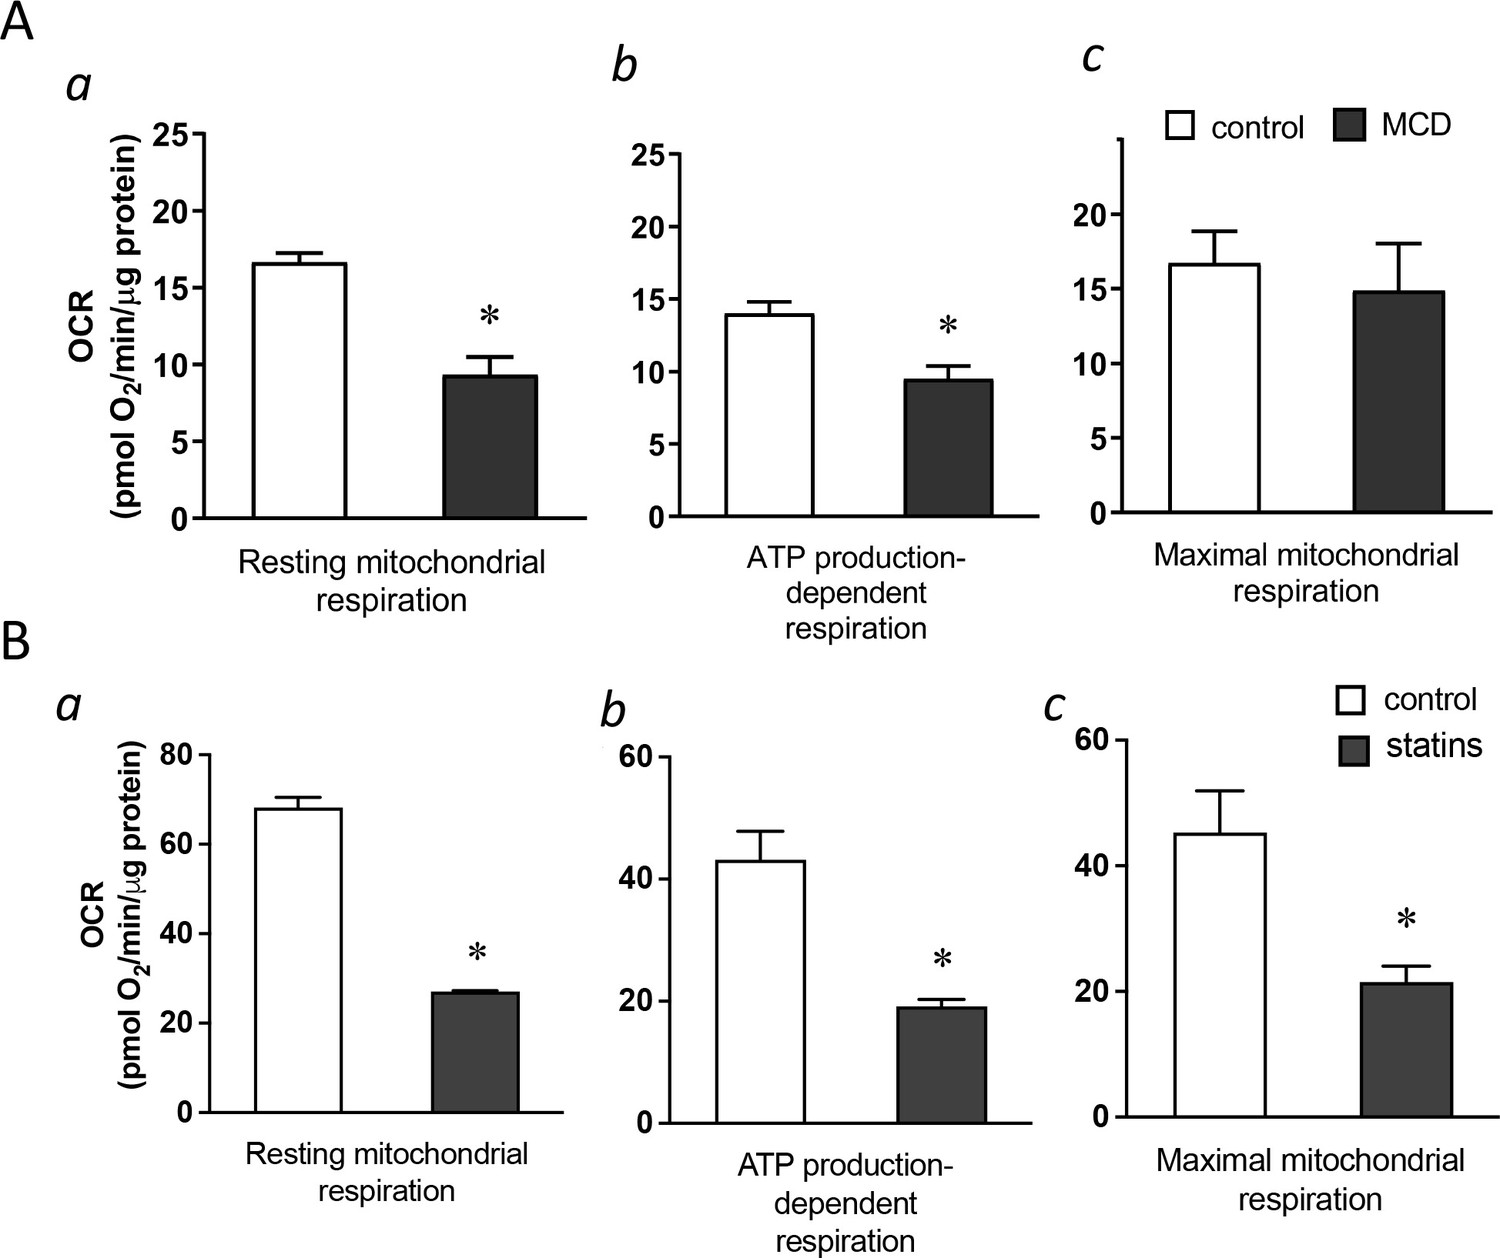
Cholesterol levels modulate mitochondrial respiration.
(A) Mitochondrial oxygen consumption rates (OCRs) of bone marrow-derived macrophages (BMDMs) treated with 1 hr methyl-β-cyclodextrin (MCD) (5 mM) or without. (a) OCR for mitochondrial resting respiration. (b) OCR representing mitochondrial ATP production-linked respiration. (c) OCR representing maximal respiration. (B) Mitochondrial OCRs in BMDMs treated compactin or without compactin (10 + 200 µM mevalonate; 2 days). (a) OCR for mitochondrial resting respiration. (b) OCR representing mitochondrial ATP production-linked respiration. (c) OCR representing maximal respiration. Data are representative of 3 independent experiments with 3 samples per group and data are presented as mean ± standard deviation (SD). Statistical analysis was performed using unpaired, two-tailed Student’s t-test. An asterisk (*) indicates a significant difference, p < 0.05.
Figure 4 with 1 supplement
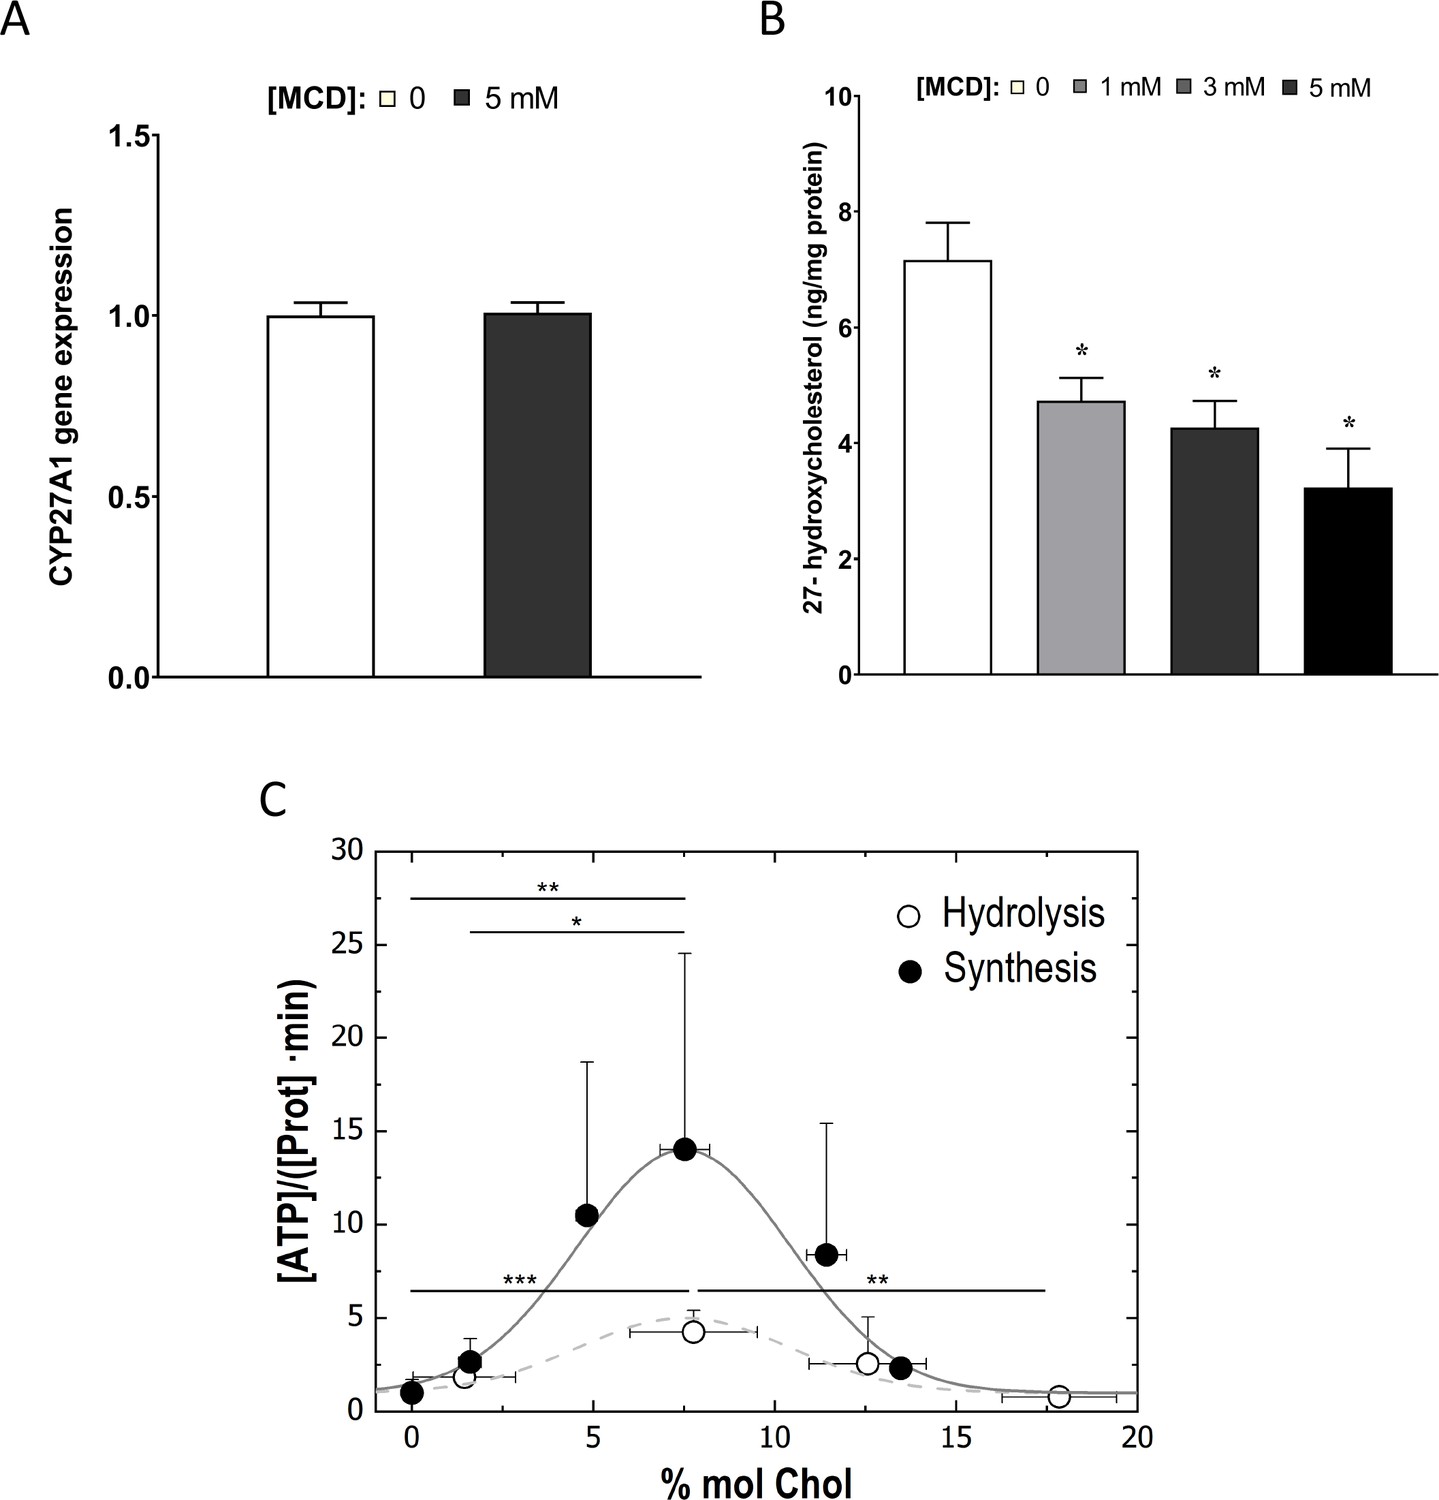
Cholesterol levels modulate the mitochondrial ATP synthase activity.
(A) Sterol 27-hydroxylase, Cyp27a1, expression in 1 hr methyl-β-cyclodextrin (MCD)-treated and control RAW macrophages. (B) 27-Hydroxycholesterol (27-HC) analysis by ultraperformance liquid chromatography/electrospray ionization/tandem mass spectrometry. 27-HC levels were normalized to the protein content in the whole cell pellet. (C) ATP hydrolysis and synthesis in cholesterol-doped inner membrane vesicles (IMVs); ATP hydrolysis was performed by adding a total concentration of 2 mM ATP to 200 mM IMVs (lipid concentration) and incubated for 30 min. Concentration of phosphates from ATP hydrolysis was measured using the malaquite green assay. ATP concentration after synthesis was measured using ATP detection assay kit (Molecular Probes) with a luminometer GloMax-Multi Detection. Data in B are from 3 samples per group and data are presented as mean ± standard deviation (SD). An asterisk (*) indicates p < 0.05. Data in (C) are representative of at least two independent experiments with three replicates and presented as means ± SD. Statistical analysis was performed using the Tukey analysis of variance (ANOVA) test. (*), (**), and (***) indicate a significant difference with p < 0.05, 0.01, and 0.001, respectively.
Figure 4—figure supplement 1

Sterol 27-hydroxylase, Cyp27a1, expression.
RAW 264.7 macrophages were treated with compactin (7 + 200 µM mevalonate) for 2 days and the expression of Cyp27a1 analyzed. (*) indicates a significant difference with p < 0.01.
Figure 5 with 1 supplement
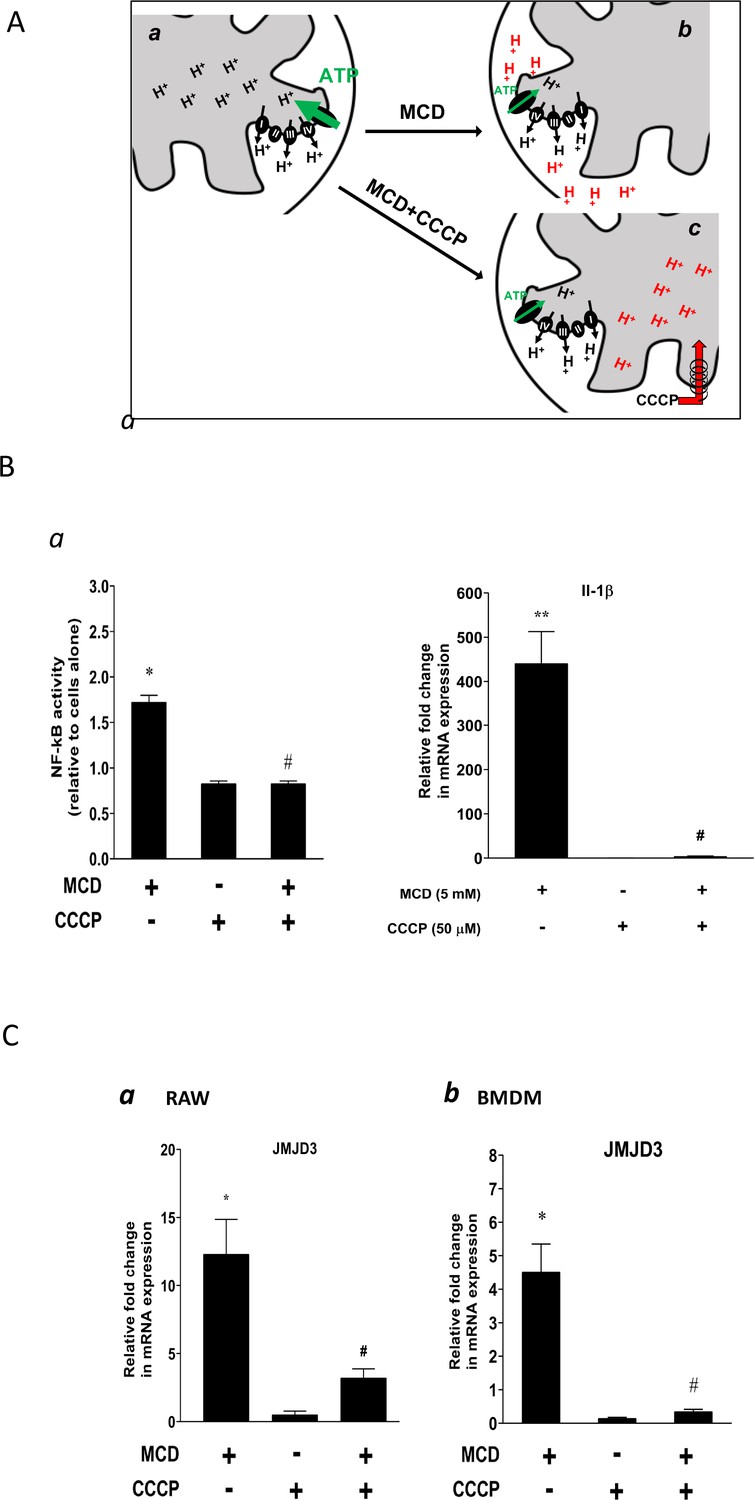
Effect of proton flux on NF-κB activation and Jmjd3 expression in methyl-β-cyclodextrin (MCD)-treated cells.
(A) Schematic of potential mechanism induced by MCD, and MCD/carbonyl cyanide m-chlorophenyl hydrazine (CCCP) on mitochondrial proton flux. (B) Effect of CCCP on NF-κB activity and Jmjd3 expression: (a) on NF-κB activity in RAW blue macrophages (CCCP = 50 µM); (b) effect of CCCP on Il1b expression in RAW 264.7 macrophages (CCCP = 50 µM). (C) Effect of CCCP (a) on Jmjd3 expression in RAW 264.7 macrophages (CCCP = 50 µM) and (b) on bone marrow-derived macrophages (BMDMs) (CCCP = 200 µM). Data are representative of 3 independent experiments with 3 samples per group and data are presented as mean ± standard deviation (SD). Statistical analysis was performed using unpaired, two-tailed Student’s t-test. Asterisks (*) and (**) indicate a significant difference with p < 0.05 and p < 0.001. A hashtag (#) indicates a significant difference between MCD without or with inhibitors with p < 0.05.
Figure 5—figure supplement 1
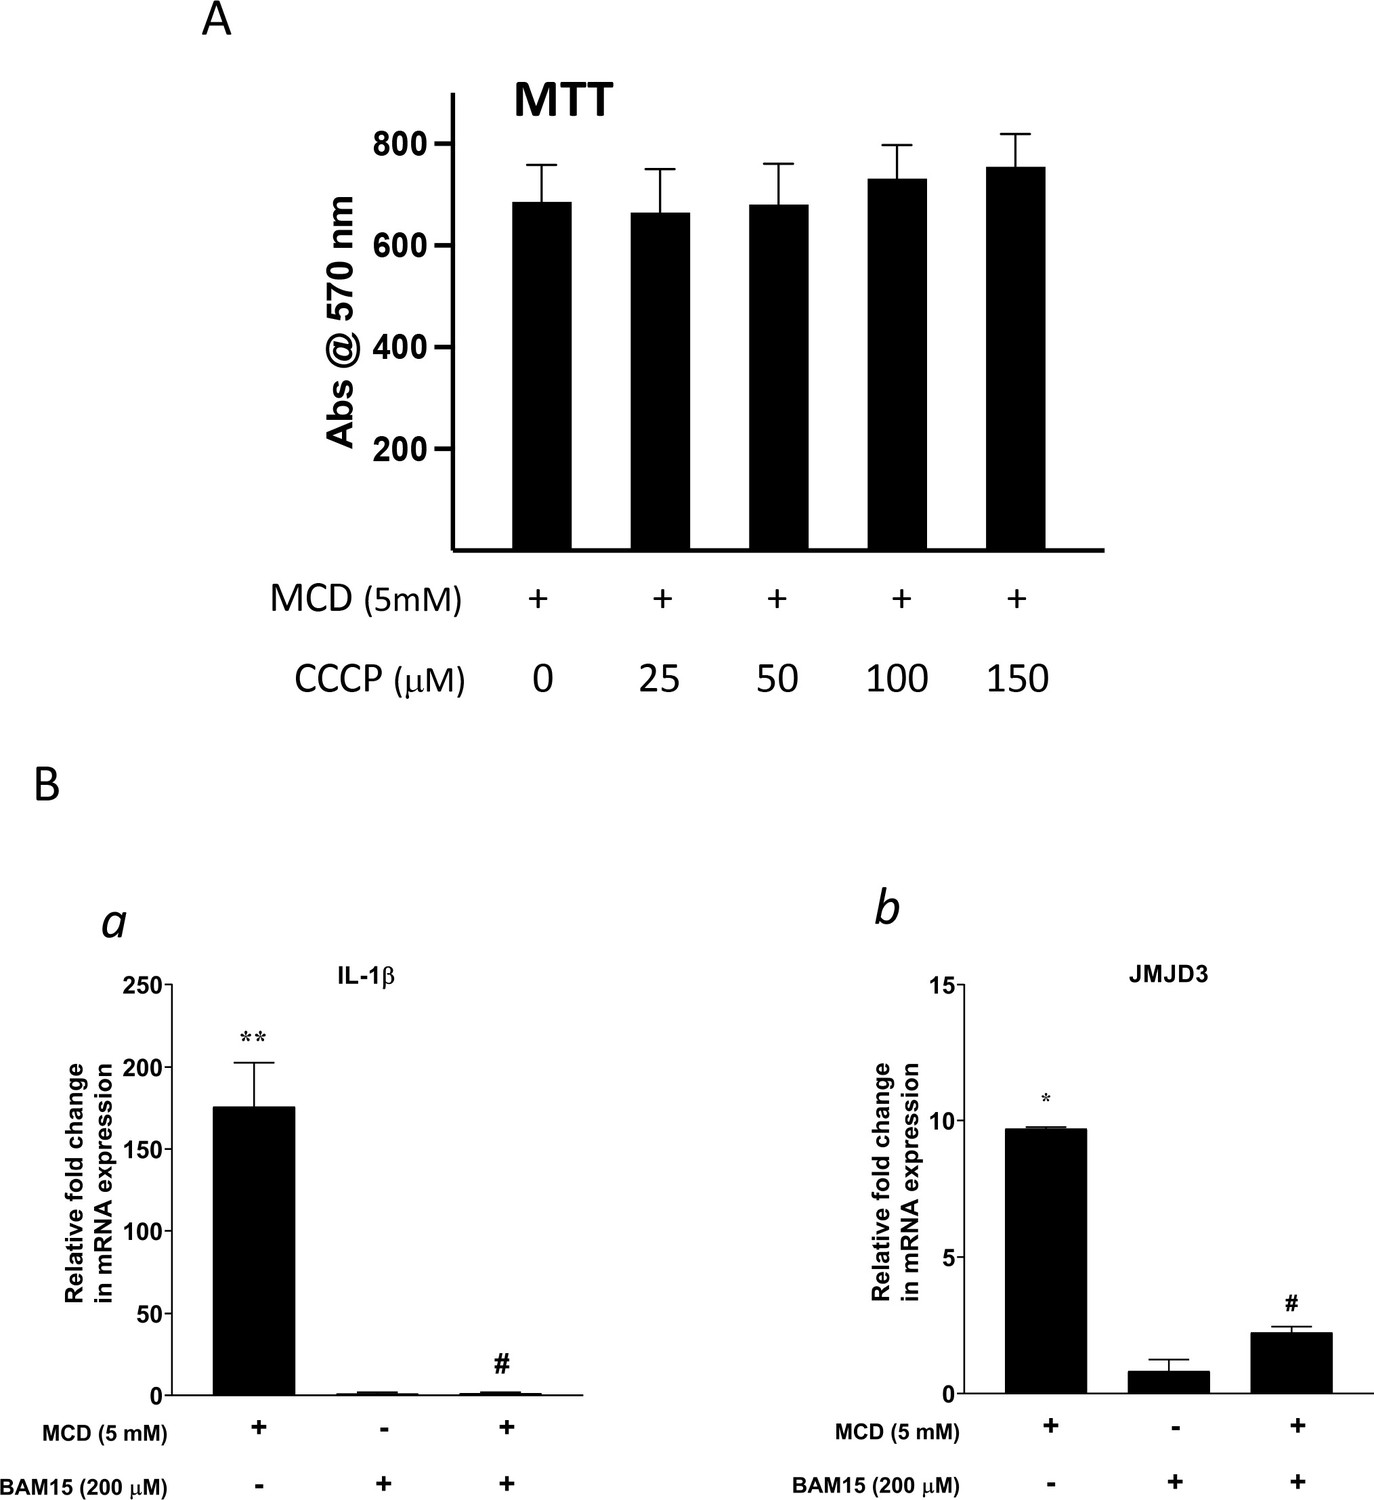
The effect of proton flux Inhibitors.
(A) The toxicity of carbonyl cyanide m-chlorophenyl hydrazine (CCCP) by 3- (4,5-dimethylthiazol-2-yl)-2,5-diphenyltetrazolium bromide (MTT) assay. (B) Effect of BAM15 (200 µM) on Il1b (a) and Jmjd3 (b) gene expression in methyl-β-cyclodextrin (MCD)-treated RAW264.7 macrophages. Data are representative of 3 independent samples per condition and are presented as mean ± standard deviation (SD). Statistical analysis was performed using unpaired, two-tailed Student’s t-test. Asterisk (*) and hashtag (#) indicate a significant difference between MCD without or with inhibitors with p < 0.05; (**) indicates a significant difference with p < 0.01.
Figure 6 with 1 supplement
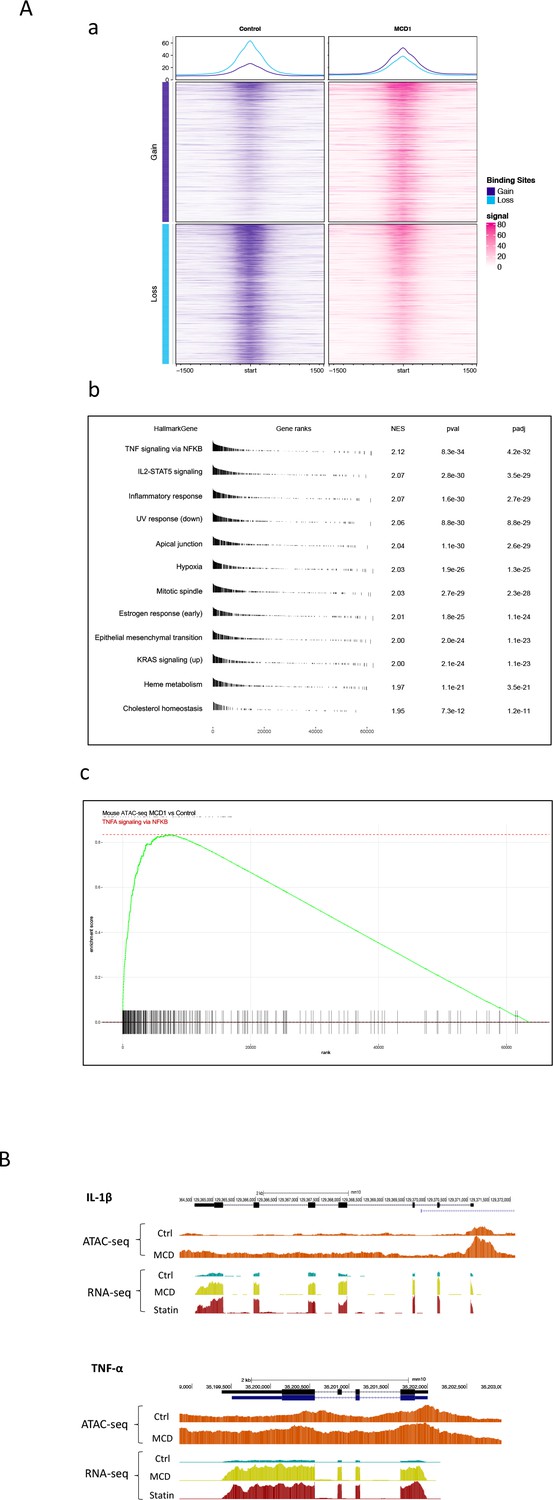
Cholesterol modulates macrophage epigenetic modifications.
(A) ATAC-seq in control and methyl-β-cyclodextrin (MCD) (5 mM, 1 hr) treated RAW 264.7 macrophages. (a) Summit-centered heatmap of differentially accessible ATAC-seq signals. (b) Pathways identified by gene set enrichment analysis (GSEA) of differentially assessable genes in (a). (c) The details of most highly represented pathway, TNFA signaling vis NF-κB. (B) ATAC- and RNA-seq profiles alignment from ATAC- and RNA-seq for the genomic loci of Il1b (top) and Tnfa (bottom).
Figure 6—figure supplement 1
Pathway analysis among the genes opened by methyl-β-cyclodextrin (MCD) in ATAC-seq.
Regulatory pathways of genes opened by MCD were analyzed using Metascape.
Figure 7
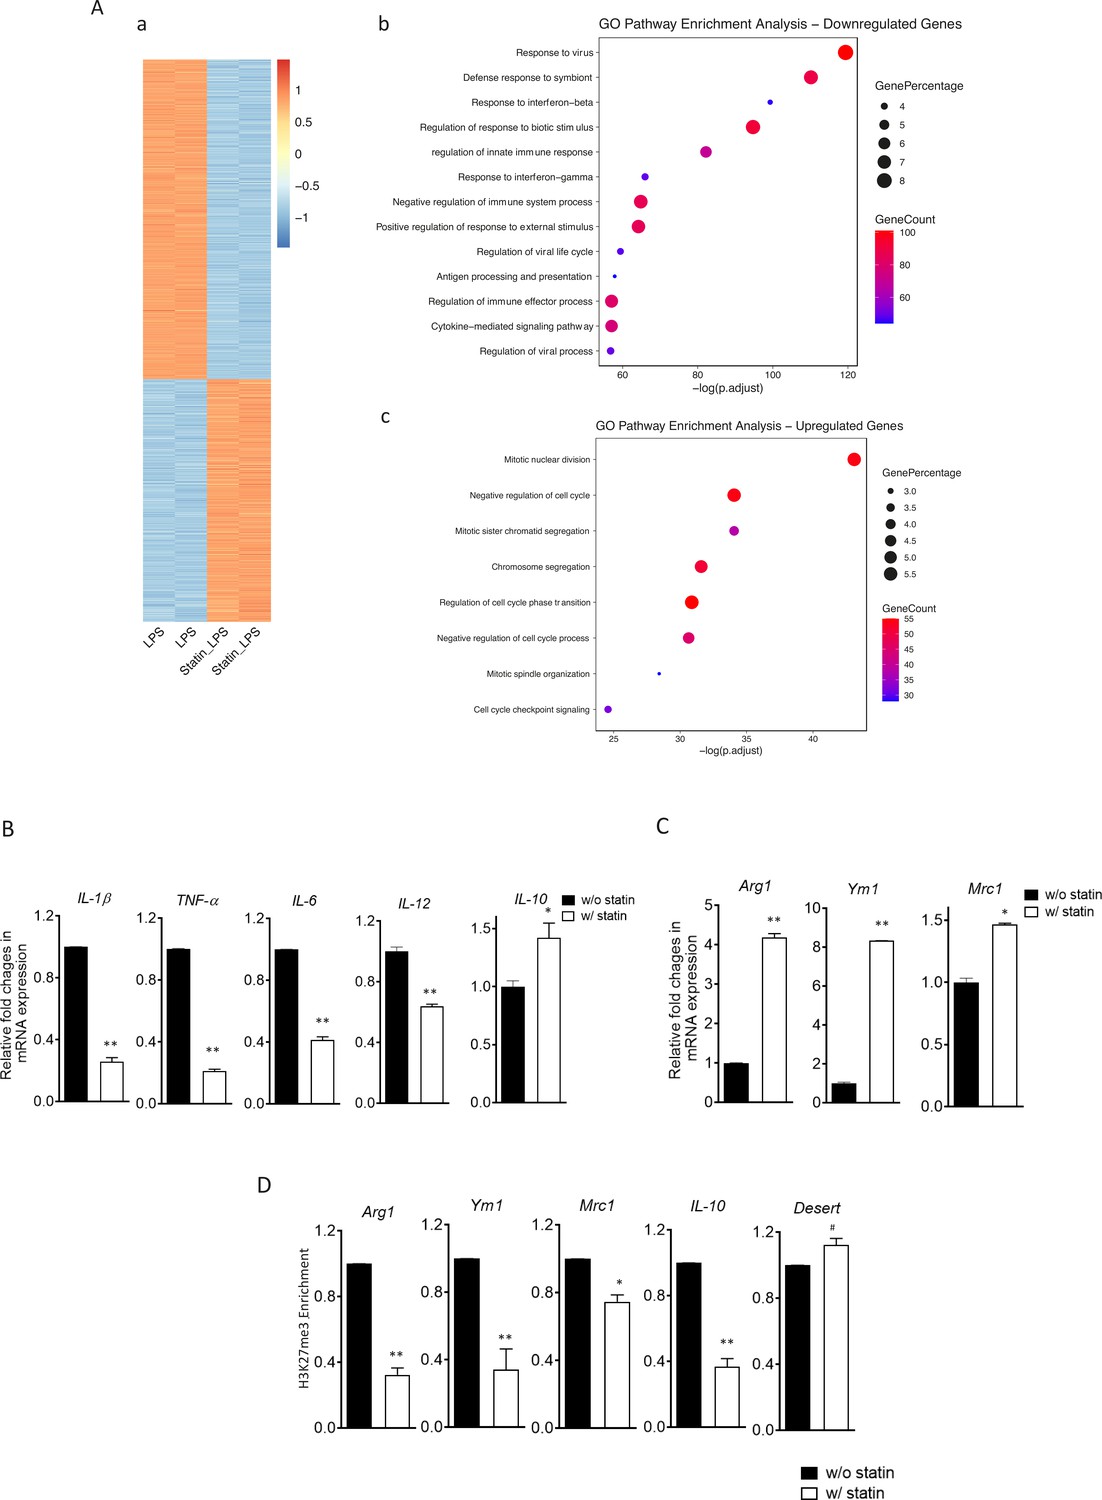
Statins supress proinflammatory cytokines and enhance anti-inflammatory factors in lipopolysaccharide (LPS)- or IL-4-activated macrophages.
(A) RAW 264.7 macrophages treated with statins (lovastatin, 7 + 200 µM mevalonate; 2 days) or without were stimulated with LPS (100 ng/ml) for 3 hr. (a) Heatmap of differentially expressed genes by statins. (b) Gene Ontology (GO) analysis of downregulated genes by statins. (c) GO analysis of upregulated genes by statin. (B) Bone marrow-derived macrophages (BMDMs) treated with or without compactin (10 + 200 µM mevalonate; 2 days) are stimulated by LPS (50 ng/ml, 3 hr). Gene expressions are analyzed by qPCR. (C) BMDMs treated with or without compactin are stimulated by IL-4 (20 ng/ml, 6 hr) and gene expressions are analyzed by qPCR. (D) Chromatin-immunoprecipitation (ChIP) analysis of H3K27me3 in BMDMs with or without compactin treatment. The inactive gene desert is used as input control. Data are representative of at least 2 independent experiments with 3 samples per group and data are presented as mean ± standrad deviation (SD). Statistical analysis was performed using unpaired, two-tailed Student’s t-test. Asterisks (*) and (**) indicate a significant difference with p < 0.05 and p < 0.001. A hashtag (#) indicates not significant.
Figure 8 with 2 supplements
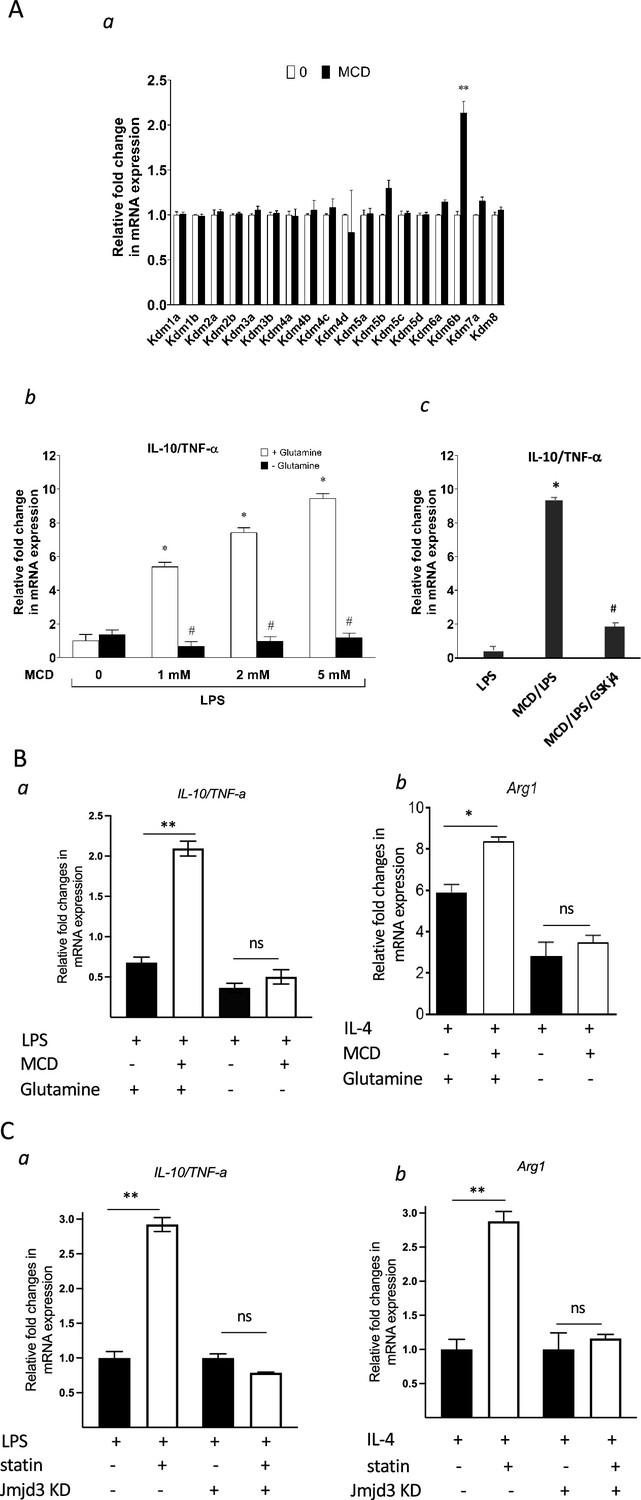
Cholesterol reduction suppresses proinflammatory phenotypes and enhances the expression of anti-inflammatory factors, depending on Jmjd3 and its enzymatic activity.
(A) RAW macrophages were treated with methyl-β-cyclodextrin (MCD) (5 mM, 1 hr). (a) The expression of JmjC demethylase family with or without MCD treatment. (b) After lipopolysaccharide (LPS) stimulation (100 ng/ml, 3 hr), in the presence of glutamine or without, the expression of Il10 and Tnfa was analyzed by qPCR to generate the ratio of Il10/Tnfa. (c) Effect of GSJK4, a JMJD3 inhibitor, on Il10/Tnfa. (B) (a) Bone marrow-derived macrophages (BMDMs) treated with or without MCD are stimulated by LPS (50 ng/ml, 3 hr) in the presence of glutamine or without. Expression of Il10 and Tnfa was analyzed by qPCR to generate the ratio of ratio of Il10/Tnfa. (b) BMDMs treated with or without MCD are stimulated by IL-4 (20 ng/ml, 6 hr) and expression of Arg1 is analyzed by qPCR. (C) wt and Jmjd3 KD RAW macrophages were treated with compactin (10 + 200 µM mevalonate; 2 days) and then stimulated with LPS (100 ng/ml, 3 hr) or IL-4 (20 ng/ml, 6 hr). Expression of Il10 and Tnfa (a) or Arg1 (b) was analyzed by qPCR. Data are representative of 3 independent experiments with 3 samples per group and data are presented as mean ± standard deviation (SD). Statistical analysis was performed using unpaired, two-tailed Student’s t-test. Asterisks (*) and (**) indicate a significant difference with p < 0.05 and p < 0.001. A hashtag (#) indicates a significant difference between MCD without or with glutamine with p < 0.05.
Figure 8—figure supplement 1

Expression of the Jmjd3.
In 264.7 macrophages with increasing doses of methyl-β-cyclodextrin (MCD) (mean ± standard deviation [SD]). An asterisk (*) indicates a significant difference with p < 0.01.
Figure 8—figure supplement 2

Expression of JMJD3 in wt and Jmjd3 KD macrophages (mean ± standard deviation [SD]), p < 0.001.
Figure 9
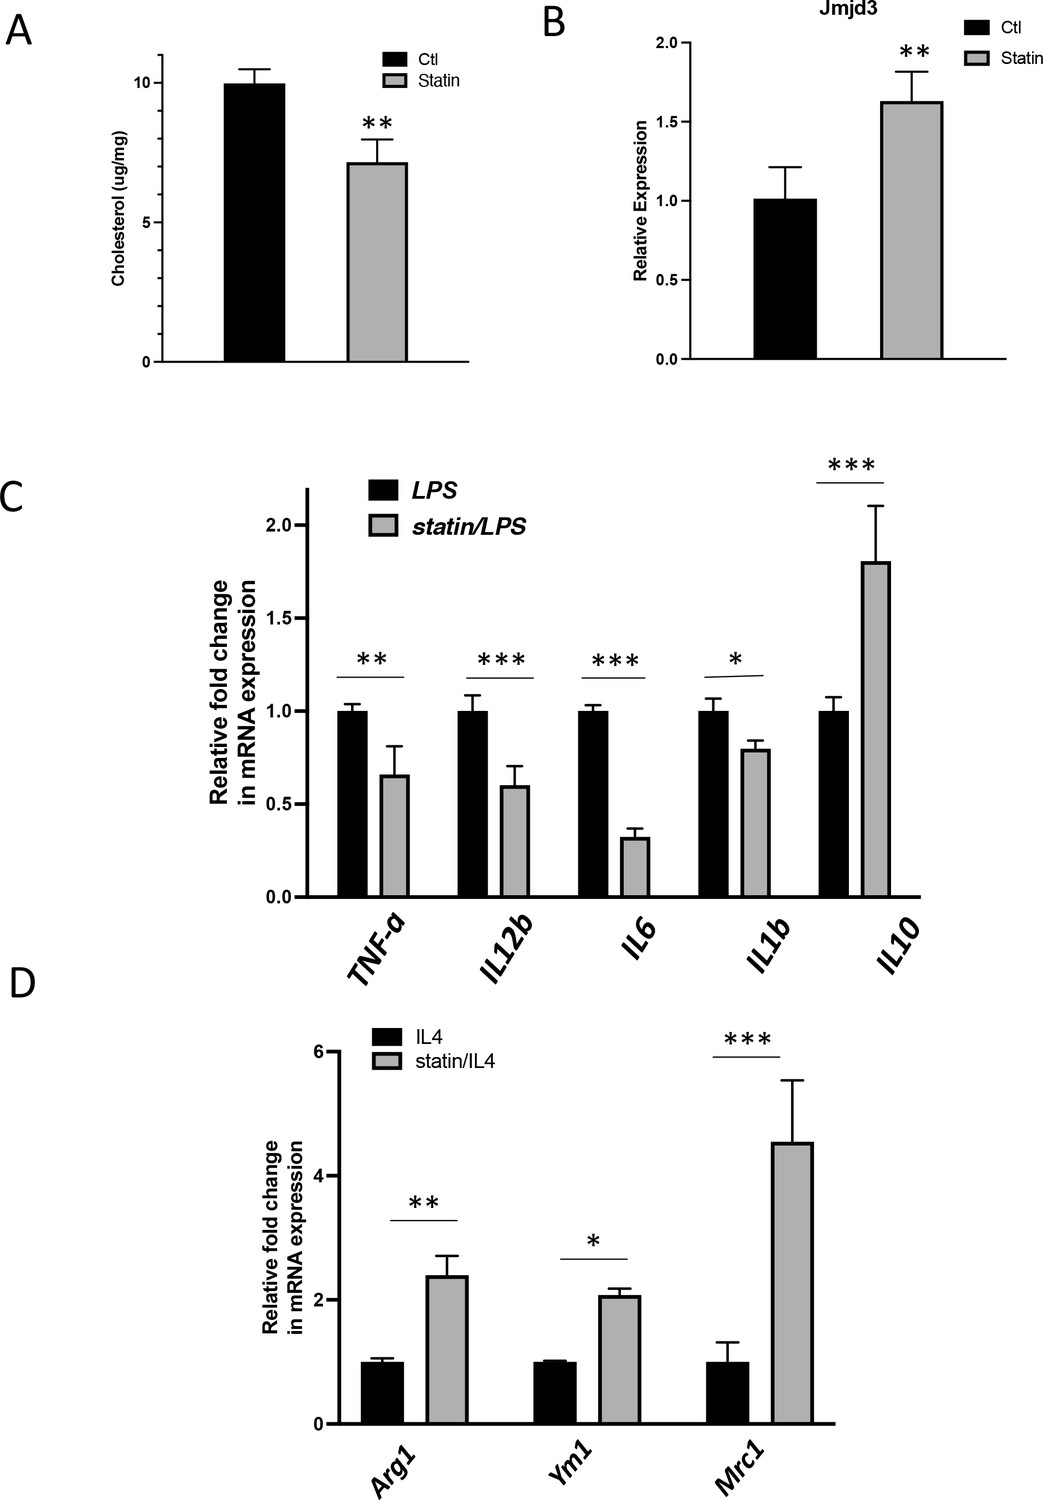
In vivo statin feeding in mice reduces cholesterol and upregulates Jmjd3 in the peritoneal macrophages, which conveys anti-inflammatory phenotype.
(A) Total cholesterol contents (free and esterified) in freshly isolated mouse peritoneal macrophages from simvastatin-fed (100 μg/kg/day, 14 days) and control mice. (B) Jmjd3 gene expression in peritoneal macrophages from simvastatin-fed (statin) and control mice. (C) Freshly isolated mouse peritoneal macrophages from simvastatin-fed and control mice are stimulated by lipopolysaccharide (LPS) (100 ng/ml, 6 hr). Gene expressions are analyzed by qPCR. (D) Freshly isolated mouse peritoneal macrophages from simvastatin-fed and control mice are stimulated by IL-4 (20 ng/ml, 6 hr) and gene expressions are analyzed by qPCR. Data are representative of 3 independent experiments with 3–4 samples per group and presented as mean ± standard deviation (SD). Statistical analysis was performed using unpaired, two-tailed Student’s t-test. Asterisks (*), (**), and (***) indicate a significant difference with p < 0.05, p < 0.005, and p < 0.001, respectively.
Tables
Table 1
Upregulated genes (top 40) by statin (A) and methyl-β-cyclodextrin (MCD) (B).
RNA-seq was performed in statin- or MCD-treated macrophages. For genes upregulated (log2 >1) (Supplementary file 1), the top 40 upregulated genes by both statin and by MCD.
| Gene names | log2 fold change | p value | padj |
|---|---|---|---|
| Pgf | 10.13651906 | 8.87E−12 | 1.50E−10 |
| Rab15 | 9.393223225 | 4.73E−10 | 6.56E−09 |
| Sphk1 | 8.930573917 | 1.11E−09 | 1.45E−08 |
| Cplx2 | 8.774337587 | 1.02E−08 | 1.15E−07 |
| Edn1 | 8.701794125 | 4.44E−10 | 6.21E−09 |
| Dok7 | 8.435798979 | 0.000000194 | 1.79E−06 |
| Pdcd1 | 7.677598898 | 0.00000317 | 0.000023229 |
| Bdkrb2 | 7.485212923 | 0.00000921 | 0.000061728 |
| Pdpn | 7.245557725 | 8.11E−10 | 1.09E−08 |
| Nr4a3 | 6.905154247 | 8.81E−17 | 2.79E−15 |
| Dusp8 | 6.790646438 | 4.60E−46 | 1.27E−43 |
| Areg | 6.694617375 | 9.88E−11 | 1.48E−09 |
| Gm13889 | 6.67201557 | 1.19E−33 | 1.55E−31 |
| Ptpn14 | 6.580623988 | 9.83E−13 | 1.91E−11 |
| Hgfac | 6.329990066 | 0.0000575 | 0.00031881 |
| Clec4n | 6.157949617 | 1.52E−114 | 4.62E−111 |
| Mylk2 | 6.131939756 | 0.00163753 | 0.0060117 |
| Socs2 | 6.088256349 | 0.00180709 | 0.00656174 |
| Hr | 6.018030298 | 8.71E−42 | 2.08E−39 |
| Arntl2 | 6.016235026 | 0.00019782 | 0.00095687 |
| Esyt3 | 6.006389797 | 0.00297479 | 0.01010416 |
| Arhgef26 | 5.979707067 | 0.00654321 | 0.01983335 |
| Itgb3 | 5.924269828 | 0.00404747 | 0.01320581 |
| Tnfrsf9 | 5.761582722 | 2.79E−09 | 3.42E−08 |
| Hbegf | 5.737032919 | 1.23E−16 | 3.81E−15 |
| Sema7a | 5.586005669 | 0.00826075 | 0.02417248 |
| Lrrc32 | 5.473546382 | 0.00000044 | 3.80E−06 |
| Scn11a | 5.408935346 | 0.01371225 | 0.03712608 |
| \Prss35 | 5.402316379 | 0.01365624 | 0.0370148 |
| Mustn1 | 5.257604938 | 0.000000142 | 1.35E−06 |
| Rgs16 | 5.190735177 | 0.000000529 | 0.000004505 |
| Clcf1 | 5.151265251 | 0.00361481 | 0.01196418 |
| BC021614 | 5.075557852 | 0.00411785 | 0.01339593 |
| Cxcl2 | 5.021314952 | 9.02E−191 | 1.10E−186 |
| Fam20a | 4.966798875 | 0.00741 | 0.02203267 |
| Sp7 | 4.928788817 | 0.00615636 | 0.01883905 |
| Gprc5a | 4.927629461 | 6.27E−19 | 2.49E−17 |
| Nfe2 | 4.875385857 | 1.23E−14 | 3.03E−13 |
| Ccl3 | 4.847246887 | 1.61E−119 | 6.54E−116 |
| Lamc2 | 4.837832794 | 1.68E−09 | 2.13E−08 |
| Il1b | 4.115965111 | 6.22E−29 | 1.71E−26 |
| Cxcl2 | 3.962459756 | 0 | 0 |
| Egr1 | 3.365911716 | 2.49E−125 | 2.10E−122 |
| Tnf | 3.306387647 | 1.50E−176 | 2.06E−173 |
| Nfkbiz | 3.259909052 | 0 | 0 |
| Arc | 3.021670065 | 2.13E−30 | 6.18E−28 |
| Ier3 | 2.897093474 | 4.02E−153 | 4.43E−150 |
| Zfp36 | 2.853262721 | 1.29E−157 | 1.57E−154 |
| Lif | 2.748205257 | 1.80E−10 | 2.18E−08 |
| Dusp2 | 2.627829764 | 7.14E−129 | 6.55E−126 |
| Tnfaip3 | 2.585932017 | 2.15E−279 | 7.87E−276 |
| Egr2 | 2.32626986 | 2.58E−46 | 9.46E−44 |
| Ier2 | 2.034656801 | 2.63E−262 | 7.24E−259 |
| Dusp1 | 1.977596852 | 6.88E−109 | 4.45E−106 |
| Junb | 1.950358114 | 5.59E−74 | 2.80E−71 |
| Btg2 | 1.92138967 | 3.61E−204 | 7.94E−201 |
| Pde4b | 1.920348453 | 8.18E−87 | 4.50E−84 |
| Dusp5 | 1.918194267 | 6.50E−27 | 1.75E−24 |
| Maff | 1.891310296 | 8.36E−41 | 2.70E−38 |
| Ppp1r15a | 1.878276549 | 6.16E−121 | 4.84E−118 |
| Ptgs2 | 1.775605515 | 1.44E−201 | 2.63E−198 |
| Phlda1 | 1.775056479 | 1.24E−13 | 1.90E−11 |
| Nfkbid | 1.673557595 | 4.68E−111 | 3.22E−108 |
| Fos | 1.629250783 | 1.79E−146 | 1.79E−143 |
| Nfkbia | 1.595064568 | 7.69E−196 | 1.21E−192 |
| Nr4a1 | 1.580570737 | 3.42E−42 | 1.18E−39 |
| Socs3 | 1.571871776 | 9.72E−66 | 4.11E−63 |
| Gdf15 | 1.555447107 | 0.0000514 | 0.00317852 |
| Pim1 | 1.547649464 | 5.43E−108 | 3.32E−105 |
| Zc3h12a | 1.524253928 | 7.40E−92 | 4.28E−89 |
| Egr3 | 1.494163502 | 5.44E−20 | 1.13E−17 |
| Osm | 1.430409511 | 1.27E−22 | 3.10E−20 |
| Myc | 1.331901297 | 1.10E−10 | 1.35E−08 |
| Gpr84 | 1.310067562 | 1.23E−18 | 2.42E−16 |
| Traf1 | 1.30684728 | 4.76E−52 | 1.81E−49 |
| Cxcl10 | 1.28466895 | 1.01E−15 | 1.76E−13 |
| Hmgcs1 | 1.279756645 | 7.39E−07 | 6.25E−05 |
| Errfi1 | 1.254057102 | 1.47E−38 | 4.63E−36 |
| H2-K2 | 1.251411578 | 1.71E−17 | 3.24E−15 |
| Ccrl2 | 1.214065207 | 1.41E−13 | 2.13E−11 |
Table 2
Mouse primers used for real-time RT-qPCR.
| Primer | Sequence | |
|---|---|---|
| Hprt1 | Forward | TGTTGTTGGATATGCCCTTG |
| Reverse | TTGCGCTCATCTTAGGCTTT | |
| Il1b | Forward | AGTTGACGGACCCCAAAAGAT |
| Reverse | GTTGATGTGCTGCTGGGAGA | |
| Jmjd3 | Forward | CCAGGCCACCAAGAGAATAA |
| Reverse | CGCTGATGGTCTCCCAATAG | |
| Tnfa | Forward | CCGTAGGGCGATTACAGTCA |
| Reverse | CCTGGCCTCTCTACCTTGTTG | |
| Il10 | Forward | TGGCCCAGAAATCAAGGAGC |
| Reverse | CAGCAGACTCAATACACACT | |
| Il6 | Forward | TAGTCCTTCCTACCCCAATTTCC |
| Reverse | TTGGTCCTTAGCCACTCCTTC | |
| Il12b | Forward | GGAAGCACGGCAGCAGAATA |
| Reverse | AACTTGAGGGAGAAGTAGGAATGG | |
| Arg1 | Forward | CTCCAAGCCAAAGTCCTTAGAG |
| Reverse | AGGAGCTGTCATTAGGGACATC | |
| Ym1 | Forward | AGAAGGGAGTTTCAAACCTGGT |
| Reverse | GTCTTGCTCATGTGTGTAAGTGA | |
| Mrc1 | Forward | CTCTGTTCAGCTATTGGACGC |
| Reverse | CGGAATTTCTGGGATTCAGCTTC | |
Additional files
-
MDAR checklist
- https://cdn.elifesciences.org/articles/85964/elife-85964-mdarchecklist1-v4.docx
-
Supplementary file 1
RNA-seq data of macrophages treated or not with statins.
- https://cdn.elifesciences.org/articles/85964/elife-85964-supp1-v4.xlsx
-
Supplementary file 2
RNA-seq data of macrophages treated or not with MCD.
- https://cdn.elifesciences.org/articles/85964/elife-85964-supp2-v4.xlsx
-
Supplementary file 3
ATAC-seq data of macrophages treated or not with MCD.
- https://cdn.elifesciences.org/articles/85964/elife-85964-supp3-v4.xlsx
-
Supplementary file 4
Genes showing chromatin opening (ATAC-Seq peak) and increased expression (RNA-Seq) after MCD treatment as well as Statin Treatment.
- https://cdn.elifesciences.org/articles/85964/elife-85964-supp4-v4.xlsx
-
Supplementary file 5
RNA-seq of macrophages treated with or not with statins and then stimulated by LPS.
- https://cdn.elifesciences.org/articles/85964/elife-85964-supp5-v4.xlsx
Download links
A two-part list of links to download the article, or parts of the article, in various formats.
Downloads (link to download the article as PDF)
Open citations (links to open the citations from this article in various online reference manager services)
Cite this article (links to download the citations from this article in formats compatible with various reference manager tools)
Statin-mediated reduction in mitochondrial cholesterol primes an anti-inflammatory response in macrophages by upregulating Jmjd3
eLife 13:e85964.
https://doi.org/10.7554/eLife.85964


