Transcriptional regulation of SARS-CoV-2 receptor ACE2 by SP1
- State Key Laboratory for Conservation and Utilization of Bio-Resources in Yunnan, School of Life Sciences, Yunnan University, China
- Key Laboratory of Bioactive Peptides of Yunnan Province/Key Laboratory of Animal Models and Human Disease Mechanisms of the Chinese Academy of Sciences, KIZ-CUHK Joint Laboratory of Bio-Resources and Molecular Research in Common Diseases, Center for Biosafety Mega-Science, Kunming Institute of Zoology, Chinese Academy of Sciences, China
- Department of Pathology, Yan’an Hospital, Kunming Medical University, China
Figures
Figure 1 with 1 supplement
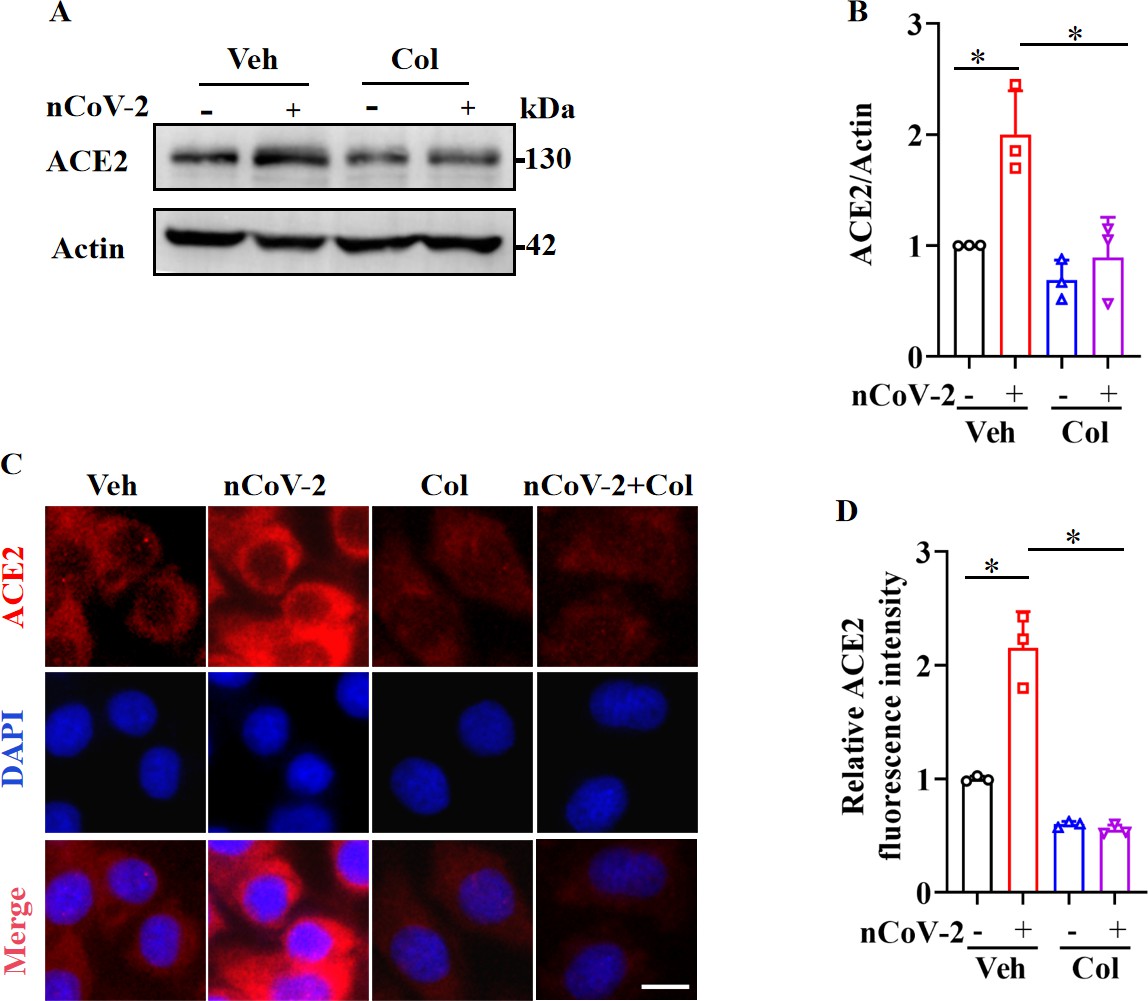
SARS-CoV-2 infection up-regulated ACE2 expression, which was suppressed by colchicine.
(A and B) SARS-CoV-2 infection up-regulated protein levels of ACE2. Colchicine (20 nM) significantly reduced protein levels of ACE2 in HPAEpiCs. Blot is typical of three independent experiments (A). Quantification of ACE2 to Actin ratio (B). Results are means ± standard deviation (SD) of three independent experiments. *p<0.05 (Student’s t-test). (C) Representative images of immunofluorescence staining for ACE2. Scale bar: 10 μm. (D) Quantification of ACE2 fluorescence intensity. Results are means ± SD of three independent experiments. *p<0.05 (Student’s t-test). Veh, Vehicle. Col, Colchicine. nCoV-2, SARS-CoV-2.
-
Figure 1—source data 1
Original uncropped western blot images in Figure 1A (anti-ACE2 and anti-Actin).
- https://cdn.elifesciences.org/articles/85985/elife-85985-fig1-data1-v1.zip
-
Figure 1—source data 2
PDF containing Figure 1A and original scans of relevant western blots (anti-ACE2 and anti-Actin) with highlighted bands and sample labels.
- https://cdn.elifesciences.org/articles/85985/elife-85985-fig1-data2-v1.zip
-
Figure 1—source data 3
Original file for quantification of ACE2 to Actin ratio in Figure 1B (anti-ACE2 and anti-Actin).
- https://cdn.elifesciences.org/articles/85985/elife-85985-fig1-data3-v1.zip
-
Figure 1—source data 4
Original file for quantification of ACE2 fluorescence intensity in Figure 1D.
- https://cdn.elifesciences.org/articles/85985/elife-85985-fig1-data4-v1.zip
Figure 1—figure supplement 1

Colchicine blocked SARS-CoV-2 replication.
(A) Colchicine (20 nM) inhibited SARS-CoV-2 replication in HPAEpiCs. Cell culture supernatants were collected for viral load determination (n=8 each group). Error bars show means ± SD. ***p<0.001 (Student’s t-test). (B) Dose-response analysis of HPAEpiCs treated with colchicine at indicated concentrations and infected with SARS-CoV-2 (MOI = 1) for 48 hr.
-
Figure 1—figure supplement 1—source data 1
Original file for determination of viral load in Figure 1—figure supplement 1A.
- https://cdn.elifesciences.org/articles/85985/elife-85985-fig1-figsupp1-data1-v1.zip
-
Figure 1—figure supplement 1—source data 2
Original file for dose-response analysis in Figure 1—figure supplement 1B.
- https://cdn.elifesciences.org/articles/85985/elife-85985-fig1-figsupp1-data2-v1.zip
Figure 2 with 1 supplement
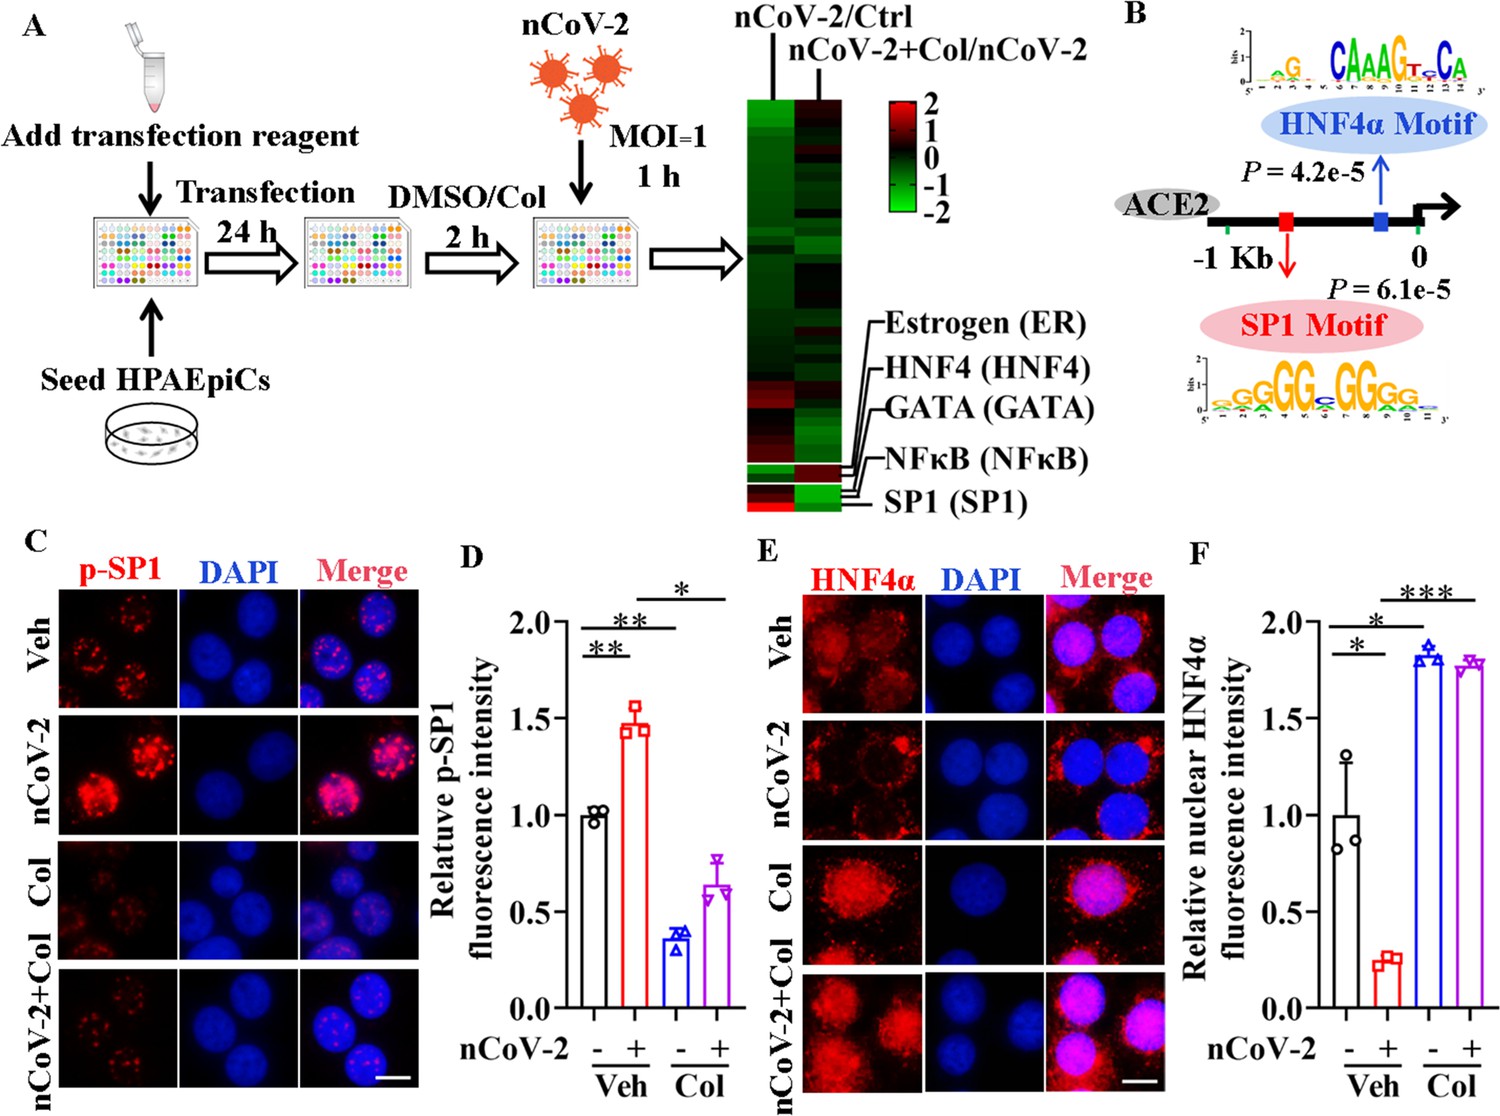
Activation of SP1 and inactivation of HNF4α were mediated by SARS-CoV-2.
(A) Assays for signaling pathways in response to SARS-CoV-2 infection and colchicine treatment (20 nM) using Cignal Finder 45-Pathway Reporter Array. (B) SP1 and HNF4α binding elements 1.5 kb upstream of TSS of ACE2 gene identified by MEME program. (C and D) SARS-CoV-2 significantly increased phosphorylation of SP1 (p–SP1) in HPAEpiCs, which was suppressed by treatment with colchicine (20 nM). Representative images of immunofluorescence staining for p-SP1 (C). Scale bar: 10 μm. Quantification of p-SP1 fluorescence intensity (D). Results are means ± SD of three independent experiments. *p<0.05, **p<0.01 (Student’s t-test). (E and F) SARS-CoV-2 induced cytoplasmic translocation of HNF4α, whereas colchicine (20 nM) promoted its nuclear accumulation in HPAEpiCs. Representative images of immunofluorescence staining for HNF4α (E). Scale bar: 10 μm. Quantification of HNF4α fluorescence intensity (F). Results are means ± SD of three independent experiments. *p<0.05, ***p<0.001 (Student’s t-test). Veh, Vehicle. Col, Colchicine. nCoV-2, SARS-CoV-2.
-
Figure 2—source data 1
Original file for quantification of p-SP1 fluorescence intensity in Figure 2D.
- https://cdn.elifesciences.org/articles/85985/elife-85985-fig2-data1-v1.zip
-
Figure 2—source data 2
Original file for quantification of HNF4α fluorescence intensity in Figure 2F.
- https://cdn.elifesciences.org/articles/85985/elife-85985-fig2-data2-v1.zip
Figure 2—figure supplement 1

SP1 was primarily located in nucleus of HPAEpiCs.
Scale bar: 10 μm.
Figure 3 with 3 supplements
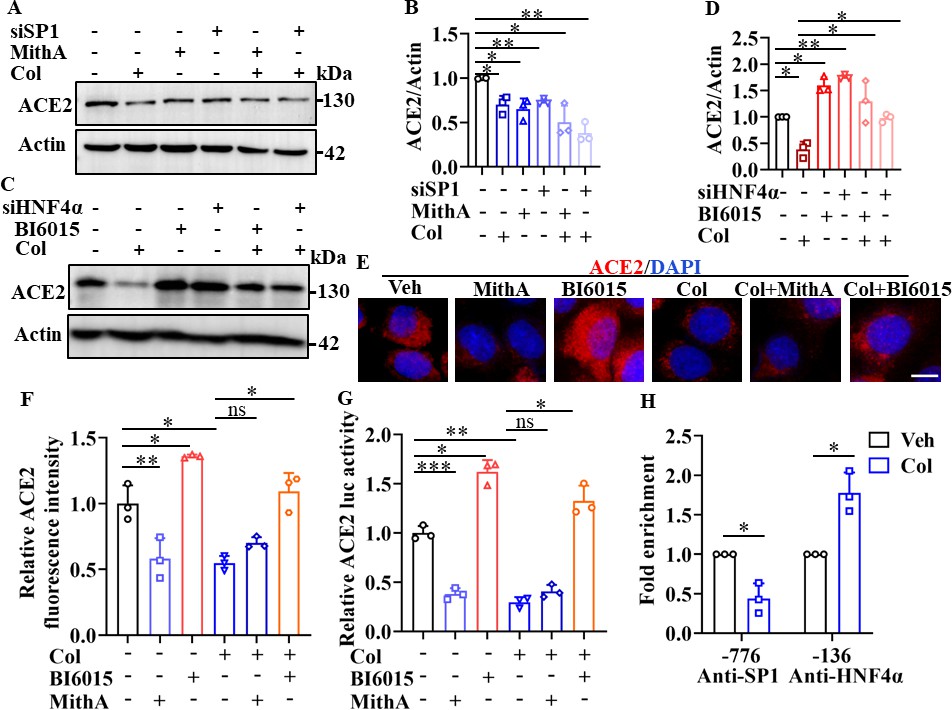
SP1 and HNF4α exerted opposing effects on regulation of ACE2 expression.
(A and B) HPAEpiCs were treated with colchicine (20 nM), MithA (100 nM), colchicine +MithA, siSP1, or siSP1 +colchicine, respectively. Inhibition of SP1 significantly suppressed ACE2 levels in HPAEpiCs. Blot is typical of three independent experiments (A). Quantification of ACE2 to Actin ratio (B). Results are means ± SD of three independent experiments. *p<0.05, **p<0.01 (Student’s t-test). (C and D) Supplementation with colchicine (20 nM) significantly suppressed ACE2 levels in HPAEpiCs, which was reversed by treatment with BI6015 (20 μM) or siHNF4α. Blot is typical of three independent experiments (C). Quantification of ACE2 to Actin ratio (D). Results are means ± SD of three independent experiments. *p<0.05, **p<0.01 (Student’s t-test). (E and F) HPAEpiCs were treated with MithA (100 nM), BI6015 (20 μM), colchicine (20 nM), colchicine + MithA, or colchicine +BI6015, respectively. Representative images of immunofluorescence staining for ACE2 in HPAEpiCs (E). Scale bar: 10 μm. Quantification of ACE2 fluorescence intensity (F). Results are means ± SD of three independent experiments. *p<0.05, **p<0.01, ns, not significant (Student’s t-test). (G) Luciferase activity analysis of ACE2 promoter in HPAEpiCs. Results are means ± SD of three independent experiments. *p<0.05, **p<0.01, ***p<0.001, ns, not significant (Student’s t-test). (H) Putative SP1 and HNF4α binding sites in promoter regions of ACE2 were detected by ChIP-qPCR with anti-SP1 and anti-HNF4α antibodies, respectively. Results are means ± SD of three independent experiments. *p<0.05. Veh, Vehicle. Col, Colchicine.
-
Figure 3—source data 1
Original uncropped western blot images in Figure 3A (anti-ACE2 and anti-Actin).
- https://cdn.elifesciences.org/articles/85985/elife-85985-fig3-data1-v1.zip
-
Figure 3—source data 2
Original uncropped western blot images in Figure 3C (anti-ACE2 and anti-Actin).
- https://cdn.elifesciences.org/articles/85985/elife-85985-fig3-data2-v1.zip
-
Figure 3—source data 3
PDF containing Figure 3A, C and original scans of relevant western blot analysis (anti-ACE2 and anti-Actin) with highlighted bands and sample labels.
- https://cdn.elifesciences.org/articles/85985/elife-85985-fig3-data3-v1.zip
-
Figure 3—source data 4
Original file for quantification of ACE2 to Actin ratio in Figure 3B, D (anti-ACE2 and anti-Actin).
- https://cdn.elifesciences.org/articles/85985/elife-85985-fig3-data4-v1.zip
-
Figure 3—source data 5
Original file for quantification of ACE2 fluorescence intensity in Figure 3F.
- https://cdn.elifesciences.org/articles/85985/elife-85985-fig3-data5-v1.zip
-
Figure 3—source data 6
Original file for luciferase activity analysis in Figure 3G.
- https://cdn.elifesciences.org/articles/85985/elife-85985-fig3-data6-v1.zip
-
Figure 3—source data 7
Original file for ChIP analysis in Figure 3H.
- https://cdn.elifesciences.org/articles/85985/elife-85985-fig3-data7-v1.zip
Figure 3—figure supplement 1
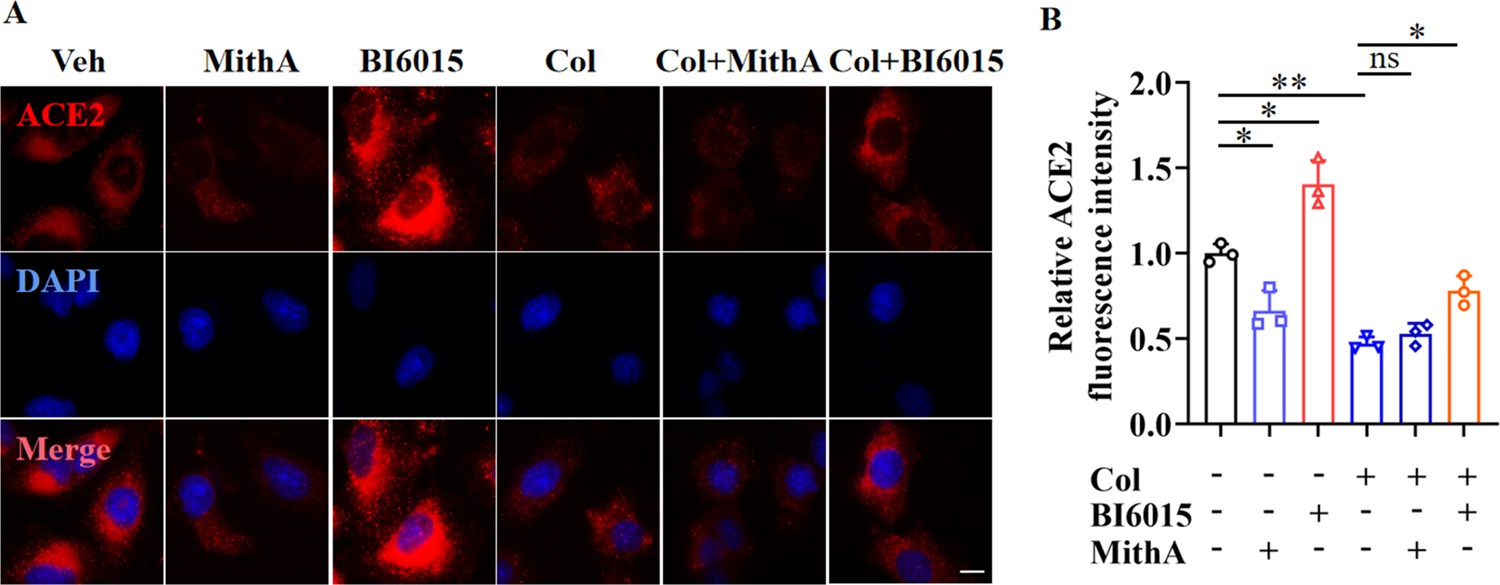
Immunofluorescence analysis of expression and localization of ACE2 in A549 cells.
(A) Representative images of immunofluorescence staining for ACE2 in A549 cells. A549 cells were treated with MithA, BI6015, colchicine, colchicine +MithA, or colchicine +BI6015, respectively. Scale bar: 10 μm. (B) Quantification of ACE2 fluorescence intensity. Results are means ± SD of three independent experiments. *p<0.05, **p<0.01, ns, not significant (Student’s t-test). Veh, Vehicle. Col, Colchicine.
-
Figure 3—figure supplement 1—source data 1
Original file for quantification of ACE2 fluorescence intensity in Figure 3—figure supplement 1B.
- https://cdn.elifesciences.org/articles/85985/elife-85985-fig3-figsupp1-data1-v1.zip
Figure 3—figure supplement 2

SARS-CoV-2 infection up-regulated ACE2 expression, which was suppressed by colchicine in HK-2 and Huh-7 cells.
(A and B) SARS-CoV-2 infection up-regulated protein levels of ACE2. Colchicine (20 nM) significantly reduced protein levels of ACE2 in HK-2 cells. Blot is typical of three independent experiments (A). Quantification of ACE2 to Actin ratio in HK-2 cells (B). Results are means ± SD of three independent experiments. *p<0.05, **p<0.01 (Student’s t-test). (C and D) SARS-CoV-2 infection up-regulated protein levels of ACE2. Colchicine (20 nM) significantly reduced protein levels of ACE2 in SARS-CoV-2-infected Huh-7 cells. Blot is typical of three independent experiments (C). Quantification of ACE2 to Actin ratio in Huh-7 cells (D). Results are means ± SD of three independent experiments. *p<0.05, **p<0.01, ns, not significant (Student’s t-test). (E) Colchicine (20 nM) and MithA (100 nM) inhibited SARS-CoV-2 replication in HK-2 cells. Cell culture supernatants were collected for viral load determination. Error bars show means ± SD. **p<0.01, ***p<0.001 (Student’s t-test). (F) Colchicine (20 nM) and MithA (100 nM) inhibited SARS-CoV-2 replication in Huh-7 cells. Cell culture supernatants were collected for viral load determination. Error bars show means ± SD. **p<0.01, ***p<0.001 (Student’s t-test).
-
Figure 3—figure supplement 2—source data 1
Original uncropped western blot images in Figure 3—figure supplement 2A (anti-ACE2 and anti-Actin).
- https://cdn.elifesciences.org/articles/85985/elife-85985-fig3-figsupp2-data1-v1.zip
-
Figure 3—figure supplement 2—source data 2
Original uncropped western blot images in Figure 3—figure supplement 2C (anti-ACE2 and anti-Actin).
- https://cdn.elifesciences.org/articles/85985/elife-85985-fig3-figsupp2-data2-v1.zip
-
Figure 3—figure supplement 2—source data 3
PDF containing Figure 3—figure supplement 2A, C and original scans of relevant western blot analysis (anti-ACE2 and anti-Actin) with highlighted bands and sample labels.
- https://cdn.elifesciences.org/articles/85985/elife-85985-fig3-figsupp2-data3-v1.zip
-
Figure 3—figure supplement 2—source data 4
Original file for quantification of ACE2 to Actin ratio in Figure 3—figure supplement 2B, D (anti-ACE2 and anti-Actin).
- https://cdn.elifesciences.org/articles/85985/elife-85985-fig3-figsupp2-data4-v1.zip
-
Figure 3—figure supplement 2—source data 5
Original file for determination of viral load in Figure 3—figure supplement 2E, F.
- https://cdn.elifesciences.org/articles/85985/elife-85985-fig3-figsupp2-data5-v1.zip
Figure 3—figure supplement 3
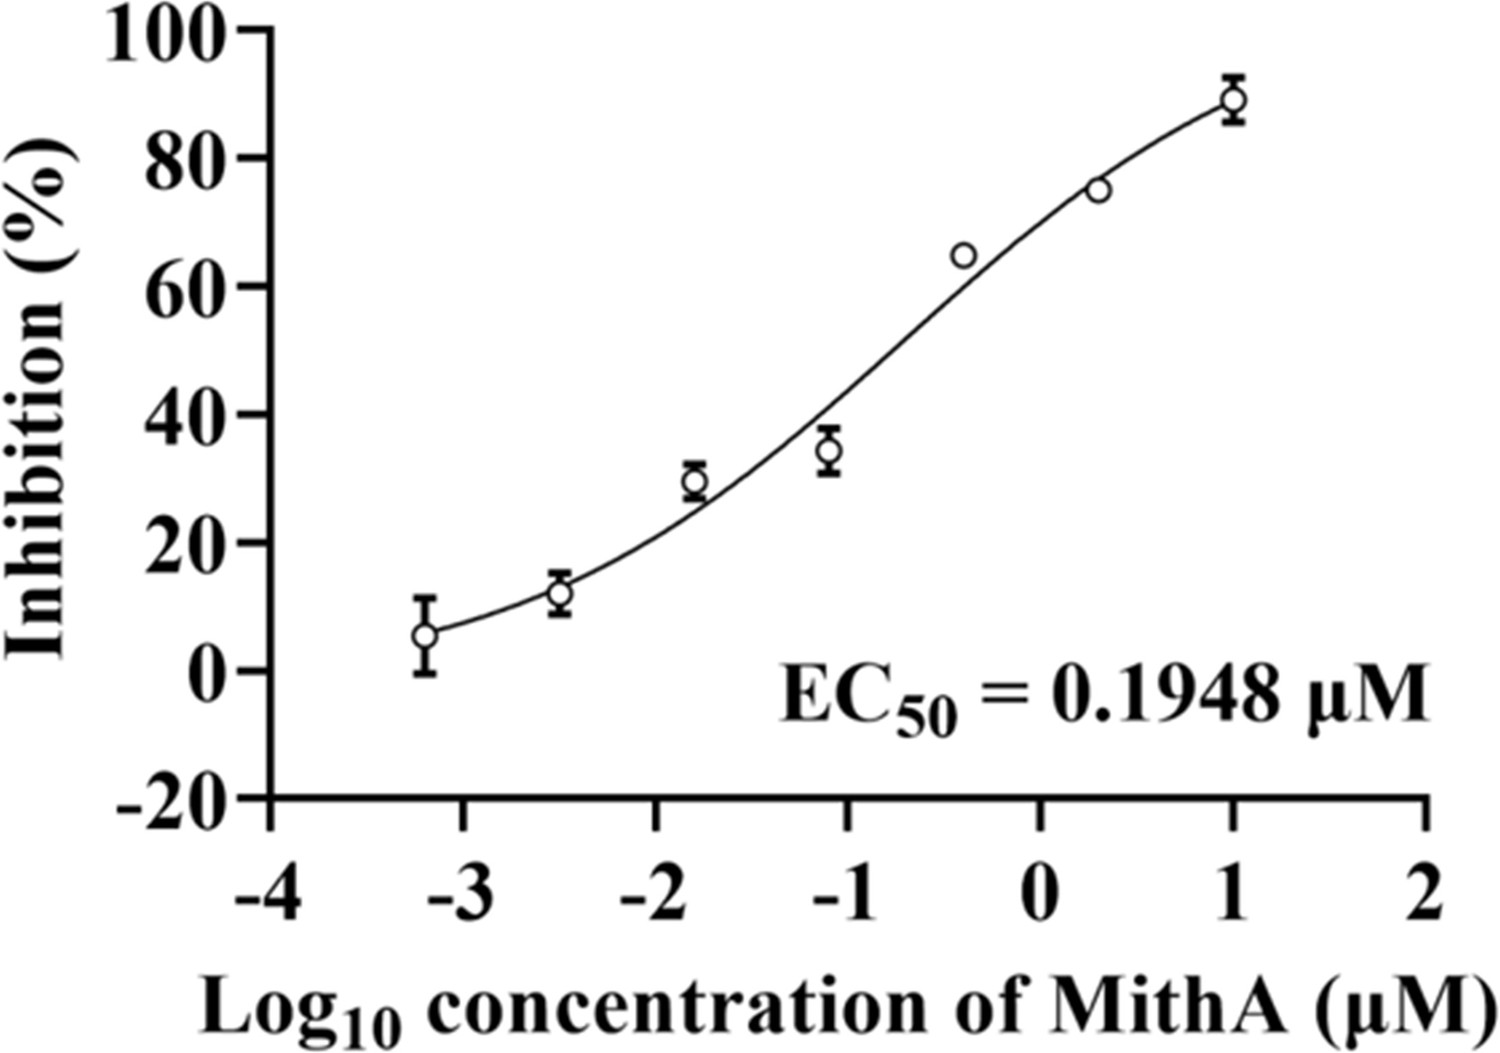
MithA inhibited SARS-CoV-2 replication in a dose-dependent manner.
Dose-response analysis of HPAEpiCs treated with indicated concentrations of MithA and infected with SARS-CoV-2 (MOI = 1) for 48 hr. EC50 was achieved by plaque reduction assay and plotted using logistic non-linear regression.
-
Figure 3—figure supplement 3—source data 1
Original file for dose-response analysis in Figure 3—figure supplement 3.
- https://cdn.elifesciences.org/articles/85985/elife-85985-fig3-figsupp3-data1-v1.zip
Figure 4
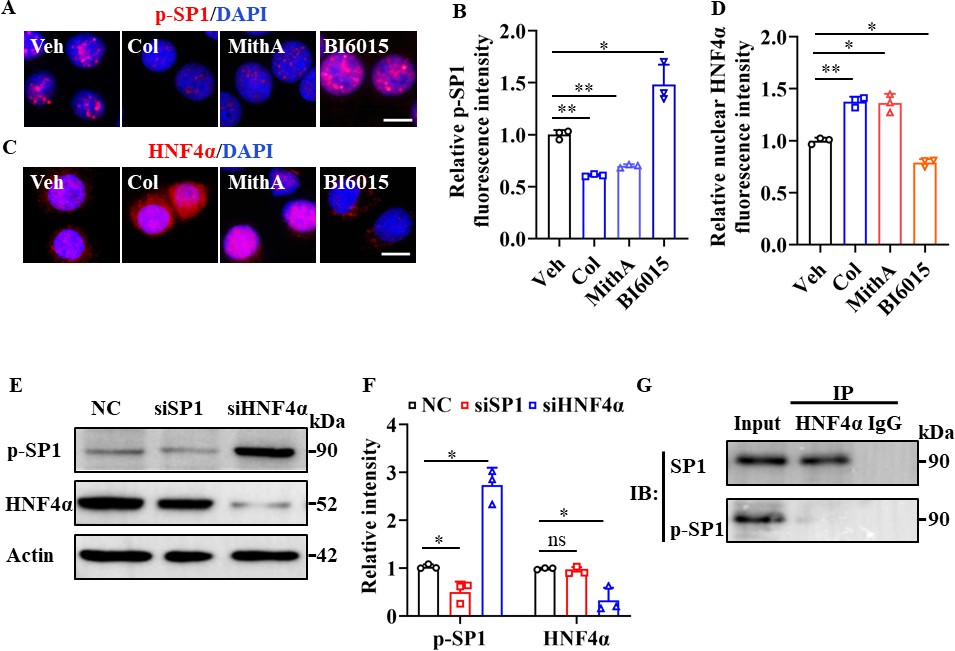
SP1 and HNF4α antagonized each other via protein-protein interactions.
(A and B) Supplementation with colchicine (20 nM) and MithA (100 nM) significantly suppressed SP1 phosphorylation (p–SP1) in HPAEpiCs, which was reversed by treatment with BI6015 (20 μM). Representative images of immunofluorescence staining for p-SP1 (A). Scale bar: 10 μm. Quantification of p-SP1 fluorescence intensity (B). Results are means ± SD of three independent experiments. *p<0.05, **p<0.01 (Student’s t-test). (C and D) Supplementation with colchicine (20 nM) and MithA (100 nM) promoted nuclear accumulation of HNF4α in HPAEpiCs, which was inhibited by treatment with BI6015 (20 μM). Representative images of immunofluorescence staining for HNF4α (C). Scale bar: 10 μm. Quantification of HNF4α fluorescence intensity (D). Results are means ± SD of three independent experiments. *p<0.05, **p<0.01 (Student’s t-test). (E and F) Phosphorylation levels of SP1 and total protein levels of HNF4α were measured in HPAEpiCs by western blotting. Blot is typical of three independent experiments (E). Quantification of p-SP1 or HNF4α to Actin ratio (F). Results are means ± SD of three independent experiments. *p<0.05, ns, not significant (Student’s t-test). (G) Interactions between SP1 and HNF4α were measured by co-IP in HPAEpiCs. NC, Negative control. Veh, Vehicle. Col, Colchicine.
-
Figure 4—source data 1
Original file for quantification of p-SP1 fluorescence intensity in Figure 4B.
- https://cdn.elifesciences.org/articles/85985/elife-85985-fig4-data1-v1.zip
-
Figure 4—source data 2
Original file for quantification of HNF4α fluorescence intensity in Figure 4D.
- https://cdn.elifesciences.org/articles/85985/elife-85985-fig4-data2-v1.zip
-
Figure 4—source data 3
Original uncropped western blot images in Figure 4E (anti-p-SP1, anti-HNF4α, and anti-Actin).
- https://cdn.elifesciences.org/articles/85985/elife-85985-fig4-data3-v1.zip
-
Figure 4—source data 4
PDF containing Figure 4E, G and original scans of relevant western blot analysis (anti-p-SP1, anti-HNF4α, and anti-Actin) with highlighted bands and sample labels.
- https://cdn.elifesciences.org/articles/85985/elife-85985-fig4-data4-v1.zip
-
Figure 4—source data 5
Original file for quantification of p-SP1 or HNF4α to Actin ratio in Figure 4F (anti-p-SP1, anti-HNF4α, and anti-Actin).
- https://cdn.elifesciences.org/articles/85985/elife-85985-fig4-data5-v1.zip
-
Figure 4—source data 6
Original uncropped western blot images in Figure 4G.
- https://cdn.elifesciences.org/articles/85985/elife-85985-fig4-data6-v1.zip
Figure 5 with 1 supplement
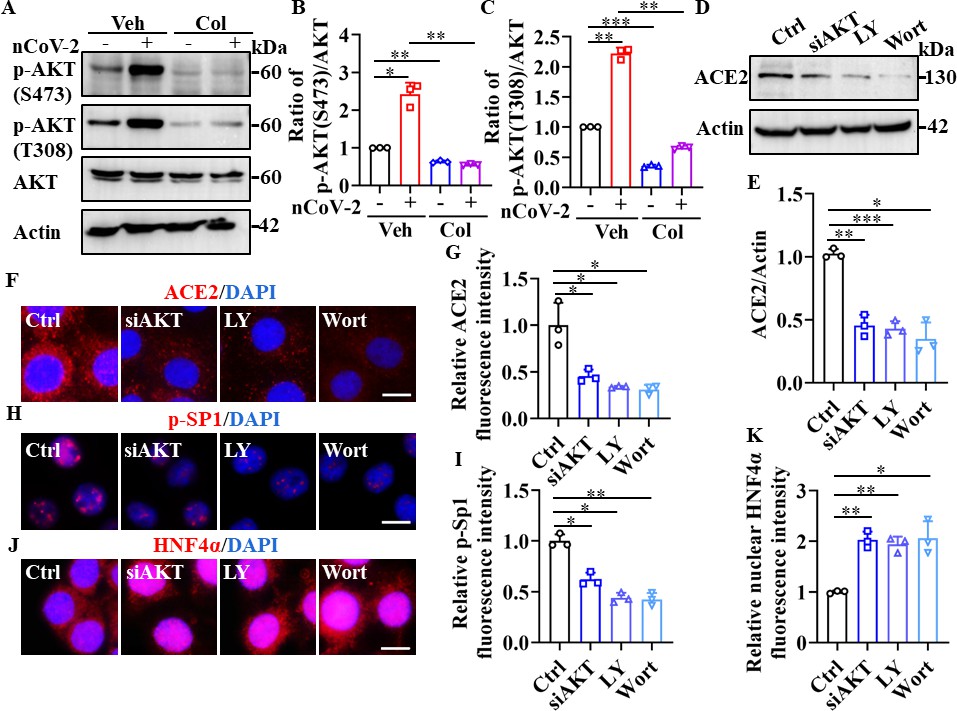
SP1 and HNF4α were downstream of the PI3K/AKT signaling pathway.
(A–C) Phosphorylation levels of AKT (S473 and T308) were measured in HPAEpiCs by western blotting. Blot is typical of three independent experiments (A). Quantification of p-AKT (S473) (B) or p-AKT (T308) (C) to Actin ratio. Results are means ± SD of three independent experiments. *p<0.05, **p<0.01, ***p<0.001 (Student’s t-test). (D–G) Supplementation with LY294002 (30 μM) and wortmannin (50 nM) or siAKT significantly suppressed ACE2 levels in HPAEpiCs. Blot is typical of three independent experiments (D). Quantification of ACE2 to Actin ratio (E). Results are means ± SD of three independent experiments. *p<0.05, **p<0.01, ***p<0.001 (Student’s t-test). Representative images of immunofluorescence staining for ACE2 (F). Scale bar: 10 μm. Quantification of ACE2 fluorescence intensity (G). Results are means ± SD of three independent experiments. *p<0.05 (Student’s t-test). (H and I) Supplementation with LY294002 (30 μM) and wortmannin (50 nM) or siAKT significantly suppressed phosphorylation of SP1 (p–SP1) in HPAEpiCs. Representative images of immunofluorescence staining for p-SP1 (H). Scale bar: 10 μm. Quantification of p-SP1 fluorescence intensity (I). Results are means ± SD of three independent experiments. **p<0.01, **p<0.01 (Student’s t-test). (J and K) Supplementation with LY294002 (30 μM) and wortmannin (50 nM) or siAKT promoted nuclear accumulation of HNF4α in HPAEpiCs. Representative images of immunofluorescence staining for HNF4α (J). Scale bar: 10 μm. Quantification of HNF4α fluorescence intensity (K). Results are means ± SD of three independent experiments. *p<0.05, **p<0.01 (Student’s t-test). Ctrl, Control. Veh, Vehicle. Col, Colchicine. LY, LY294002. Wort, wortmannin. nCoV-2, SARS-CoV-2.
-
Figure 5—source data 1
Original uncropped western blot images in Figure 5A (anti-p-AKT (S473), anti-p-AKT (T308), and anti-Actin).
- https://cdn.elifesciences.org/articles/85985/elife-85985-fig5-data1-v1.zip
-
Figure 5—source data 2
PDF containing Figure 5A, D and original scans of relevant western blot analysis with highlighted bands and sample labels.
- https://cdn.elifesciences.org/articles/85985/elife-85985-fig5-data2-v1.zip
-
Figure 5—source data 3
Original file for quantification of p-AKT to AKT ratio in Figure 5B, C.
- https://cdn.elifesciences.org/articles/85985/elife-85985-fig5-data3-v1.zip
-
Figure 5—source data 4
Original uncropped western blot images in Figure 5D (anti-ACE2 and anti-Actin).
- https://cdn.elifesciences.org/articles/85985/elife-85985-fig5-data4-v1.zip
-
Figure 5—source data 5
Original file for quantification the ratio of ACE2 to Actin in Figure 5E.
- https://cdn.elifesciences.org/articles/85985/elife-85985-fig5-data5-v1.zip
-
Figure 5—source data 6
Original files for quantification of ACE2, p-SP1, and HNF4α fluorescence intensity in Figure 5G, I and K.
- https://cdn.elifesciences.org/articles/85985/elife-85985-fig5-data6-v1.zip
Figure 5—figure supplement 1
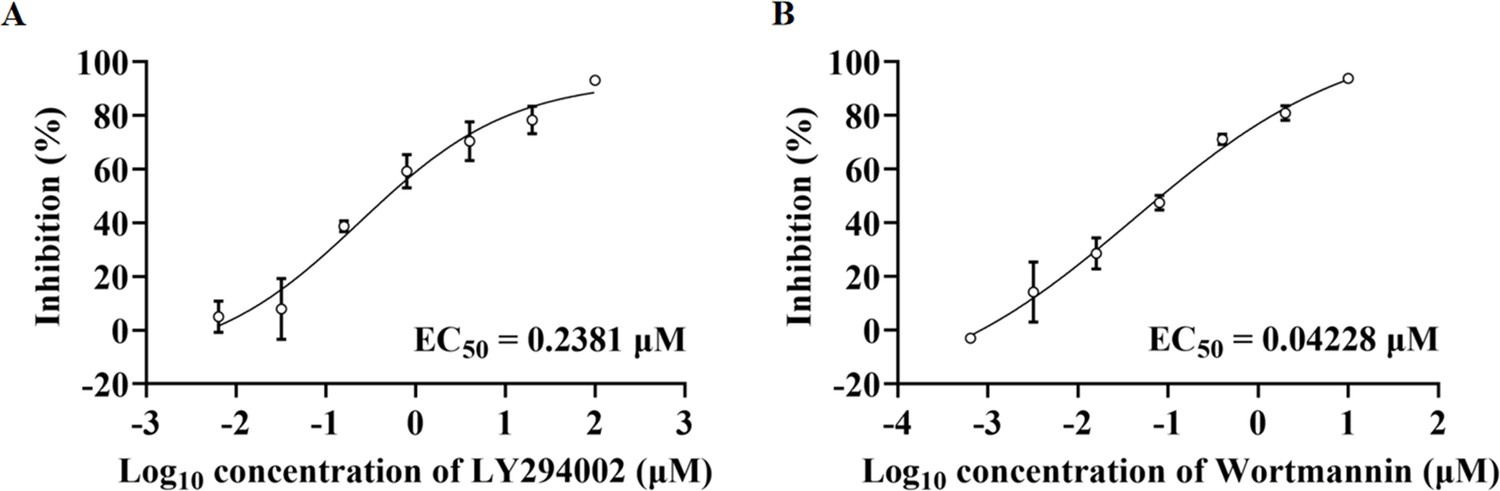
PI3K inhibitors inhibited SARS-CoV-2 replication in a dose-dependent manner.
(A and B) Dose-response analysis of HPAEpiCs treated with indicated concentrations of PI3K/AKT inhibitors LY294002 (A) or wortmannin (B) and infected with SARS-CoV-2 (MOI = 1) for 48 hr. EC50 was achieved by plaque reduction assay and plotted using logistic non-linear regression model.
-
Figure 5—figure supplement 1—source data 1
Original file for dose-response analysis in Figure 5—figure supplement 1A, B.
- https://cdn.elifesciences.org/articles/85985/elife-85985-fig5-figsupp1-data1-v1.zip
Figure 6 with 2 supplements
Inhibition of SP1 inhibited replication of SARS-CoV-2 and reduced lung pathology in Syrian hamsters.
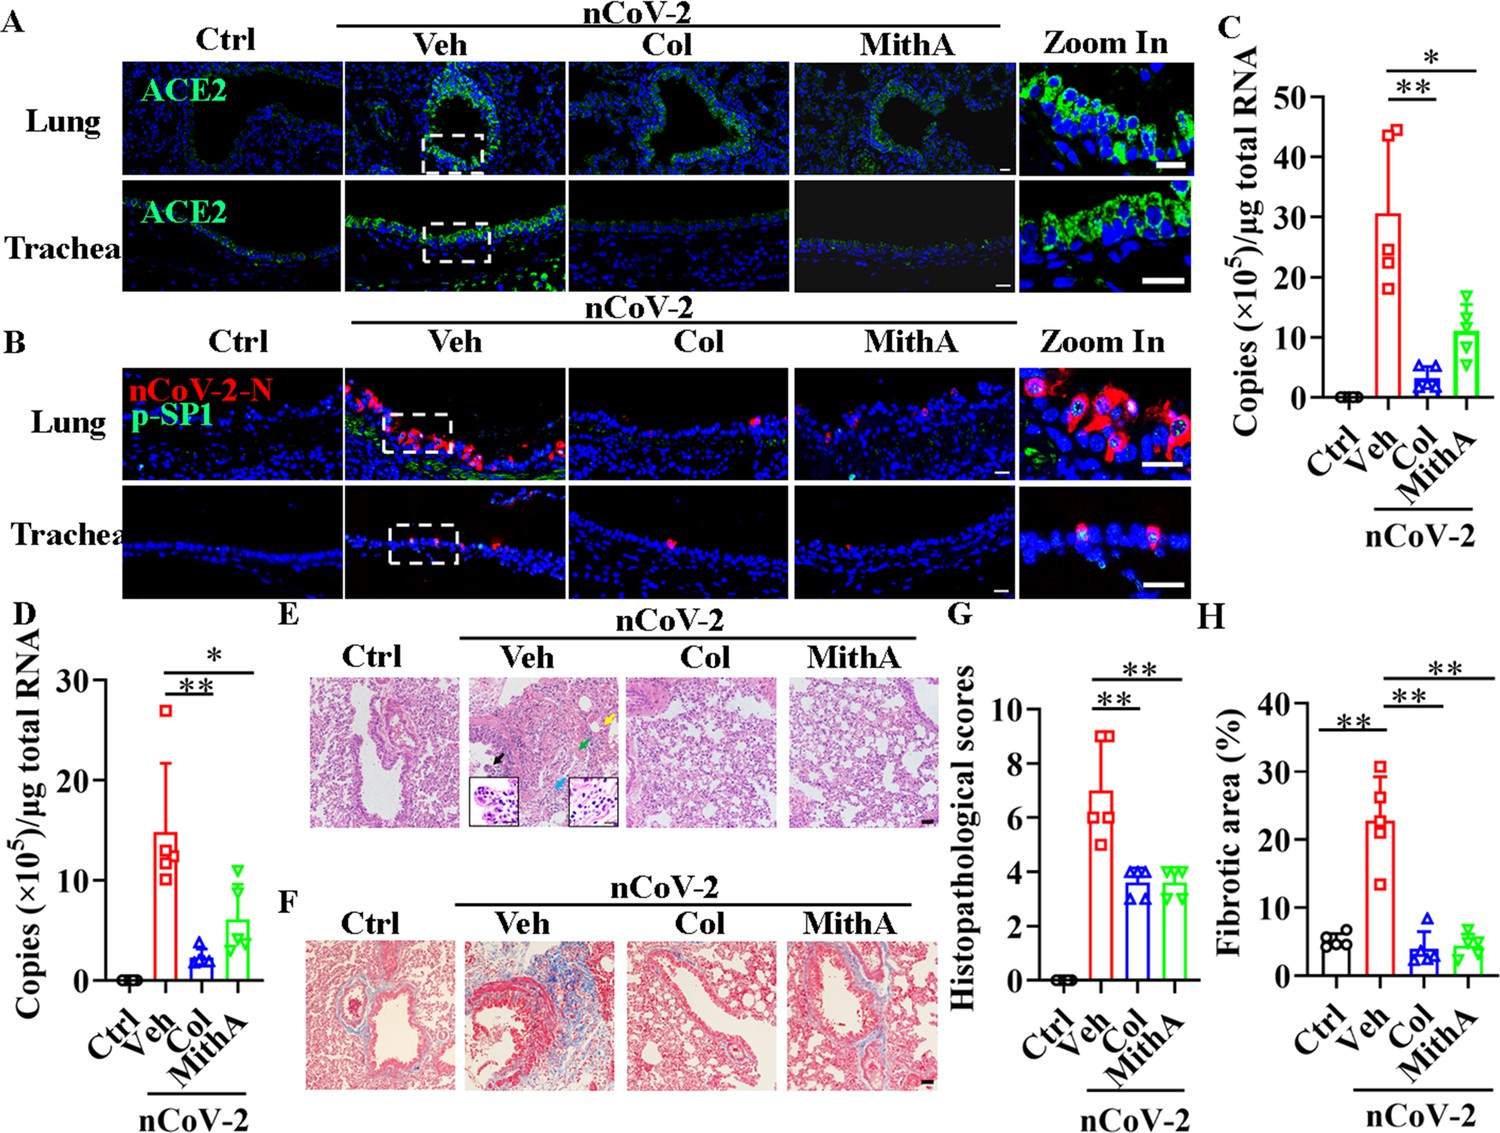
(A) Treatment with colchicine or MithA inhibited ACE2 expression in lung and trachea of hamsters infected with SARS-CoV-2. Representative images of immunofluorescence staining of ACE2 in lung and trachea of hamsters. Parts on right side are high-power images. Scale bar: 20 μm. (B) Treatment with colchicine or MithA inhibited replication of SARS-CoV-2 in lung and trachea of hamsters. Representative images of immunofluorescence staining of SARS-CoV-2-N and p-SP1 in lung and trachea of hamsters. Parts on right side are high-power images. Scale bar: 20 μm. Viral loads of SARS-CoV-2 were measured in lung (C) and trachea (D) of hamsters by RT-qPCR (n=5 each group). Error bars show means ± SD. *p<0.05, **p<0.01 (Student’s t-test). (E–H) Supplementation with colchicine or MithA attenuated histopathological damage in lung of hamsters infected with SARS-CoV-2. Representative images of H&E staining in lung of hamsters infected with SARS-CoV-2 at 3 dpi (E). Bronchial epithelial cell necrosis and pyknosis (black arrow), edema, loose arrangement of muscle fibers, and massive lymphocyte infiltration (blue arrow), extensive hemorrhage (green arrow), and alveolar wall thickening (yellow arrow). Parts on lower side are high-power images of black and blue arrows, respectively. Scale bar: 40 μm. Representative images of Masson staining in lung of hamsters infected with SARS-CoV-2 at 3 dpi (F). Scale bar: 40 μm. Summary of lung lesion scoring in different groups at 3 dpi (n=5 each group) (G). Error bars show means ± SD. **p<0.01 (Student’s t-test). Quantitative analysis of fibrotic area in lung tissues (H). Error bars show means ± SD. **p<0.01 (Student’s t-test). Ctrl, Control. Veh, Vehicle. Col, Colchicine. nCoV-2, SARS-CoV-2.
-
Figure 6—source data 1
Original file for determination of viral load in Figure 6C.
- https://cdn.elifesciences.org/articles/85985/elife-85985-fig6-data1-v1.zip
-
Figure 6—source data 2
Original file for determination of viral load in Figure 6D.
- https://cdn.elifesciences.org/articles/85985/elife-85985-fig6-data2-v1.zip
-
Figure 6—source data 3
Original file for lesion scores in Figure 6G.
- https://cdn.elifesciences.org/articles/85985/elife-85985-fig6-data3-v1.zip
-
Figure 6—source data 4
Original file for quantitative analysis of fibrotic area in Figure 6H.
- https://cdn.elifesciences.org/articles/85985/elife-85985-fig6-data4-v1.zip
Figure 6—figure supplement 1
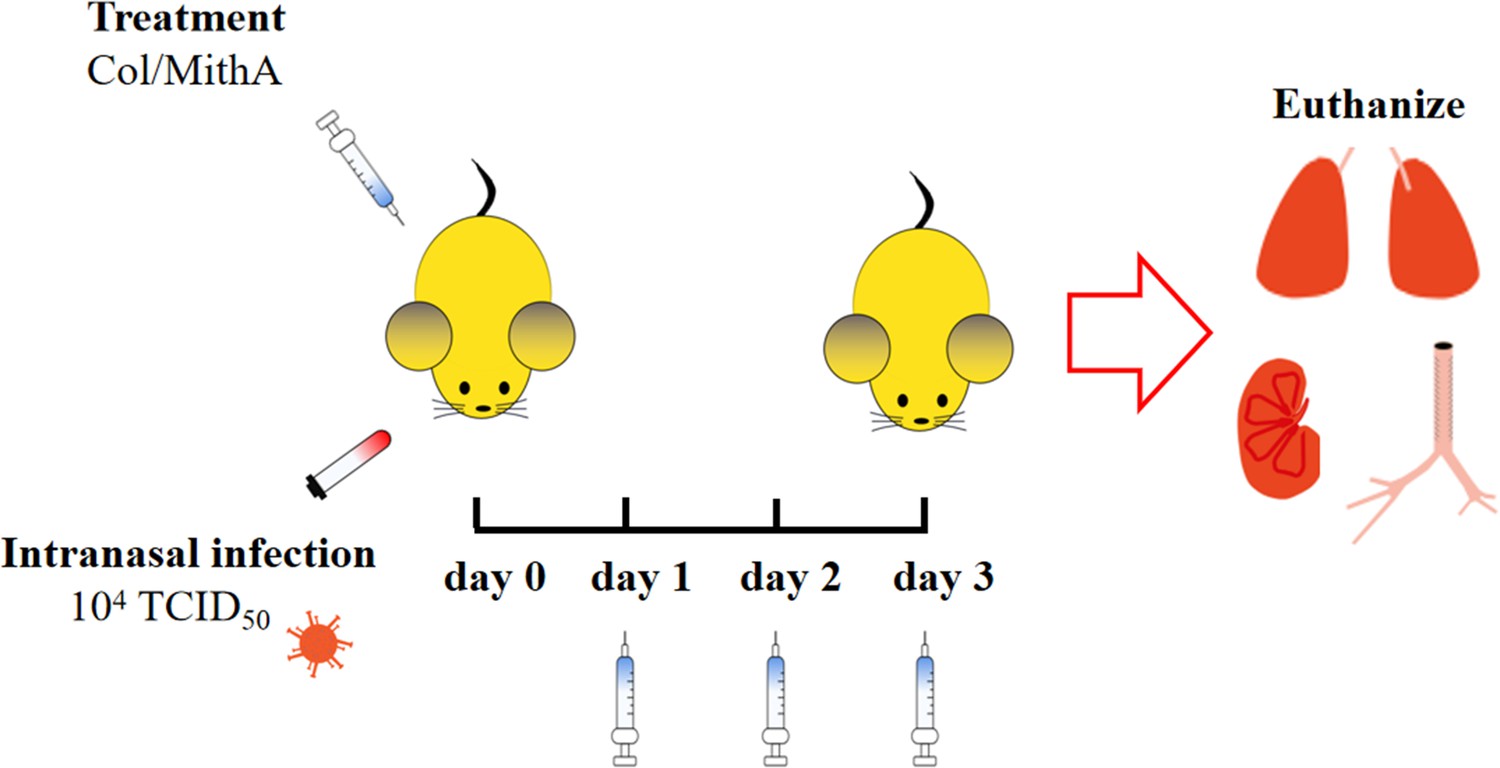
Schematic representation of experimental design for SARS-CoV-2 infection in Syrian hamsters.
On day 0 of SARS-CoV-2 infection in Syrian hamsters, colchicine and MithA were injected intraperitoneally at doses of 0.2 mg/kg/day. According to different groups, drugs were injected up to 3 dpi. Uninfected and placebo groups were given the same dose of vehicle daily. Five animals in each group were euthanized at 3 dpi.
Figure 6—figure supplement 2

Colchicine and MithA blocked replication of SARS-CoV-2 by inhibiting ACE2 expression in both lung and trachea of hamsters.
(A and B) Quantification of ACE2 fluorescence intensity in both lung (A) and trachea (B) of hamsters. Error bars show means ± SD. **p<0.01, ***p<0.001 (Student’s t-test). (C and D) Quantification of SARS-CoV-2-N fluorescence intensity in both lung (C) and trachea (D) of hamsters. Error bars show means ± SD. *p<0.05, **p<0.01, ***p<0.001 (Student’s t-test). Quantification of p-SP1 fluorescence intensity in both lung (E) and trachea (F) of hamsters. Error bars show means ± SD. *p<0.05, **p<0.01, ***p<0.001 (Student’s t-test). Ctrl, Control. Veh, Vehicle. Col, Colchicine. nCoV-2, SARS-CoV-2.
-
Figure 6—figure supplement 2—source data 1
Original file for quantification of ACE2 fluorescence intensity in Figure 6—figure supplement 2A, B.
- https://cdn.elifesciences.org/articles/85985/elife-85985-fig6-figsupp2-data1-v1.zip
-
Figure 6—figure supplement 2—source data 2
Original file for quantification of SARS-CoV-2-N fluorescence intensity in Figure 6—figure supplement 2C, D.
- https://cdn.elifesciences.org/articles/85985/elife-85985-fig6-figsupp2-data2-v1.zip
-
Figure 6—figure supplement 2—source data 3
Original file for quantification of p-SP1 fluorescence intensity in Figure 6—figure supplement 2E, F.
- https://cdn.elifesciences.org/articles/85985/elife-85985-fig6-figsupp2-data3-v1.zip
Figure 7
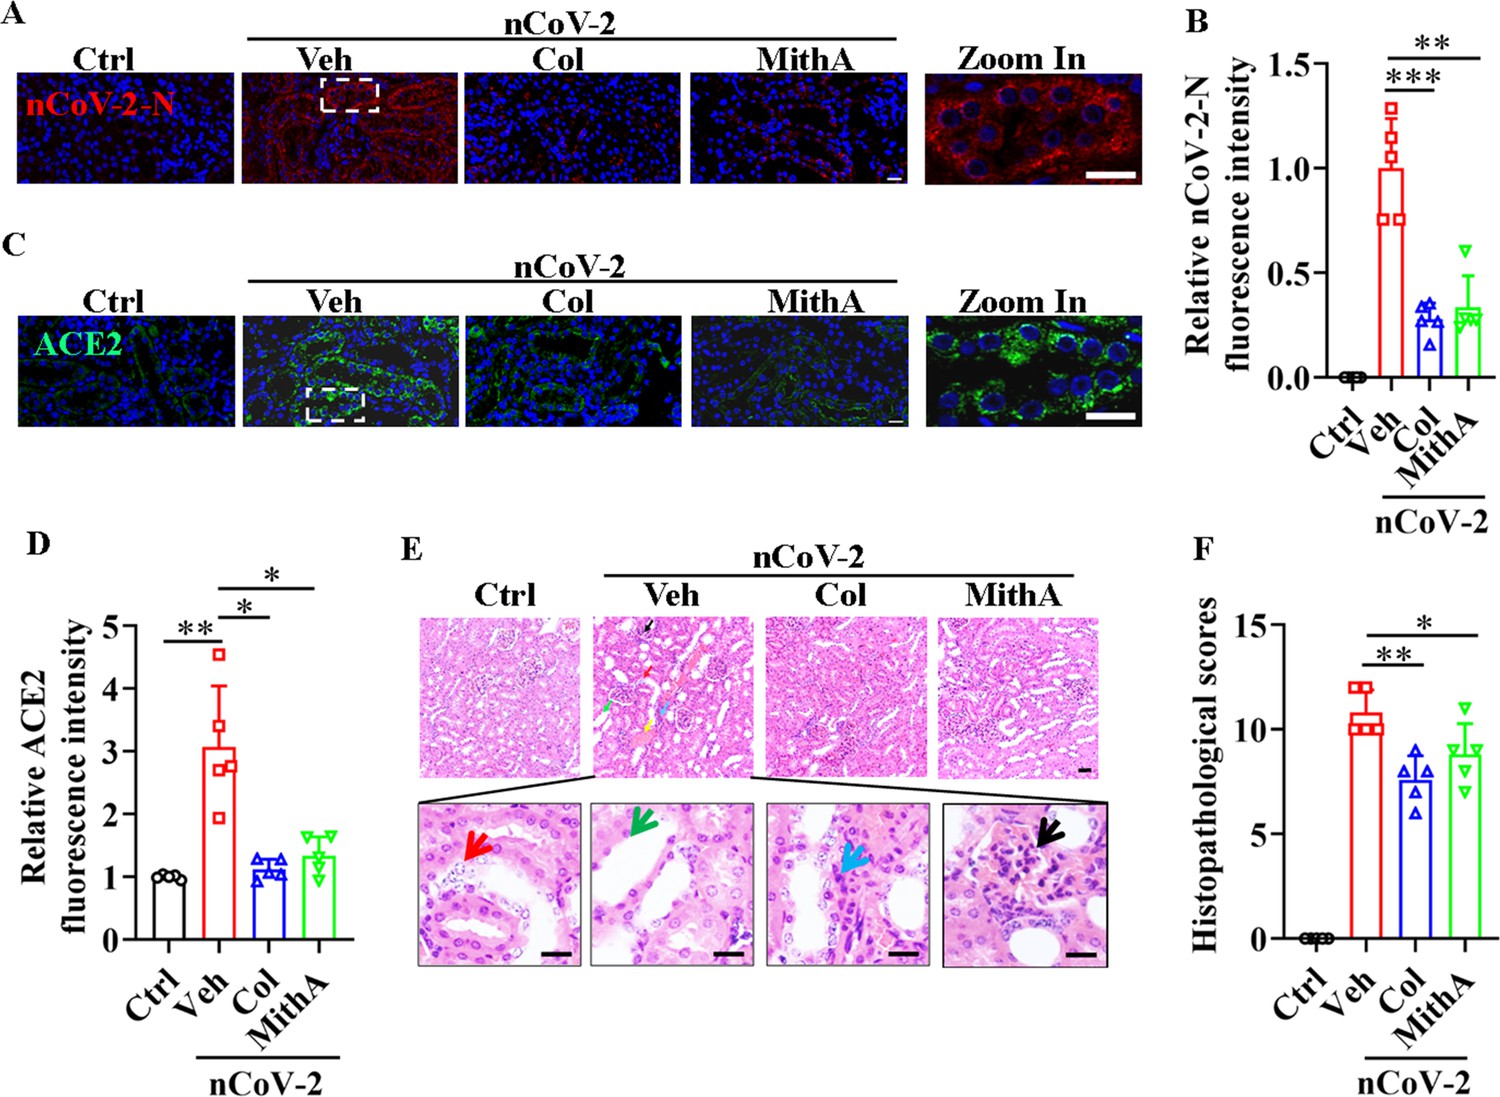
Inhibition of SP1 inhibited SARS-CoV-2 replication and reduced kidney pathology in Syrian hamsters.
(A and B) Treatment with colchicine or MithA inhibited SARS-CoV-2 replication in kidney of hamsters. Representative images of immunofluorescence staining of SARS-CoV-2-N in kidney of hamsters (A). Parts on right side are high-power images. Scale bar: 20 μm. Quantification of SARS-CoV-2-N fluorescence intensity in kidney of hamsters (B). Error bars show means ± SD. **p<0.01, ***p<0.001 (Student’s t-test). (C and D) Treatment with colchicine or MithA inhibited ACE2 expression in kidney of hamsters infected with SARS-CoV-2. Representative images of immunofluorescence staining of ACE2 in kidney of hamsters (C). Parts on right side are high-power images. Scale bar: 20 μm. Quantification of ACE2 fluorescence intensity in kidney of hamsters (D). Error bars show means ± SD. *p<0.05, **p<0.01 (Student’s t-test). (E and F) Supplementation with colchicine or MithA attenuated histopathological damage in kidney of hamsters infected with SARS-CoV-2. Representative images of H&E staining in kidney of hamsters infected with SARS-CoV-2 at 3 dpi (E). Histopathology of kidney showed renal interstitial vascular congestion (black arrow), renal tubular epithelial cell nuclear pyknosis (red arrow), brush border disappearance (green arrow), renal interstitial inflammatory cell infiltration (blue arrow), and glomerular atrophy (yellow arrow). Parts on lower side are high-power images of red, green, and blue arrows, respectively. Scale bar: 40 μm. Summary of kidney lesion scoring in different groups at 3 dpi (n=5 each group) (F). Error bars show means ± SD. *p<0.05, **p<0.01 (Student’s t-test). Ctrl, Control. Veh, Vehicle. Col, Colchicine. nCoV-2, SARS-CoV-2.
-
Figure 7—source data 1
Original file for quantification of SARS-CoV-2-N fluorescence intensity in Figure 7B.
- https://cdn.elifesciences.org/articles/85985/elife-85985-fig7-data1-v1.zip
-
Figure 7—source data 2
Original file for quantification of ACE2 fluorescence intensity in Figure 7D.
- https://cdn.elifesciences.org/articles/85985/elife-85985-fig7-data2-v1.zip
-
Figure 7—source data 3
Original file for lesion scores in Figure 7F.
- https://cdn.elifesciences.org/articles/85985/elife-85985-fig7-data3-v1.zip
Author response image 1

Representative images of immunofluorescence staining for p-SP1 and SARS-CoV-2.
SARS-CoV-2 significantly increased the levels of p-SP1 in infected HPAEpiCs, whereas the p-SP1 levels were unchanged in non-infected cells. Veh, Vehicle. Col, Colchicine. nCoV-2, SARS-CoV-2. Scale bar: 10 μm.
Author response image 2

The PI3K/AKT pathway regulates the expression of ACE2 through SP1.
(A and B) HPAEpiCs were treated with LY294002 (30 μM), wortmannin (50 nM), siSP1, siSP1 + LY294002 or siSP1 + wortmannin, respectively. Either knockdown of SP1 or inhibition of PI3K significantly suppressed the levels of ACE2 in HPAEpiCs. The blot is typical of three independent experiments (A). Quantification the ratio of ACE2 to Actin (B). These results are means ± SD of three independent experiments. ns, not significant, *P < 0.05. (C and D) SP1 overexpression rescued the expression of ACE2 in PI3K inhibitor-treated cells. The blot is typical of three independent experiments (C). Quantification the ratio of ACE2 to Actin (D). These results are means ± SD of three independent experiments. *P < 0.05. (E) Representative images of immunofluorescence staining for ACE2. Scale bar: 10 μm. (F) Quantification of ACE2 fluorescence intensity. These results are means ± SD of three independent experiments. *P < 0.05, **P < 0.01, ***P < 0.001, ns, not significant. NC, Negative Control. LY, LY294002. Wort, wortmannin.
Additional files
Download links
A two-part list of links to download the article, or parts of the article, in various formats.
Downloads (link to download the article as PDF)
Open citations (links to open the citations from this article in various online reference manager services)
Cite this article (links to download the citations from this article in formats compatible with various reference manager tools)
Transcriptional regulation of SARS-CoV-2 receptor ACE2 by SP1
eLife 13:e85985.
https://doi.org/10.7554/eLife.85985


