Comprehensive characterization of tumor microenvironment in colorectal cancer via molecular analysis
- Department of Pathology, Nanfang Hospital/School of Basic Medical Sciences, Southern Medical University, China
- Department of Pathology and Guangdong Province Key Laboratory of Molecular Tumor Pathology, School of Basic Medical Sciences, Southern Medical University, China
- Department of Pathology, The First Affiliated Hospital of USTC, Division of Life Sciences and Medicine, University of Science and Technology of China, China
- Nanjing Simcere Medical Laboratory Science Co., Ltd, China
- State Key Laboratory of Translational Medicine and Innovative Drug Development, Jiangsu Simcere Diagnostics Co., Ltd, China
- Jinfeng Laboratory, China
Figures
Figure 1 with 7 supplements
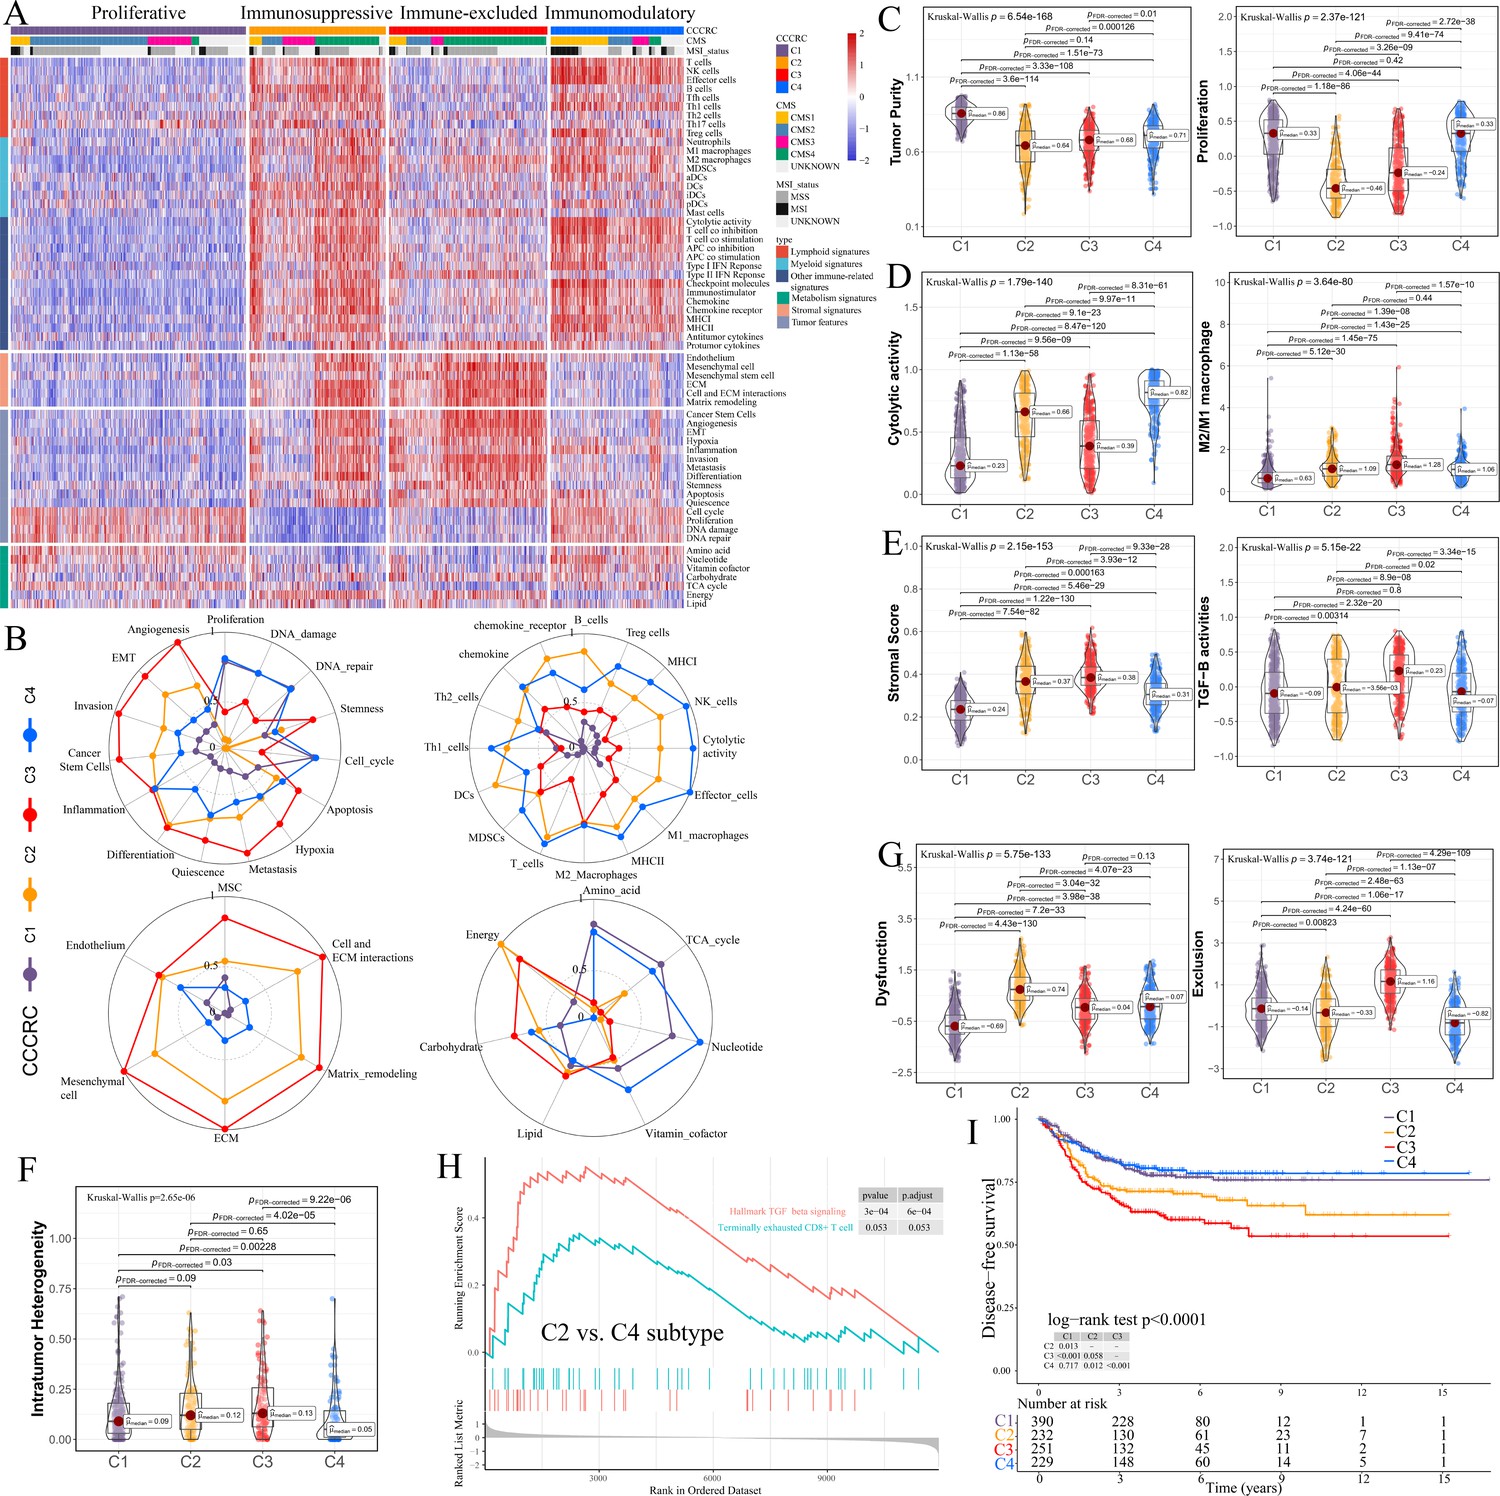
Comprehensive characterization of colorectal cancer (CCCRC).
(A) Heatmap of 1471 colorectal cancer (CRC) patients in the CRC-AFFY cohort classified into four distinct tumor microenvironment (TME) subtypes based on the 61 TME-related signatures. CMS: consensus molecular subtypes; MSI: microsatellite instability; MSS: microsatellite stability. (B) Radars display the characteristic TME-related signatures, including tumor, immune, stroma, and metabolism signatures, of each CCCRC subtype in the CRC-AFFY cohort. MSC: mesenchymal stem cells; ECM: extracellular rmatrix. Box plots show differences in tumor (C), immune (D), and stroma (E) signatures in the CRC-AFFY cohort. Tumor purity and stroma scores were obtained from the ESTIMATE algorithm. Proliferative activity (proliferation), cytolytic score, M1 and M2 macrophage proportions, and TGFB activity were calculated by Gene set variation analysis (GSVA). (F) Differences in intratumor heterogeneity between four CCCRC subtypes in CRC-RNAseq cohort. (G) Differences in T cell dysfunction and T cell exclusion scores between four CCCRC subtypes were analyzed based on the gene expression profiles in CRC-AFFY cohort. (H) Gene set enrichment analysis (GSEA) of the terminally exhausted CD8+ T cell signature and the TGF-beta signaling signature between C2 and C4 subtypes in the CRC-AFFY cohort. (I) Kaplan–Meier method with log-rank test of disease-free survival among the four CCCRC subtypes in the CRC-AFFY cohort.
Figure 1—figure supplement 1
Establishment of tumor microenvironment (TME) panel.
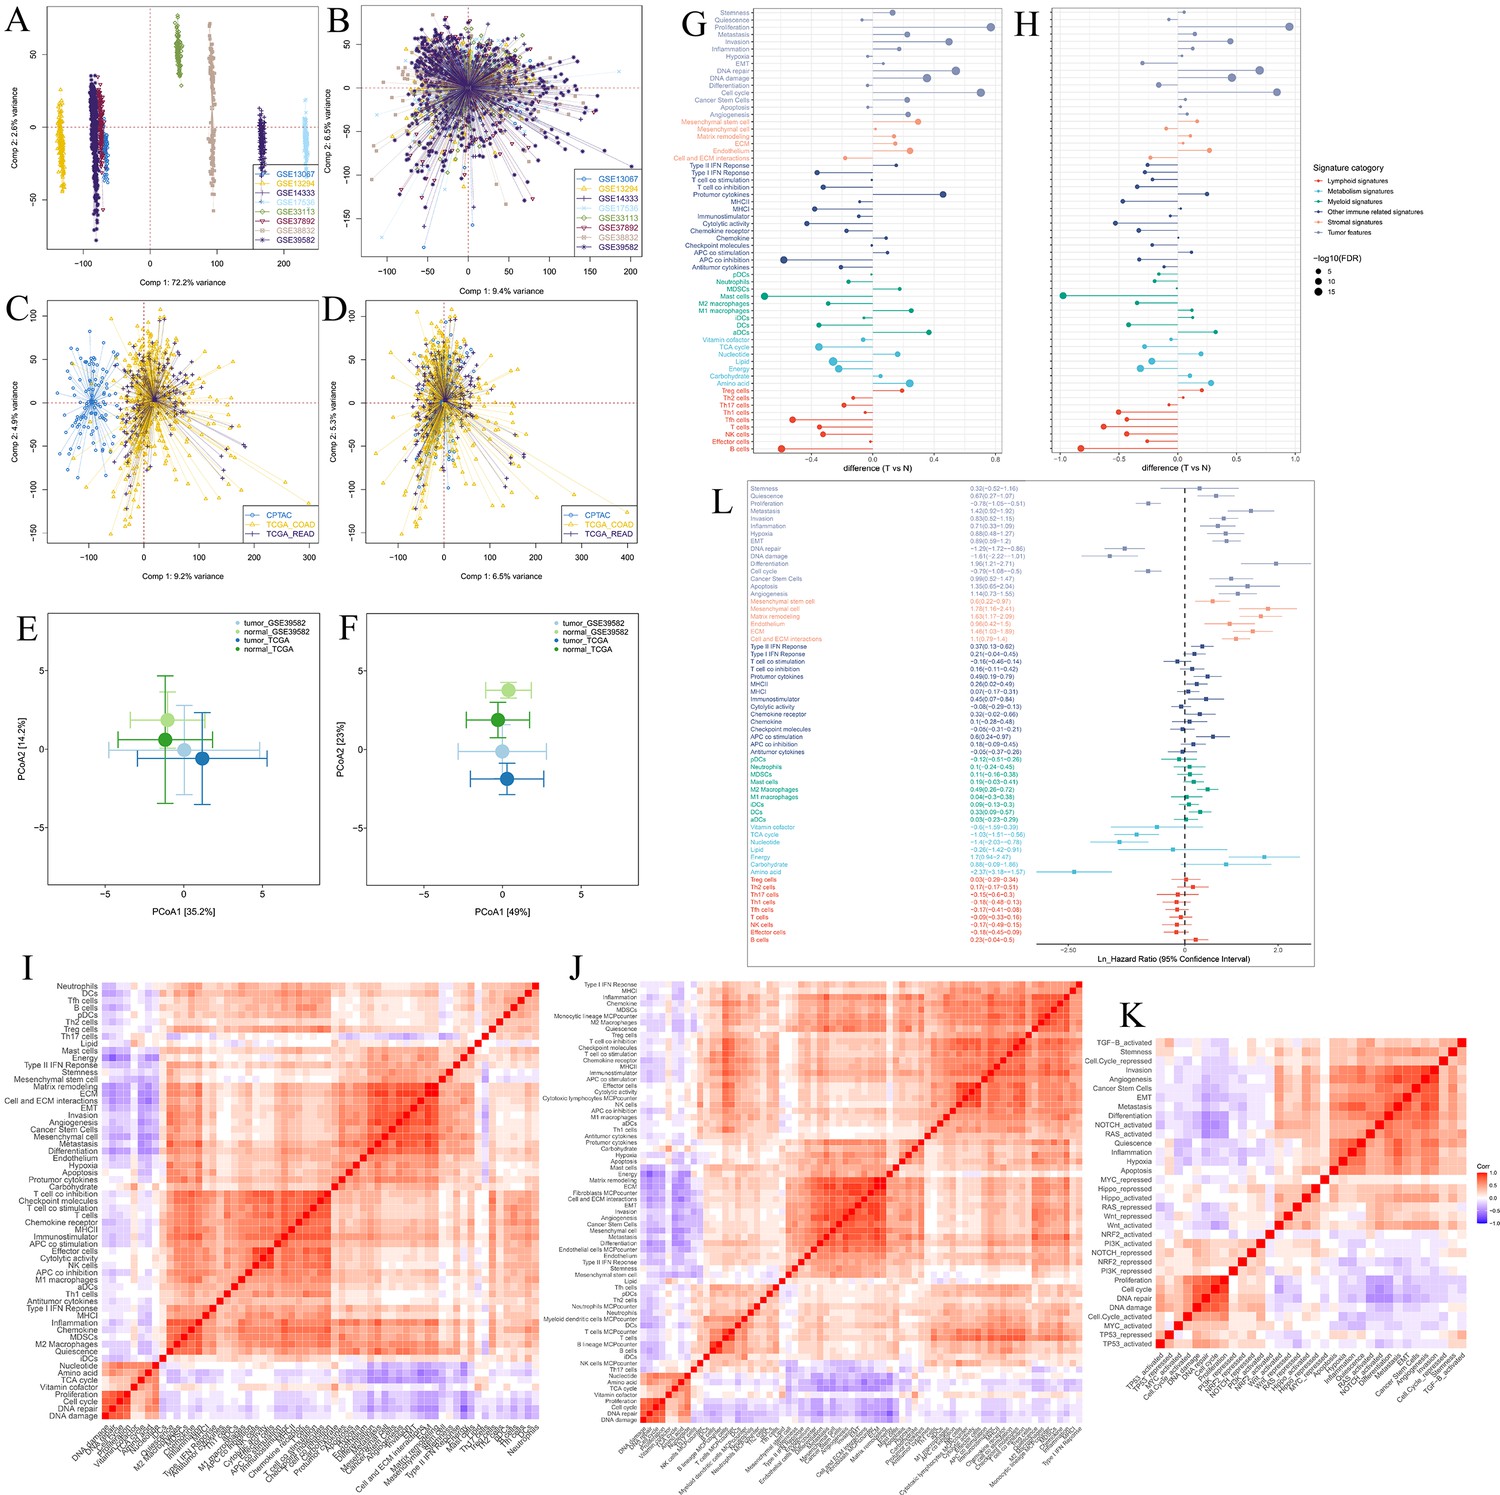
Principal component analysis (PCA) shows the batch effects of the eight microarray datasets before (A) and after (B) the removal of batch effects using the ‘ComBat’ function. PCA shows the batch effects of the two RNA sequencing datasets before (C) and after (D) the removal of batch effects using the ‘ComBat’ function. Principal coordinate analysis (PCOA) shows that the colorectal cancer samples could be distinguished from the normal samples by the TME-related signatures (E), and the signatures of the functional states of tumor cells and cancer stem cells (F) in the GSE39582 and TCGA cohorts. Difference analysis of TME signature scores between tumor (T) and normal (N) tissues in the GSE39582 cohort (G) and the TCGA cohort (H). (I) Spearman’s correlation analysis of the TME-related signatures shows three major patterns bound by positive correlations in the CRC-AFFY cohort. (J) Heatmap of Spearman’s correlation analysis of the 61 TME-related signatures and the other TME-related signatures quantified by the microenvironment cell populations (MCP)-counter algorithm in the CRC-AFFY cohort. (K) Heatmap of Spearman’s correlation analysis of the functional states of tumor cells and the 10 classical oncogenic pathways in the CRC-AFFY cohort. (L) Univariate cox analysis shows the ability of each TME signature to predict disease-free survival in the CRC-AFFY cohort.
Figure 1—figure supplement 2
Comprehensive characterization of colorectal cancer (CCCRC).
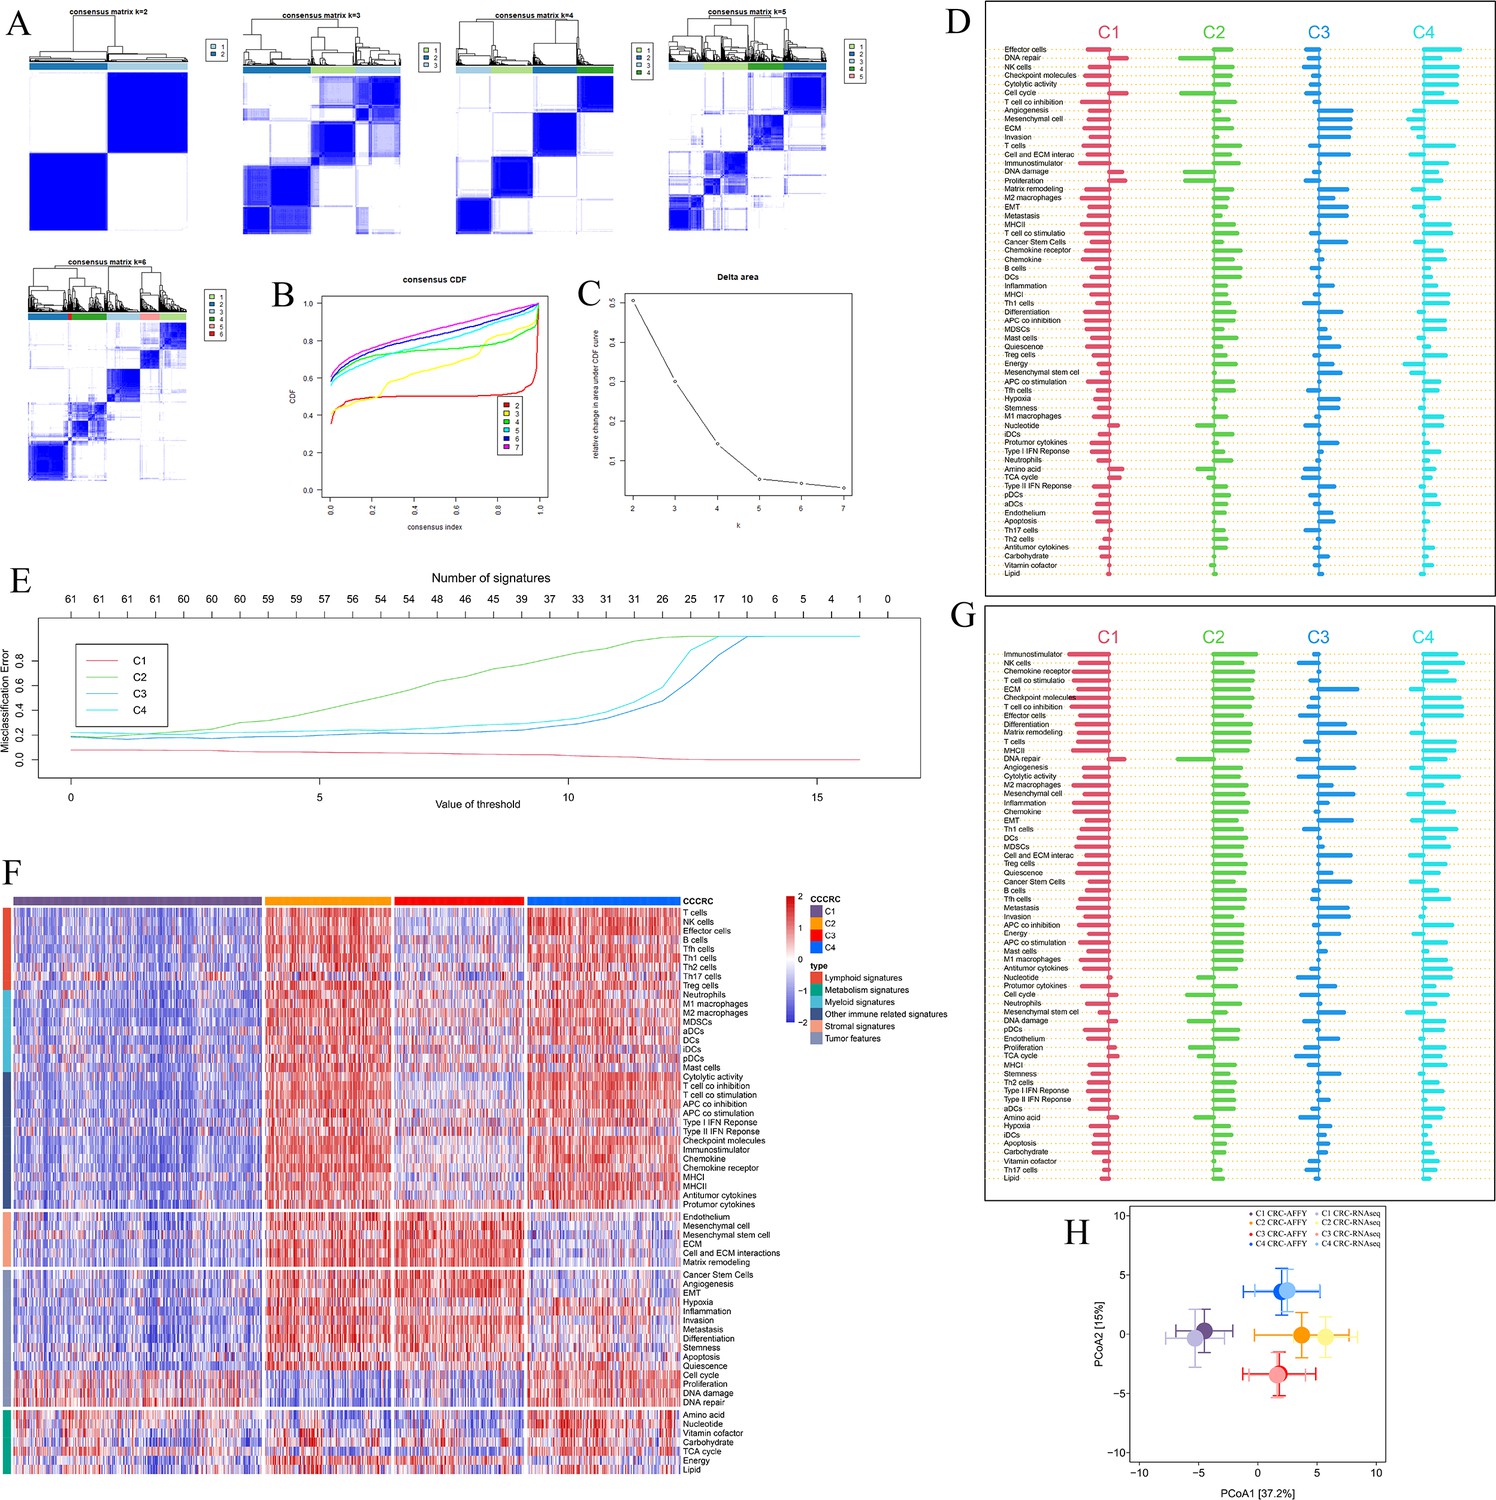
(A) Consensus matrices heatmap (k = 2–6). At k = 4, the consensus matrices heatmap displays a distinct distribution of items with high intra-cluster consensus and low inter-cluster consensus. (B) Empirical cumulative distribution function (CDF) plot. The CDF plot showes that k = 4 yields the maximum consensus distribution. (C) Delta area plot. The Delta area plot showes that k = 4 is the most significant k with a noticeable increase in consensus. (D) Shrunken differences d′ik for the 61 tumor microenvironment (TME)-related signatures having at least one nonzero difference in the CRC-AFFY cohort. (E) CCCRC classification: training errors are shown as a function of the threshold parameter. The threshold value of 0.566 was chosen and yielded a subset of 61 TME-related signatures. (F) Heatmap of 725 colorectal cancer (CRC) patients in the CRC-RNAseq cohort classified into four distinct TME subtypes based on the 61 TME-related signatures. (G) Shrunken differences d′ik for the 61 TME-related signatures having at least one nonzero difference in the CRC-RNAseq cohort. (H) Principal coordinate analysis of ‘Euclidean’ distances calculated using the scores of 61 TME-related signatures in the CRC-AFFY (dark colors) and CRC-RNAseq (light colors) cohorts. Circles and error bars represent the mean and the standard errors of the mean, respectively.
Figure 1—figure supplement 3
Differences in the tumor microenvironment (TME) components obtained from other algorithm among the comprehensive characterization of colorectal cancer (CCCRC) subtypes.
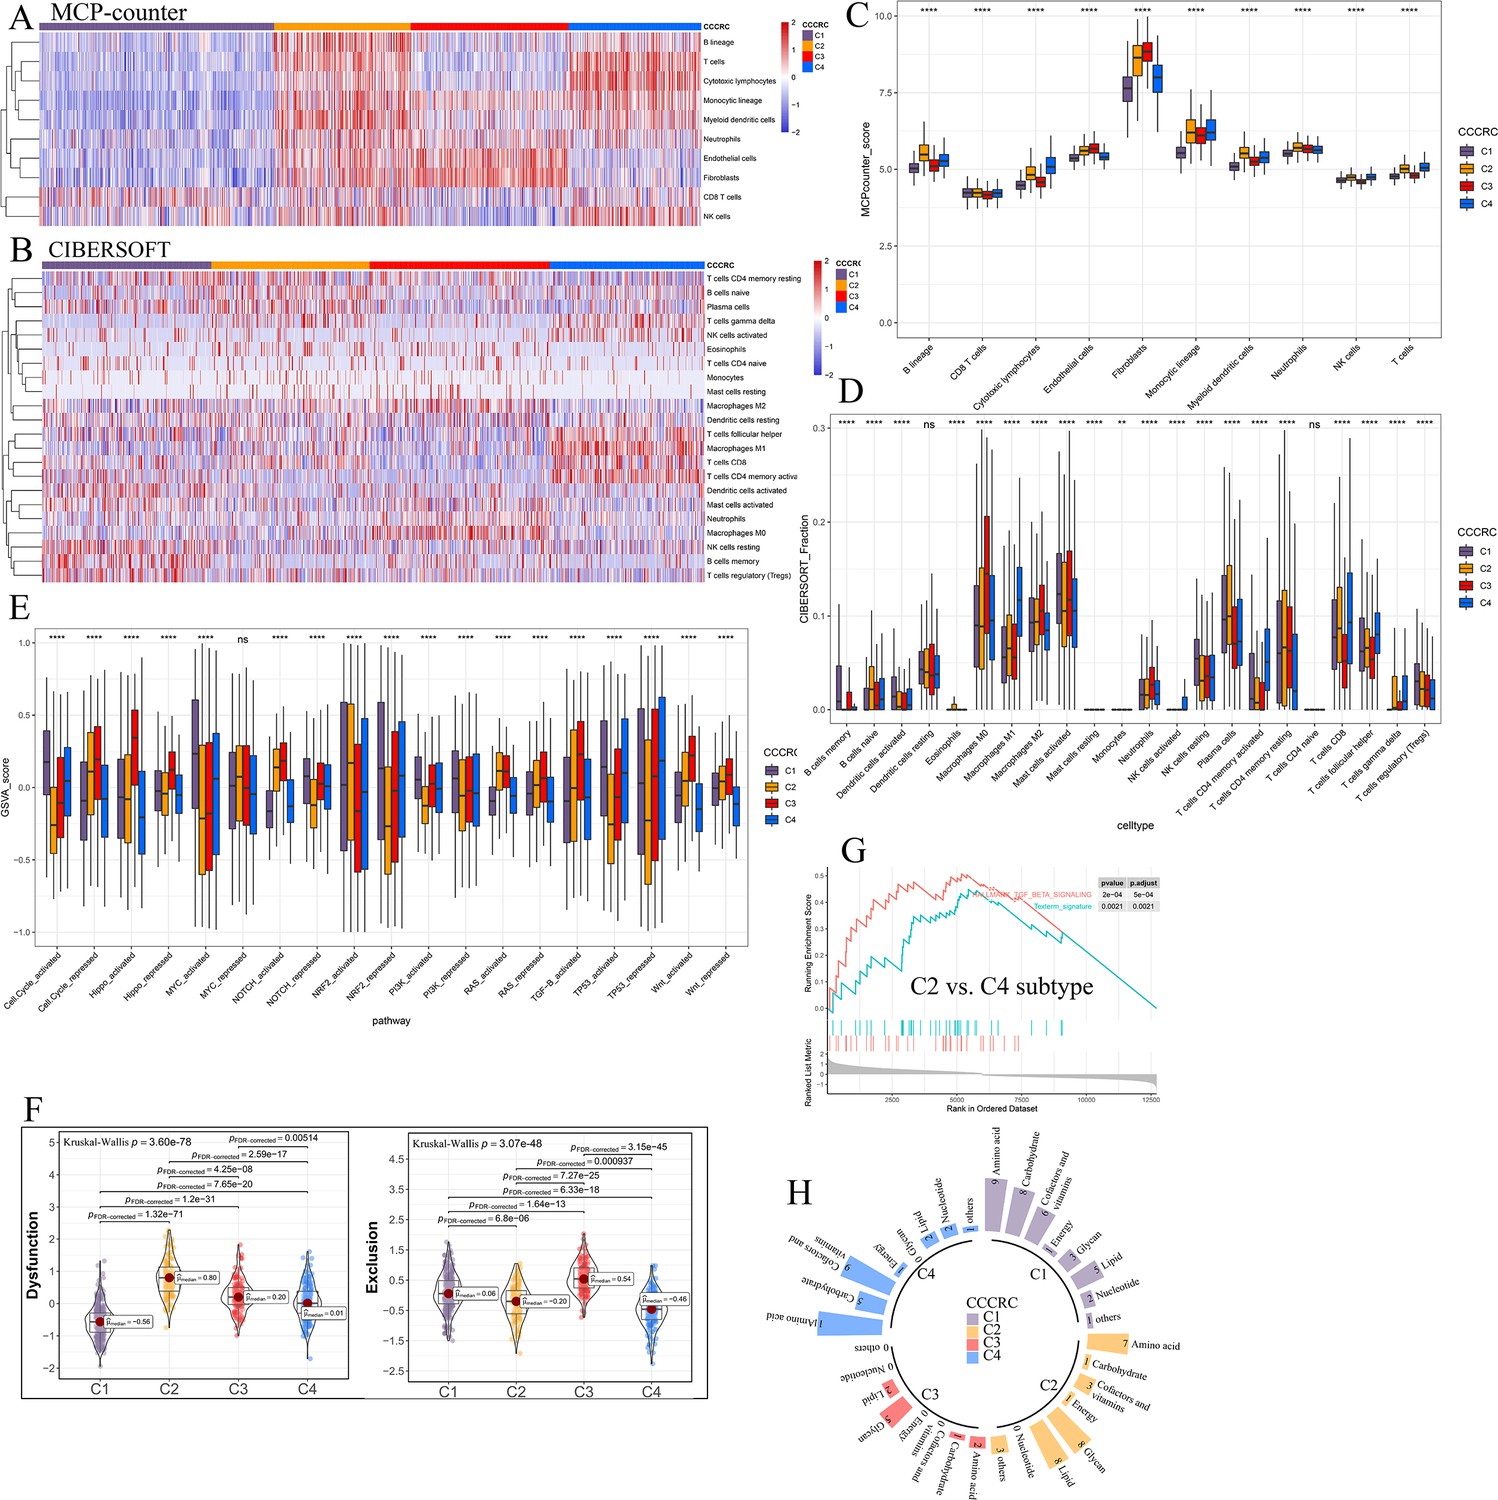
Heatmap of the TME-related signature scores derived from the microenvironment cell populations (MCP)-counter (A) and CIBERSORT (B) algorithm. Box plots show differences in the TME-related signature scores derived from the MCP-counter (C), CIBERSORT (D), and the Gene set variation analysis (GSVA) (E) algorithm among the CCCRC subtypes. (F) Differences in T cell dysfunction and T cell exclusion scores between four CCCRC subtypes analyzed in CRC-RNAseq cohort. (G) Gene set enrichment analysis (GSEA) of the terminally exhausted CD8+ T cell signature (Texterm signature) and the TGFB signaling signature between C2 and C4 subtypes in the CRC-RNAseq cohort. (H) Circle bars display significant differences in metabolic reprogramming among the four CCCRC subtypes. *p-value <0.05; **p-value <0.01; ***p-value <0.001; ****p-value <0.0001; NS, p-value >0.05.
Figure 1—figure supplement 4
Limiting the consensus clustering analysis to only immune-related or immune- and stroma-related signatures in the CRC-AFFY cohort.
(A–C) Heatmap of 1471 colorectal cancer (CRC) patients in the CRC-RNAseq cohort classified into three distinct tumor microenvironment (TME) subtypes based on the immune-related signatures (A): low (B cluster), moderate (C cluster), and high (A cluster) immune infiltration subtypes. Kaplan–Meier method with log-rank test of disease-free survival (B) and overall survival (C) among the three subtypes. (D–F) Heatmap of 1471 CRC patients in the CRC-RNAseq cohort classified into three distinct TME subtypes based on the immune- and stroma-related signatures (D): immunomodulatory (S1), cold (S2/S3), and immune-excluded (S4) subtypes. Kaplan–Meier method with log-rank test of disease-free survival (E) and overall survival (F) among the three subtypes.
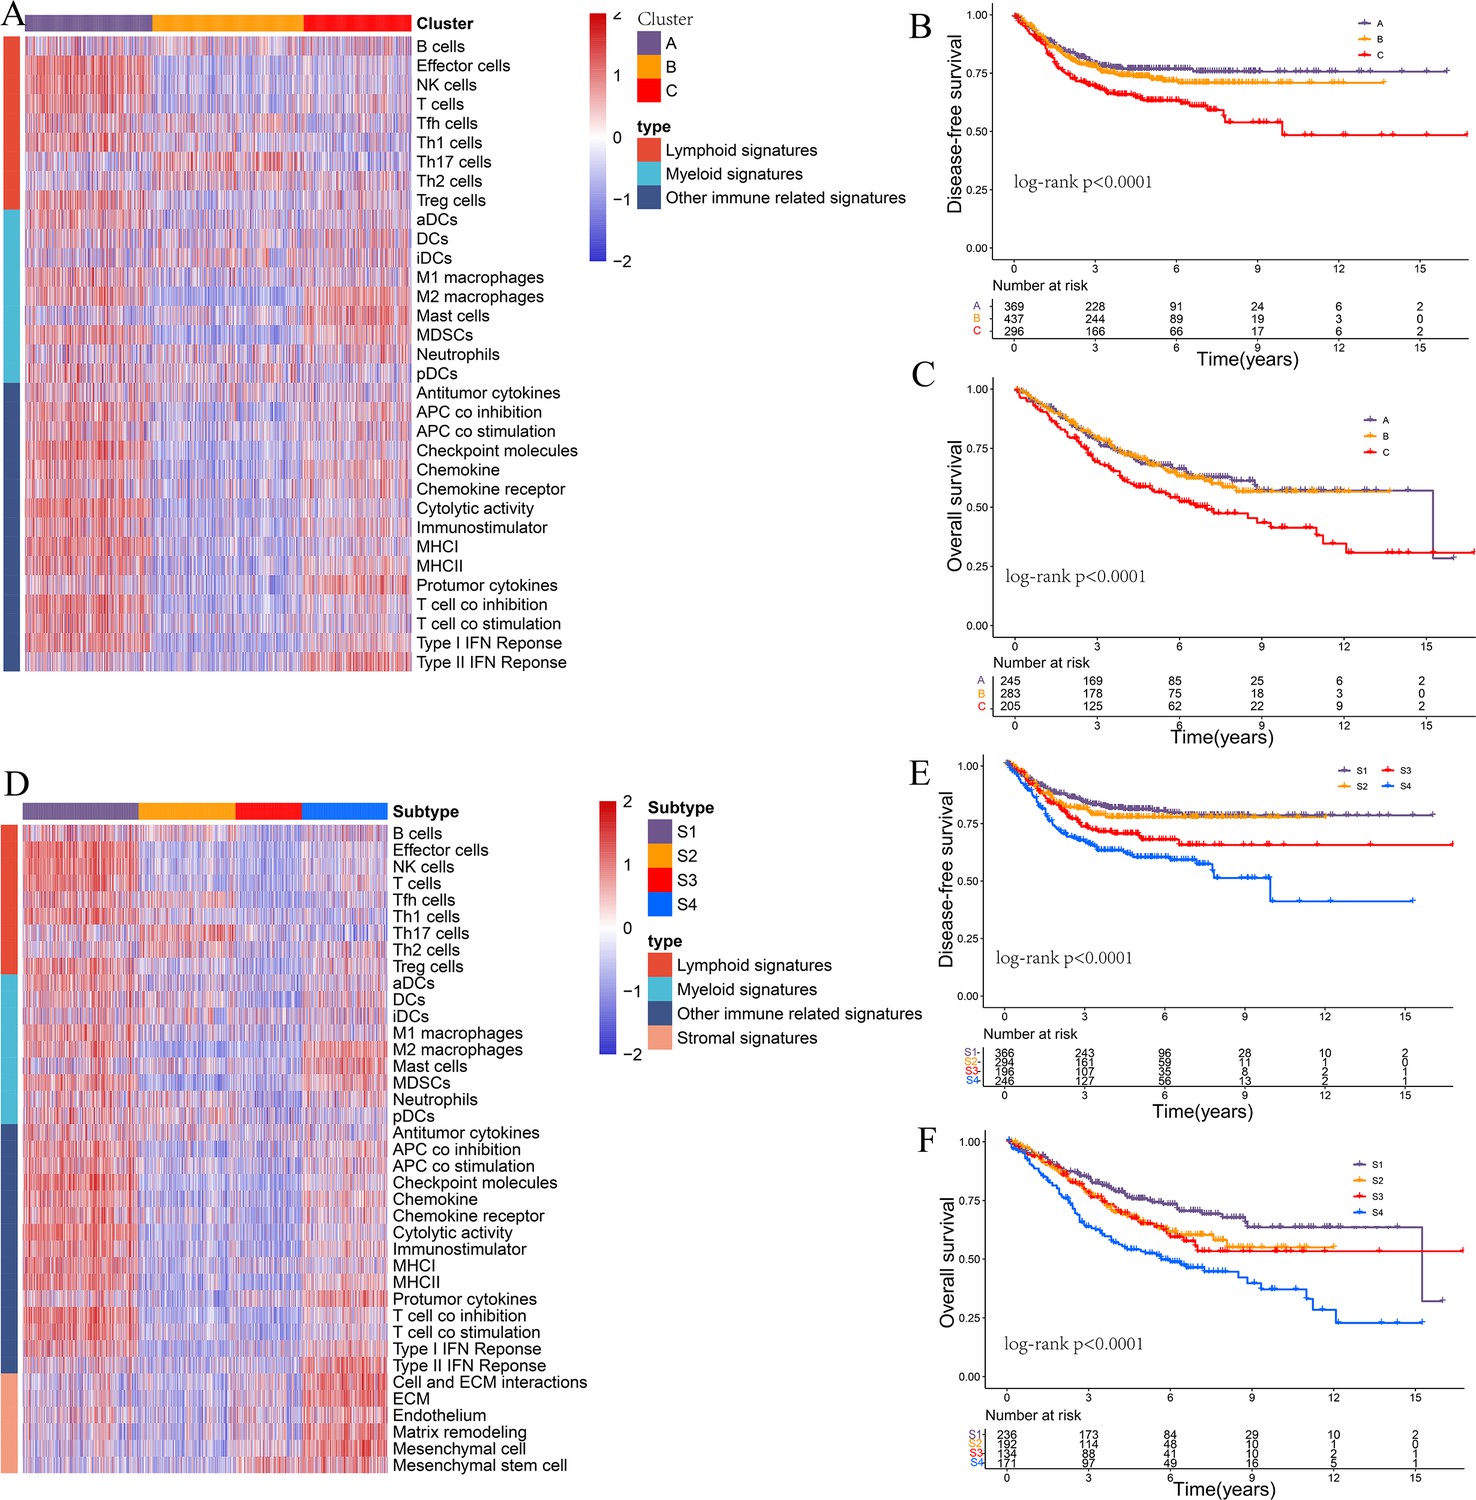
Figure 1—figure supplement 5
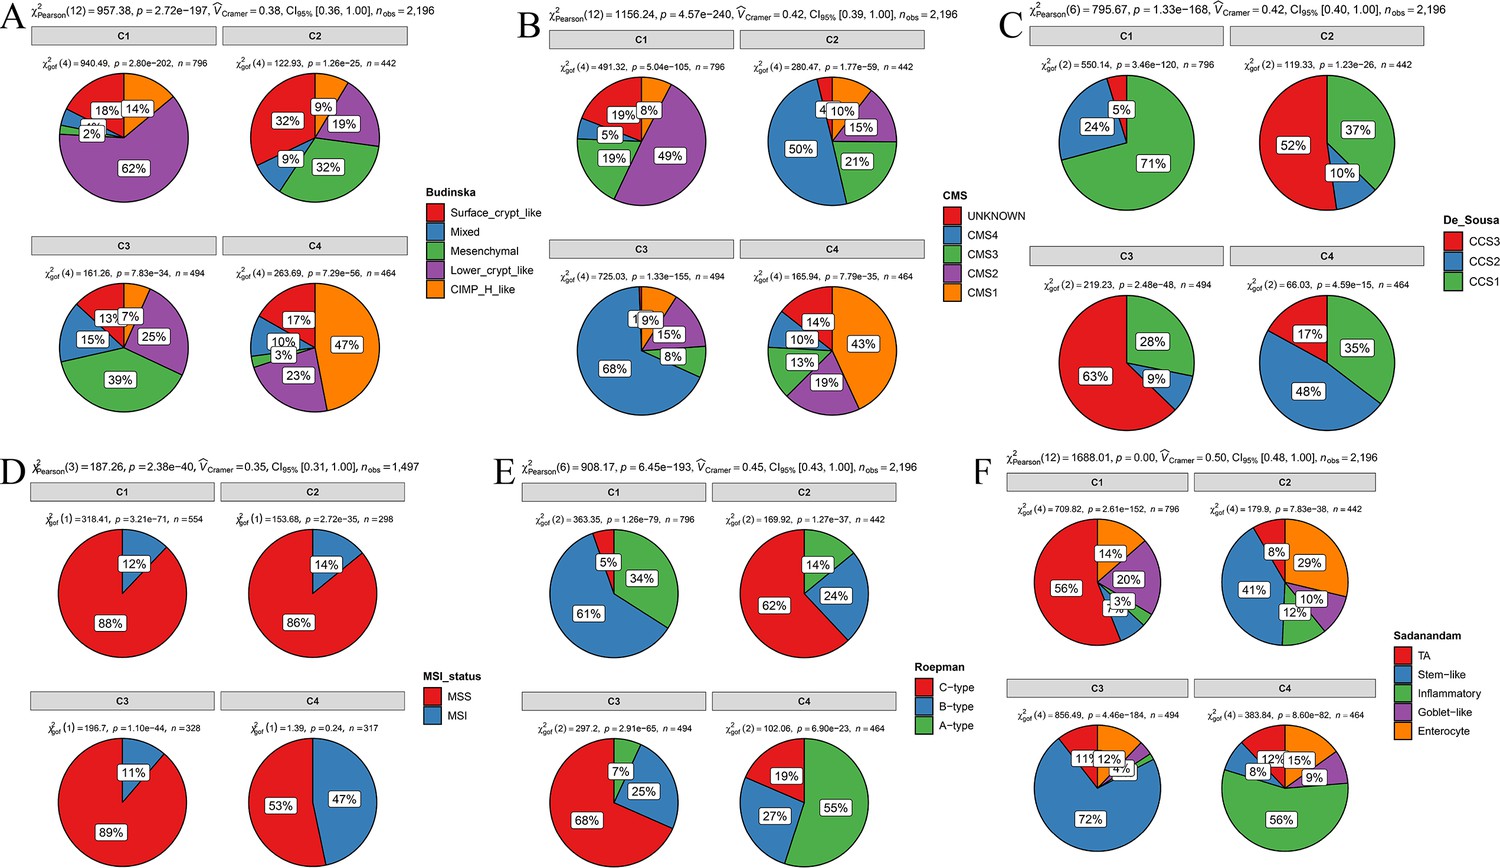
Overlap of the comprehensive characterization of colorectal cancer (CCCRC) subtypes with published colorectal cancer (CRC) molecular subtypes in the CRC-AFFY and CRC-RNAseq cohorts.
(A) Budinska classification system. (B) Consensus molecular subtypes (CMS). (C) De Sousa classification system. (D) Microsatellite instability (MSI) status. MSI: microsatellite instability; MSS: microsatellite stability. (E) Roepman classification system. (F) Sadanandam classification system.
Figure 1—figure supplement 6
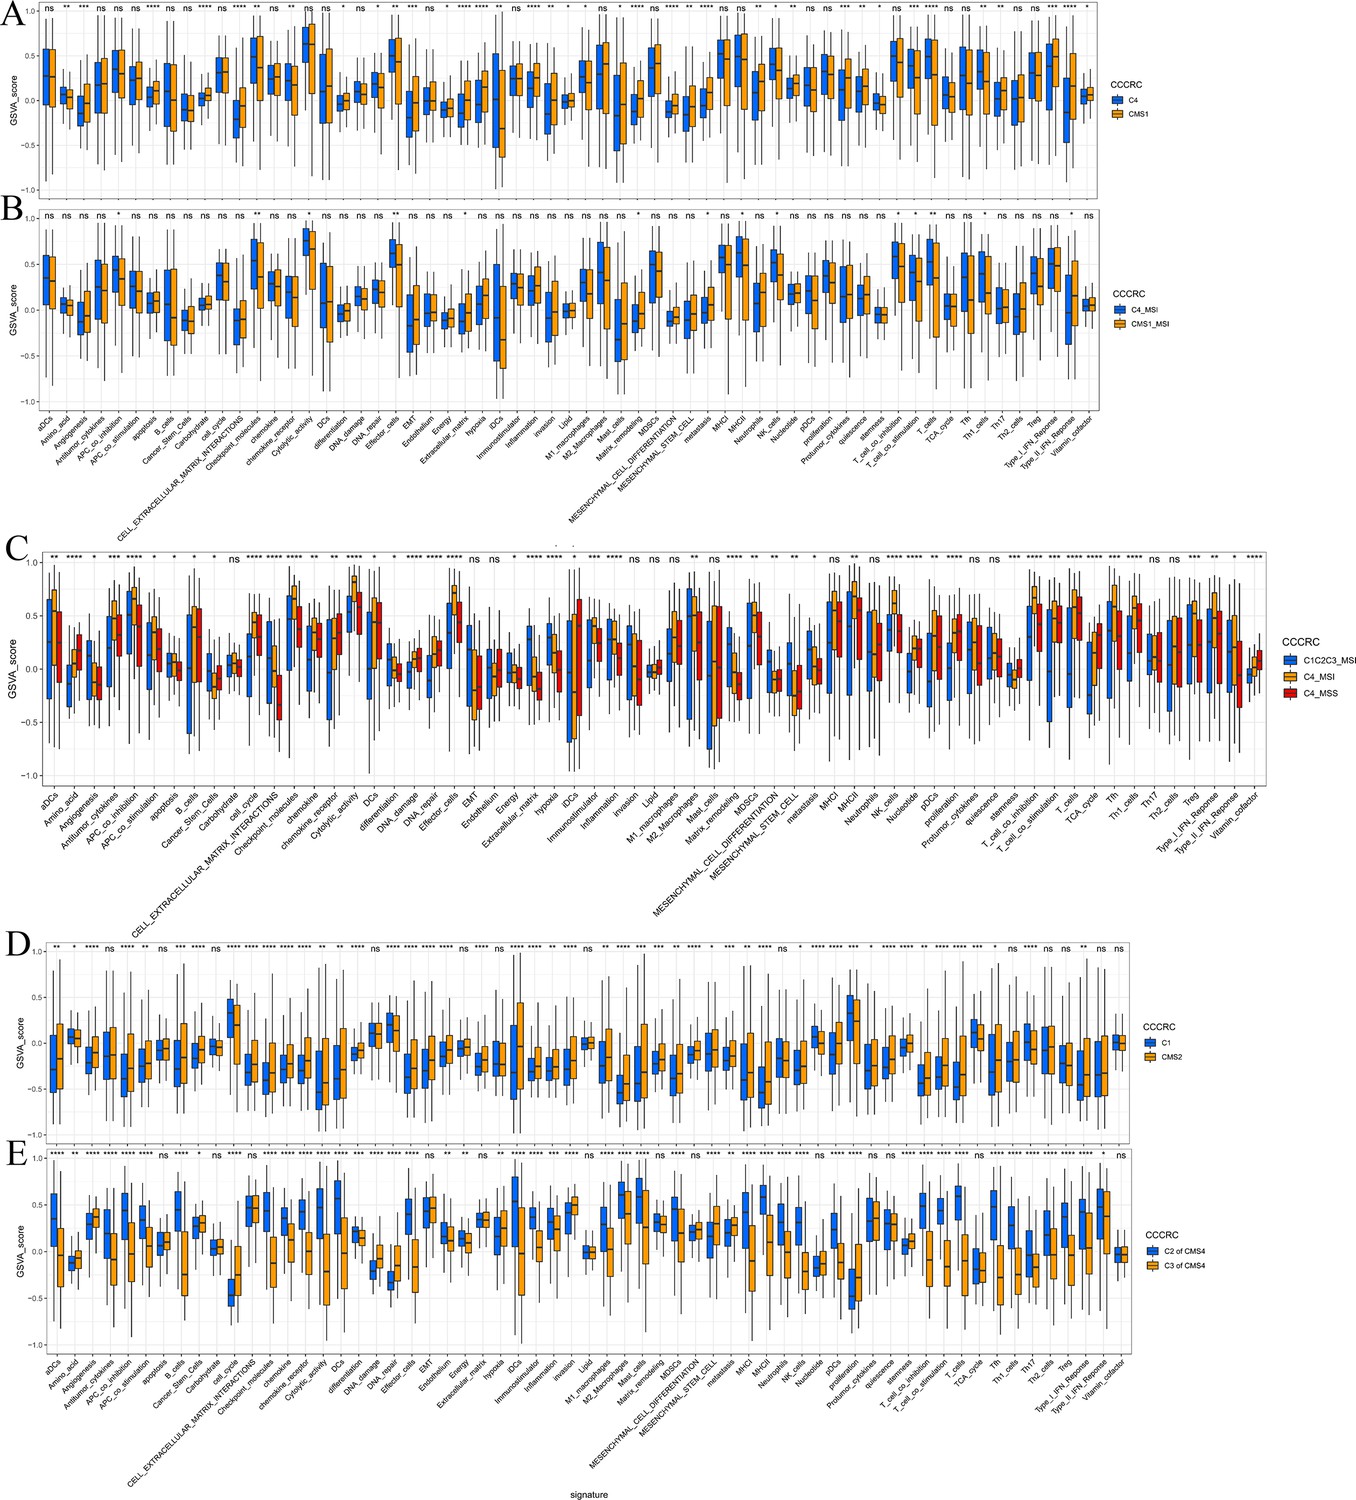
Associations between comprehensive characterization of colorectal cancer (CCCRC) subtypes and consensus molecular subtypes (CMS).
Box plots show differences in the tumor microenvironment (TME)-related signature scores between the C4 and CMS1 subtypes (A), between the C4 subtype with MSI and the CMS1 subtype with MSI (B), between the C4 subtype with MSI, the C4 subtype with MSS, and the other CCCRC subtypes with MSI (C), between the C1 and CMS2 subtypes (D), and between the C2 subtypes within CMS4 and the C3 subtypes within CMS4 (E). MSI: microsatellite instability; MSS: microsatellite stability. *p-value <0.05; **p-value <0.01; ***p-value <0.001; ****p-value <0.0001.
Figure 1—figure supplement 7
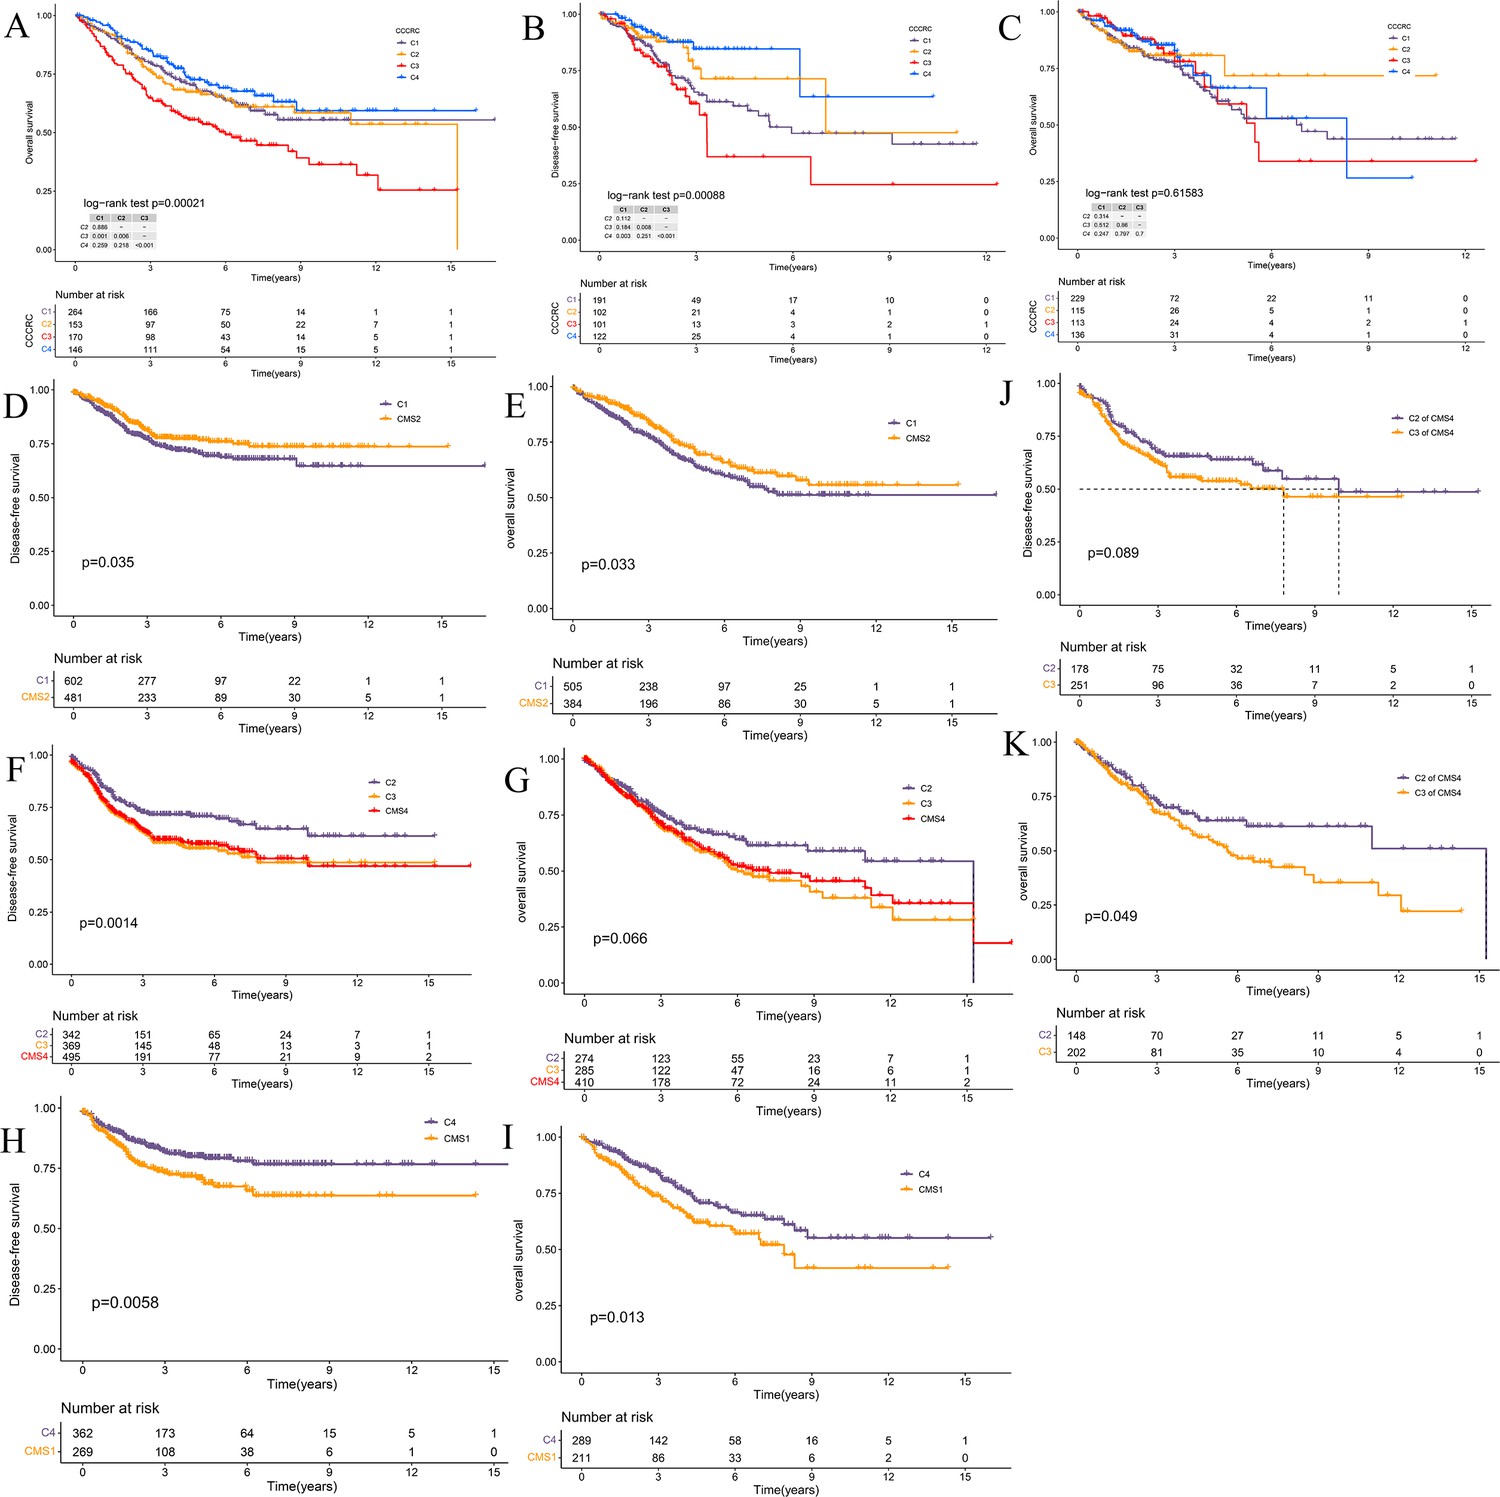
Survival analyses of the comprehensive characterization of colorectal cancer (CCCRC) subtypes and consensus molecular subtypes (CMS).
(A) Kaplan–Meier method with log-rank test of overall survival (OS) among the four CCCRC subtypes in the CRC-AFFY cohort. Kaplan–Meier method with log-rank test of disease-free survival (DFS) (B) and OS (C) among the four CCCRC subtypes in the CRC-RNAseq cohort. Kaplan–Meier method with log-rank test of DFS (D) and OS (E) between the C1 and CMS2 subtypes in the combined cohort (the CRC-AFFY and CRC-RNAseq cohorts). Kaplan–Meier method with log-rank test of DFS (F) and OS (G) between the C2, C3, and CMS4 subtypes in the combined cohort. Kaplan–Meier method with log-rank test of DFS (H) and OS (I) between the C4 and CMS1 subtypes in the combined cohort. Kaplan–Meier method with log-rank test of DFS (J) and OS (K) between the C2 subtype within the CMS4 subtype and the C3 subtype within the CMS4 subtype in the combined cohort.
Figure 2 with 1 supplement
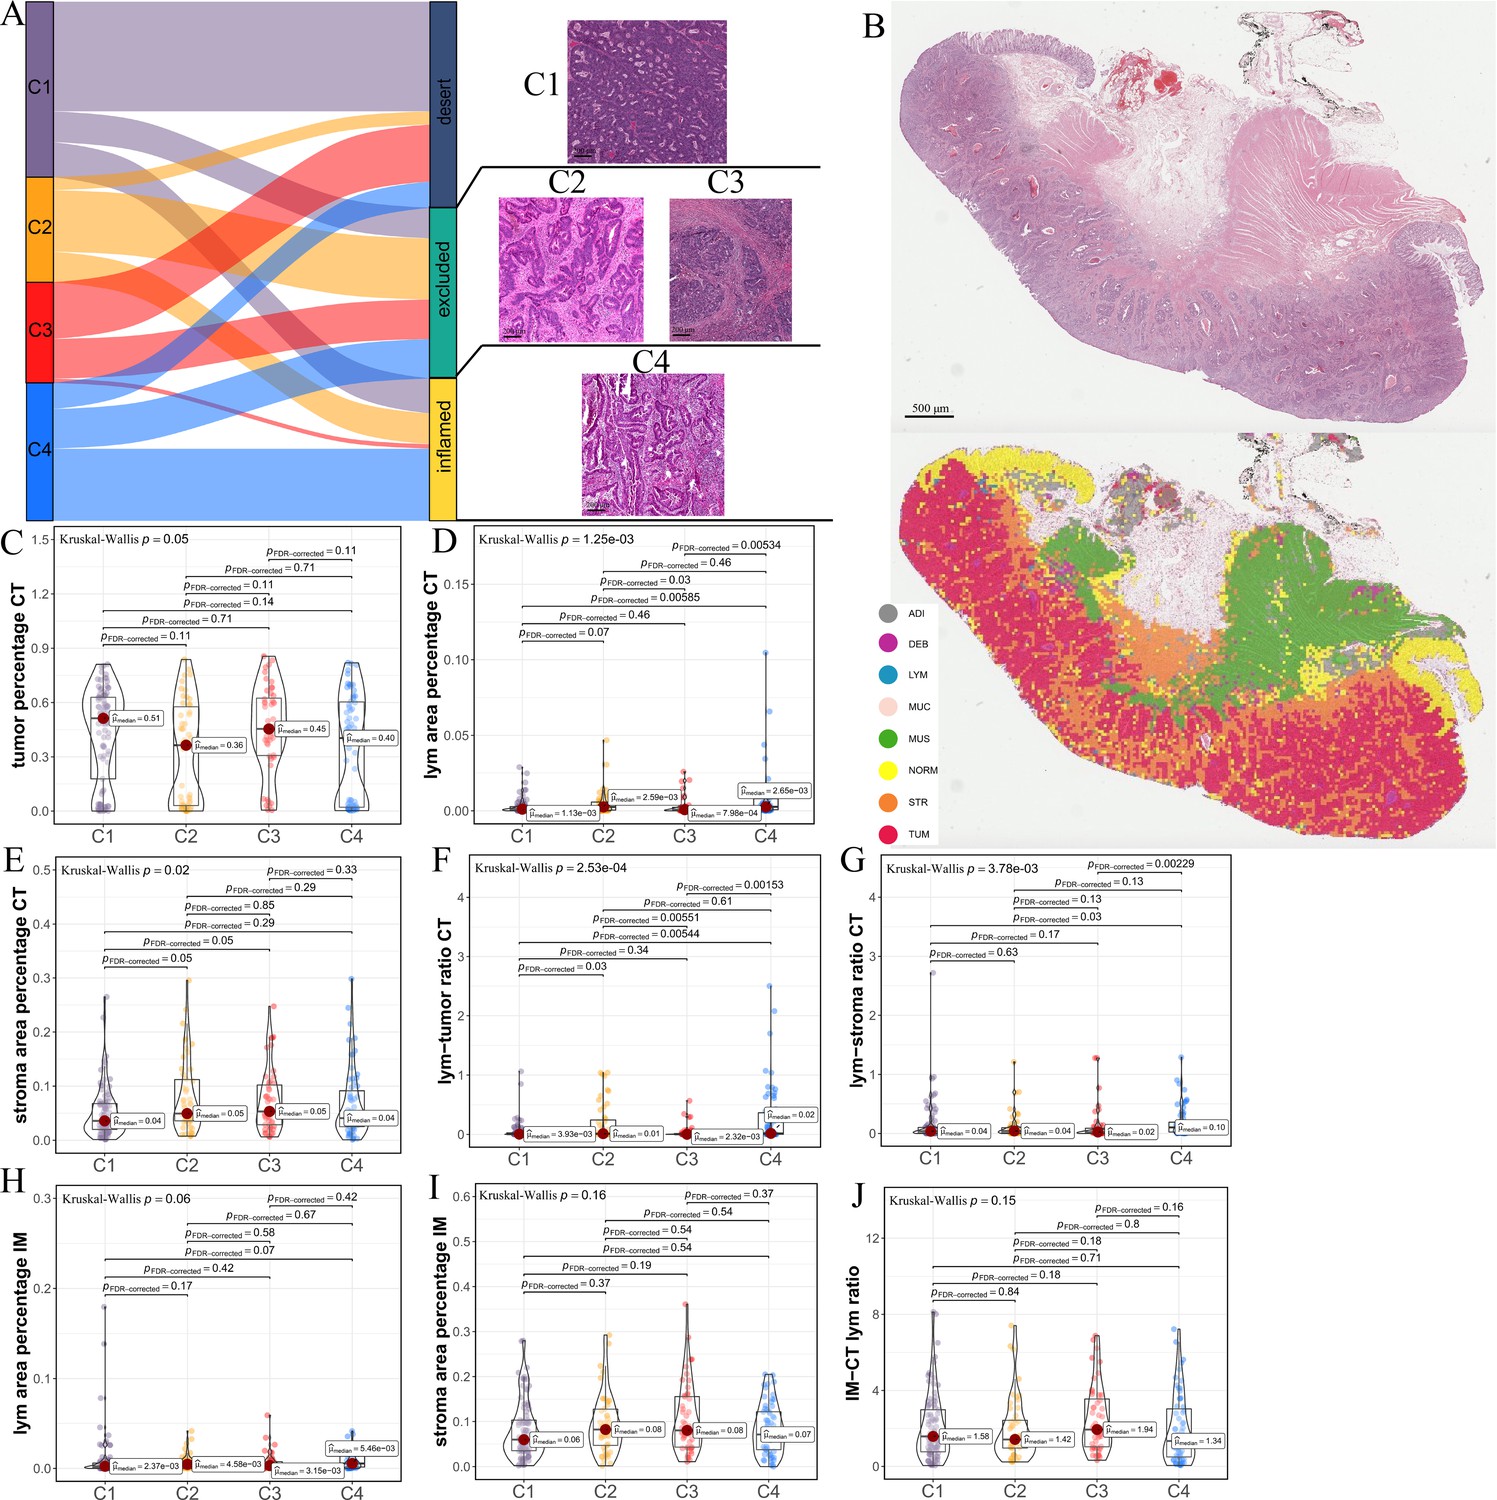
Differences in histological characteristics between comprehensive characterization of colorectal cancer (CCCRC) subtypes.
(A) Sankey plot shows overlap of CCCRC subtypes with the three-category immune classification system (‘desert’, ‘excluded’, and ‘inflamed’ phenotypes), and their representative hematoxylin and eosin (HE)-stained whole-slide images (WSIs). C1: TCGA-AA-3955; C2: TCGA-A6-6654; C3: TCGA-CK-4948; and C4: TCGA-AD-6963. Scale bars 200 μm.(B) Representative WSI (top) and the colorectal cancer (CRC)-multiclass model-inference segmentation of eight tissue types: tumor, stroma, lymphocyte, normal colon mucosa, debris, adipose, mucin, and muscle (bottom). Scale bar 500 μm. Box plots show differences in the abundance of tumors (C), lymphocyte infiltration (lym) (D), and stroma (E) in the core tumor (CT) region. Box plots show differences in the lymphocyte infiltration to tumor content ratio (F) and lymphocyte infiltration to stromal content ratio (G) in the CT region. Box plots show differences in the abundance of lymphocytes infiltration (H) and stroma (I) in the invasive margin (IM) region. (J) Box plots show differences in the ratio of lymphocyte infiltration in the IM region to the CT region.
Figure 2—figure supplement 1
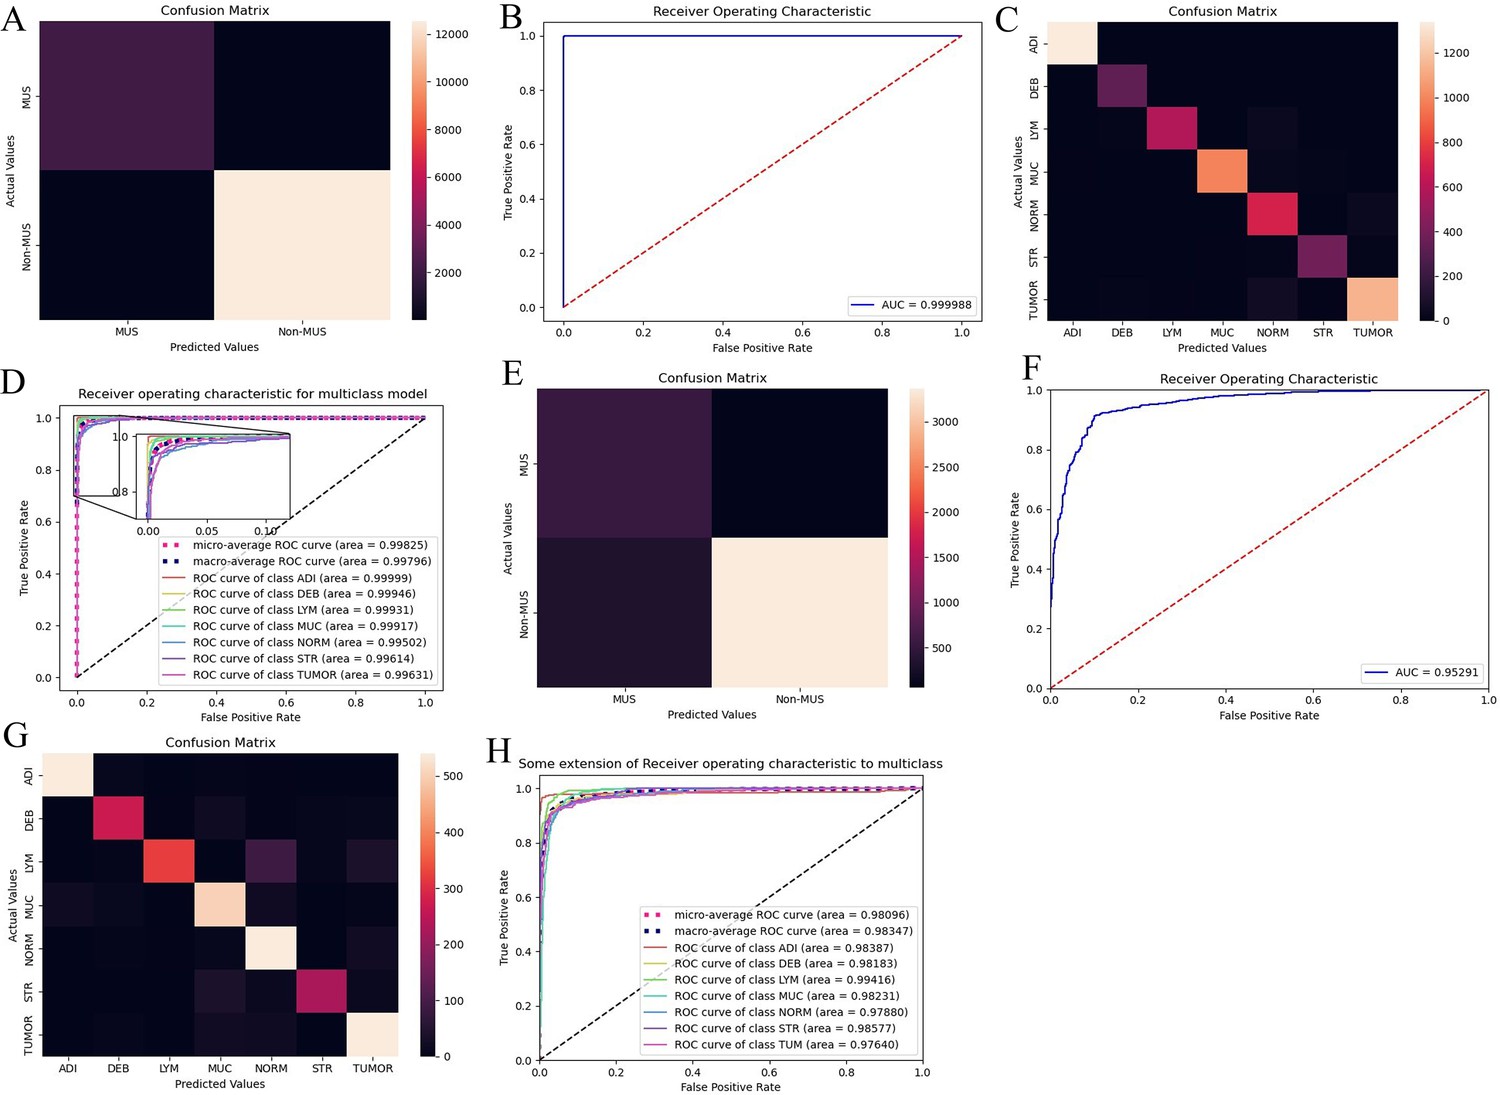
The performance of the colorectal cancer (CRC)-multiclass model: a muscle/non-muscle classifier a seven-tissue classifier.
Confusion matrices show overlapping numbers of predicted tissues and actual tissues. Area under the curve (AUC) curves show performance of the CRC-multiclass model on the TCGA-CRC dataset. (A, B) Confusion matrix and AUC of the muscle/non-muscle classifier in internal test set. (C, D) Confusion matrix and AUC of the seven-tissue classifier in internal test set. (E, F) Confusion matrix and AUC of the muscle/non-muscle classifier in external test set. (G, H) Confusion matrix and AUC of the seven-tissue classifier in external test set. (ADI: adipose; DEB: debris; LYM: lymphocytes; MUC: mucus; MUS: smooth muscle; NORM: normal colon mucosa; STR: cancer-associated stroma; TUM: colorectal adenocarcinoma epithelium).
Figure 3 with 1 supplement
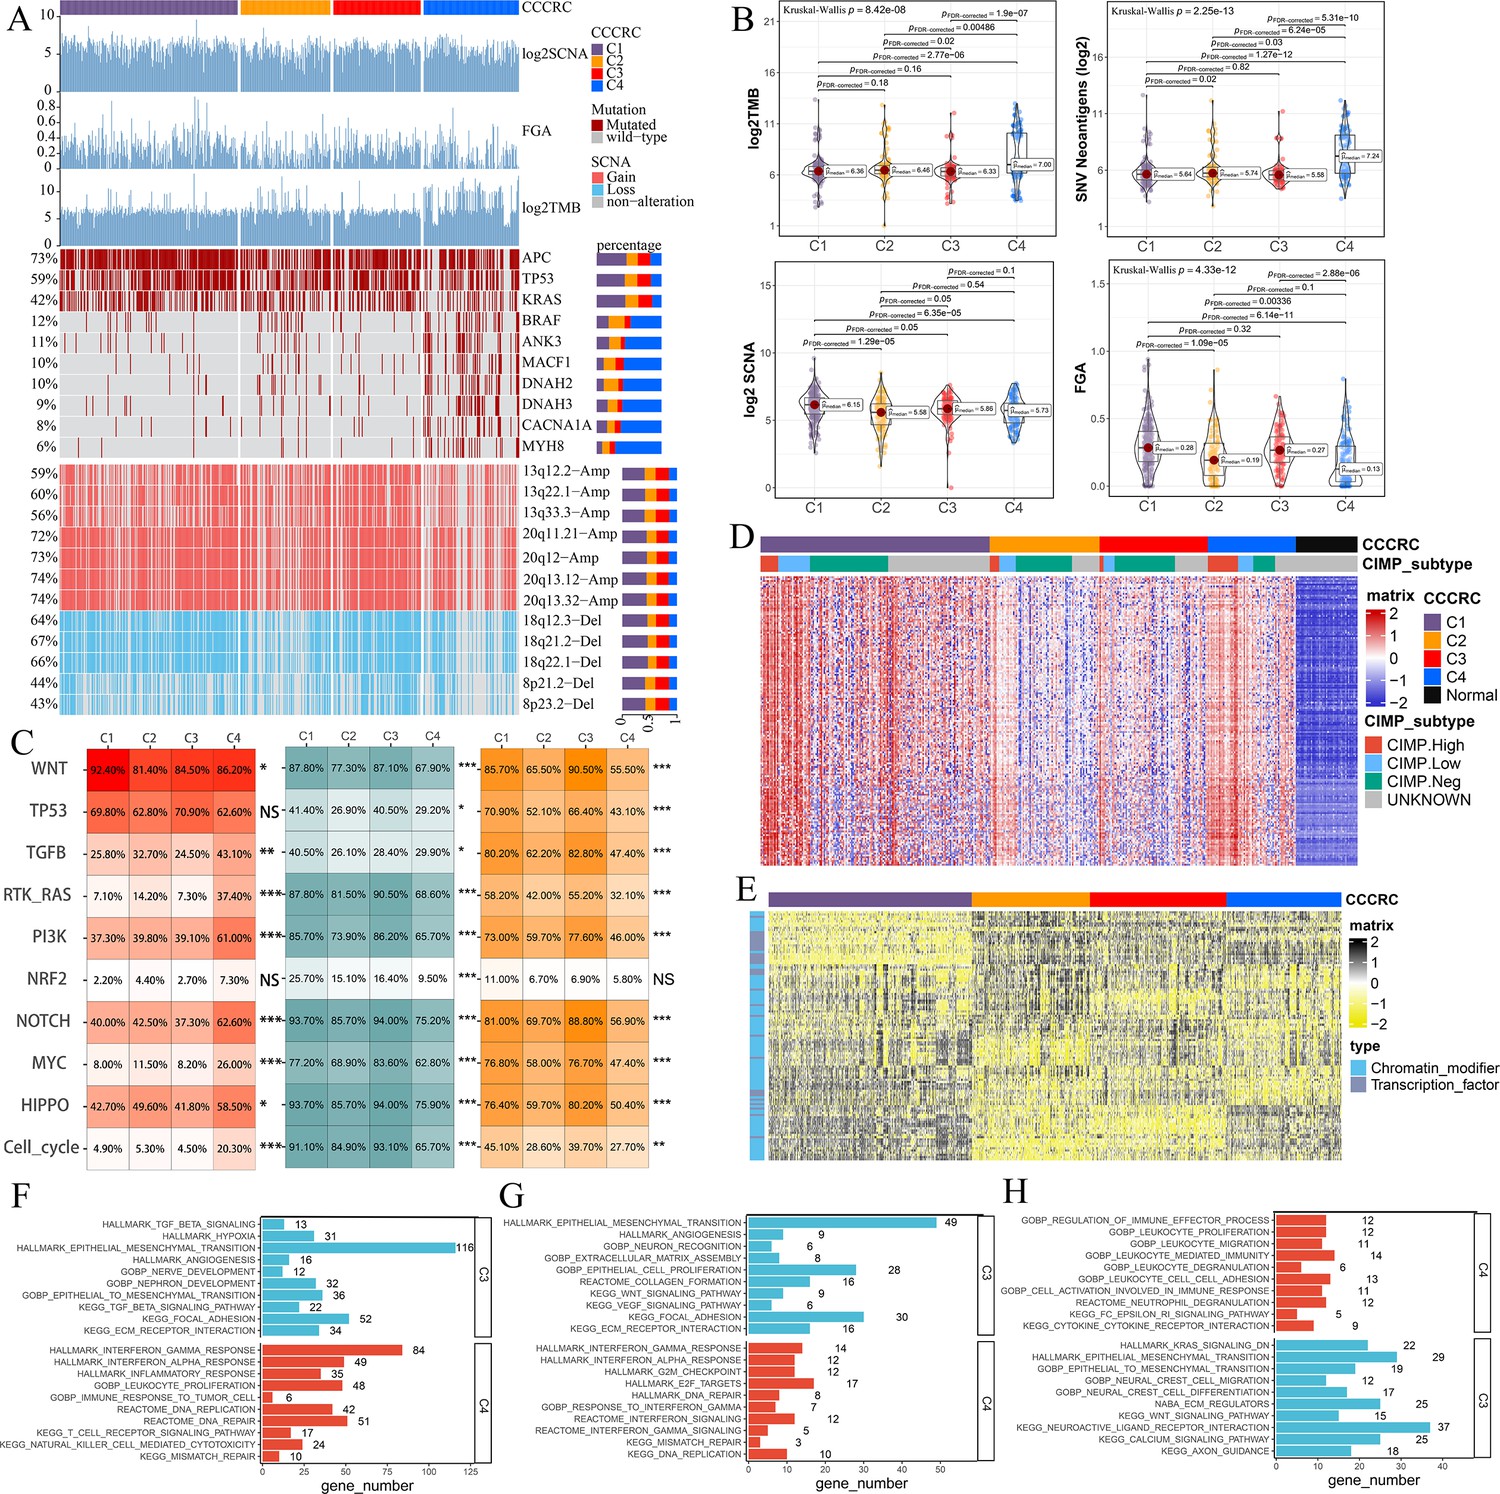
Biological characterization of comprehensive characterization of colorectal cancer (CCCRC) subtypes based on multi-omics data.
(A) Distribution of driver gene mutations and somatic copy number alterations (SCNAs) among the CCCRC subtypes in the TCGA-CRC dataset. (B) Box plots show differences in tumor mutation burden (TMB), neoantigens, SCNA counts, and fraction of the genome altered (FGA) scores among the four CCCRC subtypes in the TCGA-CRC dataset. (C) Genomic alterations in 10 oncogenic pathways were compared among the four CCCRC subtypes in the TCGA-CRC dataset. The color of the box represents the different types of genomic alterations (red, mutation; blue, amplification; yellow, deletion), and the color saturation represents the frequency. The color of the p-value represents which oncogenic pathway had the highest frequency of the genomic alterations. Heatmap shows differentially methylated genes derived from each CCCRC subtype versus normal tissues (D) and regulon activity profiles for transcription factors and chromatin modifiers (E). (F) Significantly enriched gene sets among genes upregulated in the C4 subtype (red bars) and the C3 subtype (blue bars). (G) Significantly enriched gene sets among proteins upregulated in the C4 subtype (red bars) and the C3 subtype (blue bars). (H) Significantly enriched gene sets of methylated genes with downregulated DNA methylation in the C4 subtype compared to the C3 subtype (red bars) or with upregulated DNA methylation in the C4 subtype compared to the C3 subtype (blue bars). *p-value <0.05; **p-value <0.01; ***p-value <0.001; NS, p-value >0.05.
Figure 3—figure supplement 1
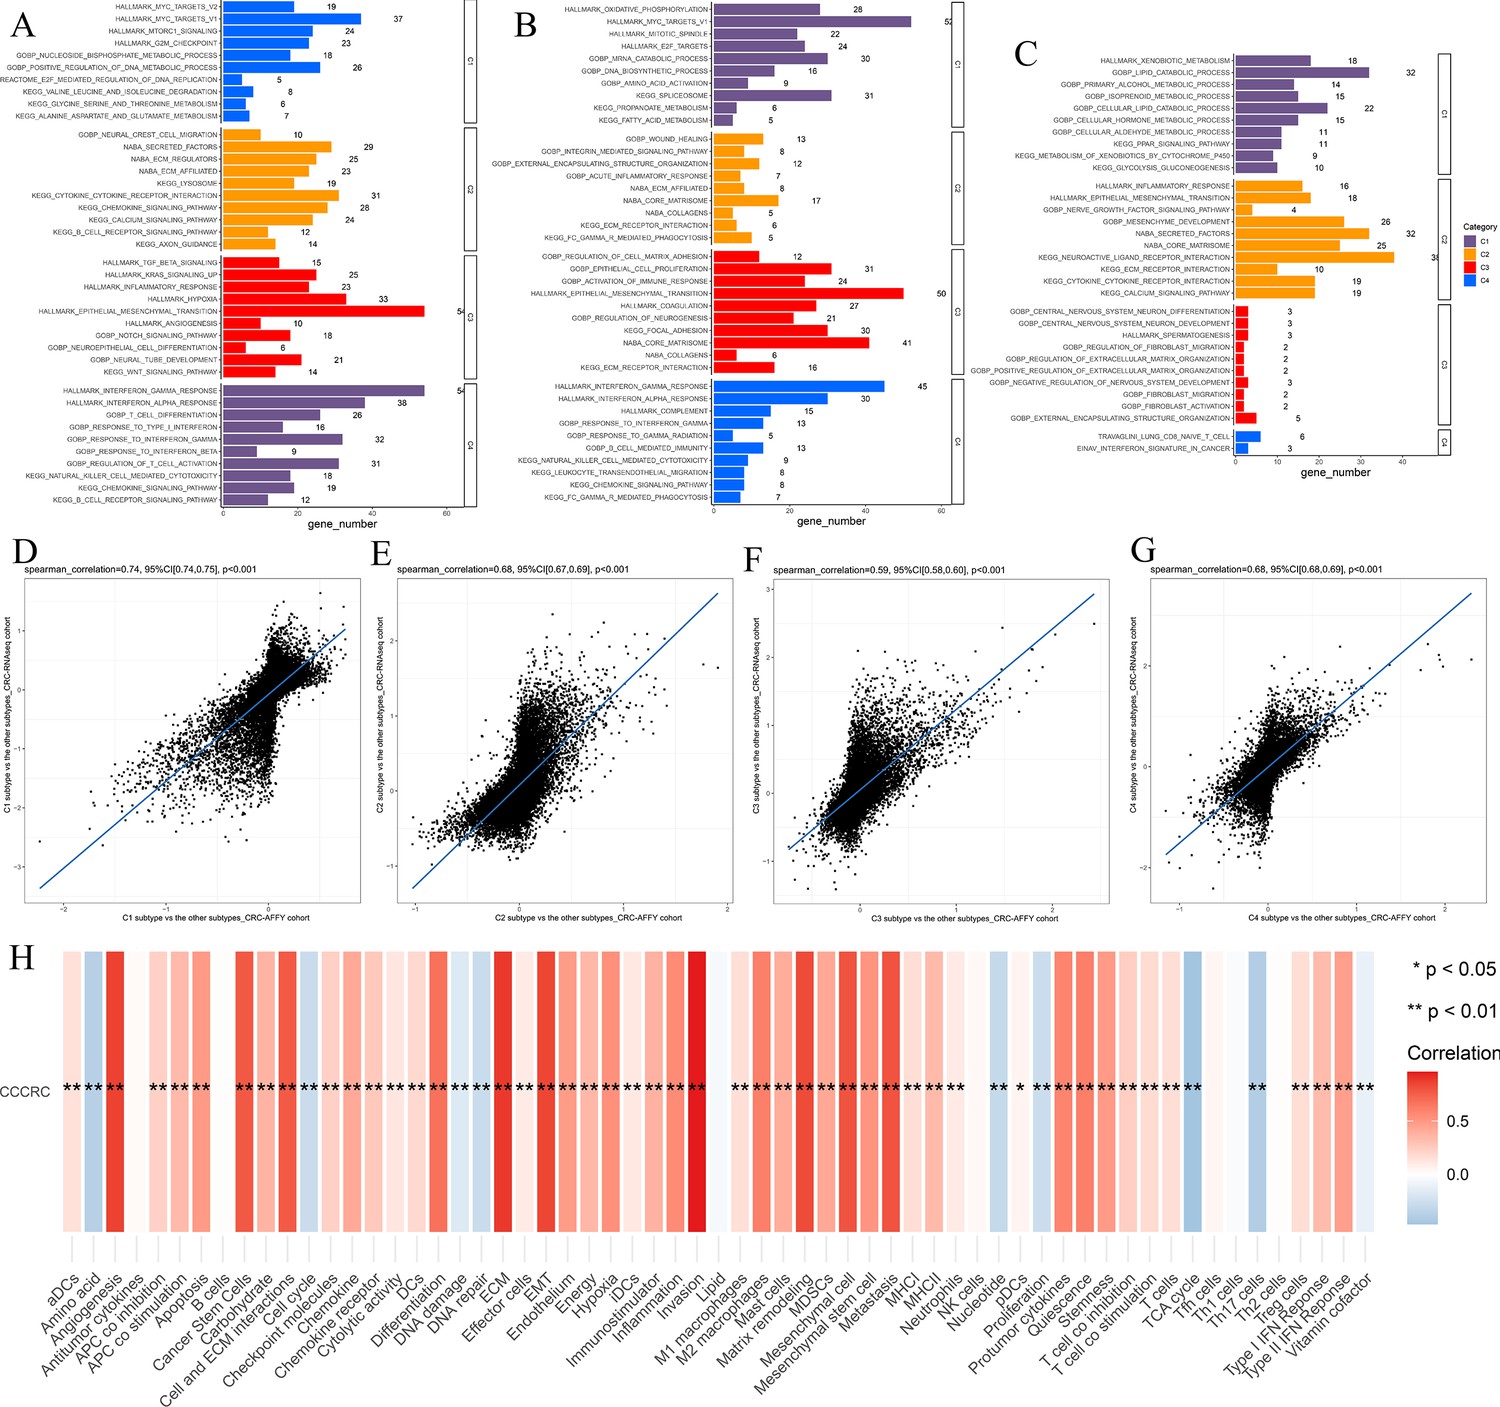
Biological characterization of the comprehensive characterization of colorectal cancer (CCCRC) subtypes based on multi-omics data.
(A–C) Significantly enriched gene sets among the CCCRC subtype-specific upregulated genes, CCCRC subtype-specific downregulated methylation genes, and CCCRC subtype-specific upregulated proteins. Scatter plots show gene expression log2-fold changes for all genes among the four CCCRC subtypes: C1 subtype versus the other subtypes (D), C2 subtype versus the other subtypes (E), C3 subtype versus the other subtypes (F), and C4 subtype versus the other subtypes (G) in the CRC-AFFY cohort and the CRC-RNAseq cohort. (H) Relationship between CCCRC score and tumor microenvironment (TME)-related signature scores.
Figure 4
Discovery of a nongenetic tumor evolution pattern.
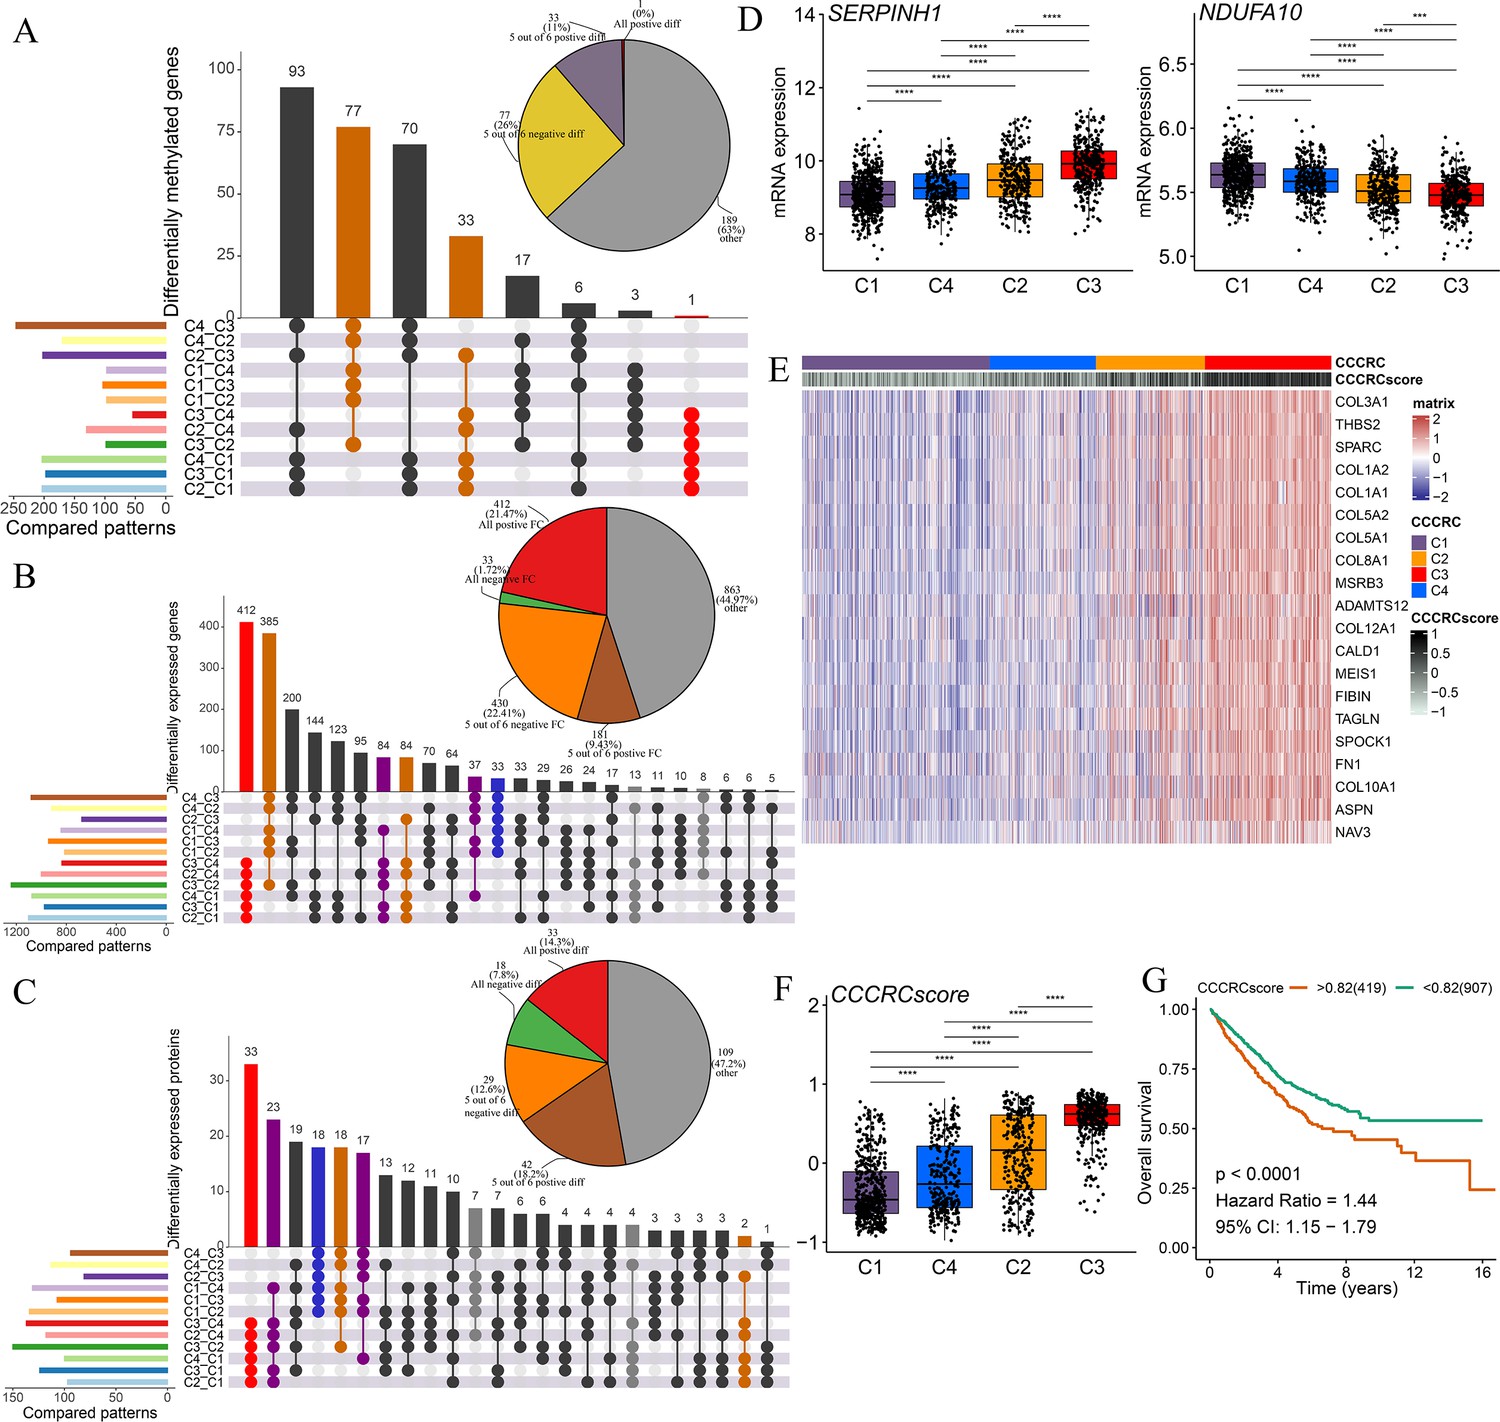
The UpSet plots are used to visualize the intersection of differentially methylated genes (A), all differentially expressed genes (B), and all differentially expressed proteins (C) between each comprehensive characterization of colorectal cancer (CCCRC) subtype. As an example, ‘C4_C3’ means that the molecular features of the C4 subtype were upregulated compared with the C3 subtype. Pie chart (top right) distributions of the sign of differences or fold changes computed for all differentially methylated genes (A), differentially expressed genes (B), and differentially expressed proteins (C). (D) mRNA expression of two top differentially expressed genes (y-axis) in the CRC-AFFY cohort stratified by the CCCRC subtypes (x-axis). (E) Heatmap shows gene expression levels of 20 CCCRC genes among the four CCCRC subtypes. (F) Box plots show differences in the CCCRC score among the four CCCRC subtypes in the CRC-AFFY cohort. (G) Kaplan–Meier method of overall survival (OS) among the four CCCRC subtypes in the CRC-AFFY and CRC-RNAseq cohorts. FC: fold change; diff: difference. ***p-value <0.001; ****p-value <0.0001.
Figure 5 with 2 supplements
Differences in T cell function between comprehensive characterization of colorectal cancer (CCCRC) subtypes.
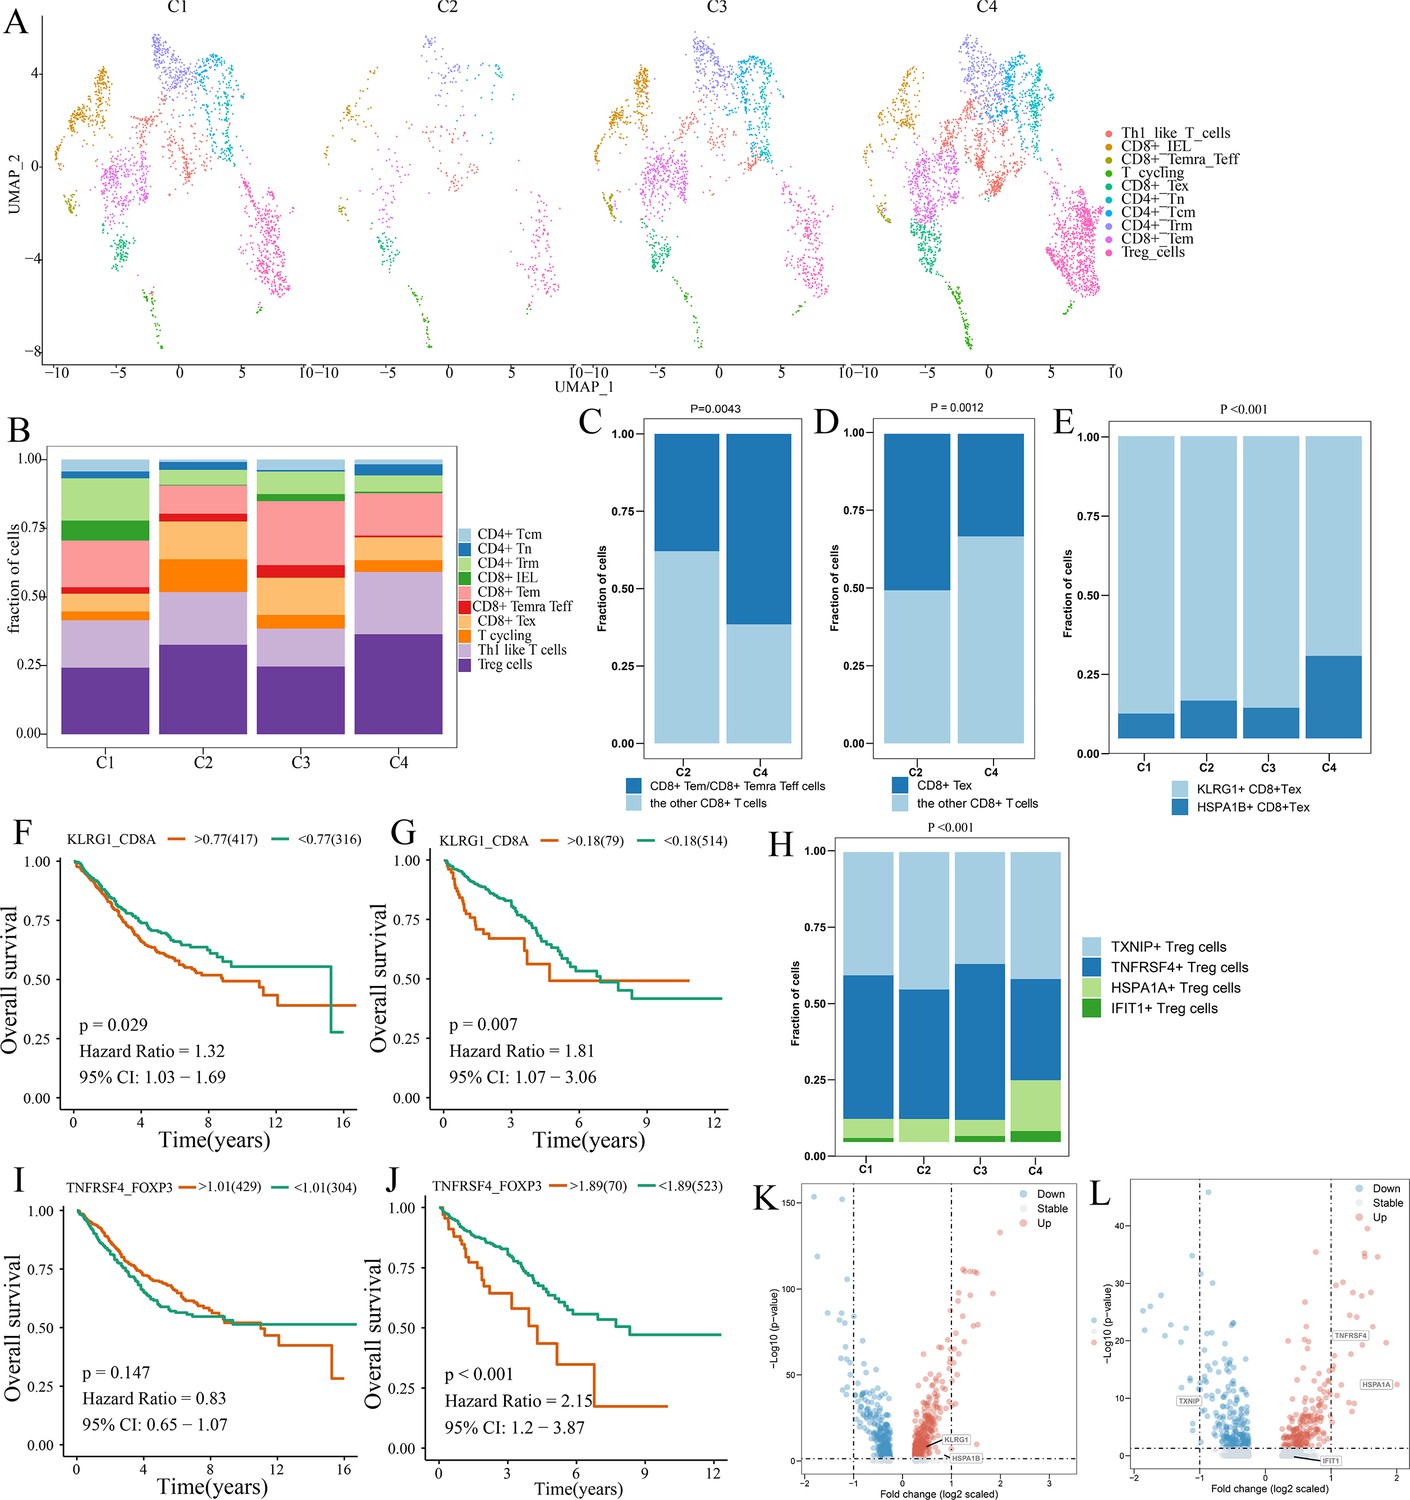
(A) UMAP shows the composition of T cells colored by cluster and divided by the CCCRC subtype in colorectal cancer (CRC) tissues. (B) Histogram shows the cell distribution of 10T cell types in the different CCCRC subtypes. (C) Proportion of effector memory CD8+ T cells (CD8+ Tem), recently activated effector memory or effector CD8+ T cells (CD8+ Temra/Teff), and the other CD8+ T cells (shown in the histogram) in the C2 and C4 subtypes. (D) Proportion of exhausted CD8+ T cells (CD8+ Tex) and the other CD8+ T cells (shown in the histogram) in the C2 and C4 subtypes. (E) Histogram shows the cell distribution of KLRG1+ CD8+ Tex and HSPA1B+ CD8+Tex cells in the different CCCRC subtypes. Kaplan–Meier method with log-rank test of overall survival (OS) in the CRC-AFFY cohort (F) and the CRC-RNAseq cohort (G) between low and high ratios of KLRG1-to-CD8A expression in patients. (H) Histogram shows the cell distribution of TXNIP+ Treg cells, TNFRSF4+ Treg cells, HSPA1A+ Treg cells, and IFIT1+ Treg cells in the different CCCRC subtypes. Kaplan–Meier method with log-rank test of OS in the CRC-AFFY cohort (I) and the CRC-RNAseq cohort (J) between low and high ratios of TNFRSF4-to-CD8A expression in patients. (K) Volcano plot shows differentially expressed genes between tumor (red dots) and normal CD8+ T cells (blue dots). (L) Volcano plot shows differentially expressed genes between tumor (red dots) and normal Treg cells (blue dots).
Figure 5—figure supplement 1
Differences in T cell function between comprehensive characterization of colorectal cancer (CCCRC) subtypes.
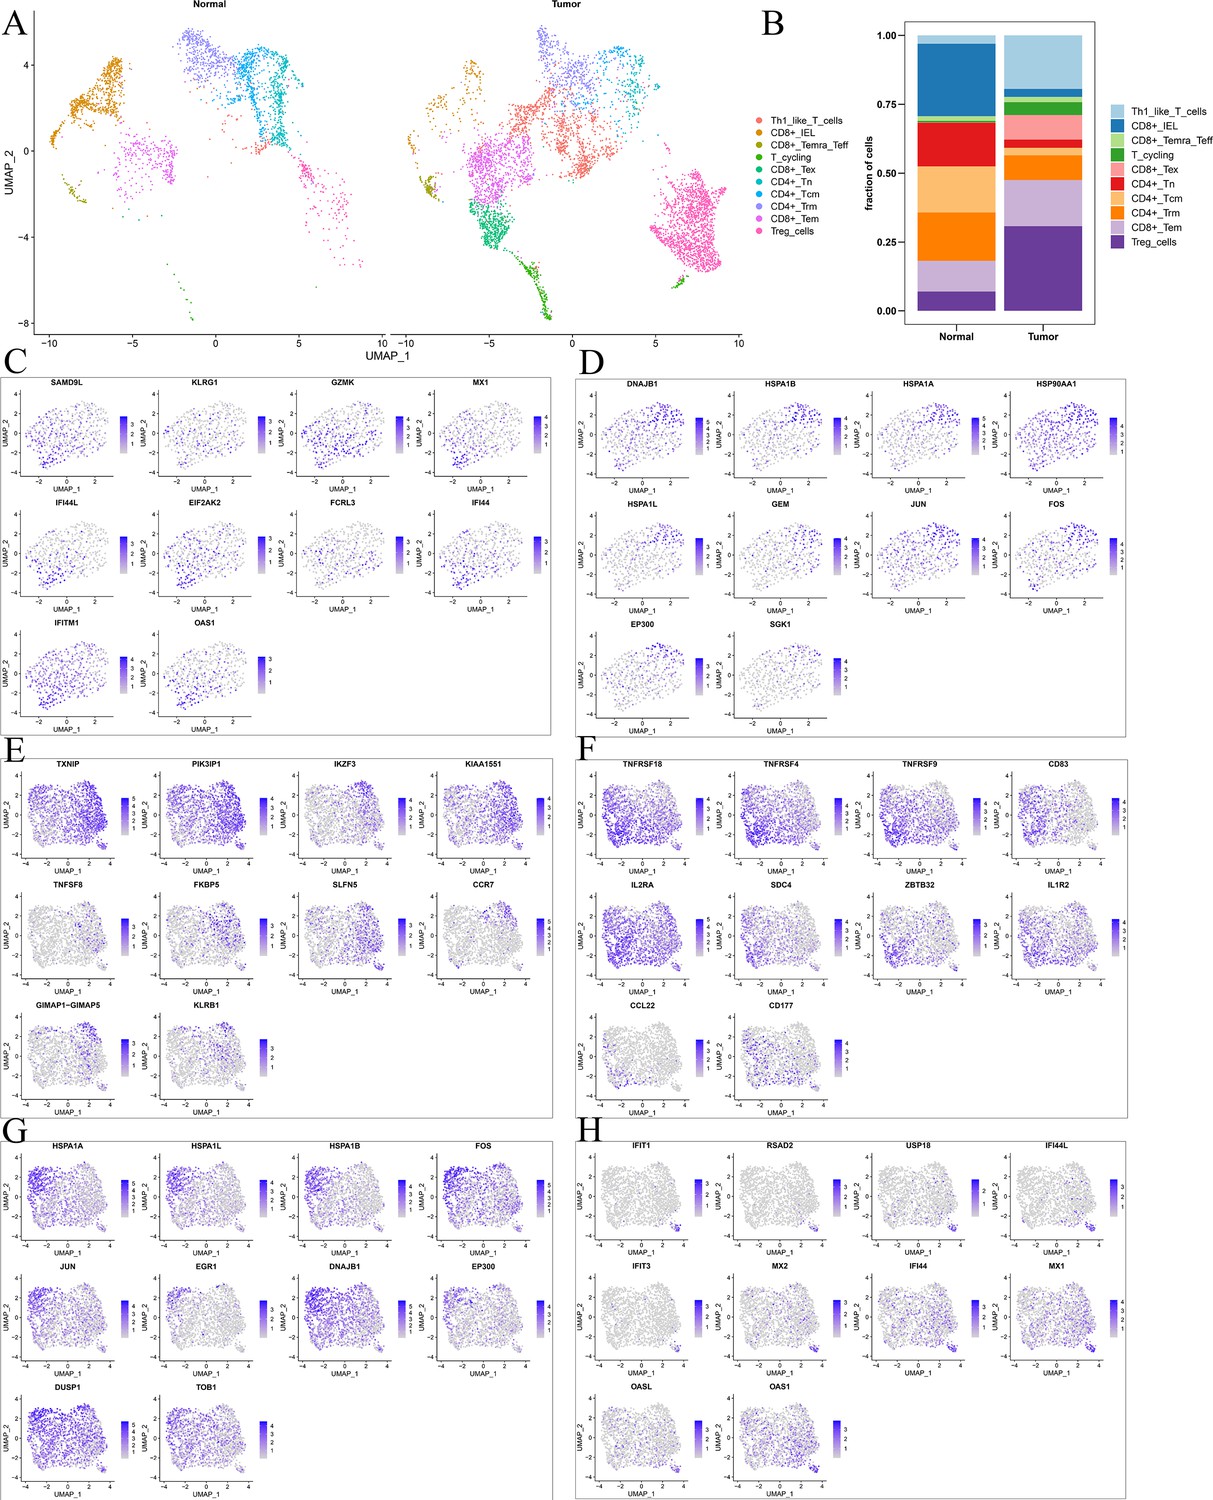
(A) UMAP shows the composition of T cells colored by cluster in tumor and normal tissues. (B) UMAP shows the composition of T cells colored by cluster and classified by CCCRC subtype in tumor and normal tissues. The tSNE visualized plot shows the expression of the top 10 marker genes for KLRG1+ CD8+ Tex (C), HSPA1B+ CD8+ Tex cells (D), TXNIP+ Treg cells (E), TNFRSF4+ Treg cells (F), HSPA1A+ Treg cells (G), and IFIT1+ Treg cells (H).
Figure 5—figure supplement 2
Survival analyses of T cell subsets.
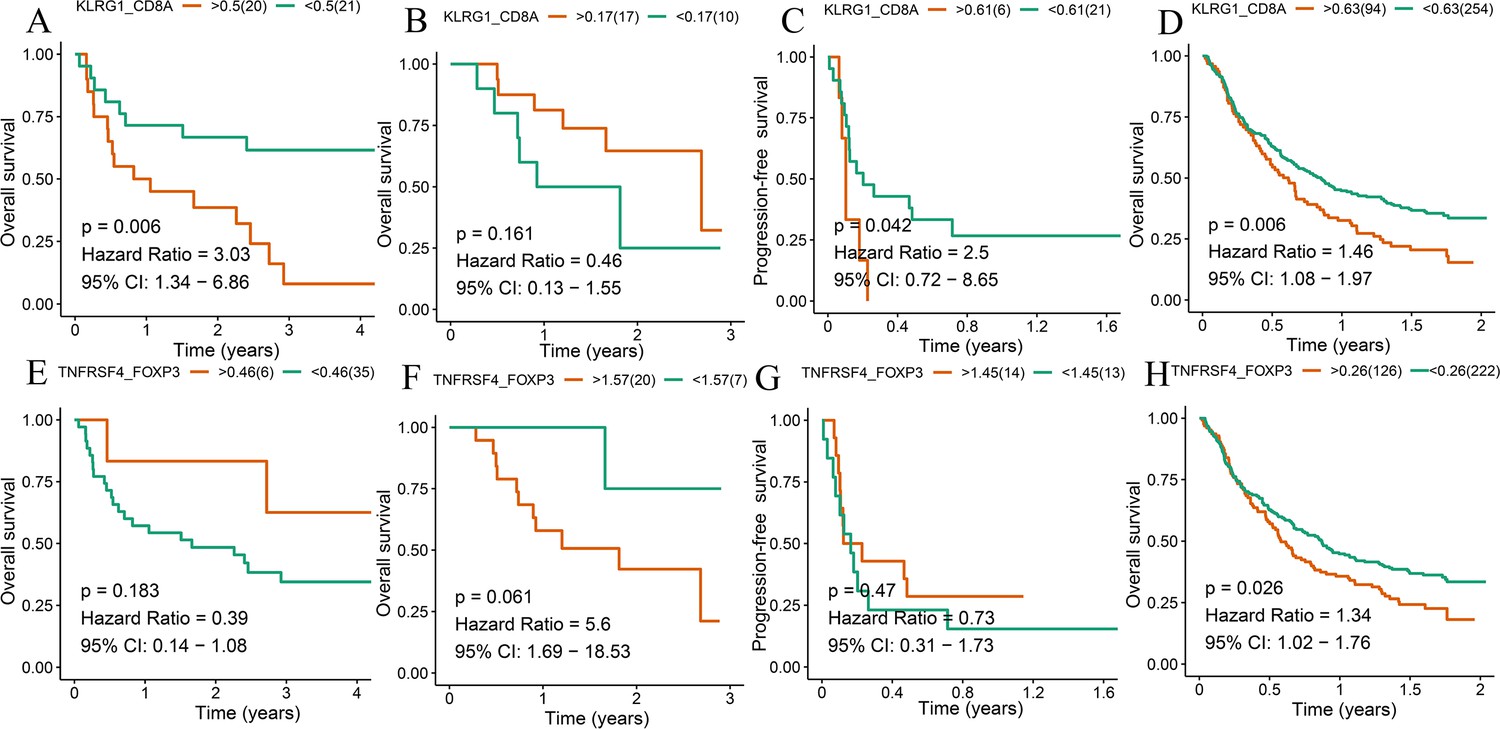
Kaplan–Meier method with log-rank test of overall survival (OS) and progression-free survival (PFS) between the high ratio of KLRG1-to-CD8A expression and the low ratio of KLRG1-to-CD8A expression in Gide (A), Hugo (B), Jung (C), and IMvigor210 (D) datasets. Kaplan–Meier method with log-rank test of OS and PFS between the high ratio of TNFRSF4-to-FOXP3 expression and the low ratio of TNFRSF4-to-FOXP3 expression in Gide (E), Hugo (F), Jung (G), and IMvigor210 (H) datasets.
Figure 6 with 4 supplements
Significance of comprehensive characterization of colorectal cancer (CCCRC) in guiding the clinical treatment of colorectal cancer (CRC).
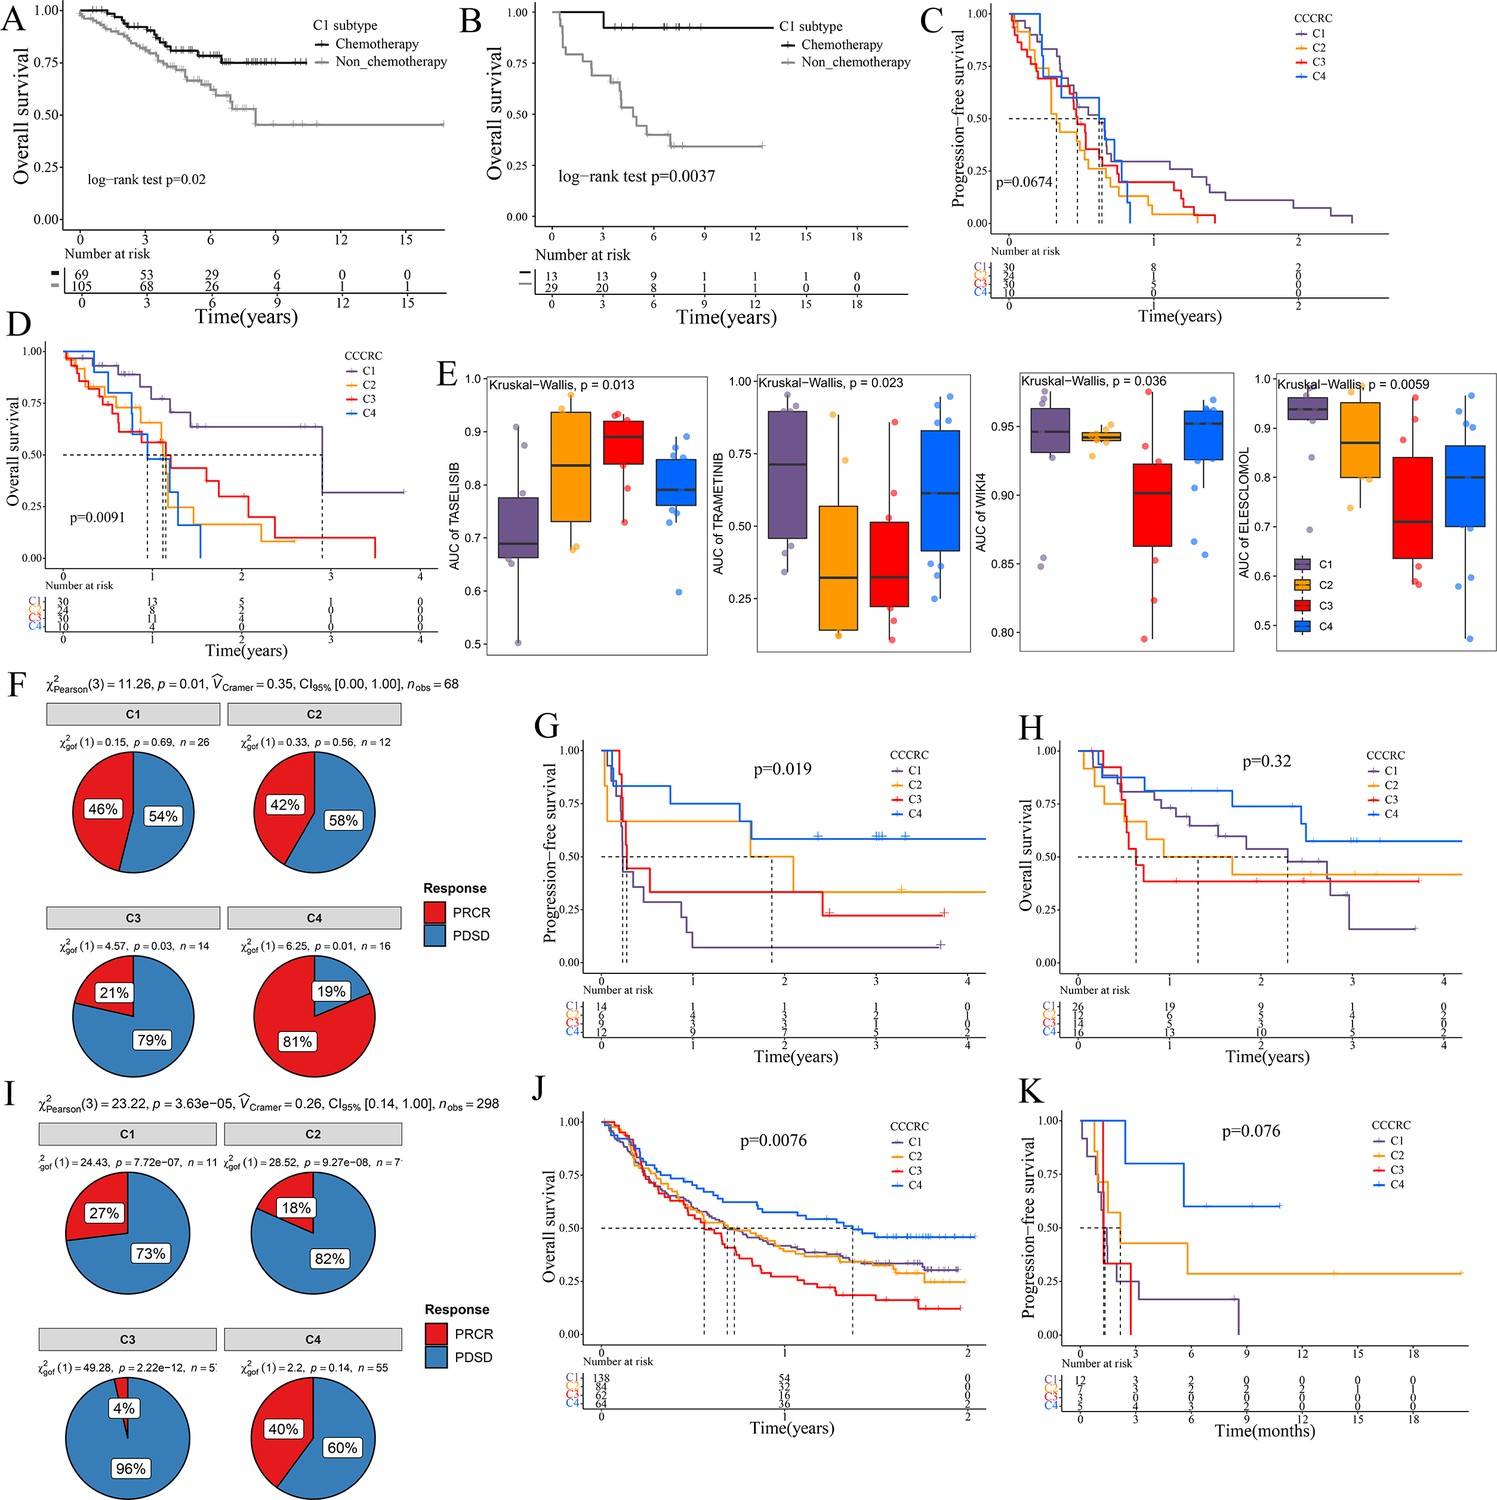
Kaplan–Meier method of overall survival (OS) between stage II and III CRC C1 patients with or without chemotherapy in the CRC-AFFY cohort (A) and the GSE103479 (B) dataset. Kaplan–Meier method of progression-free survival (PFS) (C) and OS (D) among the four CCCRC subtypes in the GSE104645 dataset. (E) Box plots show the differences in the area under the receiver operator characteristics curve (AUC) of drug responses among the four CCCRC subtypes. (F) Pie chart shows the differences in the proportion of responses to immune checkpoint blockade treatment among the four CCCRC subtypes in the two independent melanoma cohorts (Gide and Hugo datasets, n = 68) treated with anti-PD1 therapy. Kaplan–Meier method with log-rank test of PFS (G) and OS (H) among the four CCCRC subtypes in the two independent melanoma cohorts (Gide and Hugo datasets, n = 68) treated with anti-PD1 therapy. (I) Pie chart shows the differences in the proportion of responses to immune checkpoint blockade treatment among the four CCCRC subtypes in the urothelial carcinoma cohort (n = 298) treated with anti-PDL1 therapy. Kaplan–Meier method with log-rank test of OS and PFS among the four CCCRC subtypes in the urothelial carcinoma cohort (n = 348) (J) and the lung cancer cohort (n = 27) (K) treated with anti-PD1/PDL1 therapy. PRCR: partial response and complete response; PDSD: progressive disease and stable disease.
Figure 6—figure supplement 1
Significance of comprehensive characterization of colorectal cancer (CCCRC) in guiding clinical treatment of colorectal cancer (CRC).
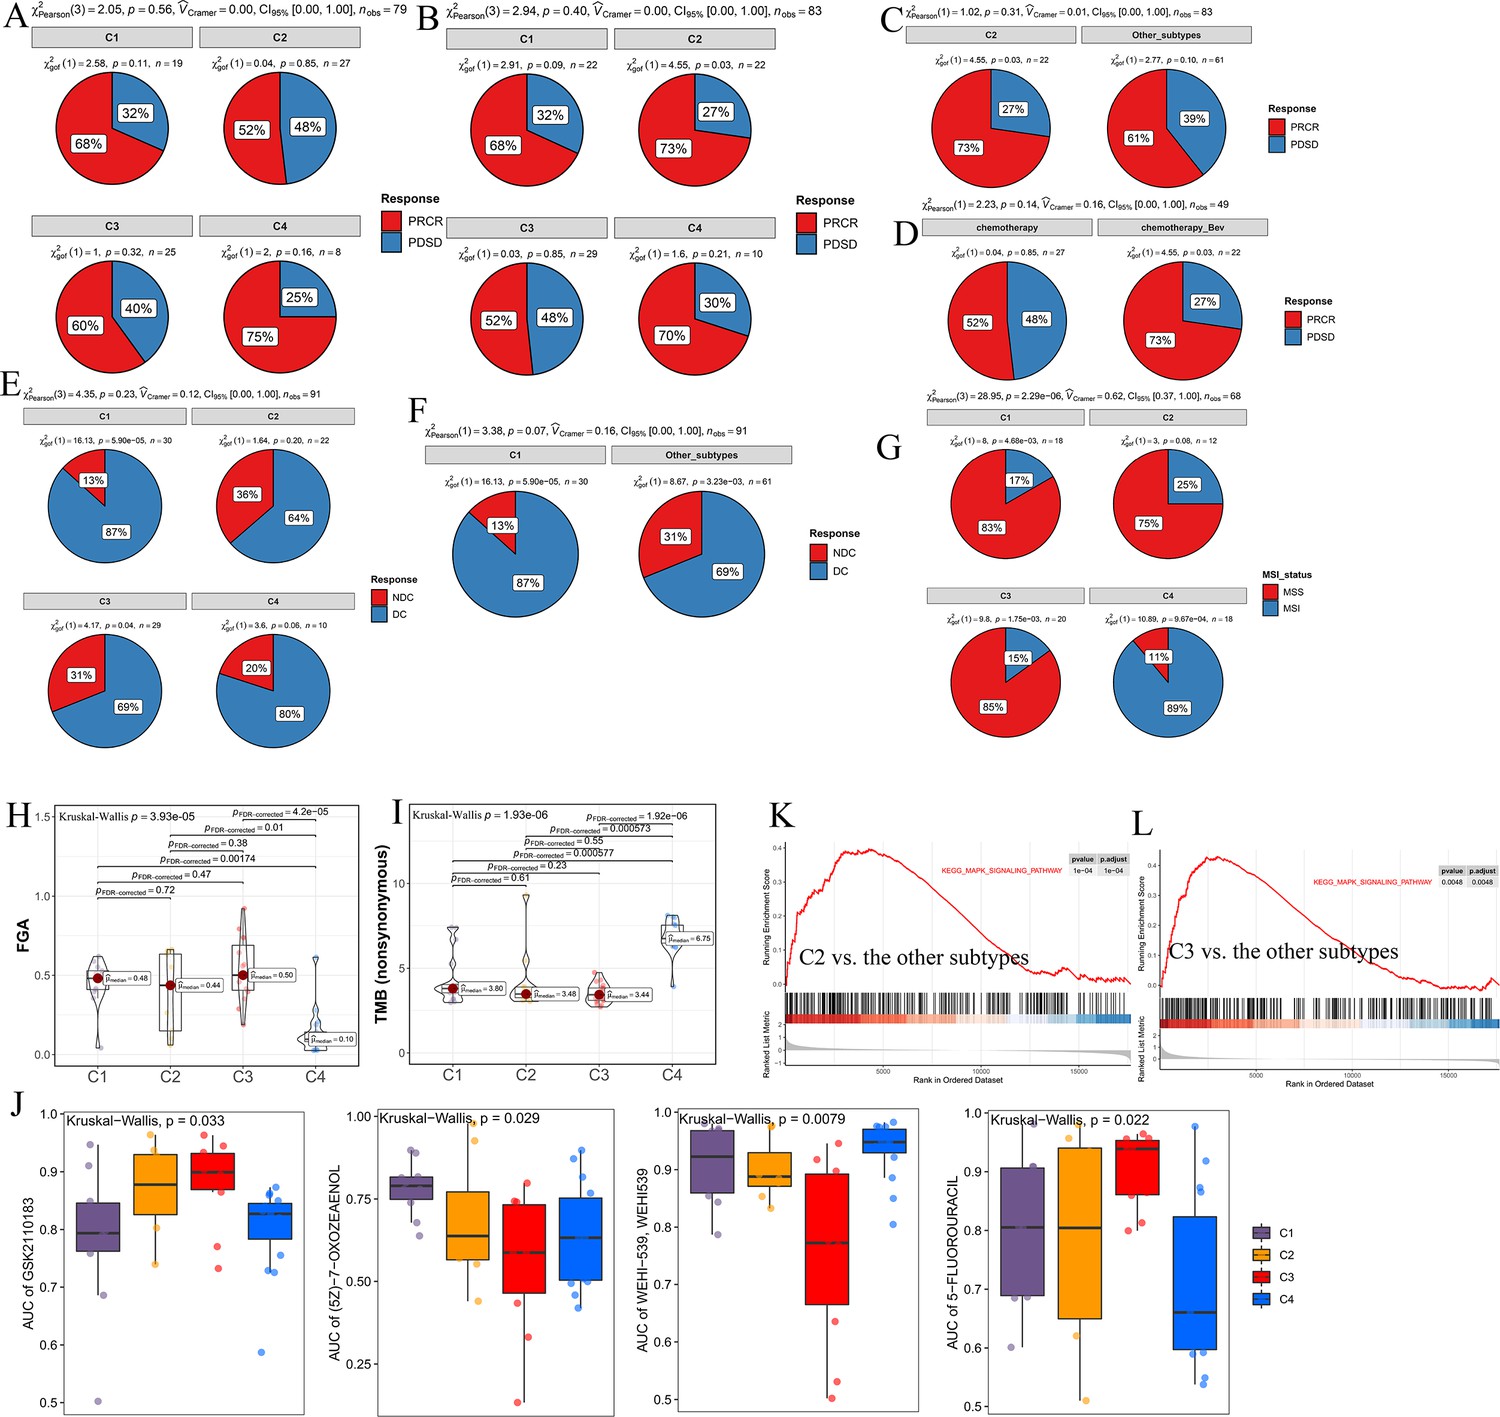
(A) Pie chart shows the differences in the proportions of responses to chemotherapy among the four CCCRC subtypes in the GSE104645 dataset. Pie chart shows the differences in the proportions of responses to a combination of chemotherapy and bevacizumab among the four CCCRC subtypes (B) and between the C2 subtype and the other subtypes (C) in the GSE104645 dataset. (D) Pie chart shows the differences in the proportions of responses to chemotherapy plus bevacizumab versus responses to chemotherapy in the C2 subtype of the GSE104645 dataset. (E) Pie chart shows the differences in the proportions of the disease control rate of anti-EGFR therapy among the four CCCRC subtypes without RAS mutation in the GSE104645 dataset. (F) Pie chart shows the differences in the proportions of responses to anti-EGFR therapy between the C1 subtype without RAS mutation and the other subtypes without RAS mutation in the GSE104645 dataset. (G) Pie chart shows the differences in the proportions of MSI status among the four CCCRC subtypes of CRC cell lines. MSI: microsatellite instability; MSS: microsatellite stability. Box plots show differences in fraction of the genome altered (FGA) scores (H) and tumor mutation burden (TMB) (nonsynonymous) (I) among the four CCCRC subtype cell lines. (J) Box plots show the differences in the area under the receiver operator characteristics curve (AUC) of drug responses among the four CCCRC subtypes. Gene set enrichment analysis (GSEA) of the Kyoto Encyclopedia of Genes and Genomes (KEGG) MAPK signaling pathway between C2 and the other subtypes (K) and between C3 and the other subtypes (L) in the CRC- AFFY cohort. PRCR, partial response and complete response; PDSD, progressive disease and stable disease; DC, disease control; NDC, no disease control.
Figure 6—figure supplement 2
Spatial transcriptomics analysis of the Cytassist sample.
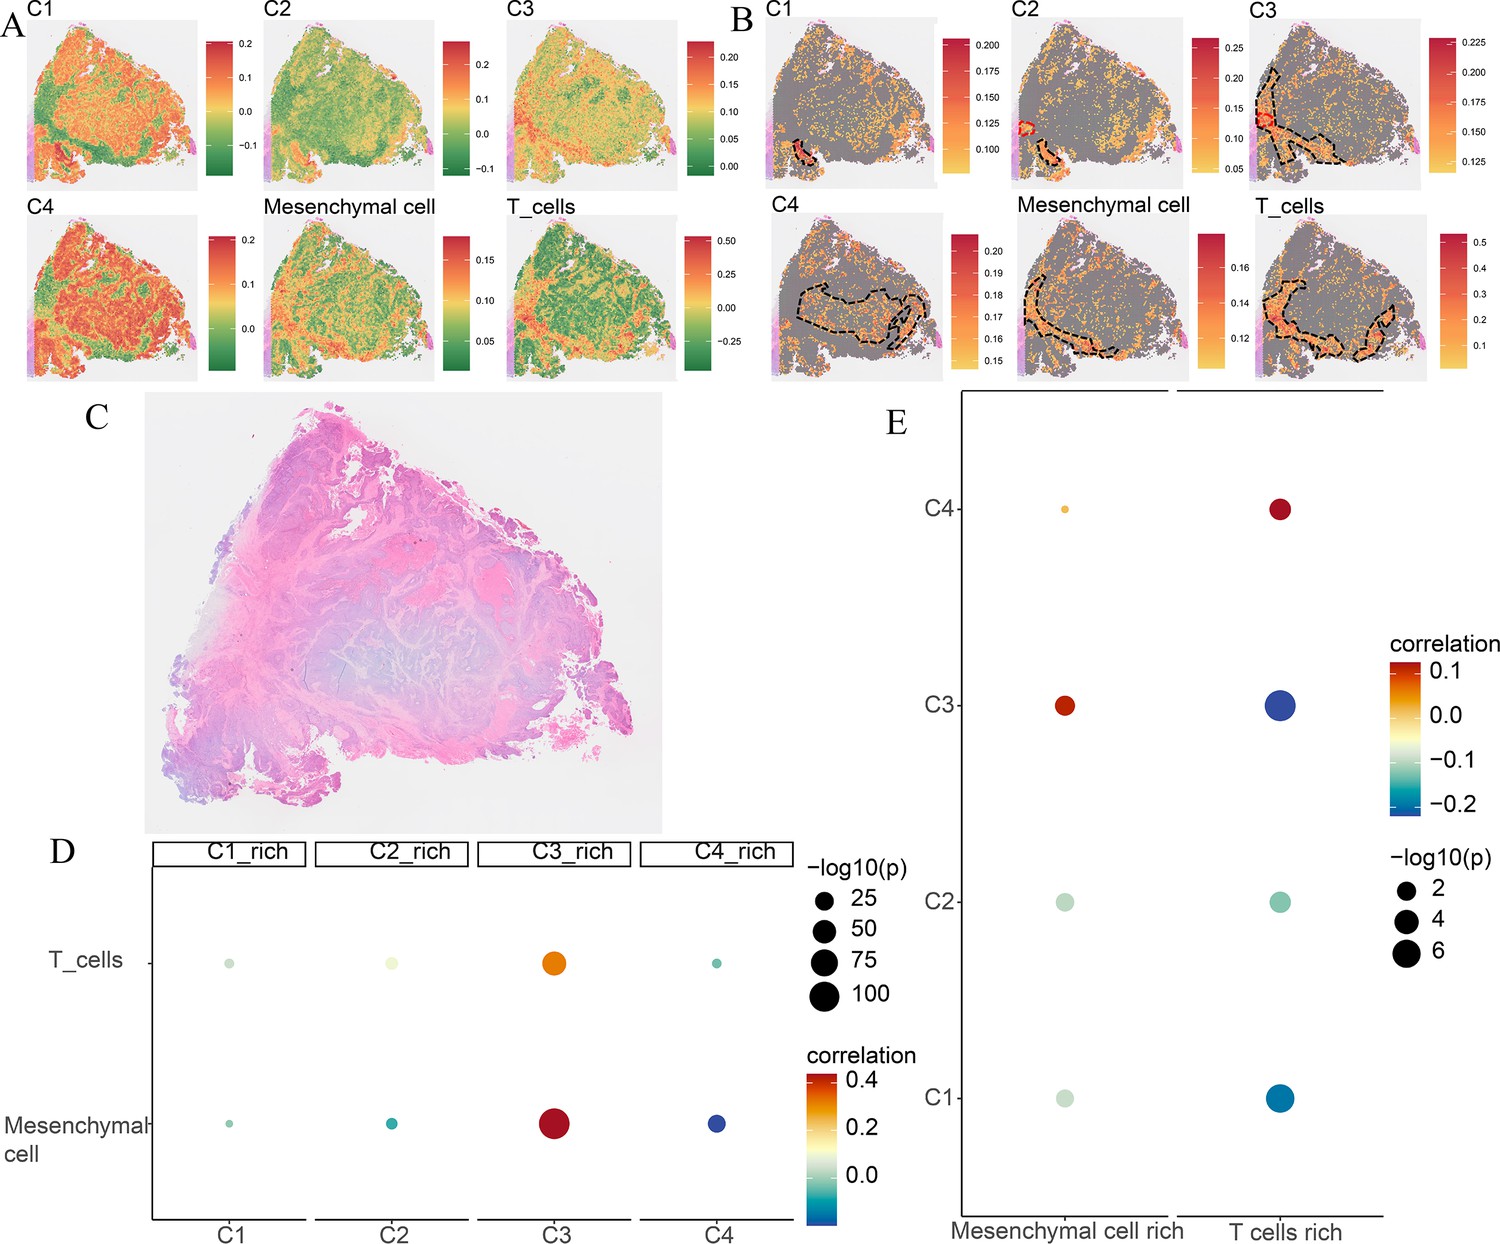
(A) The ssGSEA score of four comprehensive characterization of colorectal cancer (CCCRC) subtypes of tumor cells, T cells, and mesenchymal cells in each spot. (B) The top 25% ssGSEA score of four CCCRC subtypes of tumor cells, T cells, and mesenchymal cells in each spot. (C) The hematoxylin and eosin (HE)-stained image of the Cytassist sample obtained from 10X website (https://www.10xgenomics.com/resources/datasets). (D) Bubble diagram shows Spearman’s correlation analysis between the ssGSEA scores of each tumor cell type in their cell-type-rich regions and those of T cells and mesenchymal cells. (E) Bubble diagram shows Spearman’s correlation analysis between the ssGSEA scores of T cells and mesenchymal cells in their cell-type-rich regions and those of each tumor cell type.
Figure 6—figure supplement 3
Spatial transcriptomics analysis of the Visium sample.
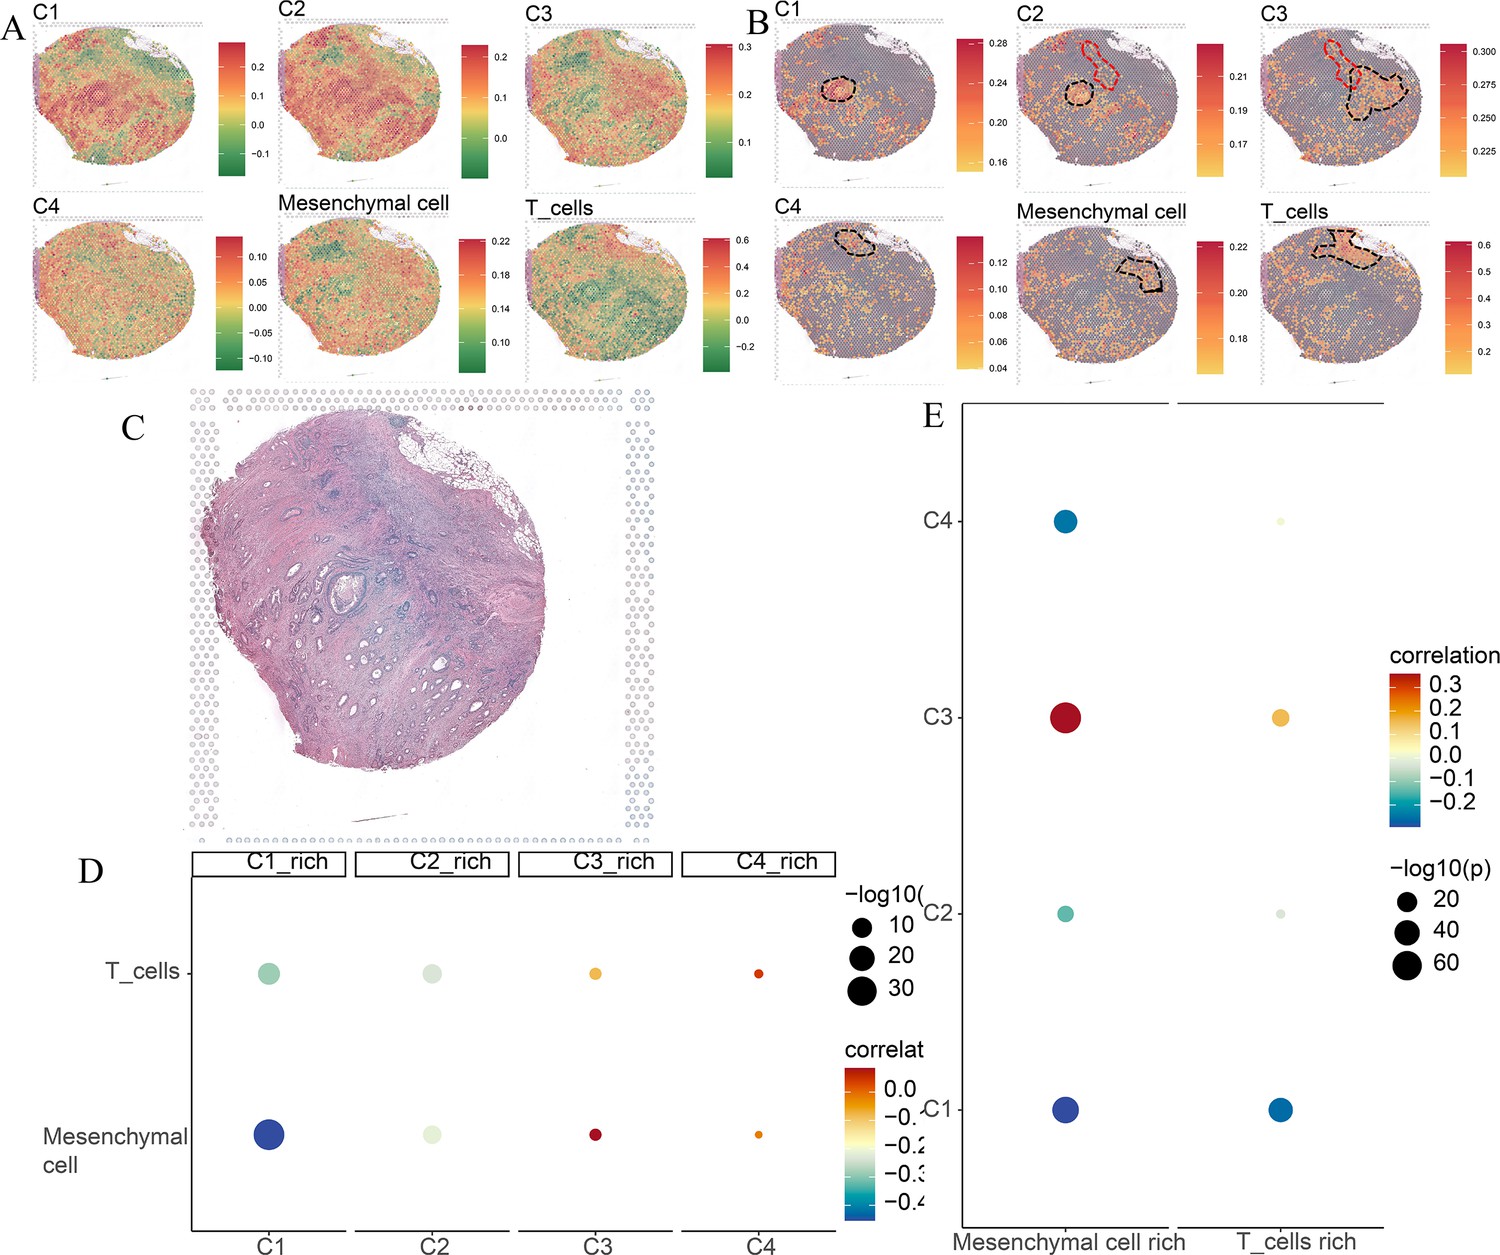
(A) The ssGSEA score of four comprehensive characterization of colorectal cancer (CCCRC) subtypes of tumor cells, T cells, and mesenchymal cells in each spot. (B) The top 25% ssGSEA score of four CCCRC subtypes of tumor cells, T cells, and mesenchymal cells in each spot. (C) The hematoxylin and eosin (HE)-stained image of the Visium sample obtained from 10X website (https://www.10xgenomics.com/resources/datasets). (D) Bubble diagram shows Spearman’s correlation analysis between the ssGSEA scores of each tumor cell type in their cell-type-rich regions and those of T cells and mesenchymal cells. (E) Bubble diagram shows Spearman’s correlation analysis between the ssGSEA scores of T cells and mesenchymal cells in their cell-type-rich regions and those of each tumor cell type.
Figure 6—figure supplement 4
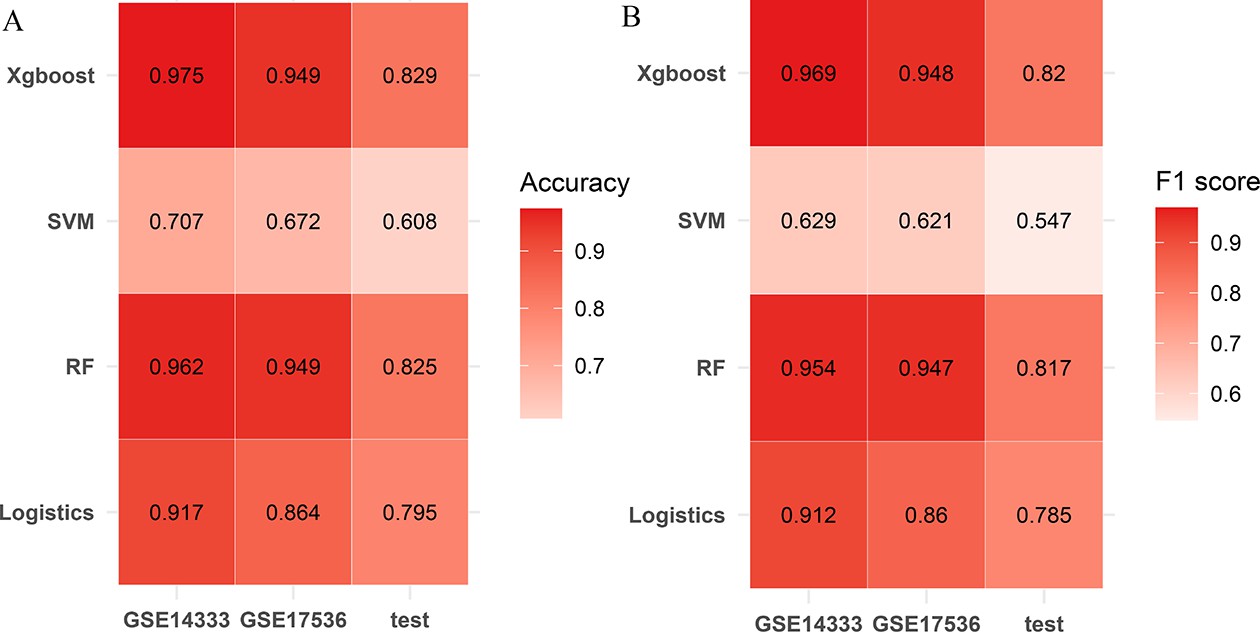
Establishment of the comprehensive characterization of colorectal cancer (CCCRC) classifier.
Heatmaps show accuracy (A) and F1 score (B) of the models constructed using the random forest (RF) algorithm, support vector machine (SVM) algorithm, extreme gradient boosting (xgboost) algorithm, logistic regression algorithm.
Figure 7
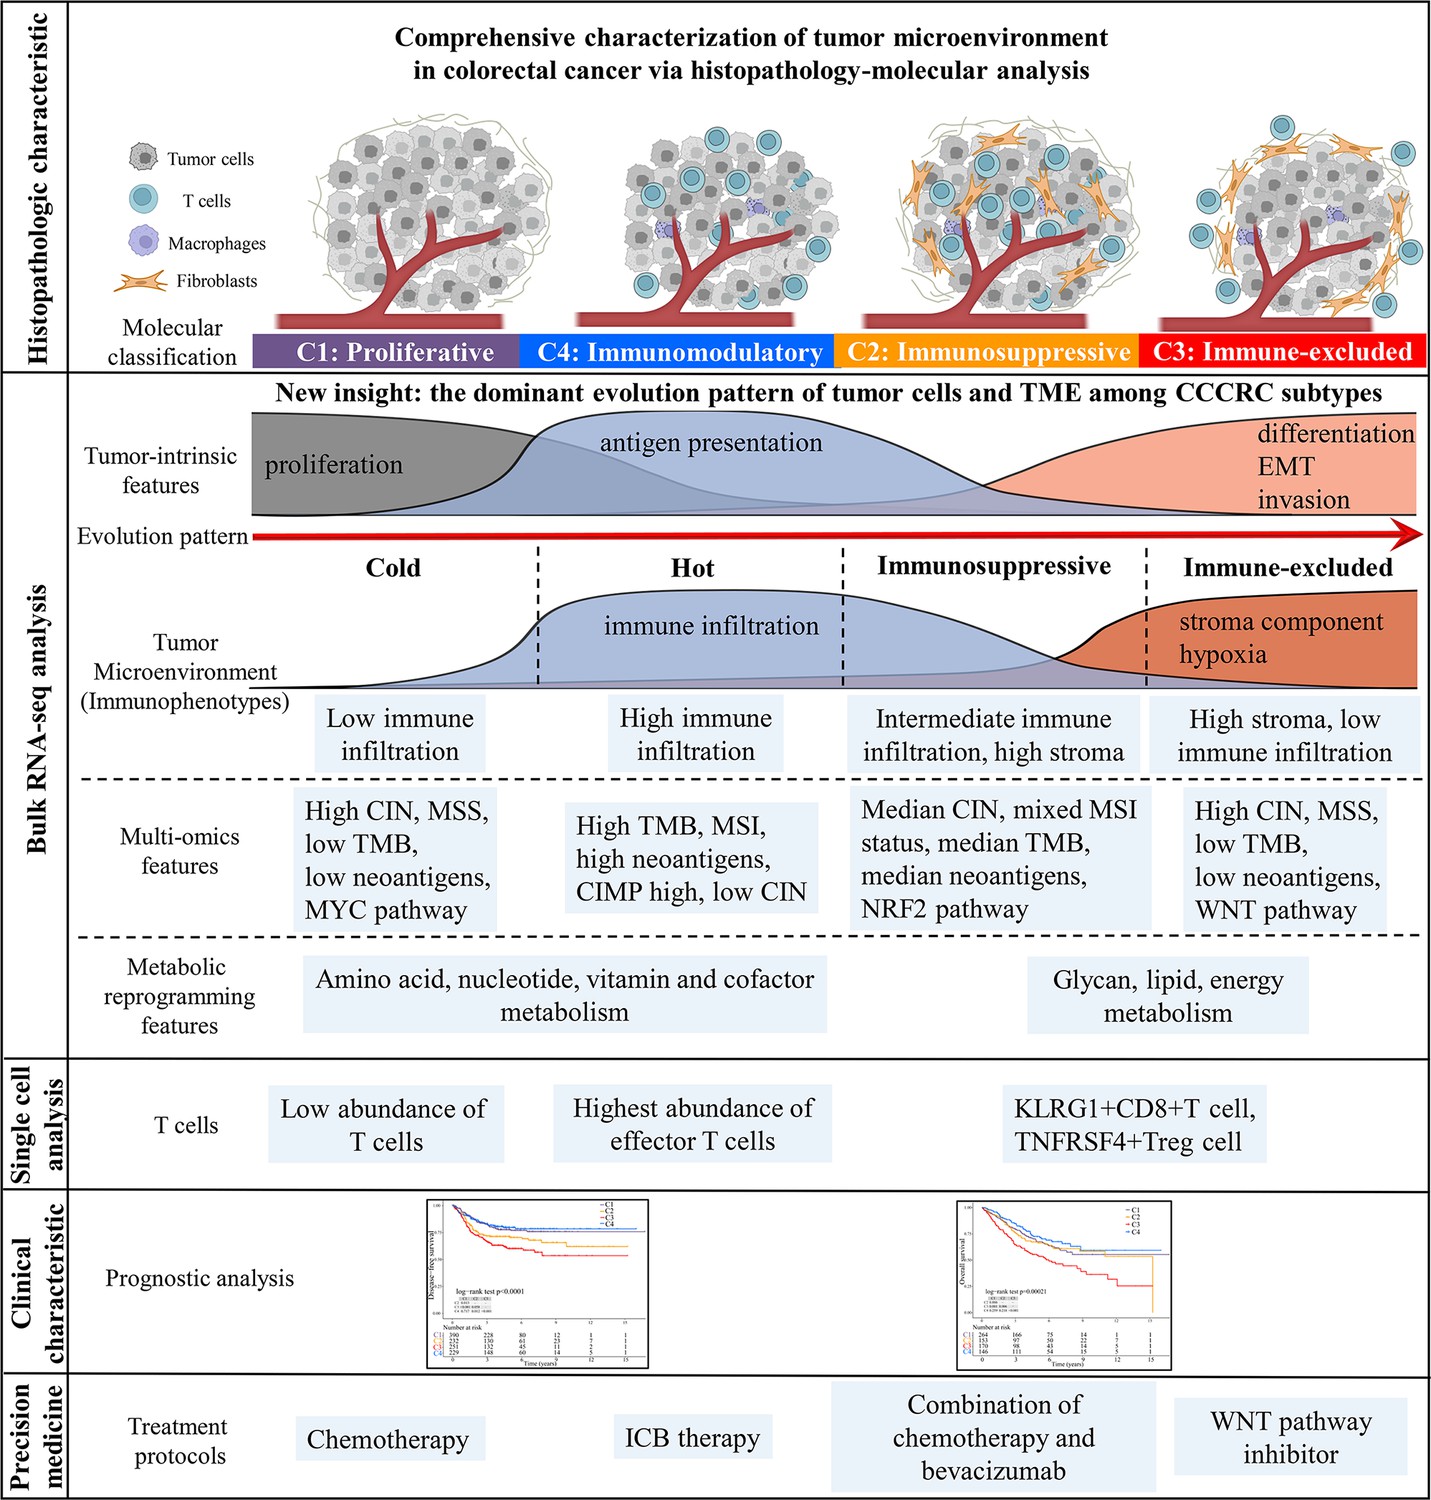
Overview of characteristics of comprehensive characterization of colorectal cancer (CCCRC) subtypes.
The graphical abstract summarizes histopathologic characteristics, tumor microenvironment features, multi-omics features, scRNAseq features, treatment strategies, and prognostic value for CCCRC subtypes.
Additional files
-
Supplementary file 1
Identification and validation of comprehensive characterization of colorectal cancer (CCCRC) classification.
(a) The 61 tumor microenvironment (TME)-related signatures used to comprehensively characterize CRC. (b) Overlapping genes between 61 TME-related signatures. (c) The datasets used to identify and validate of CCCRC classification. (d) Univariate cox analysis and Kaplan–Meier method showing the ability of the 61 TME-related signatures to predict disease-free survival and overall survival in the CRC-AFFY cohort. (e) Difference analysis of metabolism signature scores between the four CCCRC subtypes in the CRC-AFFY cohort. (f) The information of clinicopathological characteristics and CCCRC subtypes in the CRC-AFFY and CRC-RNAseq cohorts. (g) Associations between clinicopathological characteristics and CCCRC subtypes. (h) Multivariate Cox proportional hazard regression analysis for disease-free survival and overall survival adjusting for the CCCRC subtypes and clinicopathological characteristics in the combined cohort (the CRC-AFFY and CRC-RNAseq cohorts). (1) A total of 254 hematoxylin and eosin (HE)-stained whole-slide images used to evaluate histological characteristics of CCCRC subtypes.
- https://cdn.elifesciences.org/articles/86032/elife-86032-supp1-v2.xlsx
-
Supplementary file 2
The multi-omics analysis of the comprehensive characterization of colorectal cancer (CCCRC) subtypes.
(a) The different frequency of somatic mutations between the four CCCRC subtypes in TCGA-CRC dataset. The different frequency of somatic copy number alterations between the four CCCRC subtypes in TCGA-CRC dataset. (b) The fraction of altered samples per oncogenic pathway in each CCCRC subtype. (c) Lists of differentially expressed genes between each of the four subtypes and the remaining subtypes and between each subtype. (d) The correlation between all genes and the exclusion and dysfunction scores obtained from the Tumor Immune Dysfunction and Exclusion (TIDE) website. (e) Univariate cox analysis and Kaplan–Meier method showing the ability of 20 CCCRC genes to predict disease-free survival in the CRC-AFFY cohort. (f) A total of 7766T cells from 12 CRC patients in GSE108989 dataset. (g) The marker genes of the T cell clusters.
- https://cdn.elifesciences.org/articles/86032/elife-86032-supp2-v2.xlsx
-
Supplementary file 3
Clinical application of comprehensive characterization of colorectal cancer (CCCRC) classification system.
(a) The 335 CCCRC subtype-specific and cancer cell-intrinsic gene markers used to construct the pre-clinical model. (b) The 71 human colorectal cancer cell lines grouped according to CCCRC classification system. (c) A total of 80 upregulated subtype-specific genes used to construct the CCCRC classifier. (d) The performance of the CCCRC classifier in the CRC-AFFY and the CRC-RNAseq cohort. Lists of 86 human metabolism-related signatures, 10 oncogenic signatures and terminally exhausted T cell signature. (e) Transcription factors and chromatin modifiers in colorectal cancer. (f) Publicly available CRC molecular classification systems. (g) The datasets used to reveal the therapy strategies for four CCCRC subtypes.
- https://cdn.elifesciences.org/articles/86032/elife-86032-supp3-v2.xlsx
-
MDAR checklist
- https://cdn.elifesciences.org/articles/86032/elife-86032-mdarchecklist1-v2.docx
Download links
A two-part list of links to download the article, or parts of the article, in various formats.
Downloads (link to download the article as PDF)
Open citations (links to open the citations from this article in various online reference manager services)
Cite this article (links to download the citations from this article in formats compatible with various reference manager tools)
Comprehensive characterization of tumor microenvironment in colorectal cancer via molecular analysis
eLife 12:e86032.
https://doi.org/10.7554/eLife.86032


