An antagonism between Spinophilin and Syd-1 operates upstream of memory-promoting presynaptic long-term plasticity
- Institute for Biology/Genetics, Freie Universität Berlin, Germany
- Leibniz-Forschungsinstitut für Molekulare Pharmakologie, Germany
Figures
Figure 1 with 2 supplements
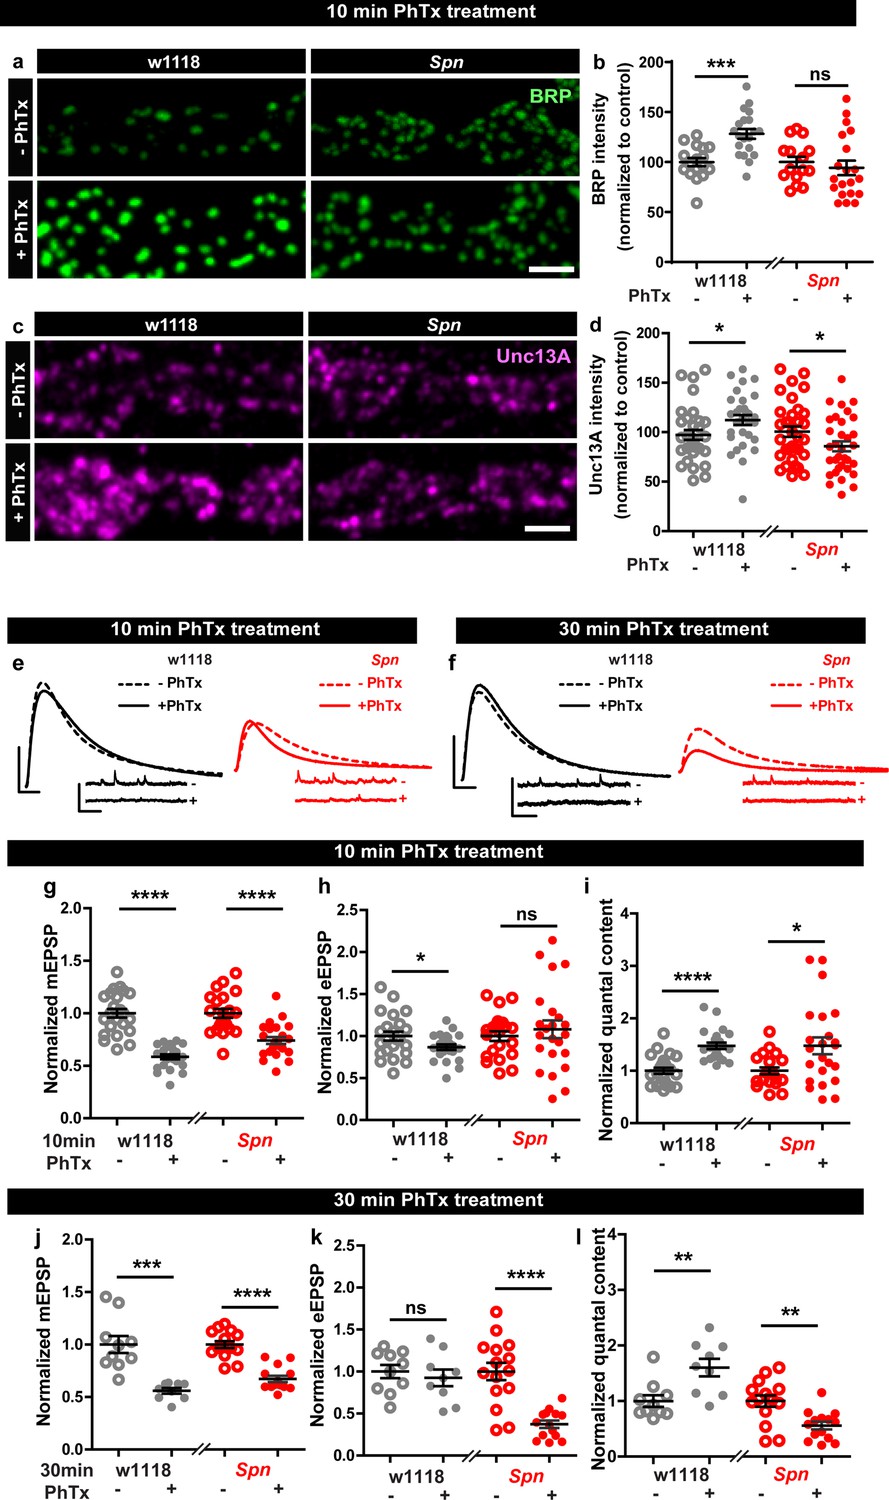
Presynaptic Spinophilin functions to sustain homeostatic plasticity through active zone remodeling.
(a,c) Representative images of third-instar larval muscle 4 NMJs immunostained with antibodies against BRP and Unc13A. Scale bars: 2 µm. (a,d) Control animals show an increase in BRP and Unc13A levels upon PhTx treatment while Spn mutants do not (b,d) mean BRP and Unc13A intensities measured through confocal imaging. (e,f) Representative traces of eEJP and mEJP measurements at third-instar larval muscle 6/7 NMJs. Scale bars: eEJP, 10 ms, 10 mV; mEJP traces 500 ms, 5 mV. (g,j) mEJP amplitudes are reduced upon PhTx treatment. eEJP amplitudes are compensated (h) and QC is increased (i) in control and Spn mutants upon 10 min PhTx treatment. eEJP amplitudes are compensated (k) and QC is increased (l) in control but not Spn mutants upon 30 min PhTx treatment. Also see Figure 1—figure supplements 1 and 2. Source data as exact normalized and raw values, detailed statistics including sample sizes and P values are provided in Figure 1—source data 1. *p ≤ 0.05; **p ≤ 0.01; ***p ≤ 0.001; n.s., not significant, p > 0.05. All panels show mean ± s.e.m.
-
Figure 1—source data 1
Table containing exact values for the data depicted in Figure 1, along with details of statistical analyses.
- https://cdn.elifesciences.org/articles/86084/elife-86084-fig1-data1-v2.xlsx
Figure 1—figure supplement 1
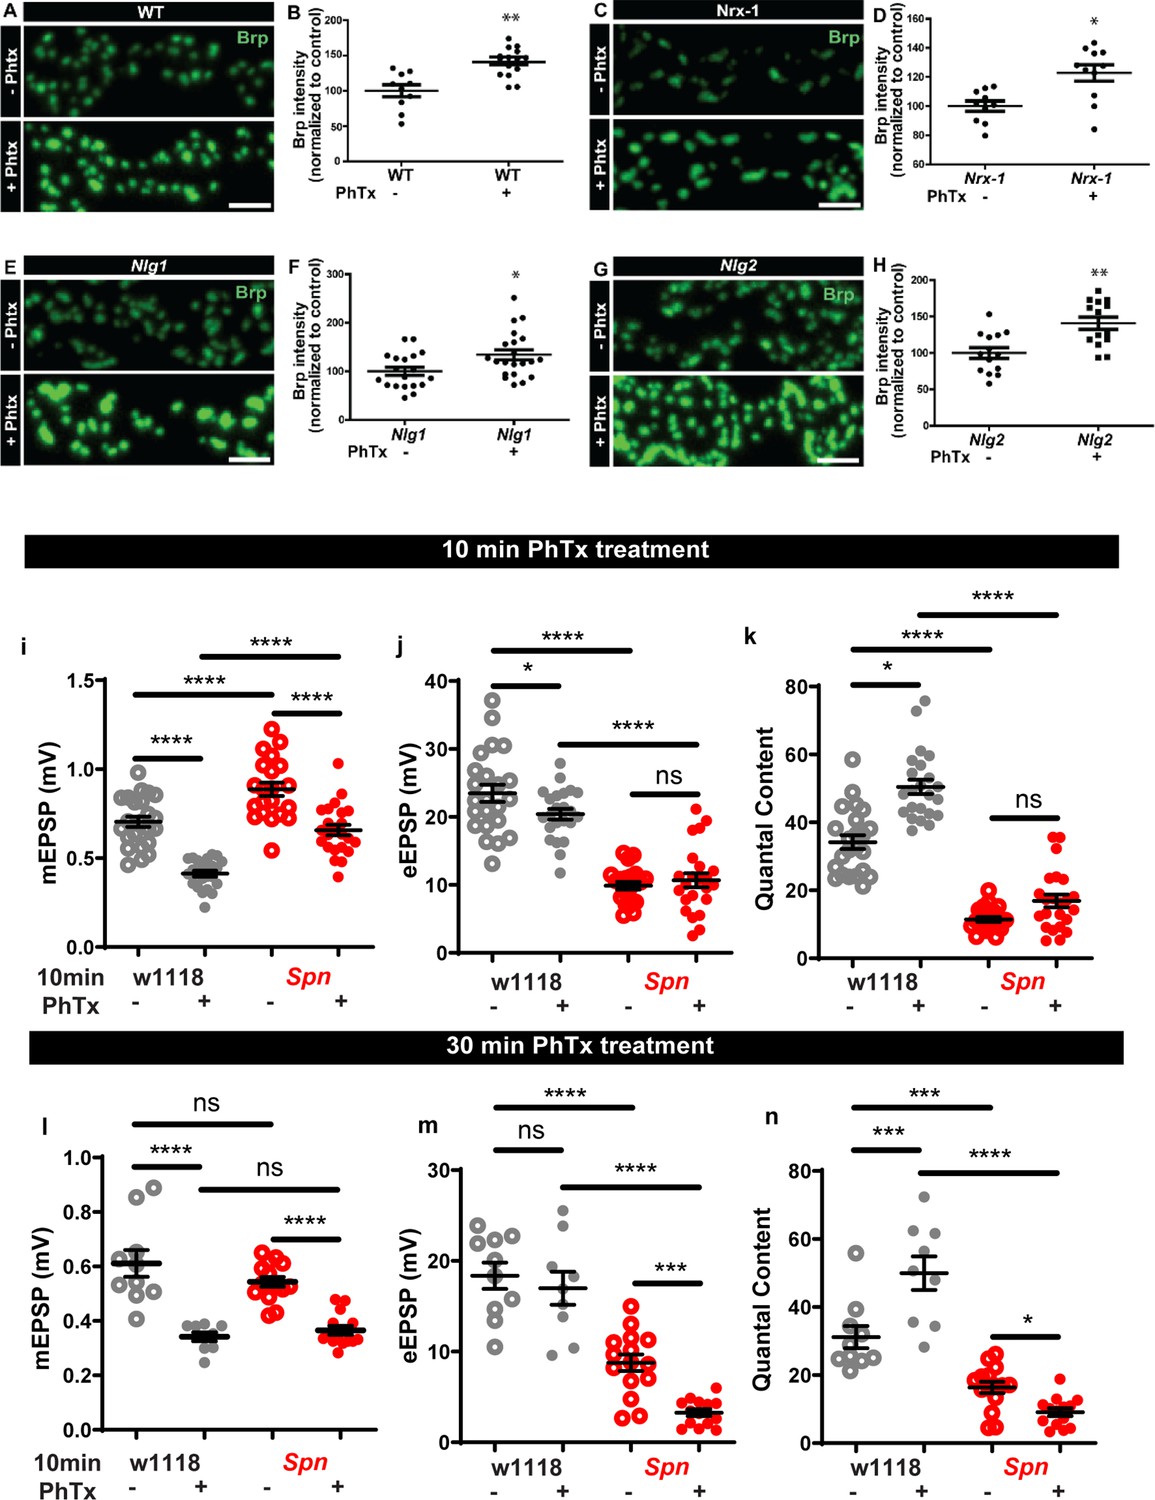
Nrx-1, Nlg1 and Nlg2 mutants undergo homeostatic plasticity, while Spn mutants cannot sustain homeostatic plasticity.
(a–h) Wildtype, Nrx-1, Nlg1, and Nlg2 mutants all show normal BRP increase upon PhTx treatment. (i–k) Graphs of raw values corresponding to Figure 1e and g–I (l-n) Graphs of raw values corresponding to Figure 1f and j–l. Source data as exact normalized and raw values, detailed statistics including sample sizes and p values are provided in Figure 1—figure supplement 1—source data 1. *p≤0.05; **p ≤ 0.01; ***p ≤ 0.001; n.s., not significant, p > 0.05. All panels show mean ± s.e.m.
-
Figure 1—figure supplement 1—source data 1
Table containing exact values for the data depicted in Figure 1—figure supplement 1, along with details of statistical analyses.
- https://cdn.elifesciences.org/articles/86084/elife-86084-fig1-figsupp1-data1-v2.xlsx
Figure 1—figure supplement 2
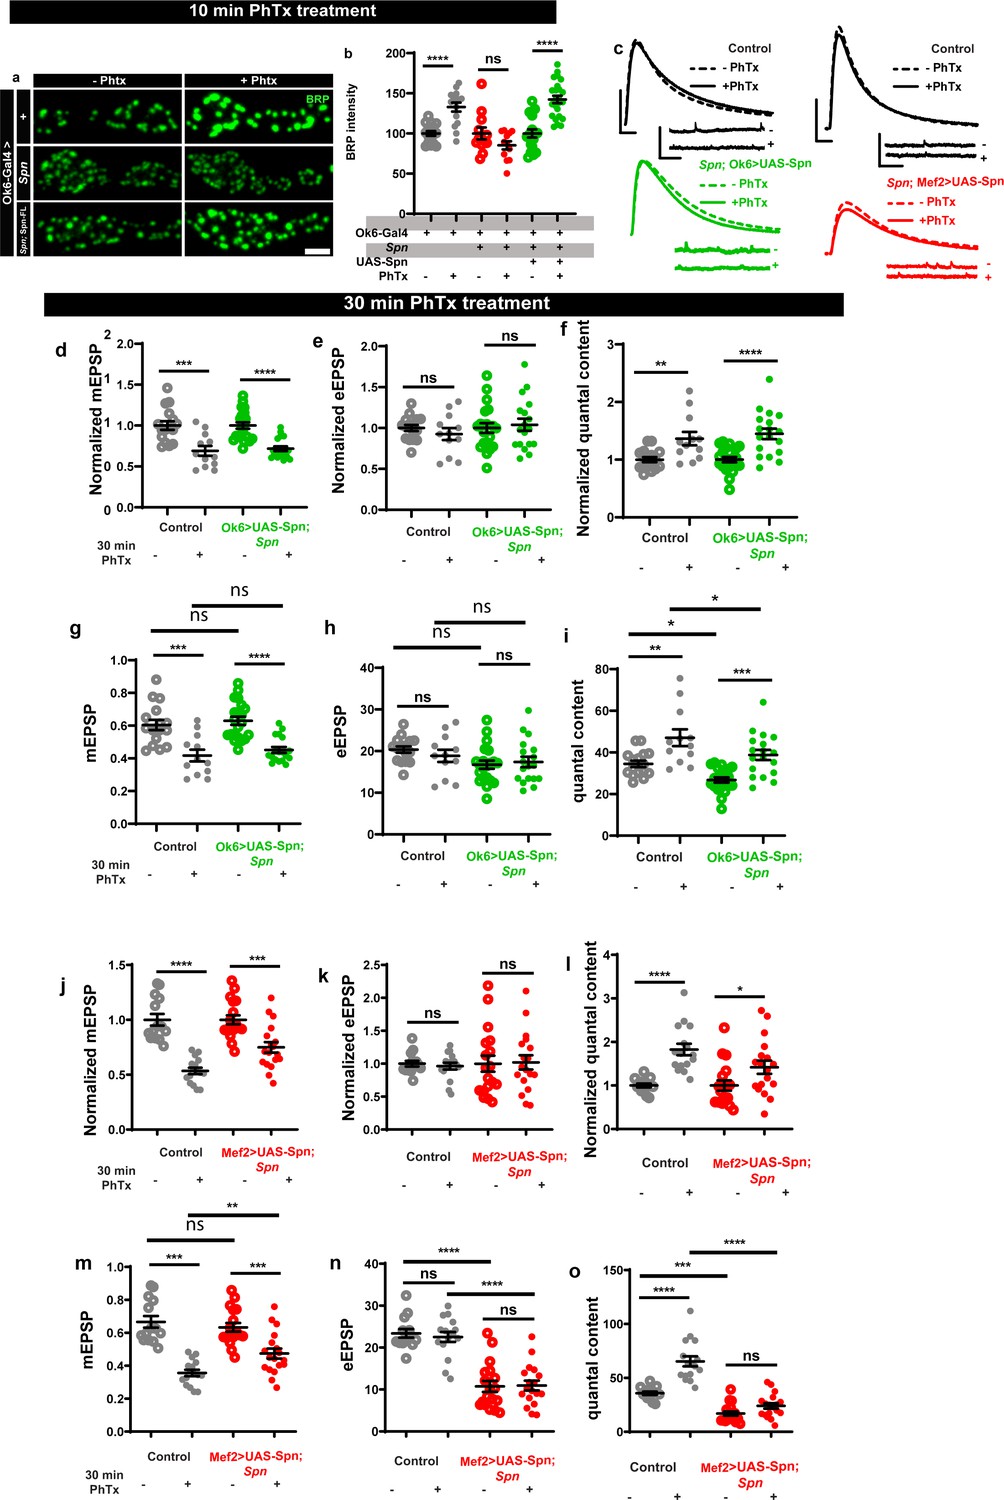
Presynaptic Spinophilin is sufficient to sustain homeostatic plasticity.
(c) Representative traces of mEJP and eEJP measurements at third-instar larval muscle 6/7 NMJs. Scale bars: eEJP, 10ms, 10 mV; mEJP traces 500ms, 5 mV. (d,g,j,m) mEPSP amplitudes are lower upon PhTx treatment. (e–f, h–i) Presynaptic motoneuronal expression of full-length Spn reinstates functional plasticity upon PhTx treatment in Spn mutants. Both normalized and raw values have been graphed. (k–l, n–o) Postsynaptic muscle expression of full-length Spn results in moderate functional plasticity upon PhTx treatment in Spn mutants. Both normalized and raw values have been graphed. Source data as exact normalized and raw values, detailed statistics including sample sizes and p values are provided in Figure 1—figure supplement 2—source data 1. *p≤0.05; **p ≤ 0.01; ***p ≤ 0.001; n.s., not significant, p > 0.05. All panels show mean ± s.e.m.
-
Figure 1—figure supplement 2—source data 1
Table containing exact values for the data depicted in Figure 1—figure supplement 2, along with details of statistical analyses.
- https://cdn.elifesciences.org/articles/86084/elife-86084-fig1-figsupp2-data1-v2.xlsx
Figure 2 with 1 supplement
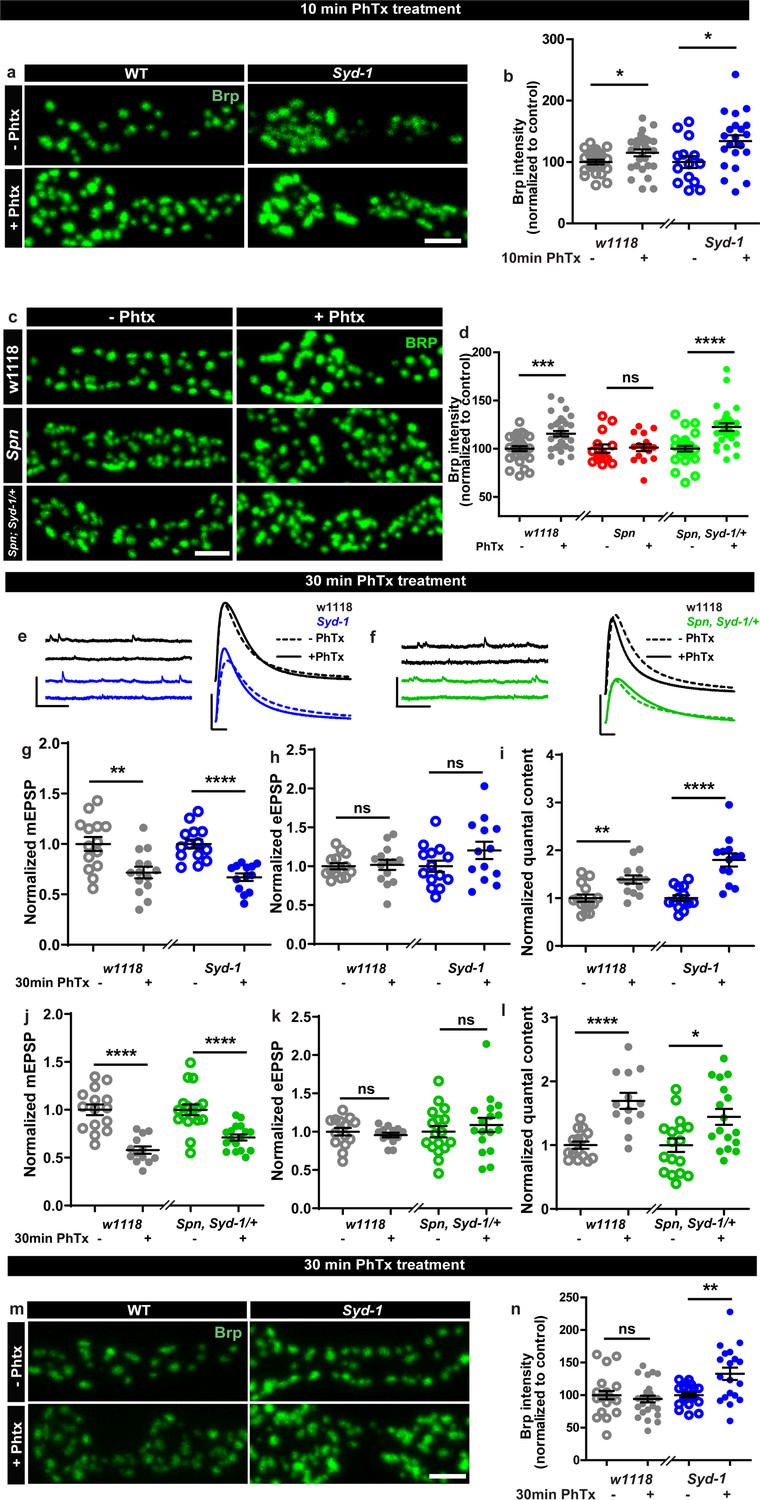
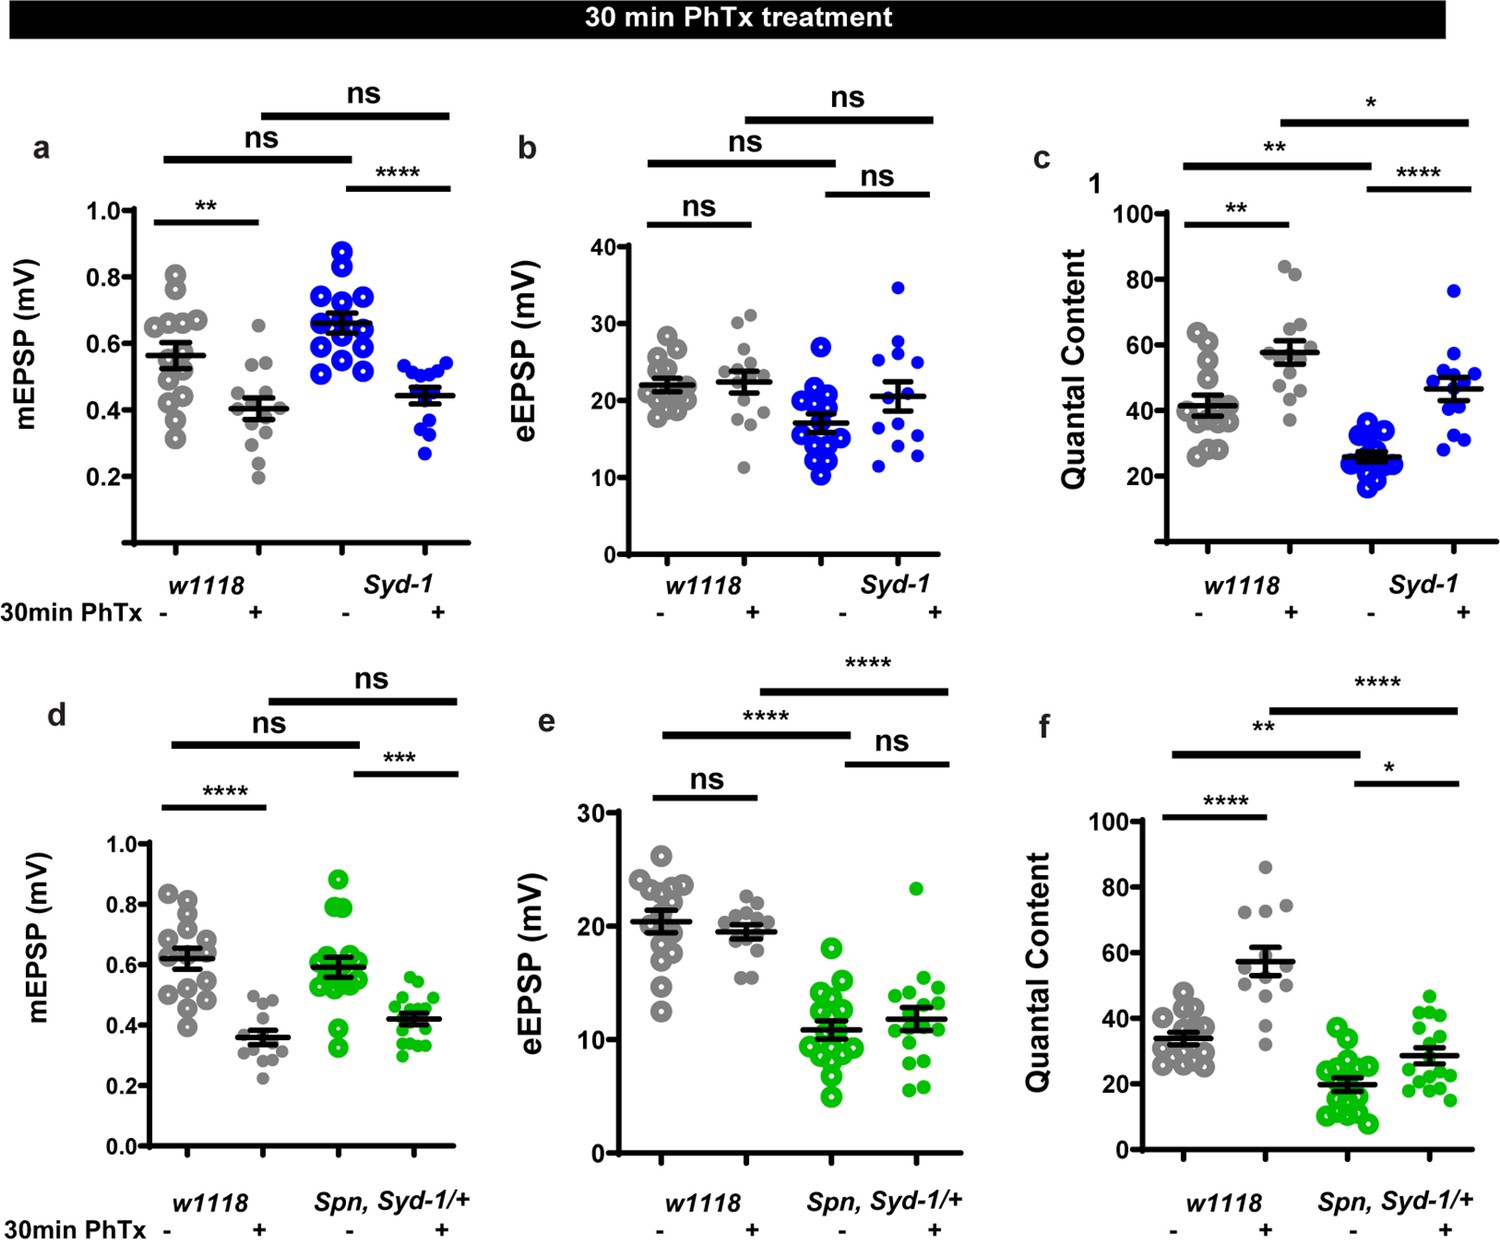
Spinophilin/Syd-1 antagonism controls active zone structural remodeling and functional plasticity.
(a,c,m) Representative images of third-instar larval muscle 4 NMJs immunostained with an antibody against BRP. Scale bars: 2 µm. (a–b) Control and Syd-1 mutant animals show an increase in BRP upon 10 min PhTx treatment (c–d) Removing a single syd-1 gene copy from Spn mutants (Spn,Syd-1/+) reinstates the BRP increase upon 10 min PhTx treatment (b,d) mean BRP intensities measured through confocal imaging. (e,f) Representative traces of mEJP and eEJP measurements at third-instar larval muscle 6/7 NMJs. Scale bars: eEJP, 10 ms, 10 mV; mEJP traces 500 ms, 5 mV. (g,j) mEJP amplitudes are reduced upon PhTx treatment. eEJP amplitudes are compensated (h) and QC is increased (i) in control and Syd-1 mutants upon 30 min PhTx treatment. eEJP amplitudes are compensated (k) and QC is increased (l) in control and single copy syd-1 in Spn (Spn,Syd-1/+) mutants upon 30 min PhTx treatment. (m–n) Syd-1 mutant animals continue to show an increase in BRP upon 30 min PhTx treatment, while controls do not. Also see Figure 2—figure supplement 1. Source data as exact normalized and raw values, detailed statistics including sample sizes and P values are provided in Figure 2—source data 1. *p ≤ 0.05; **p ≤ 0.01; ***p ≤ 0.001; n.s., not significant, p > 0.05. All panels show mean ± s.e.m.
-
Figure 2—source data 1
Table containing exact values for the data depicted in Figure 2, along with details of statistical analyses.
- https://cdn.elifesciences.org/articles/86084/elife-86084-fig2-data1-v2.xlsx
Figure 2—figure supplement 1
Spinophilin/Syd-1 antagonism sustains homeostatic plasticity.
(a–c) Raw values corresponding to Figure 2e and g–i. (d-f) Graphs of raw values corresponding to Figure 2f and j–l. Source data as exact normalized and raw values, detailed statistics including sample sizes and p values are provided in Figure 2—figure supplement 1—source data 1. *p≤0.05; **p ≤ 0.01; ***p ≤ 0.001; n.s., not significant, p > 0.05. All panels show mean ± s.e.m.
-
Figure 2—figure supplement 1—source data 1
Table containing exact values for the data depicted in Figure 2—figure supplement 1, along with details of statistical analyses.
- https://cdn.elifesciences.org/articles/86084/elife-86084-fig2-figsupp1-data1-v2.xlsx
Figure 3 with 1 supplement
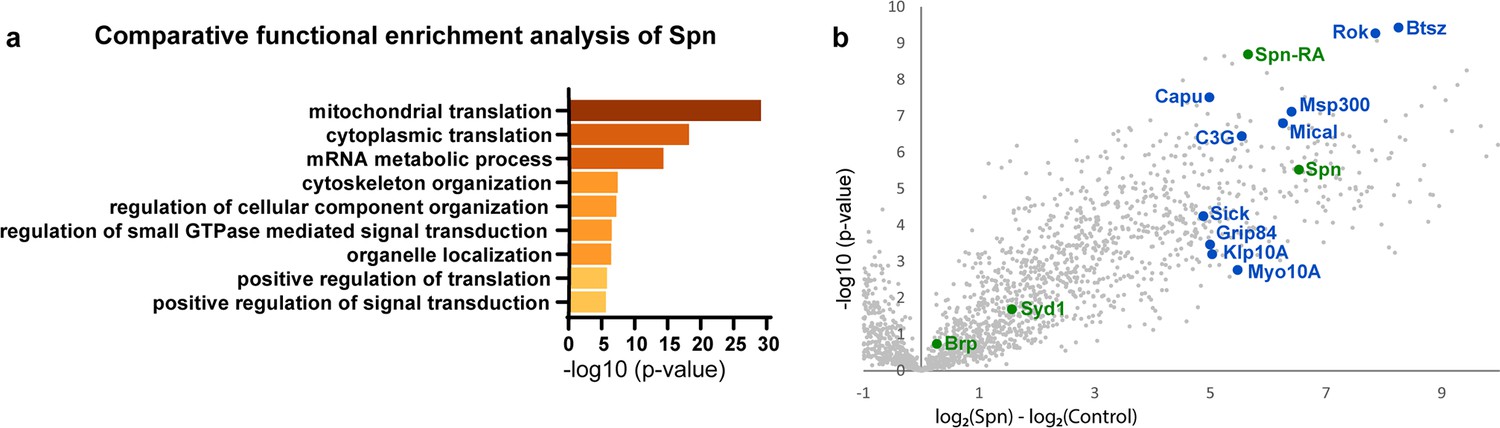
Spinophilin co-immunoprecipitates cytoskeleton remodelers.
(a) Comparative functional enrichment analysis of Spn interactomes suggested that Spn was specifically associated with proteins involved in translation control and cytoskeleton organization. (b) Spn coimmunoprecipitated various regulators of F-actin dynamics. Also see Figure 3—figure supplement 1 for influence of translation on PhTx-induced PHP.
Figure 3—figure supplement 1
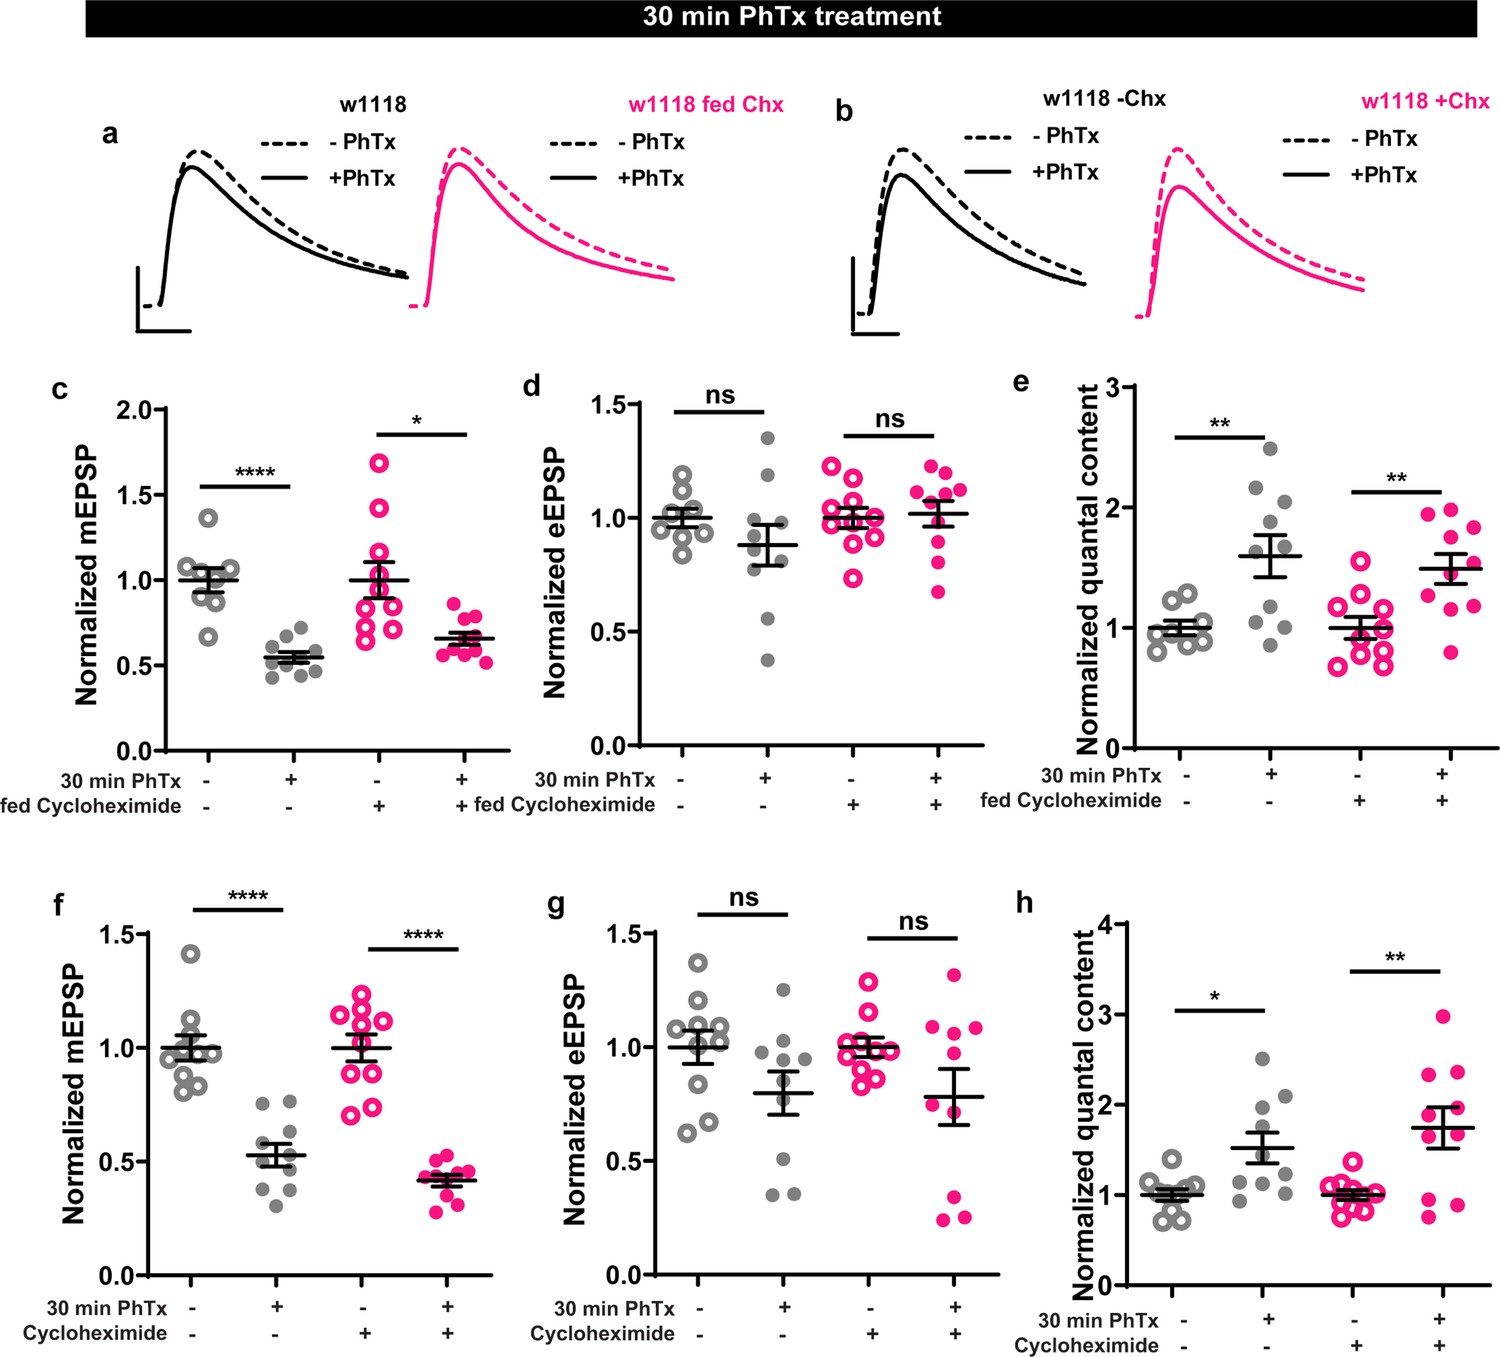
Cycloheximide, a translation elongation blocker, does not affect homeostatic plasticity.
(a,b) Representative traces of mEJP and eEJP measurements at third-instar larval muscle 6/7 NMJs. Scale bars: eEJP, 10ms, 10 mV; mEJP traces 500ms, 5 mV. (c–h) Larvae treated with Cycloheximide or fed with cycloheximide could still respond normally to PhTx treatment with an increase in quantal content. Source data as exact normalized and raw values, detailed statistics including sample sizes and p values are provided in Figure 3—figure supplement 1—source data 1. *p≤0.05; **p ≤ 0.01; ***p ≤ 0.001; n.s., not significant, p > 0.05. All panels show mean ± s.e.m.
-
Figure 3—figure supplement 1—source data 1
Table containing exact values for the data depicted in Figure 3—figure supplement 1, along with details of statistical analyses.
- https://cdn.elifesciences.org/articles/86084/elife-86084-fig3-figsupp1-data1-v2.xlsx
Figure 4 with 1 supplement
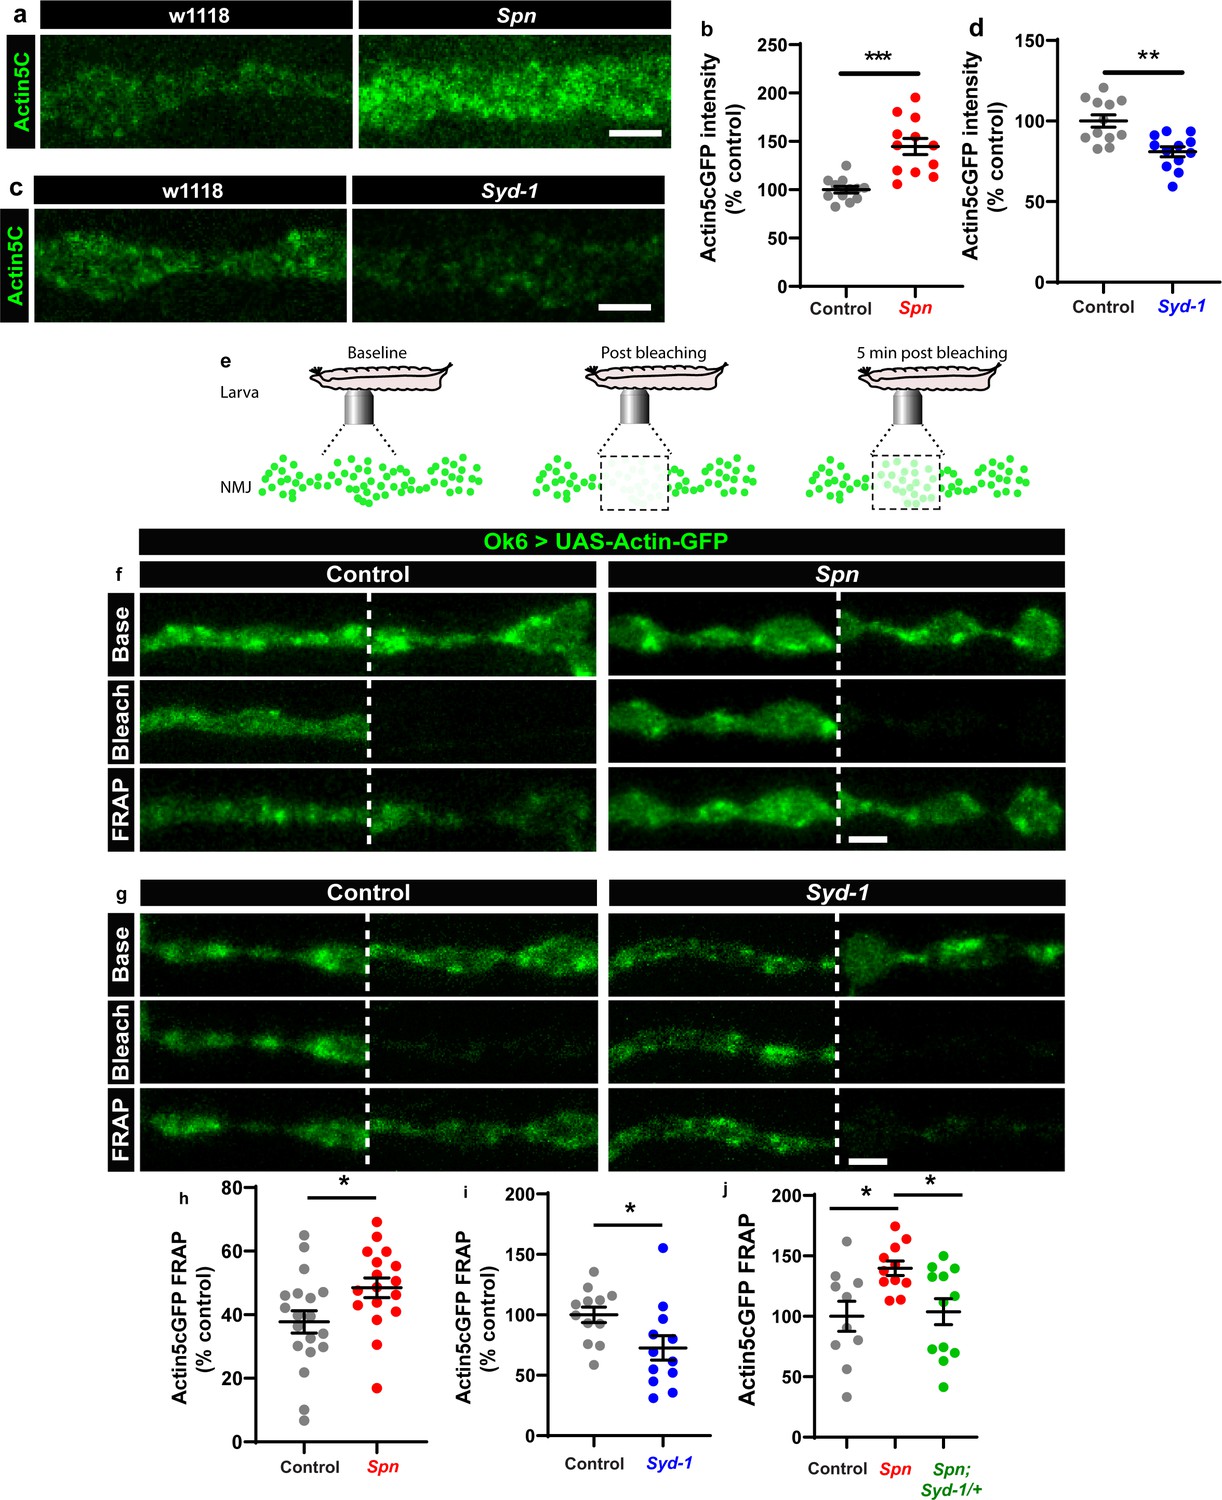
The Spinophilin/Syd-1 antagonism converges on presynaptic F-actin dynamics.
(a,c) Representative images of third-instar larval muscle 4 NMJs showing intrinsic Actin-GFP. Scale bars: 2 µm. (a–d) Spn mutants show an increase in Actin-GFP intensity while Syd-1 mutants show a decrease compared to controls. (b,d) mean actin-GFP intensities measured through confocal imaging. (e) Scheme depicting in vivo fluorescence recovery after photobleaching (FRAP) imaging procedure at developing Drosophila larval NMJs at baseline (before photobleaching), immediately post bleaching and then again after 5min to track recovery of fluorescently labelled protein. (f–g) Representative images of muscle 26/27 NMJs labelled with Actin5CGFP. Quantification of FRAP shows Actin5CGFP at the NMJ (h) increase in Spn mutants, (i) decrease in Syd-1 mutants and (j) a rescue of Spn mutant phenotype on removal of a single gene copy of Syd-1 (Spn,Syd-1/+). Also see Figure 4—figure supplement 1. Source data as exact normalized and raw values, detailed statistics including sample sizes and p values are provided in Figure 4—source data 1. *p ≤ 0.05; **p ≤ 0.01; ***p ≤ 0.001; n.s., not significant, p > 0.05. All panels show mean ± s.e.m.
-
Figure 4—source data 1
Table containing exact values for the data depicted in Figure 4, along with details of statistical analyses.
- https://cdn.elifesciences.org/articles/86084/elife-86084-fig4-data1-v2.xlsx
Figure 4—figure supplement 1
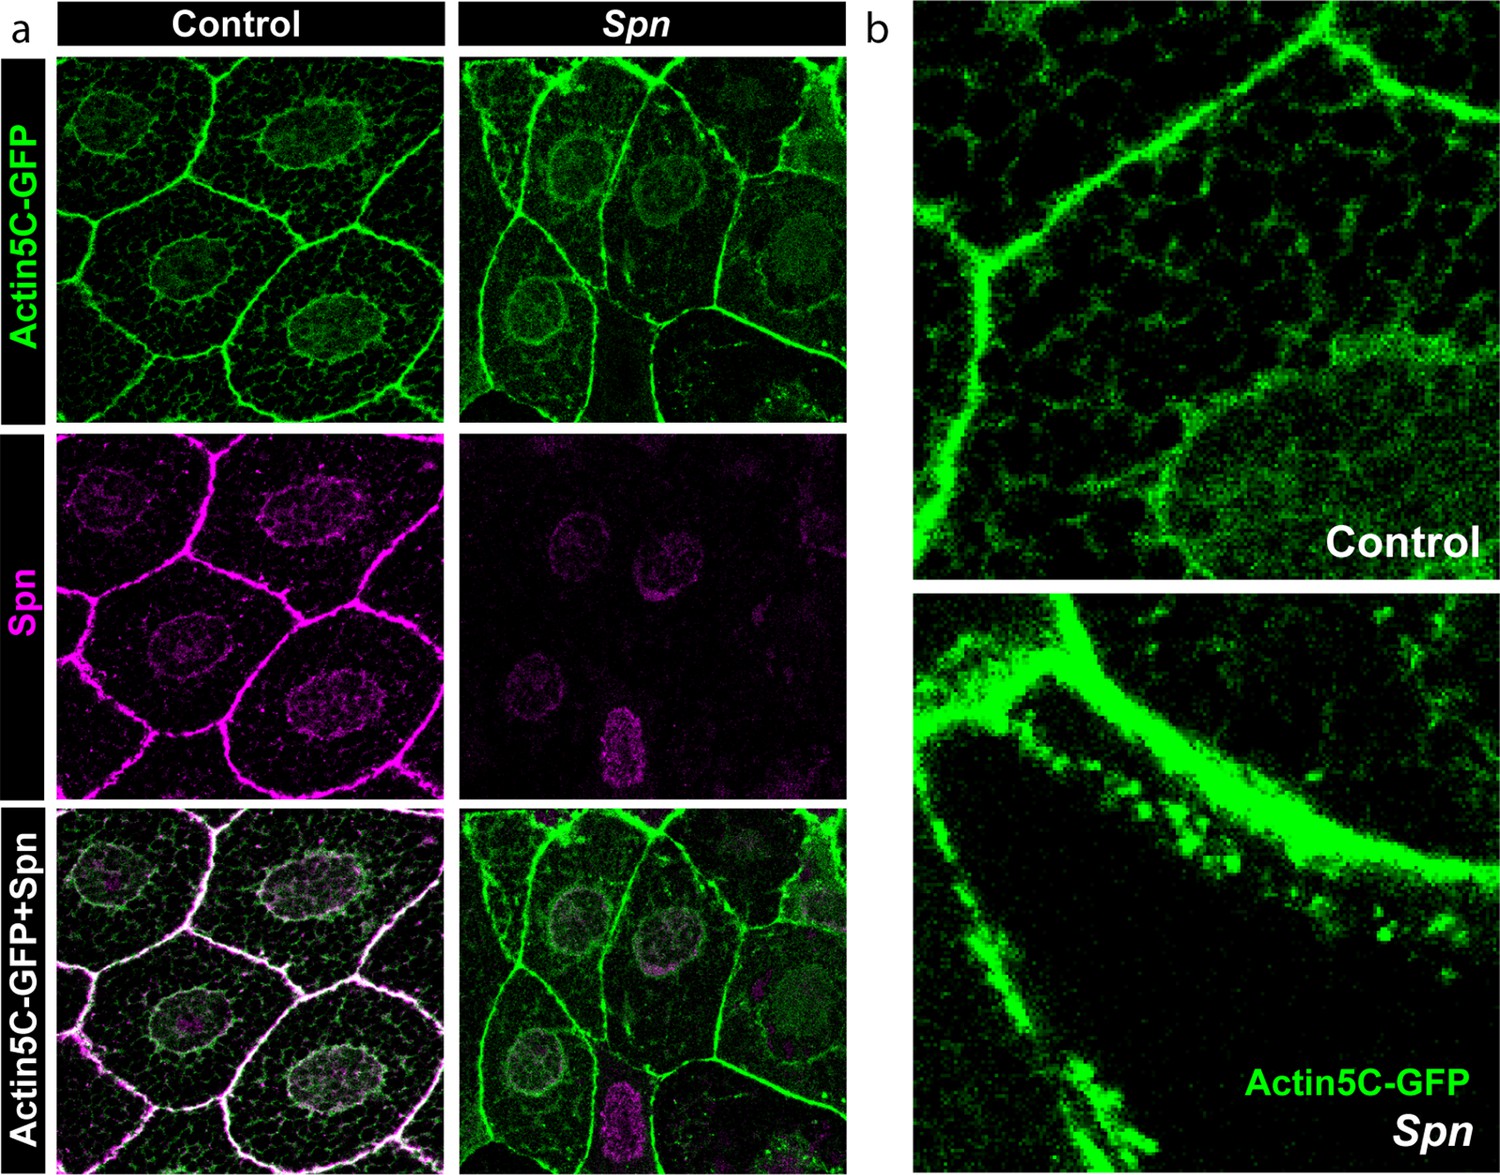
Spinophilin and actin colocalize in salivary gland cell cortices.
(a) Salivary gland cells show a colocalization of Actin-GFP and Spn at the membranes. (b) Spn mutants show an unusual accumulation of Actin-GFP at the membrane and in the cell bodies.
Figure 5 with 1 supplement
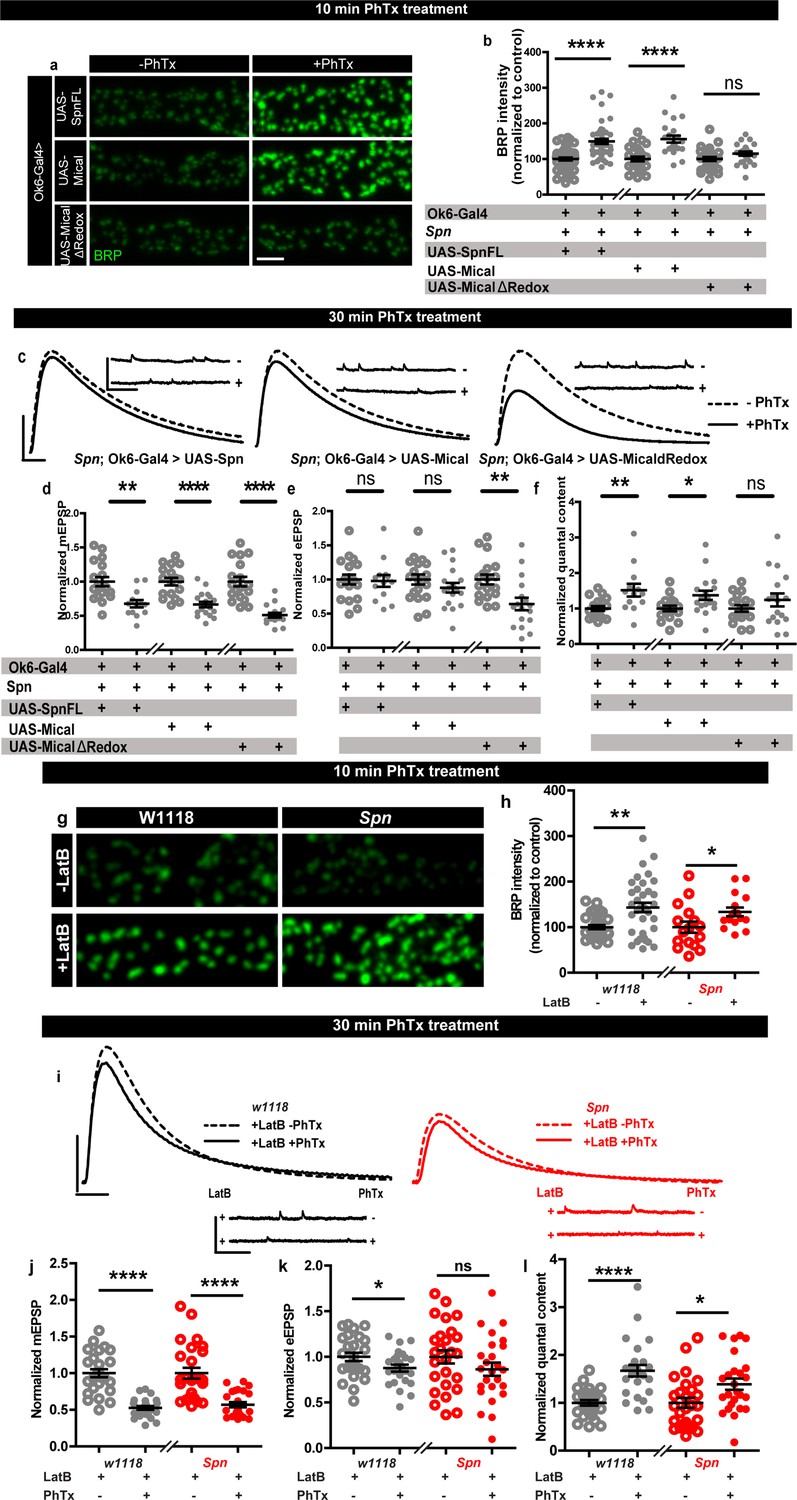
Rescue of Spinophilin plasticity deficits after genetic and pharmacological disruption of F-actin.
(a,g) Representative images of third-instar larval muscle 4 NMJs immunostained with an antibody against BRP. Scale bars: 2 µm. (a–b) motoneuronal expression of full-length Spn and Mical in Spn mutant background reinstates BRP increase upon PhTx treatment, while MicalΔRedox expression does not. (g–h) Latrunculin-B (LatB) treatment results in an increase in BRP in both control and Spn mutants. (B,H) mean BRP intensities measured through confocal imaging. (c,i) Representative traces of mEJP and eEJP measurements at third-instar larval muscle 6/7 NMJs. Scale bars: eEJP, 10ms, 10 mV; mEJP traces 500ms, 5 mV. (d,j) mEJP amplitudes are reduced upon PhTx treatment. eEJP amplitudes are compensated (e) and QC is increased (f) in motoneuronal expression of full-length Spn and Mical in Spn mutant background upon 30 min PhTx treatment but not in MicalΔRedox. eEJP amplitudes are compensated (k) and QC is increased (l) in control animals and Spn mutants treated with LatB. Also see Figure 5—figure supplement 1. Source data as exact normalized and raw values, detailed statistics including sample sizes and p values are provided in Figure 5—source data 1. *p≤0.05; **p ≤ 0.01; ***p ≤ 0.001; n.s., not significant, p > 0.05. All panels show mean ± s.e.m.
-
Figure 5—source data 1
Table containing exact values for the data depicted in Figure 5, along with details of statistical analyses.
- https://cdn.elifesciences.org/articles/86084/elife-86084-fig5-data1-v2.xlsx
Figure 5—figure supplement 1
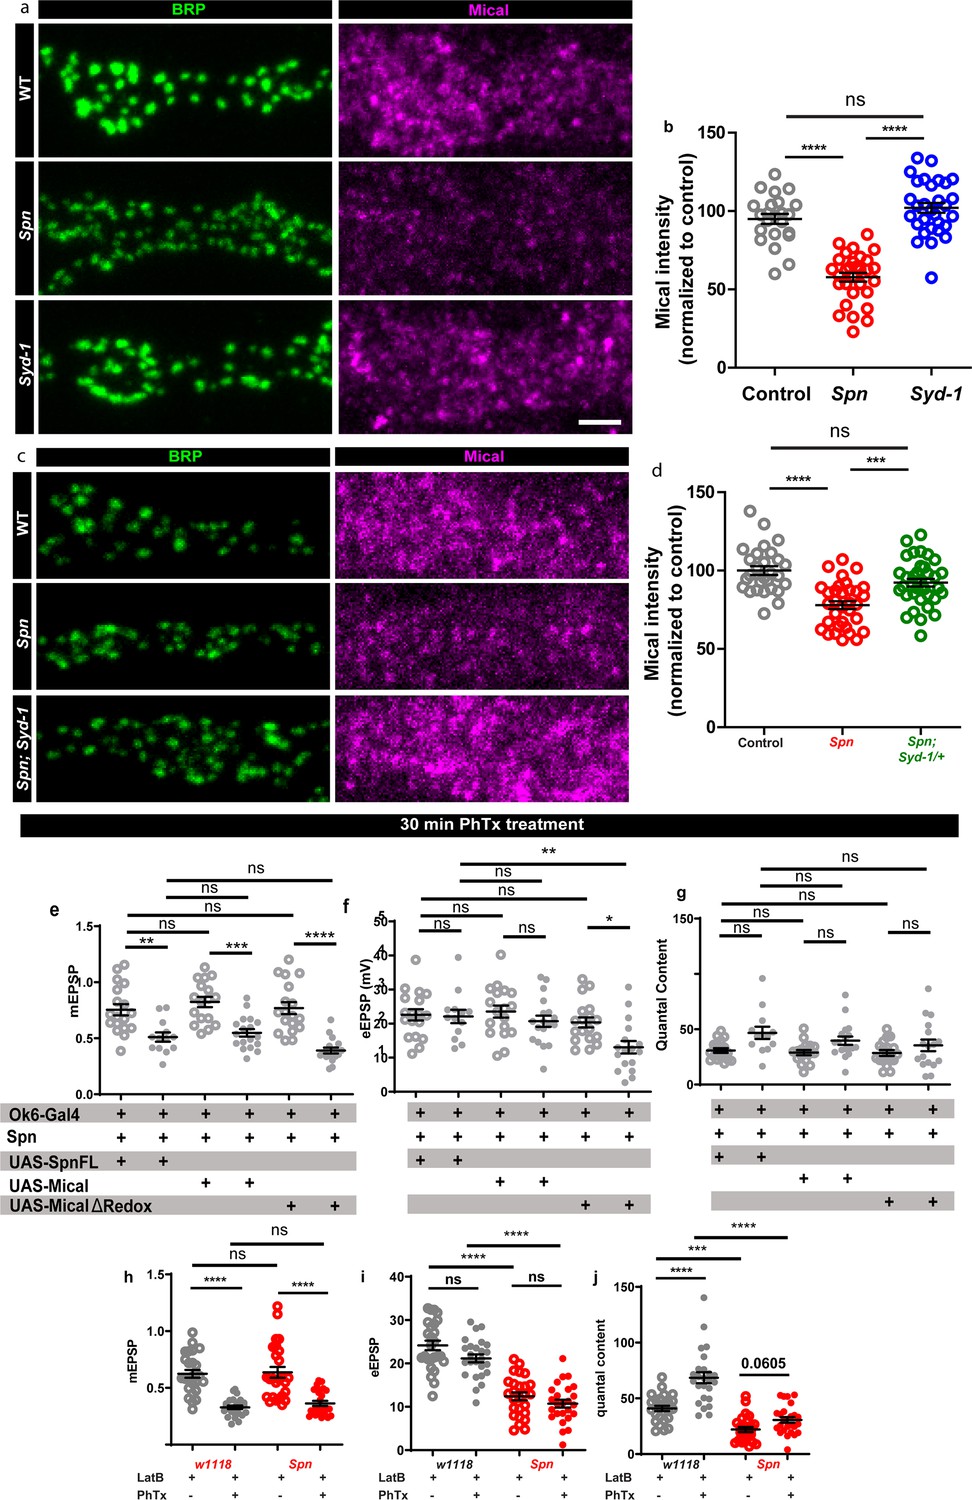
Actin depolymerization via Mical could underlie Spinophilin-mediated homeostatic plasticity.
(a–b) Spn mutants show a reduction in Mical levels at the NMJ compared to controls, while Syd-1 mutants show levels comparable to controls. (c–d) Spn mutants show a reduction in Mical levels at the NMJ compared to controls, while Spn mutants with syd-1 heterozygosity show levels comparable to controls. (e–g) Graphs of raw values corresponding to Figure 5c–f. (h–j) Graphs of raw values corresponding to Figure 5i–l. Source data as exact normalized and raw values, detailed statistics including sample sizes and p values are provided in Figure 5—figure supplement 1—source data 1. *p≤0.05; **p ≤ 0.01; ***p ≤ 0.001; n.s., not significant, p > 0.05. All panels show mean ± s.e.m.
-
Figure 5—figure supplement 1—source data 1
Table containing exact values for the data depicted in Figure 5—figure supplement 1, along with details of statistical analyses.
- https://cdn.elifesciences.org/articles/86084/elife-86084-fig5-figsupp1-data1-v2.xlsx
Figure 6 with 1 supplement
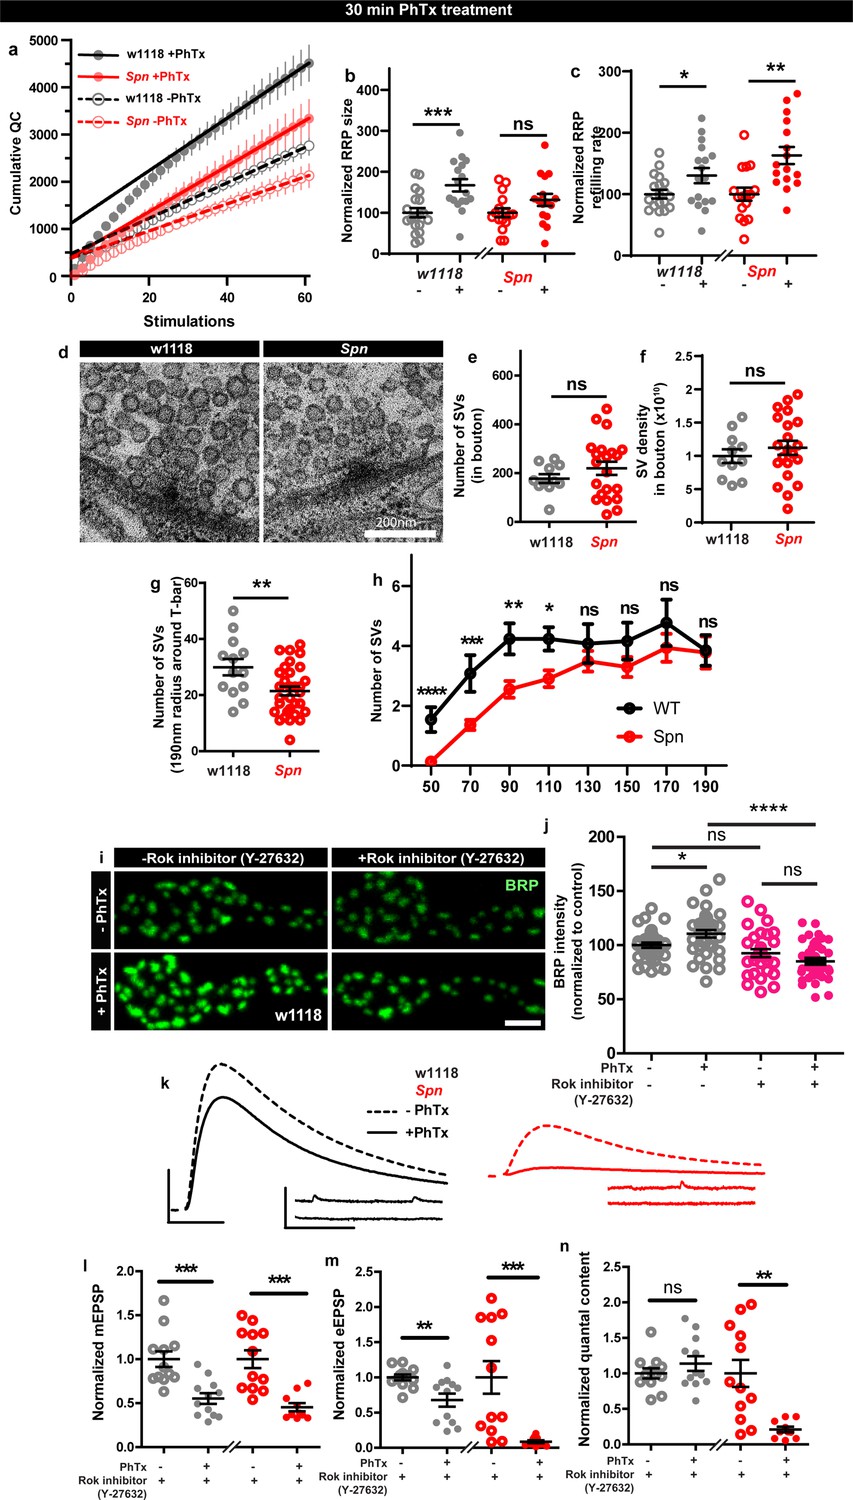
Spinophilin facilitates plastic increases in release-ready vesicle pool size.
Quantification of the RRP size (b) and RRP refilling rate (c) from (a) Average cumulative quantal content plotted against the number of stimulations with linear regression of the steady state amplitudes. (d) Representative electron microscopy images of control showing normal SV distribution and Spn mutants showing sparse SV distribution around the AZ T-bar. Spn mutants have a normal number of SVs in the bouton quantified in (e) absolute number of SVs and (f) SV density in bouton, but have (g) fewer SVs in the vicinity of the AZs. (h) SVs distribution at increasing distance from the center of the AZ shows that Spn mutants have fewer SVs near the AZ center, but have normal numbers of SVs further away from the AZ center. (i) Representative images of third-instar larval muscle 4 NMJs immunostained with an antibody against BRP. Scale bars: 2 µm. (j) Preincubating larvae with Rok inhibitor results in their inability to upregulate BRP upon PhTx treatment. (k) Representative traces of mEJP and eEJP measurements at third-instar larval muscle 6/7 NMJs. Scale bars: eEJP, 10ms, 10 mV; mEJP traces 500ms, 5 mV. (l) mEJP amplitudes are reduced upommican PhTx treatment. Upon PhTx treatment, eEJP amplitudes are not compensated (m) and QC does not increase (n) in Rok-inhibitor treated controls and Spn mutants. Also see Figure 6—figure supplement 1. Source data as exact normalized and raw values, detailed statistics including sample sizes and p values are provided in Figure 6—source data 1. *p≤0.05; **p ≤ 0.01; ***p ≤ 0.001; n.s., not significant, p > 0.05. All panels show mean ± s.e.m.
-
Figure 6—source data 1
Table containing exact values for the data depicted in Figure 6, along with details of statistical analyses.
- https://cdn.elifesciences.org/articles/86084/elife-86084-fig6-data1-v2.xlsx
Figure 6—figure supplement 1
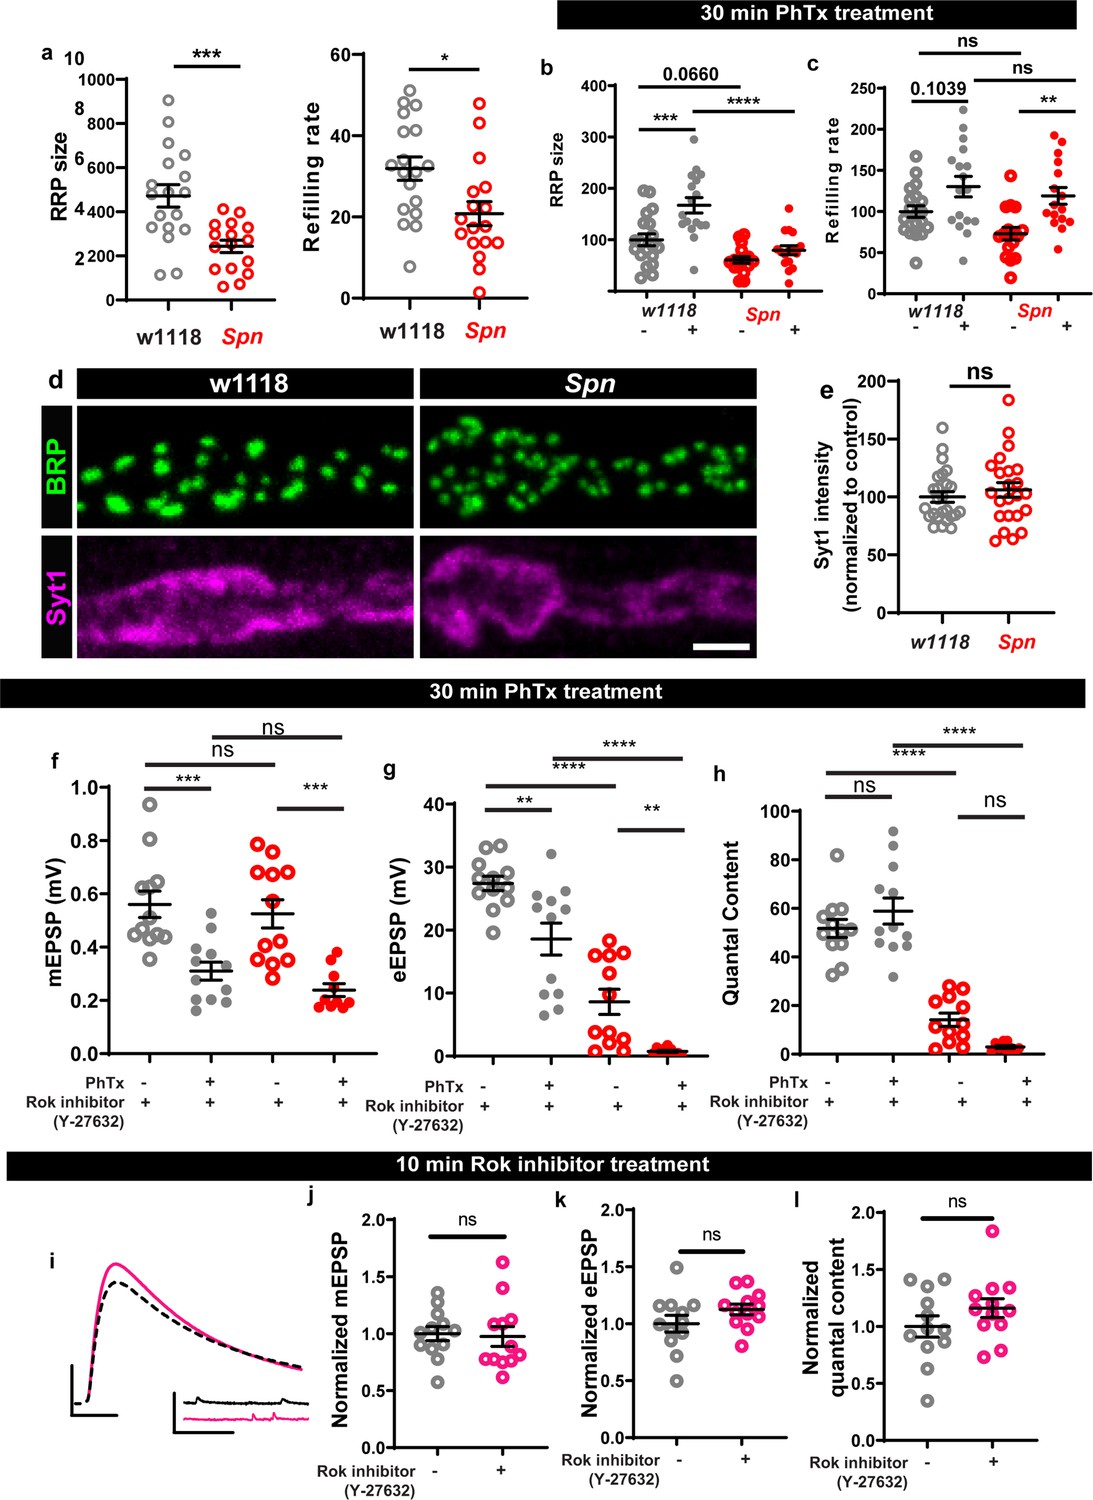
Spinophilin facilitates RRP increase during sustained homeostatic plasticity.
(a) Spn mutants have lower RRP size and refilling rates compared to wildtype controls. (b–c) Graphs of raw values corresponding to Figure 6b–c. (d-e) Syt1 levels are unaltered in Spn mutants compared to controls. (f–h) Graphs of raw values corresponding to Figure 6k–n. (i) Representative traces of mEJP and eEJP measurements at third-instar larval muscle 6/7 NMJs. Scale bars: eEJP, 10ms, 10 mV; mEJP traces 500ms, 5 mV. (j–l) control animals treated with Rok inhibitor do not show a significant change in mEPSP, eEPSP or quantal contents. Source data as exact normalized and raw values, detailed statistics including sample sizes and p values are provided in Figure 6—figure supplement 1—source data 1. *p≤0.05; **p ≤ 0.01; ***p ≤ 0.001; n.s., not significant, p > 0.05. All panels show mean ± s.e.m.
-
Figure 6—figure supplement 1—source data 1
Table containing exact values for the data depicted in Figure 6—figure supplement 1, along with details of statistical analyses.
- https://cdn.elifesciences.org/articles/86084/elife-86084-fig6-figsupp1-data1-v2.xlsx
Figure 7 with 3 supplements
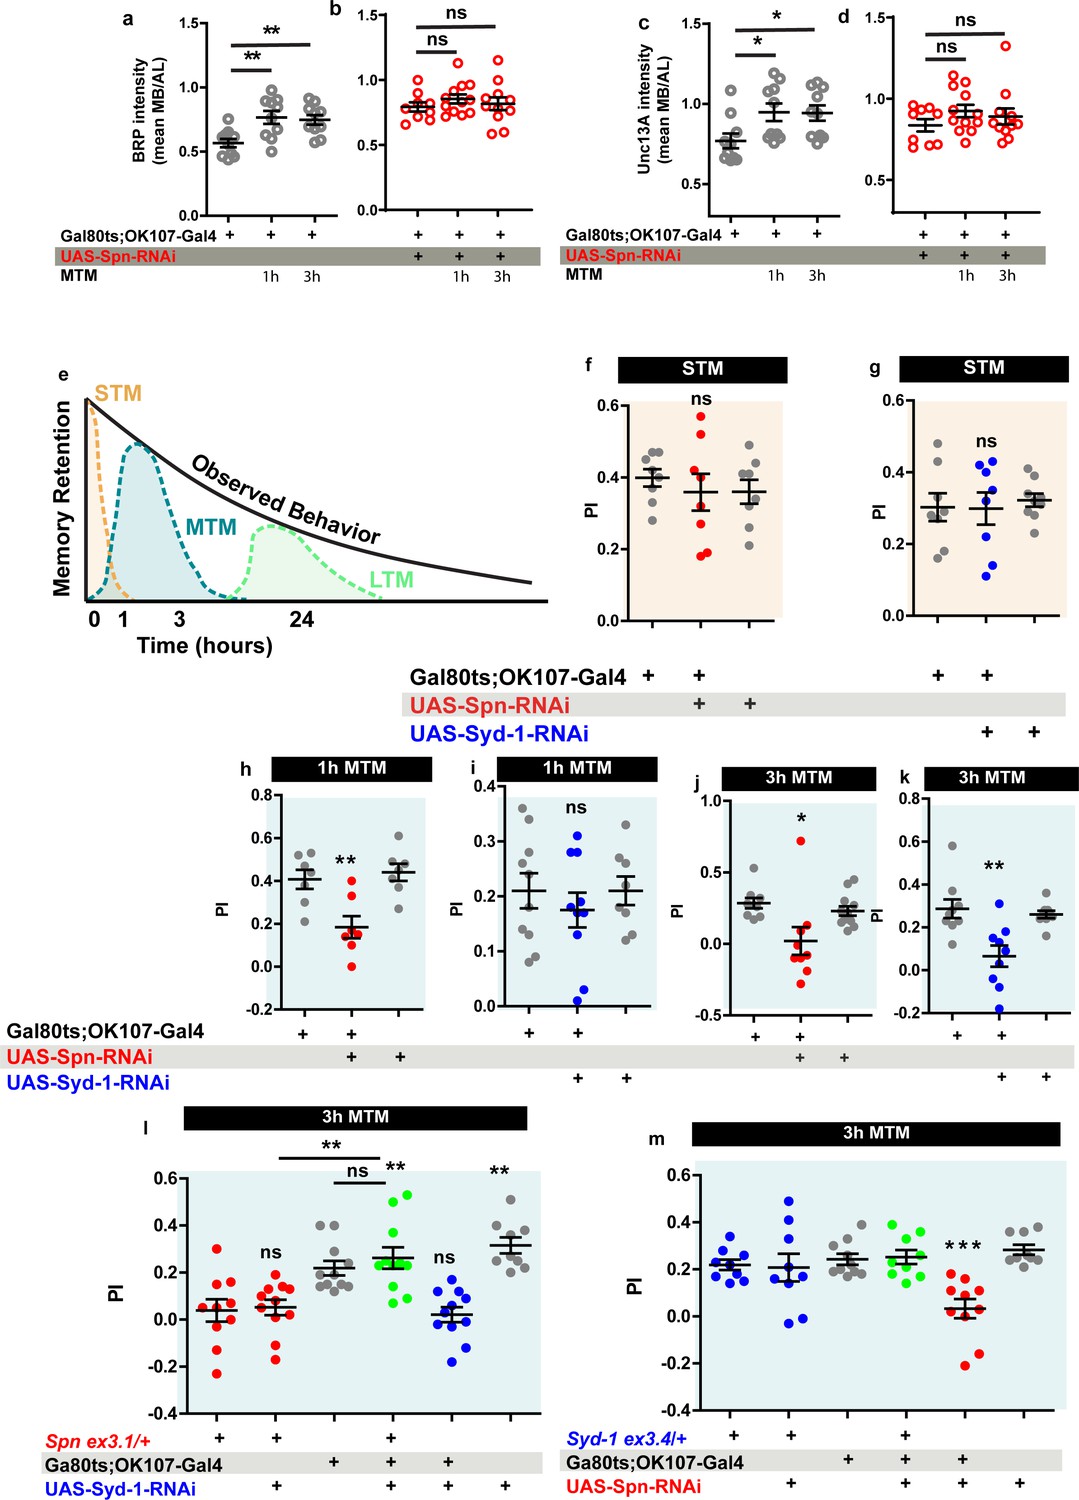
Spinophilin is crucial for aversive olfactory mid-term memories but not for learning.
The Spinophilin/Syd-1 antagonism controls aversive mid-term memories. (a–d) Quantification of BRP and Unc13A intensity in control and Spn knockdown (KD) flies, 1 and 3 h after conditioning. (a,c) BRP and Unc13A levels increase in controls upon paired conditioning while (b,d) BRP and Unc13A do not increase in Spn KD upon paired conditioning. (e) Scheme showing different phases of memory in Drosophila. (f–g) STM is normal in both Spn and Syd-1 KDs. (h) 1 hour and (j) 3 hour MTM are both impaired in Spn KD. (i) 1 hour MTM is normal while (k) 3 hour MTM is impaired in Syd-1 KD. (l) Spn heterozygosity (Spnex3.1/+) shows impaired 3 hr MTM, which is rescued upon concomitant KD of Syd-1. (m) 3 hour MTM impairment in Spn KD is rescued by concomitant reduction in Syd-1 through Syd-1 heterozygosity (Syd-1ex3.4/+). Also see Figure 7—figure supplements 1–3. Source data as exact normalized and raw values, detailed statistics including sample sizes and p values are provided in Figure 7—source data 1. *p≤0.05; **p ≤ 0.01; ***p ≤ 0.001; n.s., not significant, p > 0.05. All panels show mean ± s.e.m.
-
Figure 7—source data 1
Table containing exact values for the data depicted in Figure 7, along with details of statistical analyses.
- https://cdn.elifesciences.org/articles/86084/elife-86084-fig7-data1-v2.xlsx
Figure 7—figure supplement 1
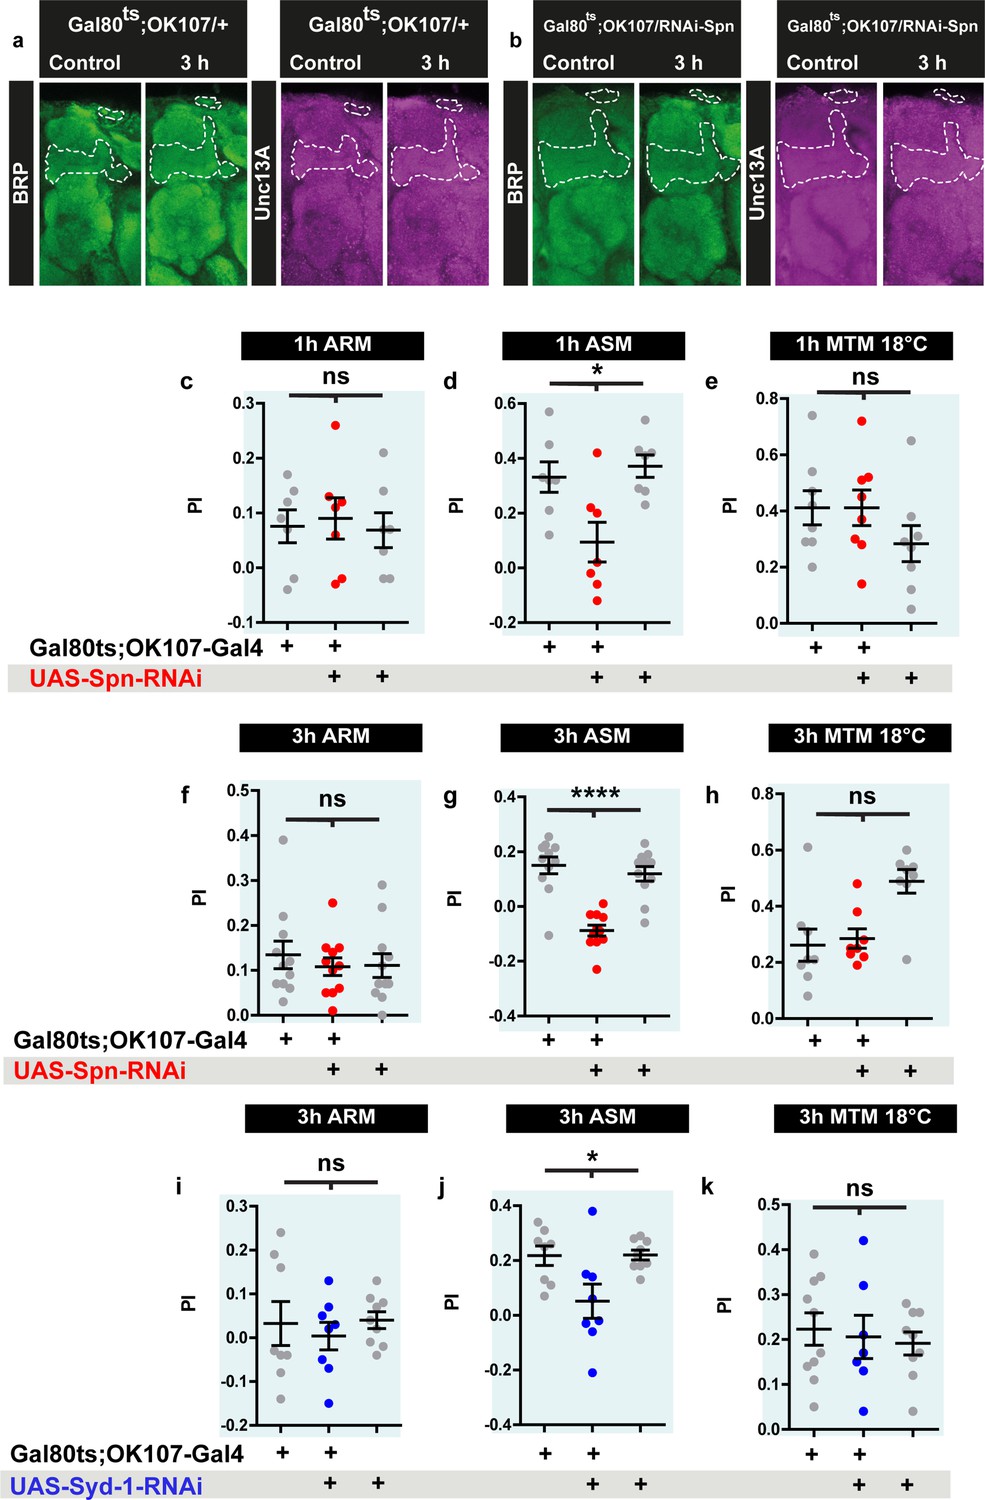
Spinophilin and Syd-1 knockdown results in impaired mid-term memory (MTM), due to impaired anesthesia-sensitive memory (ASM).
(a) Representative Drosophila brain images for data quantified in Figure 7a–d. (c–e) ARM, ASM and 18 °C control performance indices of 1 h MTM in Spn-KD corresponding to Figure 7h. (f–h) ARM, ASM and 18 °C control performance indices of 1 h MTM in Spn-KD corresponding to Figure 7j. (i–k) ARM, ASM and 18 °C control performance indices of 1 hr MTM in Syd-1-KD corresponding to Figure 7k. Source data as exact normalized and raw values, detailed statistics including sample sizes and p values are provided in Figure 7—figure supplement 1—source data 1. *p≤0.05; **p ≤ 0.01; ***p ≤ 0.001; n.s., not significant, p > 0.05. All panels show mean ± s.e.m.
-
Figure 7—figure supplement 1—source data 1
Table containining exact values for the data depicted in Figure 7—figure supplement 1, along with details of statistical analyses.
- https://cdn.elifesciences.org/articles/86084/elife-86084-fig7-figsupp1-data1-v2.xlsx
Figure 7—figure supplement 2
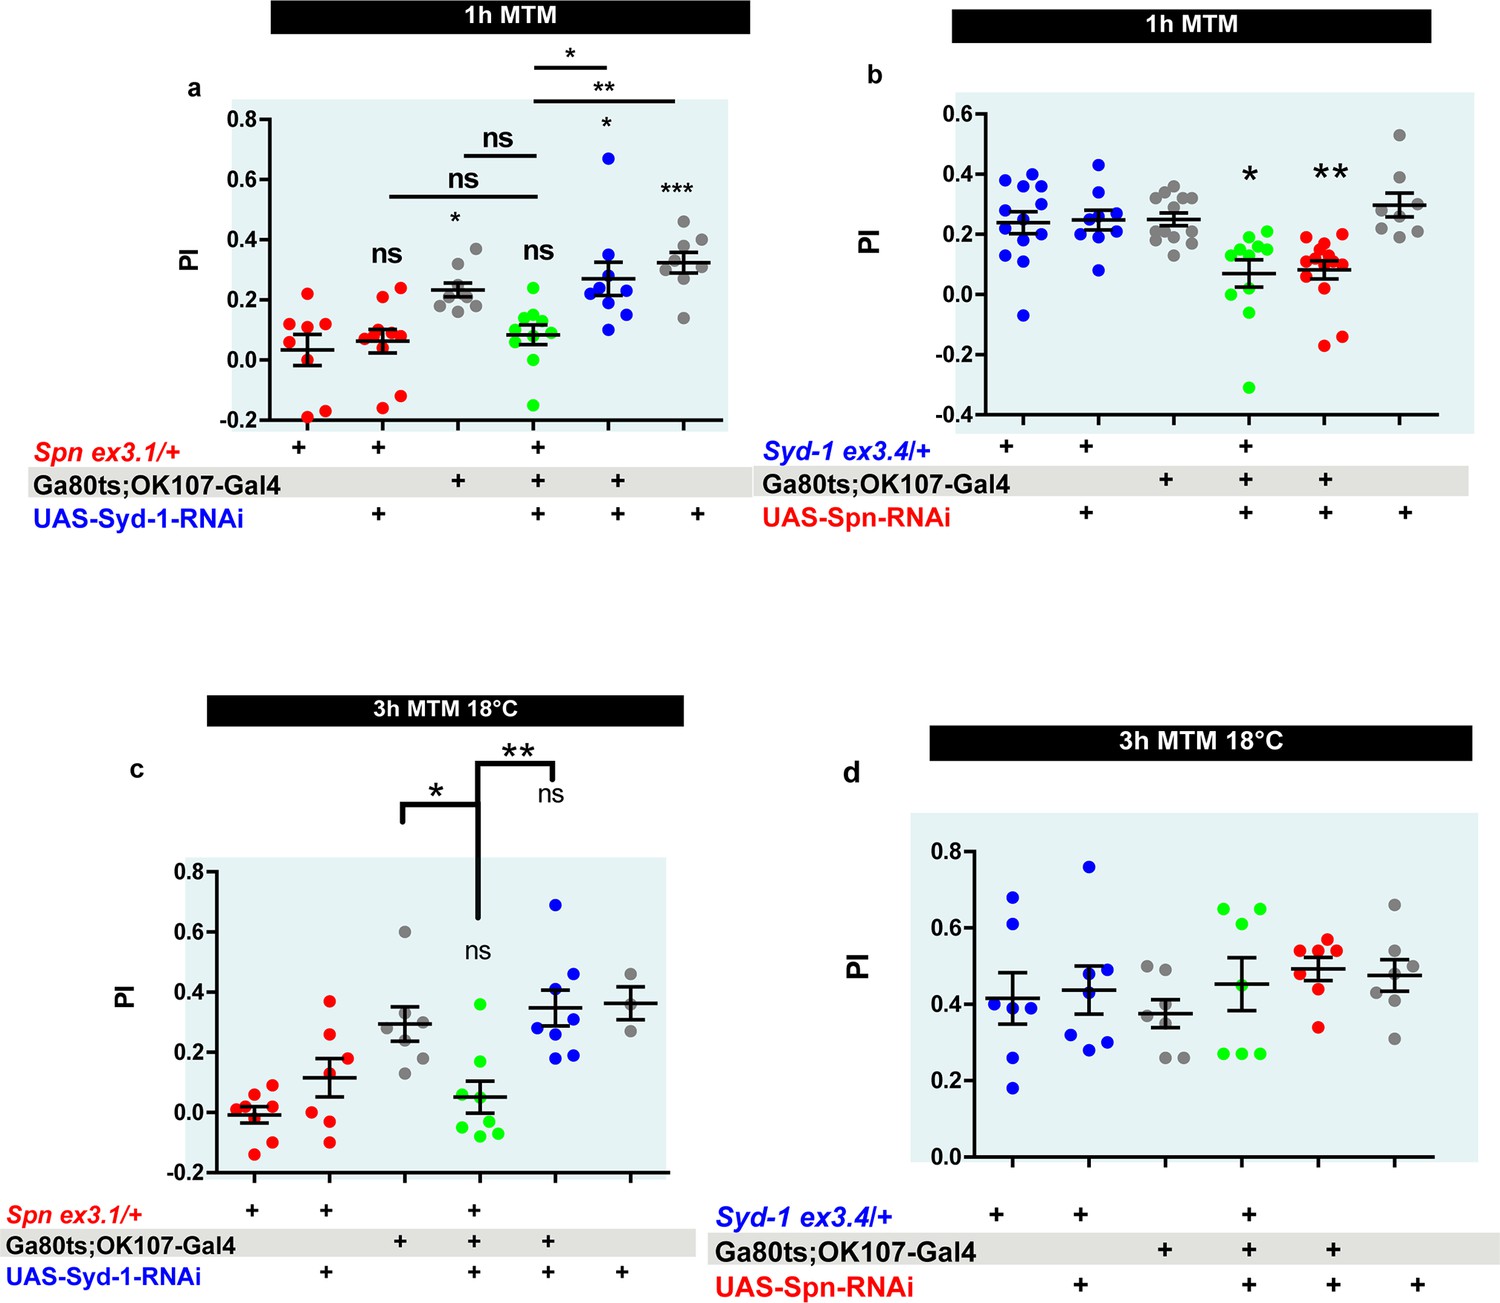
The Spinophilin/Syd-1 antagonism is not relevant to 1h mid-term memory (MTM) formation.
(a) Spn heterozygosity (Spnex3.1/+) shows impaired 1 hr MTM, which is not rescued upon concomitant KD of Syd-1. (b) 1 hr MTM impairment in Spn KD is not rescued by concomitant reduction in Syd-1 through Syd-1 heterozygosity (Syd-1ex3.4/+) (c–d) Control experiments at 18 °C show that Syd-1 KD does not rescue Spn heterozygosity and Spn-KD does not show a phenotype at 3hMTM. Source data as exact normalized and raw values, detailed statistics including sample sizes and p values are provided Figure 7—figure supplement 2—source data 1. *p≤0.05; **p ≤ 0.01; ***p ≤ 0.001; n.s., not significant, p > 0.05. All panels show mean ± s.e.m.
-
Figure 7—figure supplement 2—source data 1
Table containining exact values for the data depicted in Figure 7—figure supplement 2, along with details of statistical analyses.
- https://cdn.elifesciences.org/articles/86084/elife-86084-fig7-figsupp2-data1-v2.xlsx
Figure 7—figure supplement 3
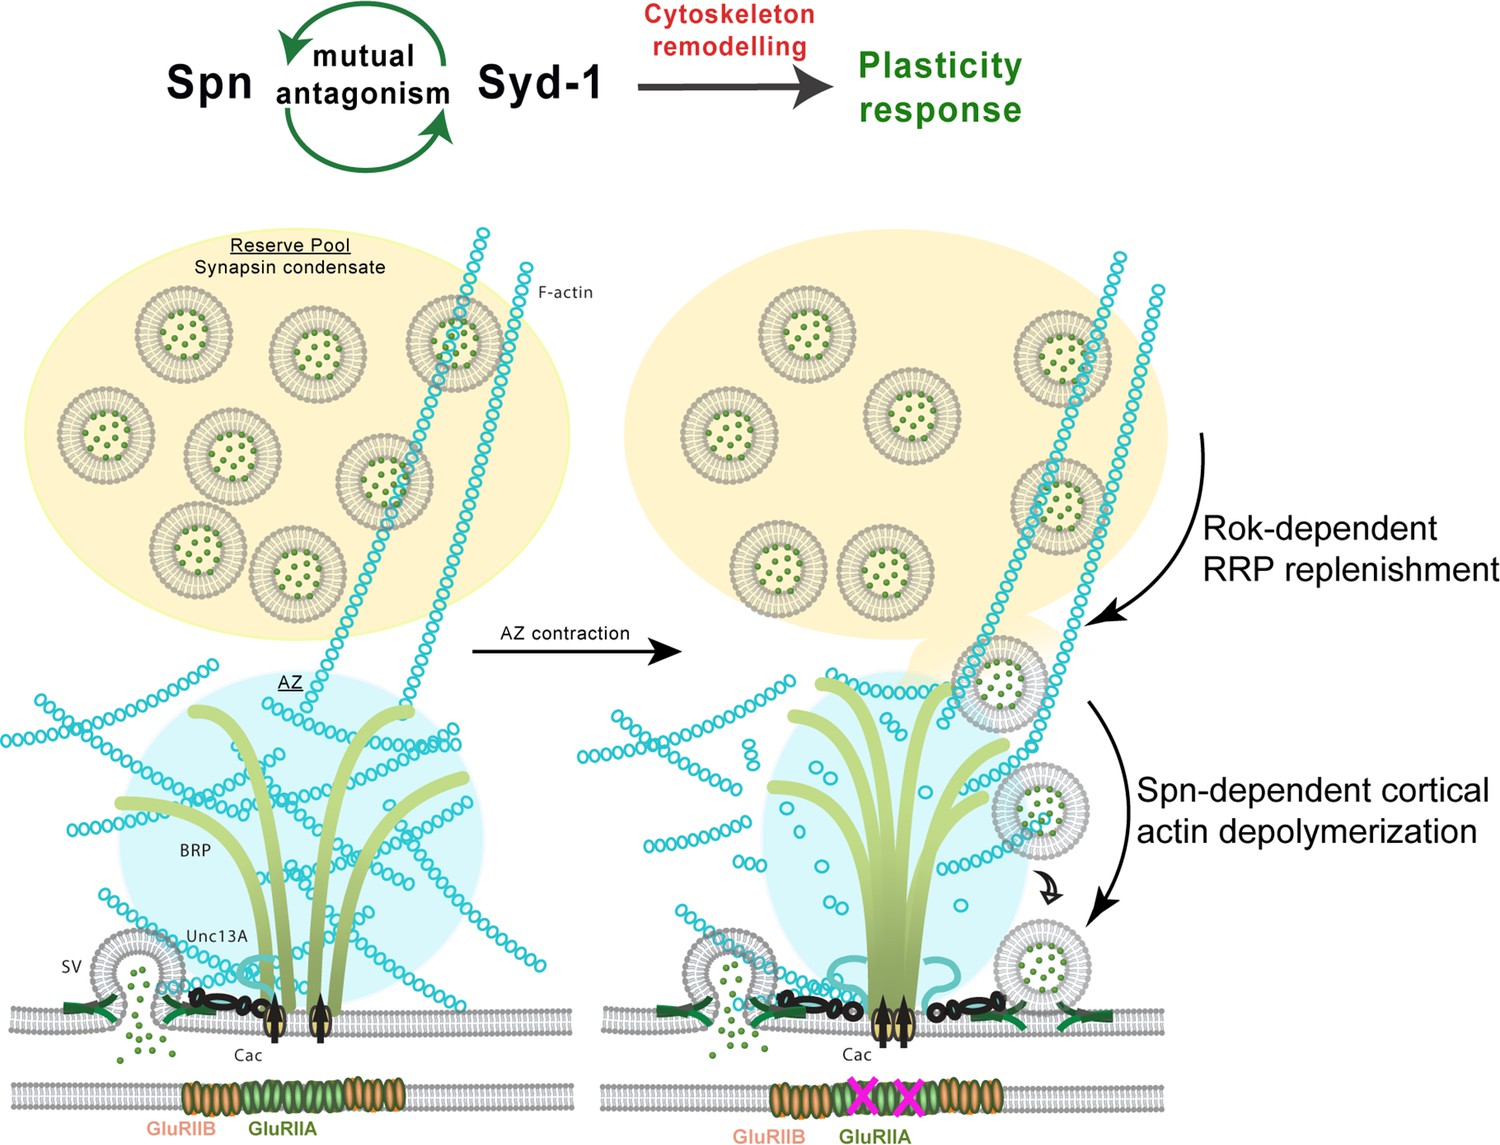
Model depicting plasticity processes underlying presynaptic homeostatic plasticity in peripheral neuromuscular synapses and memory stabilization in mushroom body KCs.
Spn and Syd-1 antagonism mediates cytoskeletal remodeling which facilitates plasticity responses. Rok replenishes the readily releasable pool of synaptic vesicles (SV) and Spn mediates actin depolymerization which gives SVs access to release sites.
Additional files
Download links
A two-part list of links to download the article, or parts of the article, in various formats.
Downloads (link to download the article as PDF)
Open citations (links to open the citations from this article in various online reference manager services)
Cite this article (links to download the citations from this article in formats compatible with various reference manager tools)
An antagonism between Spinophilin and Syd-1 operates upstream of memory-promoting presynaptic long-term plasticity
eLife 12:e86084.
https://doi.org/10.7554/eLife.86084


