The younger flagellum sets the beat for Chlamydomonas reinhardtii
- Department of Bionanoscience, Delft University of Technology, Netherlands
- Beijing National Laboratory for Condensed Matter Physics, Institute of Physics, Chinese Academy of Sciences, China
- Laboratory for Aero and Hydrodynamics, Delft University of Technology, Netherlands
Figures
Figure 1
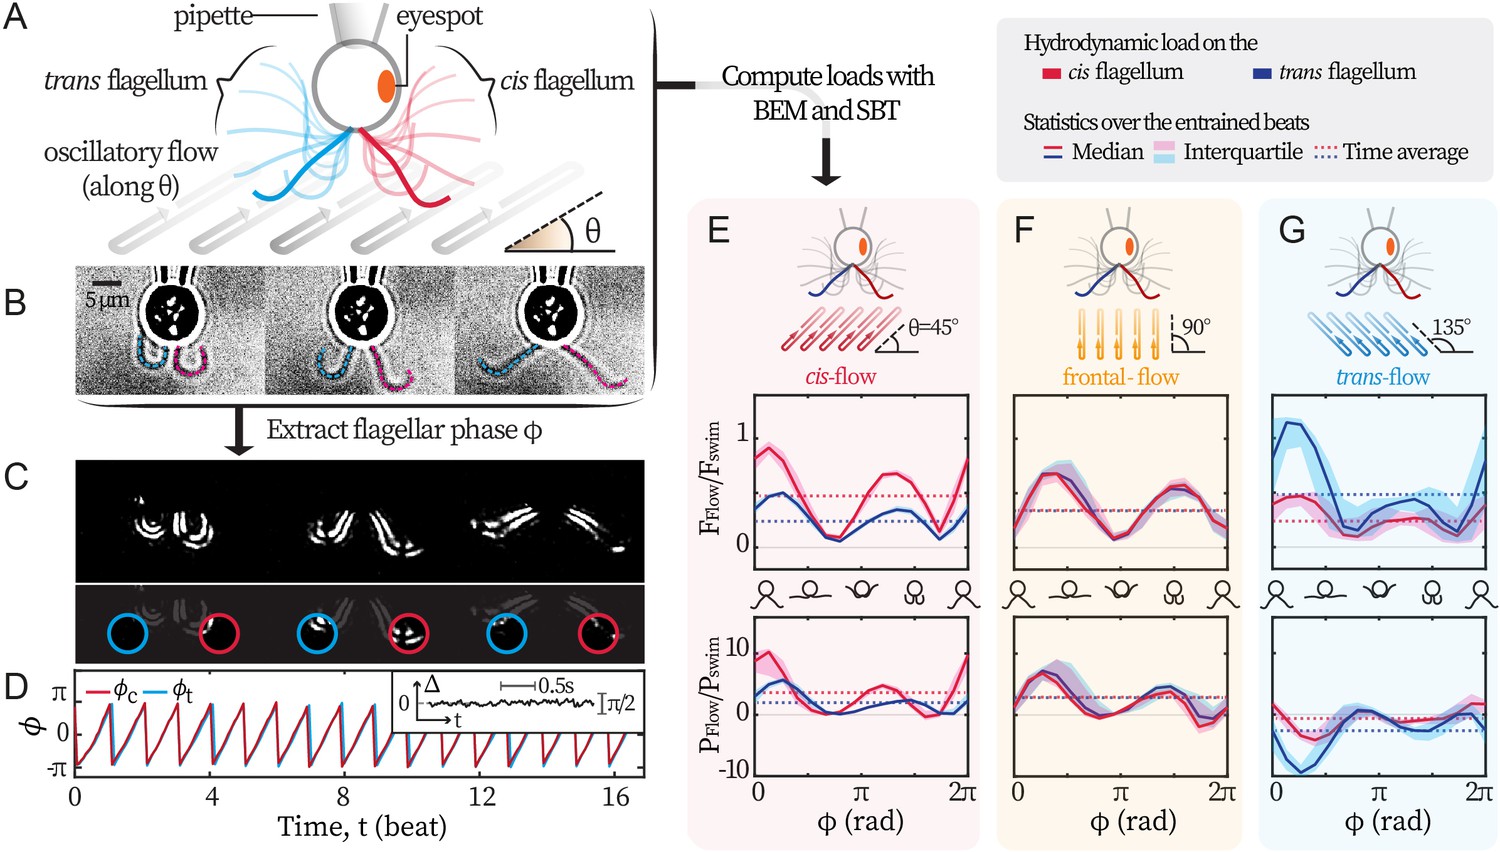
Experimental scheme.
(A) Schematic representation of the experiment. C. reinhardtii cells captured by micropipette are subjected to sinusoidal background flows along given directions (θ) in the -plane. Video recording of flagellar beating (B) are thresholded and contrast-adjusted to highlight the flagella (C), and mean pixel values within the user-defined interrogation windows (red and blue circles) are used to compute observable-independent flagellar phases (D). Inset: flagellar phase difference of a representative wt cell during synchronous beating. Hydrodynamic computations are performed to evaluate the loads due to the background flow on each flagellum. These computations require the flagella to be tracked for the entire duration of the recordings (dashed lines in B) while external flows along a given θ are applied. (E, F, G) represent the hydrodynamic loads for cis-, frontal- and trans-flows along the θ= 45°, 90° and 135° respectively. Computed forces and the forces’ rates of work are presented for the cis (red) and the trans (blue) flagellum. N≈30 periods during entrainment are used to compute the median (lines) and the interquartile (shadings). Dotted horizontal lines: loads averaged over an entrained beat. Force magnitudes and powers are scaled by =9.9 pN and =1.1 fW respectively. Flagellar phase corresponds to the displayed shapes in the middle x-axis.
Figure 2
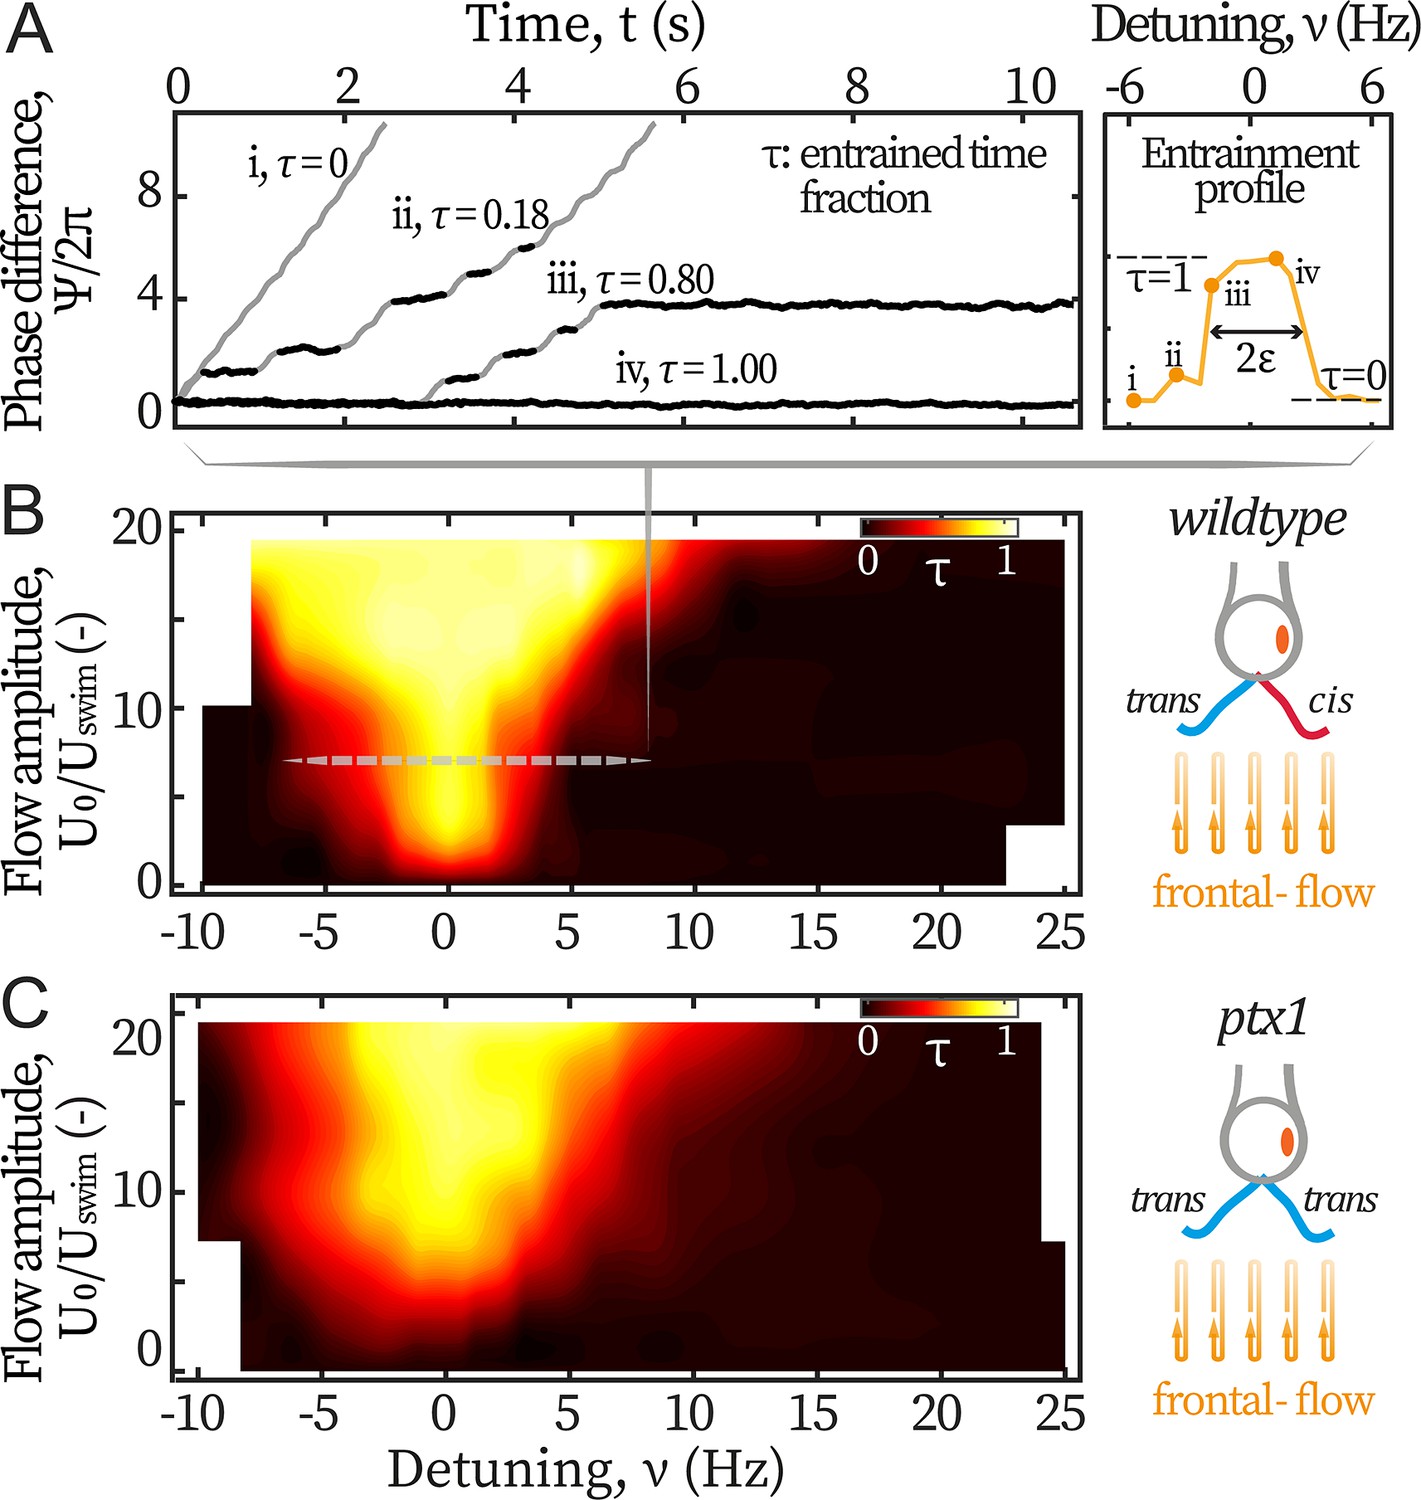
Entrainment of wt and ptx1 cells by frontal-flows.
(A) Phase dynamics of at varying detunings . Traces i to iv are taken at detunings marked as shown in the right panel. denotes interchangeably. Plateaus marked black represent flow entrainment () whose time fractions / are noted. is the total time of recording. Right panel: The ‘flow entrainment profile’, , whose width () measures the flow’s effective forcing strength . Arnold tongue diagram of a representative wt cell (B) and a representative ptx1 cell (C) tested with frontal-flows. The dashed slice in B corresponds to the data shown in A. The contour is interpolated from N=132 measurements (6 equidistant amplitudes × 22 equidistant frequencies). Color bar for ptx1: with the total time of in-phase synchronous beating.
Figure 3
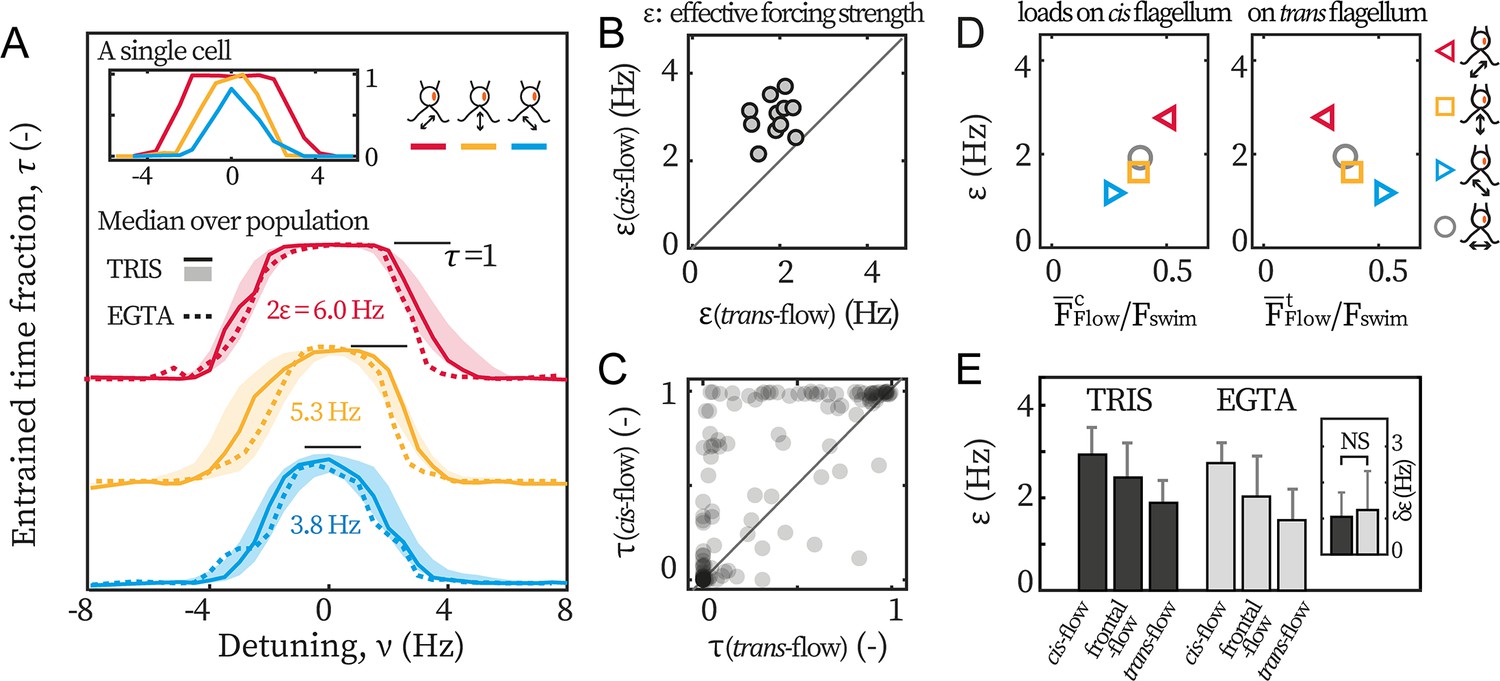
Cis-flow entrains wt cells the most effectively.
(A) The entrainment profiles of a representative wt cell (inset), the median profile of the TRIS group wt cells (N=11, solid lines) and the EGTA group (N=6, dashed lines), with either cis-flows (red), frontal-flows (yellow) or trans-flows (blue). Shaded areas are the interquartile ranges for the TRIS group. (B) Comparing against for each wt cells (TRIS group) tested. Solid line: the first bisector line (). (C) Comparing against for each cell at each flow frequency. Each point represents the time fractions of a particular cell entrained respectively by cis-flow and trans-flow of the same frequency. More than 90% of N=132 points are above the first bisector line (solid line). (D) Relations between and the loads on the cis and the trans flagellum. Markers represent different flow directions, see the drawings. (E) The effective forcing strengths of the TRIS group (black) and the EGTA group (gray). Bars and error bars: mean and 1 std., respectively. Inset: . NS: not significant, p>0.05, Kruskal-Wallis test, one-way ANOVA.
Figure 4
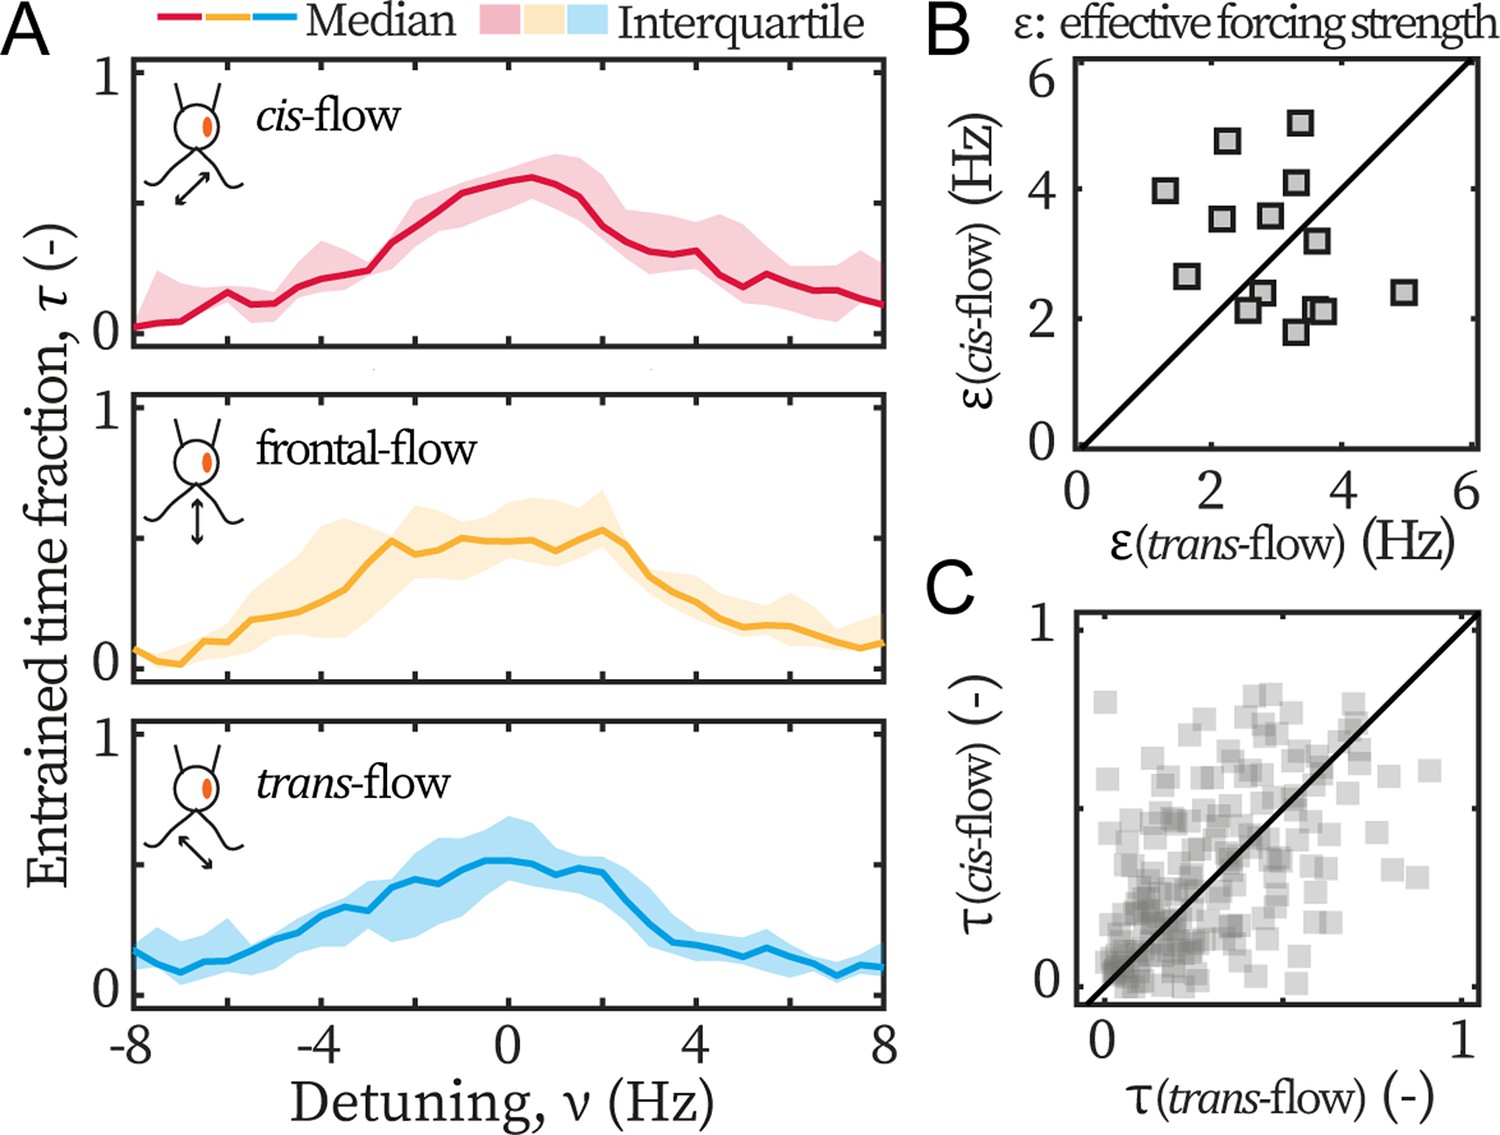
Ptx1 mutant loses the asymmetric flow response.
(A) Flow entrainment profiles of N=14 ptx1 cells, tested with cis-flows (red), frontal-flows (yellow) and trans-flows (blue). (B) and of the tested cells. The first bisector line (solid): . (C) and for each cell at each applied frequency (N=154 points). and denote respectively the effective coupling strength and the entrained time fraction during IP beating.
Figure 5
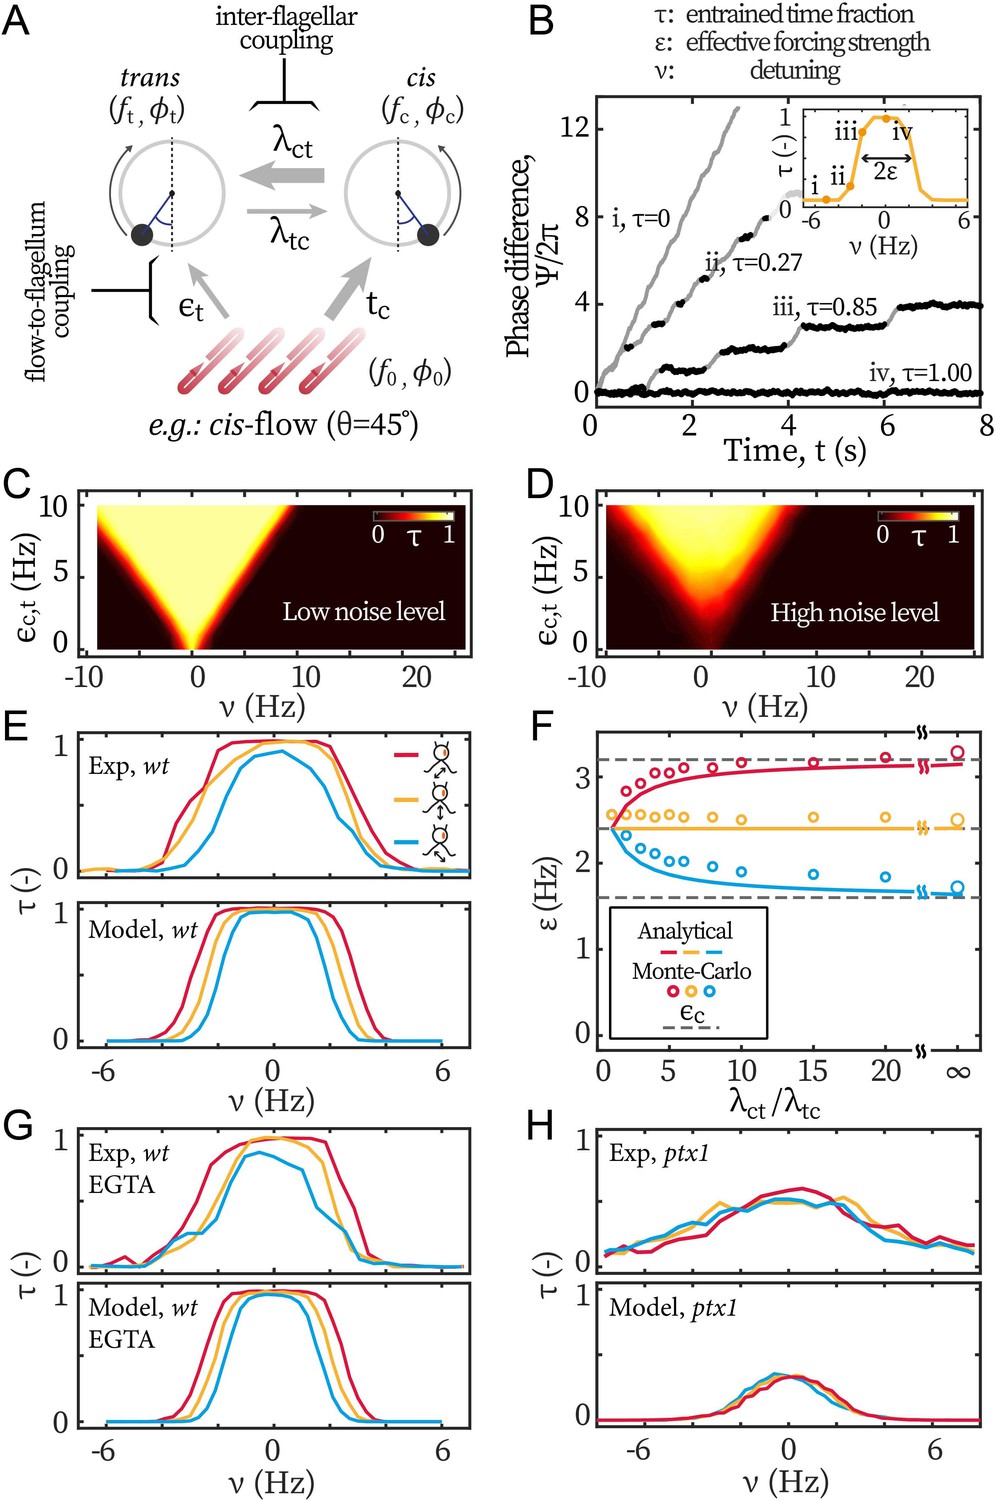
Modeling the asymmetric flow entrainment.
(A) Modeling scheme describing a cell beating under directional flow (cis-flow as an example). Arrows represent the directional coupling coefficients with line thickness representing the relative strength. For example, points from cis to trans and represents how sensitive the latter’s phase () is to the former’s phase (). Meanwhile, the arrow of being thicker than means that is much more sensitive to than the other way around. denote the sensitivity of to the flow’s phase . (B) Modeled phase dynamics of flow entrainment under frontal-flows, analogous to Figure 2A. Reproducing the Arnold tongue diagrams at the noise level of wt (C) and ptx1 (D), analogous to Figure 2B and Figure 2C respectively. (E) Flow entrainment profiles obtained experimentally (upper panel) and by modeling (lower panel). (F) as a function of the inter-flagellar coupling asymmetry . Points: measured from simulation; lines: analytical approximation (Equation 3); dashed lines: respectively for the cis-flow, frontal-flow, and trans-flow (from top to bottom). (G) Reproducing the flow entrainment of wt cells under calcium depletion. (H) Reproducing results of ptx1. See Table 1 for the modeling parameters.
Appendix 1—figure 1
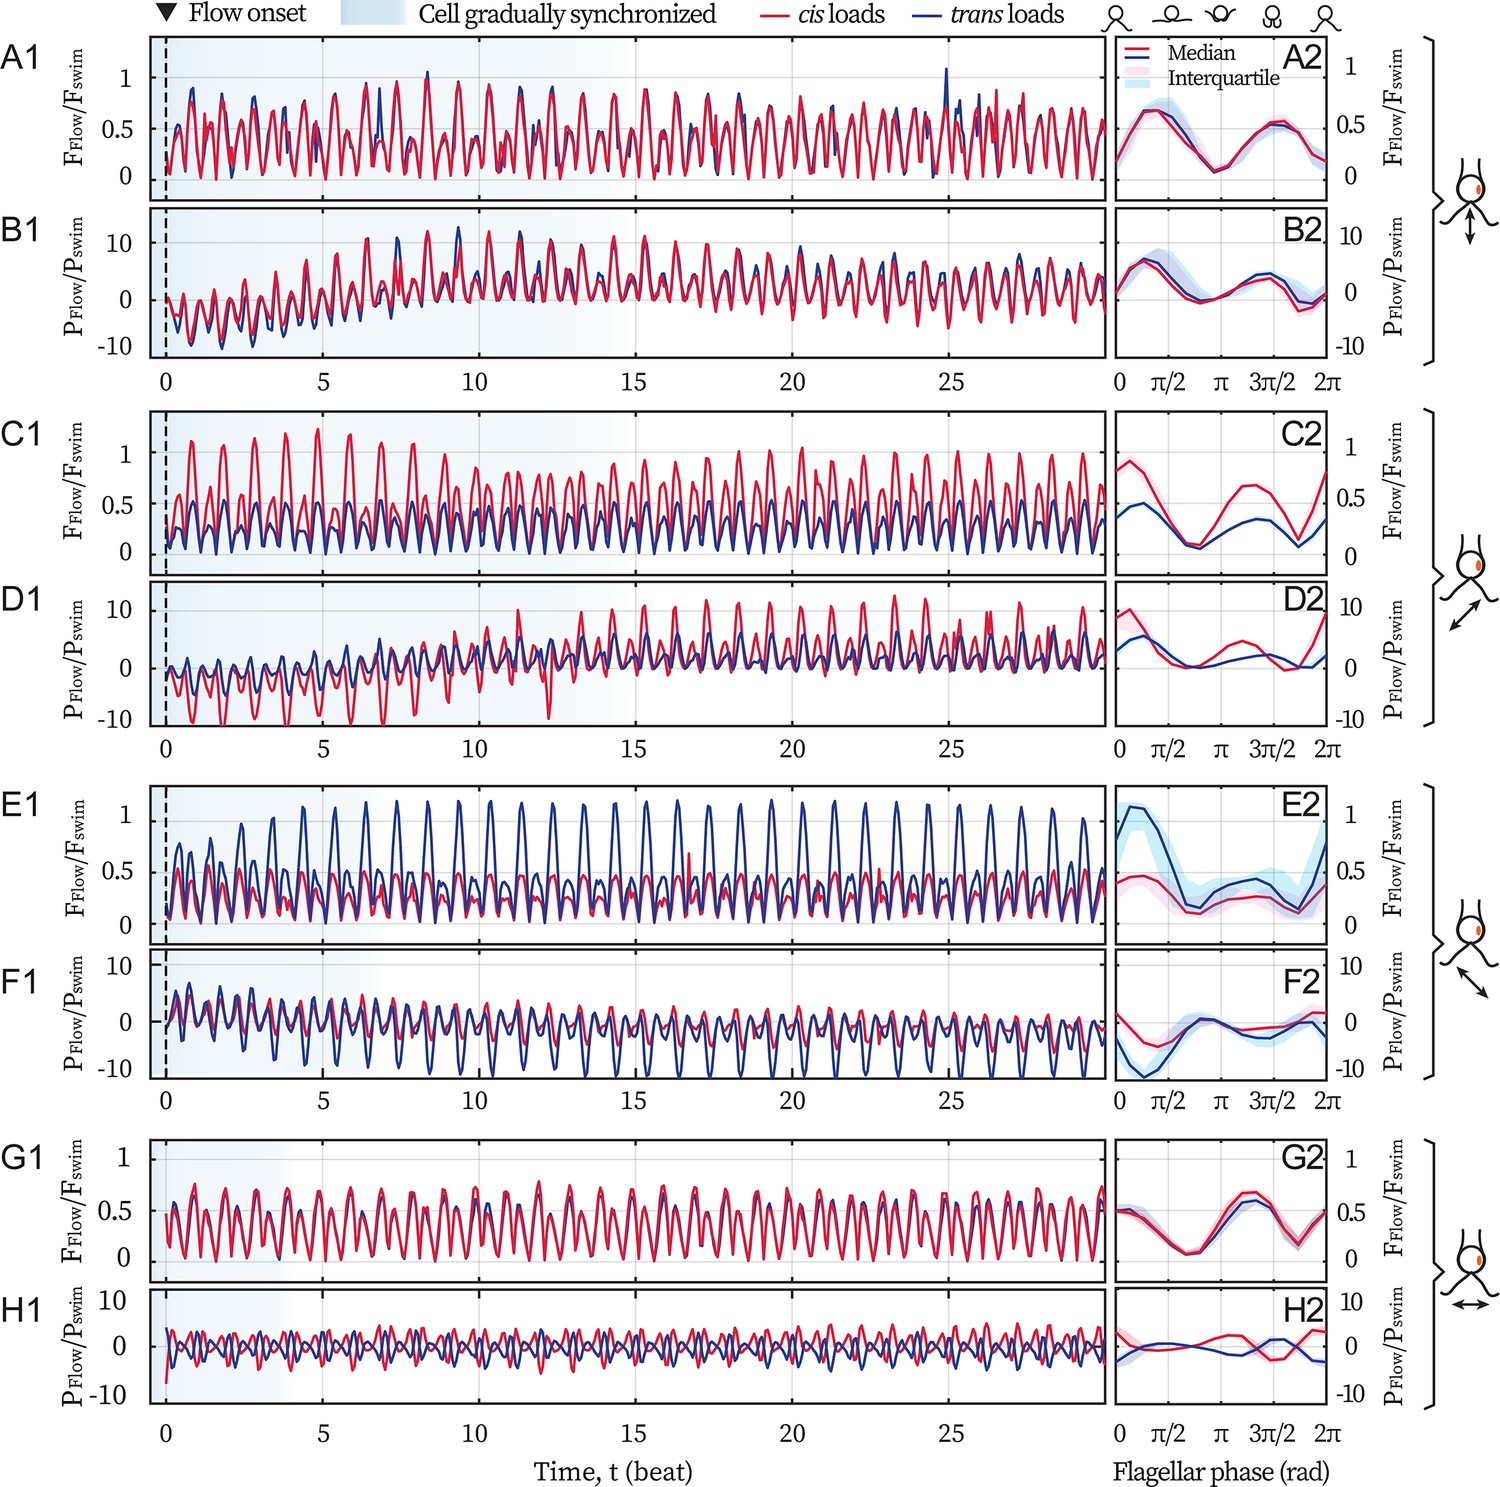
Hydrodynamic computations of the loads on the flagella.
Computations are based on recordings of different directional flows (49.2 Hz) entraining the same cell ( Hz). Computed drag forces (A1) and the force’s rate of work (B1) on the cis (red) and the trans (blue) flagellum for 30 cycles, when the cell is subjected to the frontal-flow (θ = 90°). Black dashed lines mark the onset of the applied flow. Blue shading in the background represents the beating cycles before the cell is entrained. Magnitude of the drag forces (A2) and the power of the flow (B2) averaged over the flow-entrained cycles. The solid lines and the shaded areas represent the median and the interquartile range respectively. (C–D) Same as (A–B) but for the cis-flow (θ = 45°). (E–F) Results for the trans-flow (θ = 135°). (G–H) Results for the flow with θ = 0°. Scaling factors =9.9 pN and =1.1 fW.
Appendix 1—figure 2
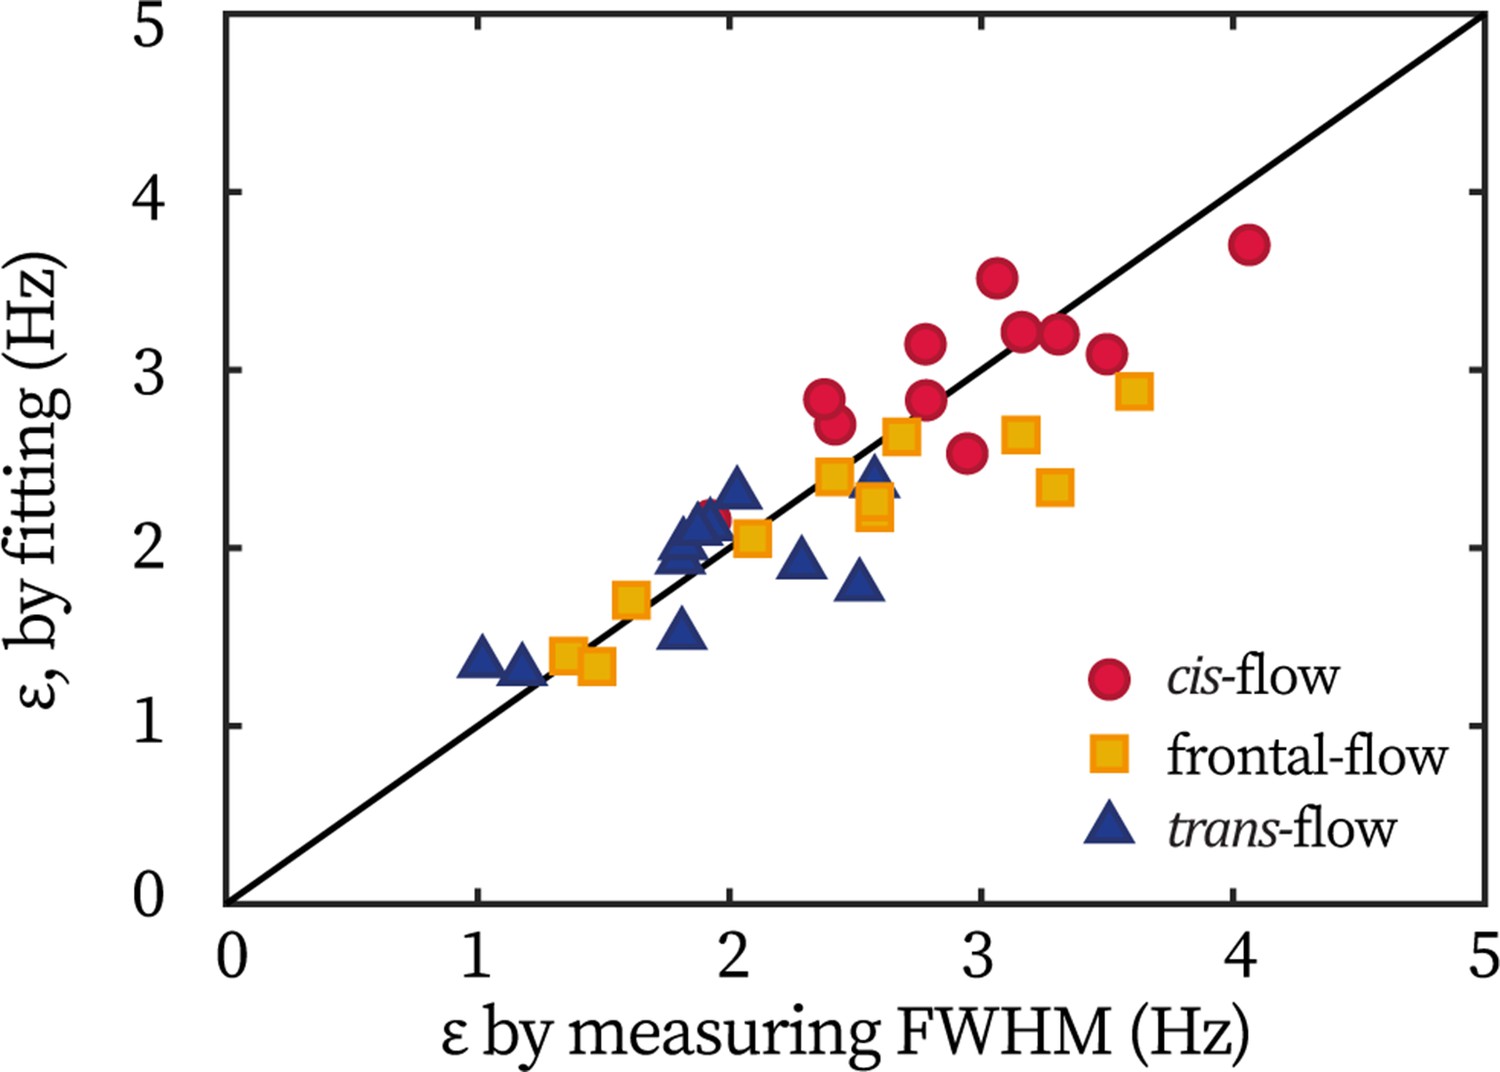
Equivalence of extracting coupling strength by different methods.
Each point represents one cell under either the frontal-flow (yellow square), the cis-flow (red circle), or the trans-flow (blue triangle). The coordinate is the coupling strength measured by the half width of entrainment profile, ; and the coordinate is obtained by fitting the flagellar phase dynamics.
Appendix 1—figure 3
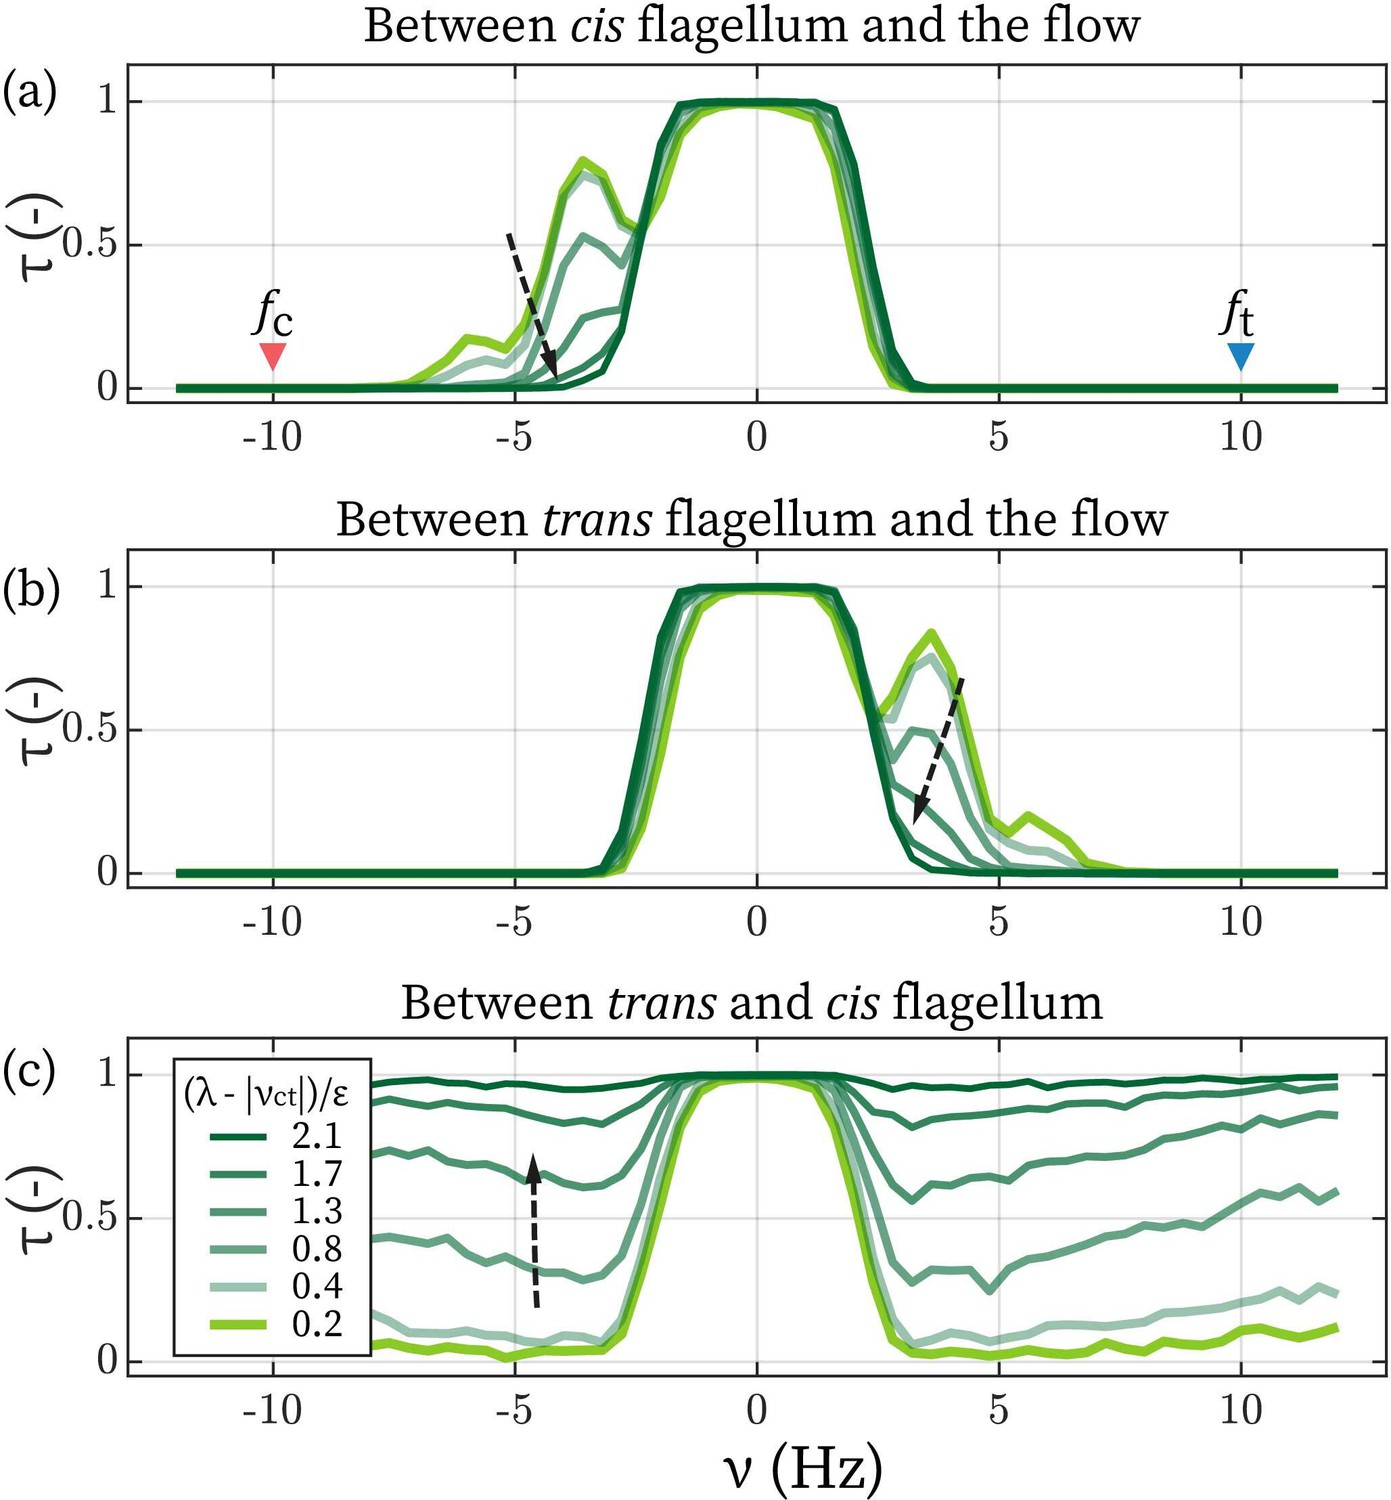
Determine the lower limit of λ.
The time fractions of the cis (a) and the trans flagellum (b) entrained by the flow. (c) The time fraction of where cis and trans are synchronized. Arrows points towards increasing .
Appendix 1—figure 4
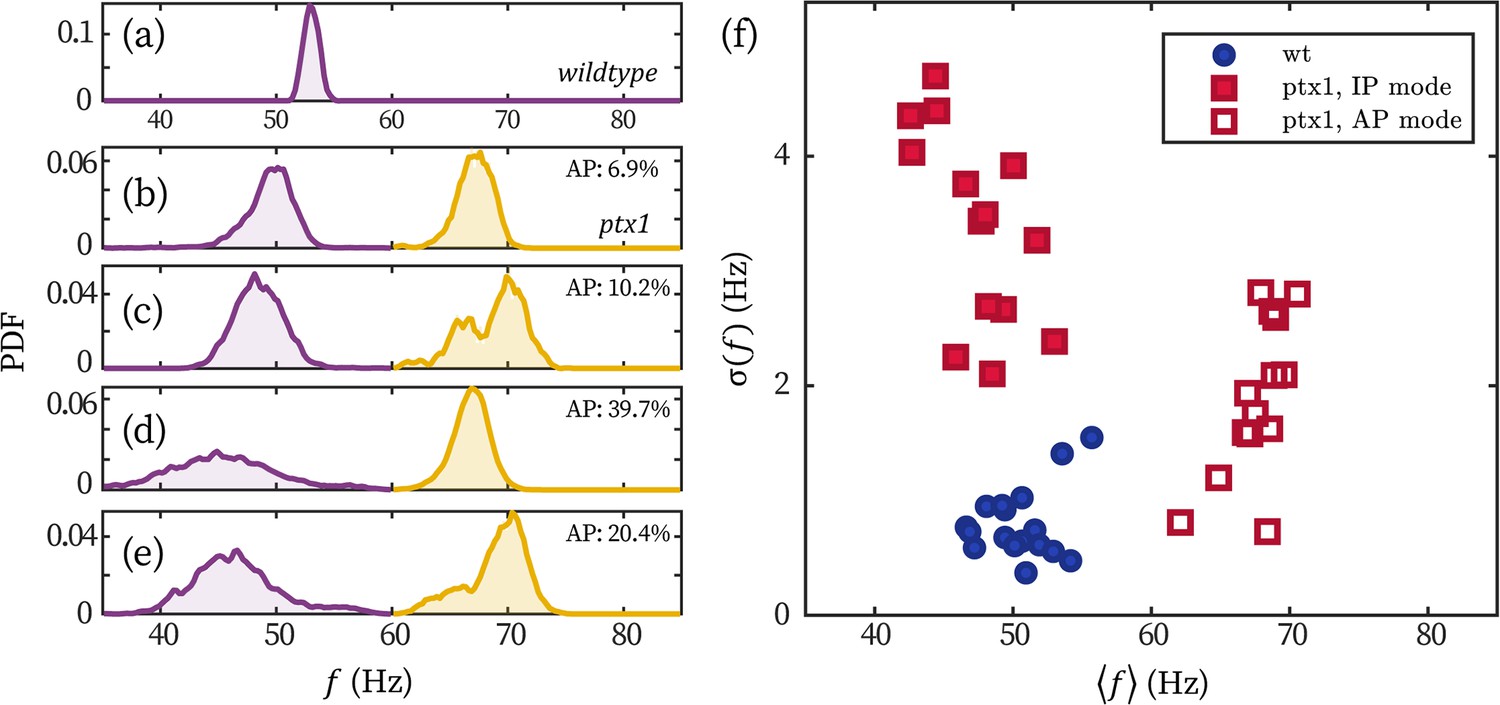
Stronger frequency fluctuation of the IP mode of ptx1 cells.
(a–e) Representative probability distributions of the beating frequency of a wt (a) and four ptx1 cells (b–e) over 30 seconds. Probability distributions of the IP (purple) and AP mode (yellow) are respectively normalized for better visualization. The time fractions of the AP mode are noted in each panel. (f) The wt and ptx1 cells represented by its mean beating frequency and the standard deviation of the beating frequencies over time .
Appendix 1—figure 5
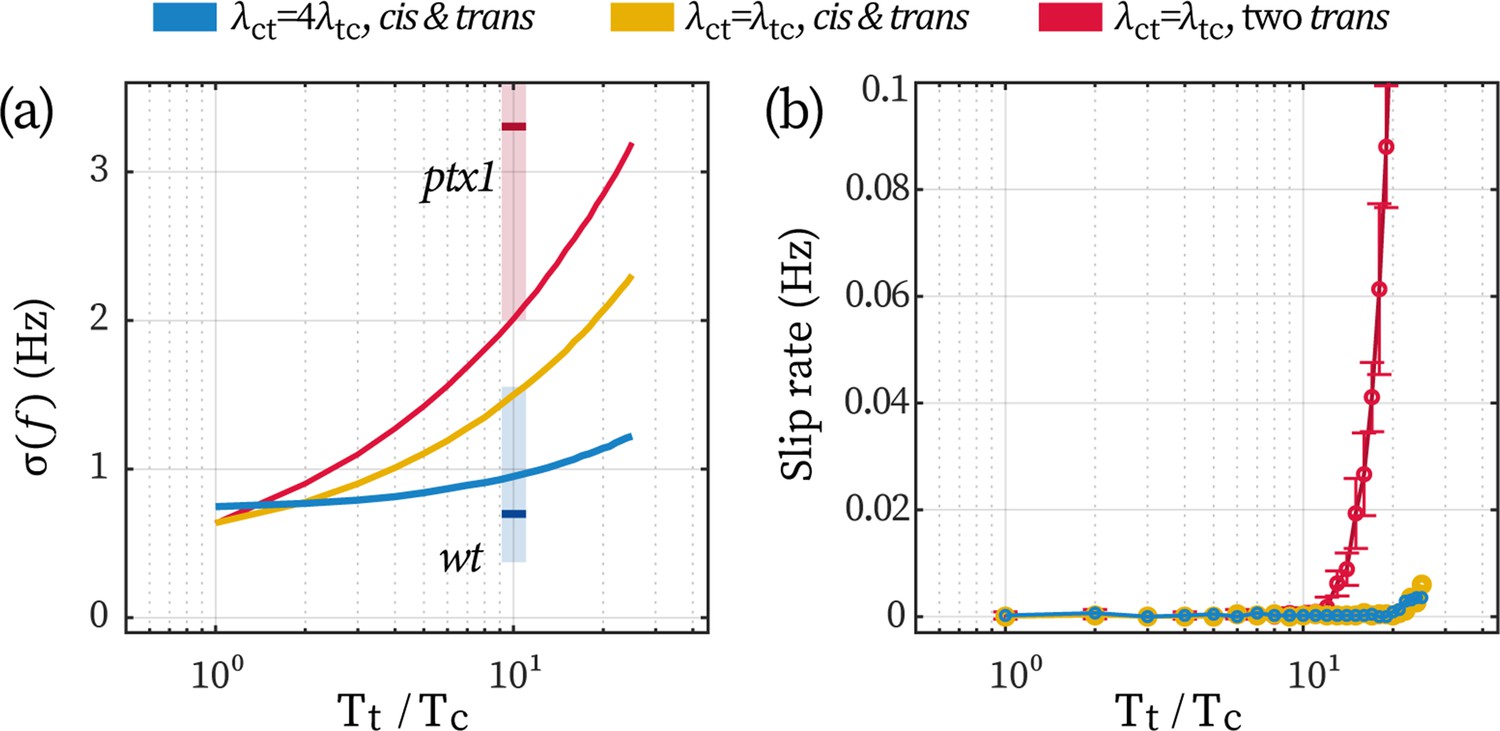
Effect of a low-noise cis in stabilizing the beating of the trans.
(a) Fluctuations in beating frequency () under different coupling schemes and flagellar noises. Other model parameters are the same as used in the main text. The colors of the lines correspond to the three cases explained in the text hereafter. The red and blue vertical shades represent the experimentally observed range for ptx1 and wt cells, respectively, with short bars marking the mean values. (b) The rate of slip under the conditions. Error bars correspond to 1 std. over N=9 repetitions.
Author response image 1

Author response image 2
Author response image 3

Tables
Table 1
Modeling parameters.
| variable | symbol (unit) | TRIS | EGTA | ptx1 |
|---|---|---|---|---|
| Intrinsic freq. Kamiya and Hasegawa, 1987; Okita et al., 2005 | (Hz) | 45,65 | 45,65 | 45,65 |
| Basal coupling* | (Hz) | 60 | 60 | 60 |
| cis dominance Okita et al., 2005; Horst and Witman, 1993 | (-) | 4:1 | 4:1 | 1:1 |
| Flow detuning | (Hz) | [–10,10] | [–10,10] | [–10,10] |
| Total forcing Klindt et al., 2016 | (Hz) | 4.8 | 4.08 | 4.8 |
| Noise† Quaranta et al., 2015 | (rad2/s) | 1.57, 9.42 | 1.57, 9.42 | 9.42, 9.42 |
-
*
detailed in Appendix 1: Monte-Carlo simulations.
-
†
detailed in Appendix 1: Noise in the beating of the ptx1 mutant.
Appendix 1—table 1
Summary of the symbols used in both the main text and the Appendix 1.
| Frequency of the synchronous beating without external flow | |
|---|---|
| Intrinsic frequencies of the cis or trans flagellum | |
| Frequency of the external flow | |
| Detuning, the flow-flagella frequency mismatch, | |
| Flagellar phase | |
| Phase of the cis or trans flagellum | |
| Phase of the external flow | |
| Phase difference between flagella, | |
| Mean flagellar phase | |
| Phase difference between the flow and the flagella, | |
| Effective forcing strength, describing flow-flagella coupling | |
| Forcing strength of external flow on the cis or trans flagellum | |
| Influence of the cis flagellar phase on the trans flagellar phase | |
| Influence of the trans-phase on the cis-phase | |
| Noise of the synchronous beating | |
| Noise of the cis or trans flagellum | |
| Effective temperature of the synchronous beating | |
| Effective temperature of the cis or trans flagellum |
Additional files
Download links
A two-part list of links to download the article, or parts of the article, in various formats.
Downloads (link to download the article as PDF)
Open citations (links to open the citations from this article in various online reference manager services)
Cite this article (links to download the citations from this article in formats compatible with various reference manager tools)
The younger flagellum sets the beat for Chlamydomonas reinhardtii
eLife 13:e86102.
https://doi.org/10.7554/eLife.86102


