The younger flagellum sets the beat for Chlamydomonas reinhardtii
- Department of Bionanoscience, Delft University of Technology, Netherlands
- Beijing National Laboratory for Condensed Matter Physics, Institute of Physics, Chinese Academy of Sciences, China
- Laboratory for Aero and Hydrodynamics, Delft University of Technology, Netherlands
Abstract
Eukaryotes swim with coordinated flagellar (ciliary) beating and steer by fine-tuning the coordination. The model organism for studying flagellate motility, Chlamydomonas reinhardtii, employs synchronous, breaststroke-like flagellar beating to swim, and it modulates the beating amplitudes differentially to steer. This strategy hinges on both inherent flagellar asymmetries (e.g. different response to chemical messengers) and such asymmetries being effectively coordinated in the synchronous beating. In C. reinhardtii, the synchrony of beating is known to be supported by a mechanical connection between flagella; however, how flagellar asymmetries persist in the synchrony remains elusive. For example, it has been speculated for decades that one flagellum leads the beating, as its dynamic properties (i.e. frequency, waveform, etc.) appear to be copied by the other one. In this study, we combine experiments, computations, and modeling efforts to elucidate the roles played by each flagellum in synchronous beating. With a non-invasive technique to selectively load each flagellum, we show that the coordinated beating essentially only responds to load exerted on the cis flagellum; and that such asymmetry in response derives from a unilateral coupling between the two flagella. Our results highlight a distinct role for each flagellum in coordination and have implication for biflagellates’ tactic behaviors.
Editor's evaluation
This important manuscript investigates how the two flagella of C. reinhardtii, which have inherently different dynamic properties, synchronize their beating. Through careful, non-invasive experiments, the authors help the field to understand the mechanisms responsible for this synchronization, arguing that these mechanisms are due to unilateral coupling between the two flagella. The data are convincing, and the conclusion about unilateral coupling has been strengthened by additional analysis during revision.
https://doi.org/10.7554/eLife.86102.sa0eLife digest
Many single-cell organisms use tiny hair-like structures called flagella to move around. To direct this movement, the flagella must work together and beat in a synchronous manner. In some organisms, coordination is achieved by each flagellum reacting to the flow generated by neighbouring flagella. In others, flagella are joined together by fiber connections between their bases, which allow movement to be coordinated through mechanical signals sent between flagella.
One such organism is Chlamydomonas reinhardtii, a type of algae frequently used to study flagellar coordination. Its two flagella – named trans and cis because of their positions relative to the cell’s eyespot – propel the cell through water using breaststroke-like movements. To steer, C. reinhardtii adjusts the strength of the strokes made by each flagellum. Despite this asymmetry, the flagella must continue to beat in synchrony to move efficiently.
To understand how the cell manages these differences, Wei et al. exposed each flagellum to carefully generated oscillations in water so that each was exposed to different forces and their separate responses could be measured. A combination of experiments, modelling and computer simulations were then used to work out how the two flagella coordinate to steer the cell.
Wei et al. found that only the cis flagellum coordinates the beating, with the trans flagellum simply copying the motion of the cis. A direct consequence of such one-way coupling is that only forces on the cis flagellum influence the coordinated beating dynamics of both flagella. These findings shed light on the unique roles of each flagellum in the coordinated movement in C. reinhardtii and have implications for how other organisms with mechanically-connected flagella navigate their environments.
Introduction
Swimming microorganisms ranging from bacteria (Berg and Brown, 1972; Smriga et al., 2016) to larger flagellates and ciliates (Hegemann and Berthold, 2009; Ueki et al., 2010; Stehnach et al., 2021) must be able to steer to swim towards desirable environments and away from hazardous ones. Such targeted navigation are known as tactic behaviors. For a specific organism, tactic behavior may be underpinned by distinct mechanisms. For example, bacteria modulate the tumbling rate (Berg and Brown, 1972) while flagellates and ciliates modulate the waveform (Brokaw et al., 1974; Gong et al., 2020; Gadêlha et al., 2020; Bennett and Golestanian, 2015), amplitude (Rüffer and Nultsch, 1991; Ueki and Wakabayashi, 2017) and frequency (Naitoh and Kaneko, 1972; Ueki et al., 2010) of their flagellar/ciliary beating. However, these active modulations of motility serve the same goal, that is, to generate a spatially asymmetric propulsive force so the cell can steer.
Chlamydomonas reinhardtii, the model organism for studies of flagellar motility, achieves tactic navigation by a fine-tuned differential modulation on its two flagella. Studying this organism offers great opportunities to look into how flagella coordinate with each other and how such coordination helps facilitate targeted steering. C. reinhardtii has a symmetric cell body and two near-identical flagella inherited from the common ancestors of land plants and animals (Merchant et al., 2007). It swims by beating its two flagella synchronously and is capable of photo- and chemotaxis (Rüffer and Nultsch, 1991; Choi et al., 2016). For this biflagellated organism, effective steering hinges on both flagellar asymmetry and flagellar coordination. On the one hand, the two flagella must be asymmetric to respond differentially to stimuli (Rüffer and Nultsch, 1990; Rüffer and Nultsch, 1991); on the other hand, the differential responses must be coordinated by the cell such that the beating would remain synchronized to guarantee effective swimming. Understanding this remarkable feat requires knowledge about both flagellar asymmetry and coordination.
The two flagella are known to be asymmetric in several, possibly associated, aspects. First of all, they differ in developmental age (Holmes and Dutcher, 1989; Dutcher and O’Toole, 2016). The flagellum closer to the eyespot, the cis(-eyespot) flagellum, is always younger than the other one, the trans(-eyespot) flagellum. This is because the cis is organized by a basal body (BB) that develops from a pre-matured one in the mother cell; and this younger BB also organizes the flagellar root (D4 rootlet) that dictates the eyespot formation (Mittelmeier et al., 2011). Second, the two flagella have asymmetric protein composition (Sakakibara et al., 1991; Mackinder et al., 2017; Yu et al., 2020). For example, the trans flagellum is richer in CAH6, a protein possibly involved in CO2 sensing (Choi et al., 2016; Mackinder et al., 2017). Finally, the flagella have different dynamic properties (Kamiya and Witman, 1984; Okita et al., 2005; Takada and Kamiya, 1997). When beating alone, the trans beats at a frequency 30–40% higher than the cis (Kamiya and Hasegawa, 1987; Rüffer and Nultsch, 1987; Okita et al., 2005; Wan et al., 2014); the trans also displays an attenuated waveform (Leptos et al., 2013) and a much stronger noise (Leptos et al., 2013; Wan, 2018). Additionally, their beating dynamics is modulated differentially by second messengers such as calcium (Kamiya and Witman, 1984; Okita et al., 2005) and cAMP (Saegusa and Yoshimura, 2015).
Remarkably, despite these inherent asymmetries, C. reinhardtii cells establish robust synchronization between the flagella. Such coordination enables the cells to swim and steer efficiently, and is mediated by the fibrous connections between flagellar bases (Quaranta et al., 2015; Wan and Goldstein, 2016). Intriguingly, in the coordinated beating, both flagella display dynamic properties, that is, flagellar waveform, beating frequency (~50 Hz), and frequency fluctuation, that are more similar to those of the cis flagellum (Rüffer and Nultsch, 1985; Kamiya and Hasegawa, 1987; Leptos et al., 2013; Wan et al., 2014; Wan, 2018). This has led to a long-standing hypothesis that ‘the cis somehow tunes the trans flagellum’ (Kamiya and Hasegawa, 1987). This implies that the symmetric flagellar beating (‘breaststroke’) observed is the result of interactions between two flagella playing differential roles in coordination. How does the basal coupling make this possible? Recent theoretical efforts show that the basal coupling can give rise to different synchronization modes (Klindt et al., 2017; Liu et al., 2018; Guo et al., 2021); and that flagellar dynamics, such as beating frequency, may simply emerge from the interplay between mechanics of basal coupling and bio-activity (Guo et al., 2021). Yet, most theoretical efforts examining flagellar synchronization have assumed two identical flagella, limiting the results’ implication for the realistic case. Moreover, very few experiments directly probe the flagella’s differential roles during synchronous beating (Wan and Goldstein, 2014). Therefore, flagellar coordination in this model organism remains unclear. To clarify the picture experimentally, one needs to selectively force each flagellum, and characterize the dynamics of the flagellar response.
In this study, we address this challenge and devise a non-invasive approach to apply external forces selectively on the cis- or the trans flagellum. Oscillatory background flows are imposed along an angle with respect to the cell’s symmetry axis. Such flows result in controlled hydrodynamic forces, which are markedly different on the two flagella. With experiments, hydrodynamic computations, and modeling, we show definitively that the two flagella are unilaterally coupled, such that the younger flagellum (cis) coordinates the beating, whereas the elder one simply copies the dynamic properties of the younger. This also means that only external forces on the cis may mechanically fine-tune the coordination. We also study the effect of calcium in the cis’ leading role as calcium is deeply involved in flagellar asymmetry and hence phototactic steering. In addition, a well-known mutant that lacks flagellar dominance (ptx1) (Horst and Witman, 1993; Okita et al., 2005) is examined. Results show that the coordinating role of cis does not need environmental free calcium, whereas it does require the genes lost or mutated in ptx1. Our results discern the differential roles of C. reinhardtii’s flagella, highlight an advanced function of the inter-flagellar mechanical coupling, and have implications for biflagellates’ tactic motility.
Methodology
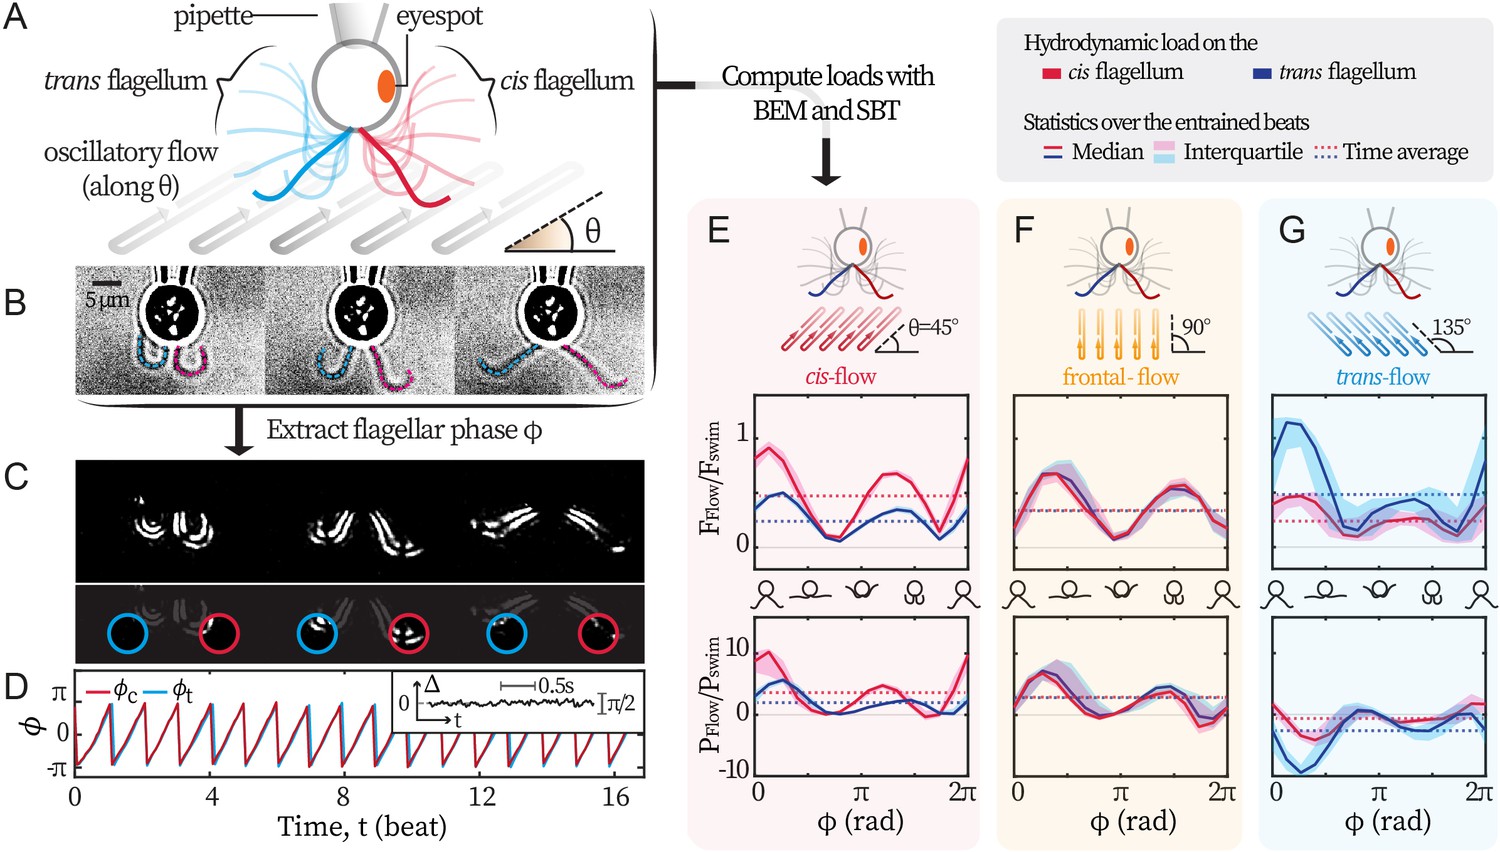
We set out to establish a non-invasive experimental technique that exerts differential loads on the flagella of C. reinhardtii. Following Quaranta et al., 2015, we use external background flows to exert hydrodynamic forcing on captured cells. Hydrodynamic forces are generated by a relative motion between the captured cell and its surrounding fluid. While the cell is captured by a glass pipette fixed in the laboratory frame, the fluid moves with the flow chamber - which is fixed on an oscillating piezoelectric stage. By programming the sinusoidal oscillations of the stage, we generate flows of desired amplitude and frequency and impose these flows along different directions to differentially load the two flagella, see Figure 1A. For each recording, we extract the phase dynamics of flagellar beating from videography (Quaranta et al., 2015; Wei et al., 2019; Wei et al., 2021), Figure 1B. First, recordings are masked and thresholded to highlight the flagella. Then, we extract the mean pixel values over time within two sampling windows (Figure 1C), and convert the two signals into observable-invariant flagellar phases (Kralemann et al., 2008), see Figure 1D. In all our experimental recordings, the cis and the trans flagella beat synchronously. Typical phase locking between them is represented in Figure 1D inset, where the phase difference fluctuates around 0. Therefore, and are equal and denoted as .
Figure 1
Experimental scheme.
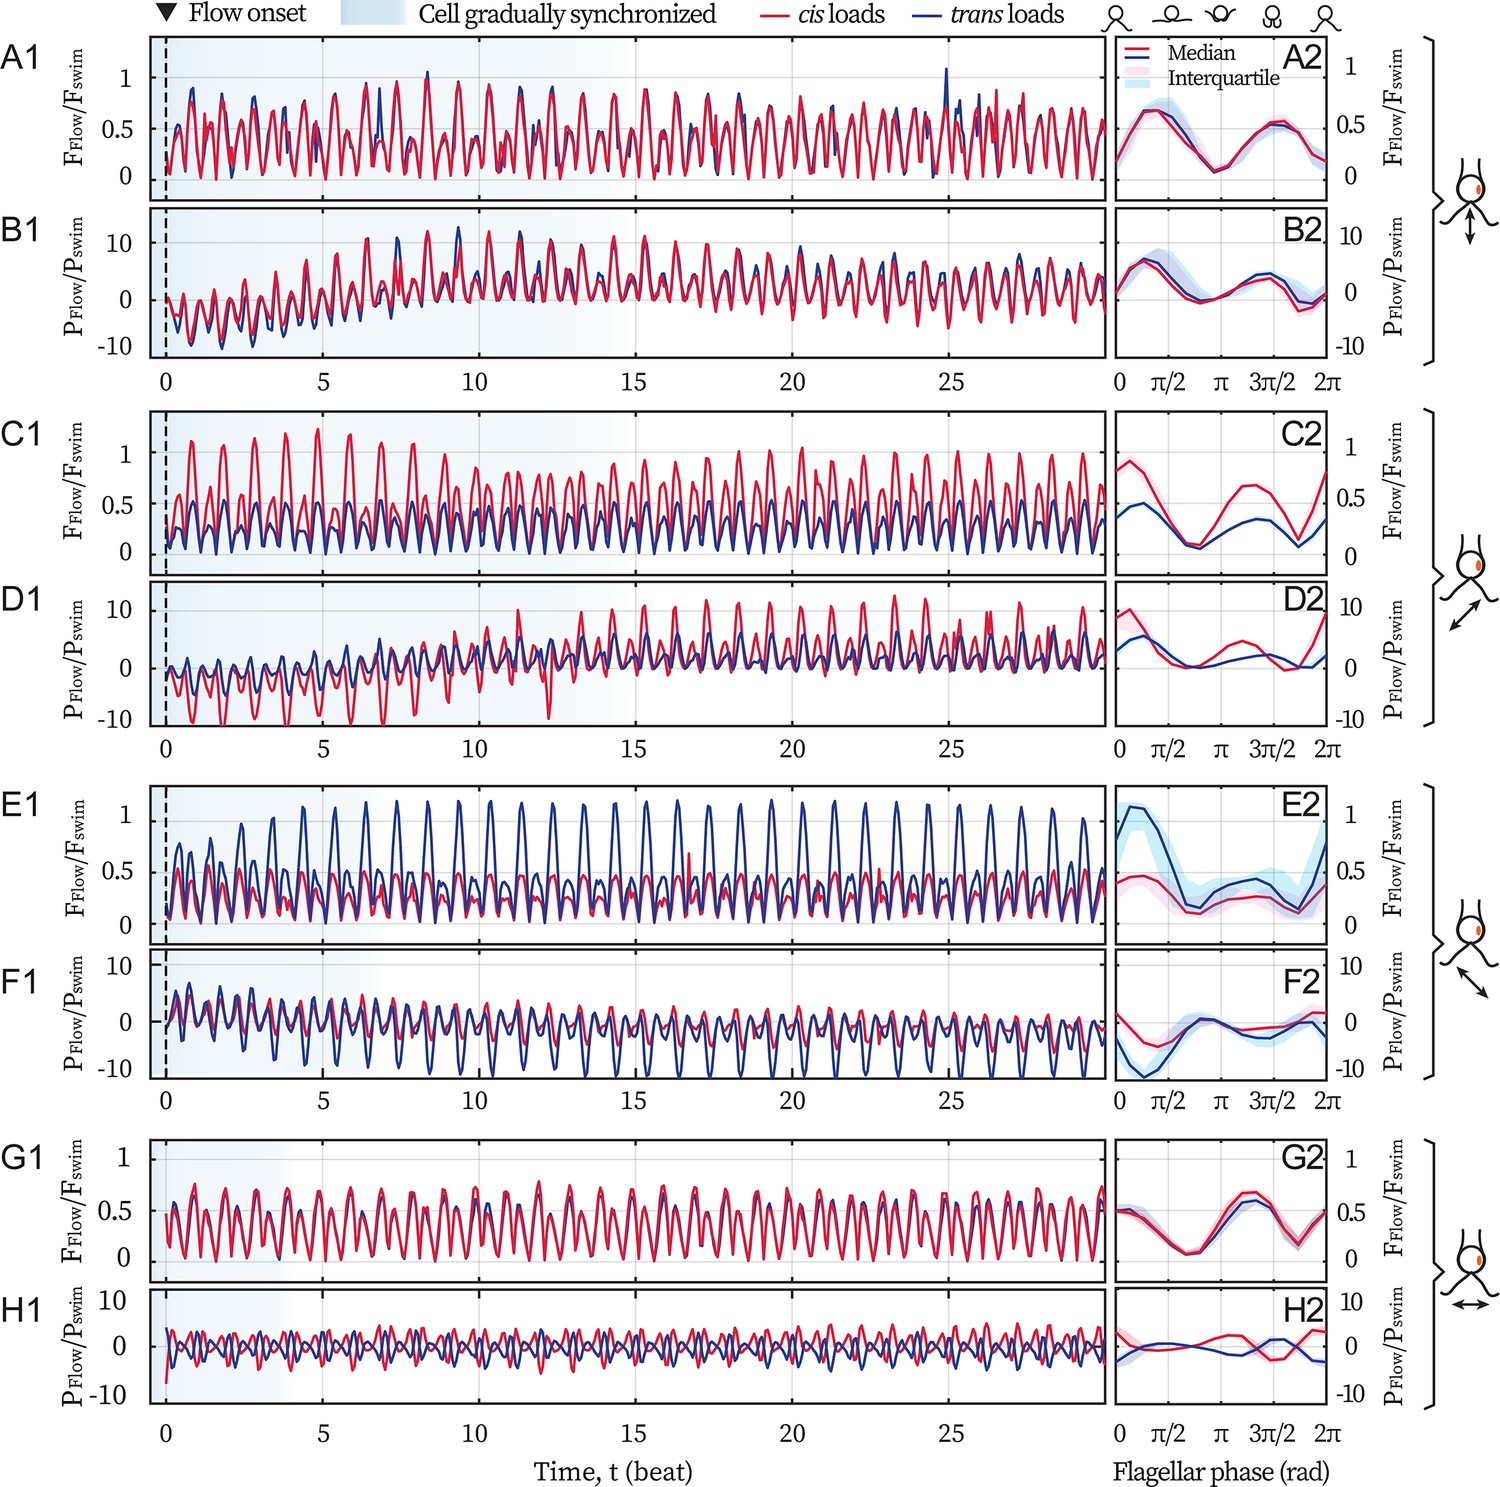
(A) Schematic representation of the experiment. C. reinhardtii cells captured by micropipette are subjected to sinusoidal background flows along given directions (θ) in the -plane. Video recording of flagellar beating (B) are thresholded and contrast-adjusted to highlight the flagella (C), and mean pixel values within the user-defined interrogation windows (red and blue circles) are used to compute observable-independent flagellar phases (D). Inset: flagellar phase difference of a representative wt cell during synchronous beating. Hydrodynamic computations are performed to evaluate the loads due to the background flow on each flagellum. These computations require the flagella to be tracked for the entire duration of the recordings (dashed lines in B) while external flows along a given θ are applied. (E, F, G) represent the hydrodynamic loads for cis-, frontal- and trans-flows along the θ= 45°, 90° and 135° respectively. Computed forces and the forces’ rates of work are presented for the cis (red) and the trans (blue) flagellum. N≈30 periods during entrainment are used to compute the median (lines) and the interquartile (shadings). Dotted horizontal lines: loads averaged over an entrained beat. Force magnitudes and powers are scaled by =9.9 pN and =1.1 fW respectively. Flagellar phase corresponds to the displayed shapes in the middle x-axis.
The response of the flagella to the external hydrodynamic loads is therefore characterized by the difference between the flagellar phase and the phase of the oscillating flow . Hereafter, we refer to the synchronization of the flagellar beating with the imposed external flow as ‘flow entrainment’, in order to avoid confusion with the ‘synchronization’ between the cis and the trans flagella. In our experiments, the cis and trans flagella always beat synchronously, therefore flow entrainment always takes place for both flagella simultaneously, regardless of the flow’s direction.
Differential external loads are selectively exerted on the cis- and the trans-flagellum by imposing oscillatory background flows at an angle with respect to the cell’s symmetry axis. We use numerical simulations to quantify the differential loads exerted by flows along different angles θ = 45° , 90°, and 135°, on the cis- and the trans flagellum, see Figure 1A. For each experiment, we track both flagella for the entire duration of the recording, see Figure 1B. We use the tracked motion of the flagella together with the oscillatory background flow as the boundary conditions to solve the Stokes equations numerically. Our numerical approach uses boundary element methods (BEM) and slender-body theory (SBT), from which we can directly deduce the total drag force on each flagellum as well as the associated power of the viscous forces on each flagellum. In the linear Stokes regime, the drag force is the sum of the contributions due to the motion of the flagella and the motion of external flow. Our simulations allow us to compute both contributions separately. We present the loads induced by the external flow and (see Materials and methods for details). Our computations provide the loads on the flagella throughout the entire experiment, from the time the captured cell is gradually entrained by the external flow, see Appendix 1: Hydrodynamic computation for asymmetric loading for the entire time series. Figure 1E,F,G represent the loads on each flagellum for flows with θ = 45°, 90°, 135°, after the cell is fully entrained. The variations of the loads are presented for one period of the power-recovery stroke, and have been obtained by phase averaging over N≈30 periods. Upper panels display the magnitude of the drag force ; while lower panels show associated power . Each panel presents the forces and powers on the cis and the trans-flagellum in red and blue respectively. The force magnitudes are scaled by = 9.9 pN; while the powers by fW. is the Stokes drag on a typical free-swimming cell (radius μm, speed μm/s, water viscosity mPa·s).
Along θ = 90°, the external flow loads both flagella symmetrically (Figure 1F). However, for flows with θ = 45°, the loads on the cis-flagellum (red) are ~2 times stronger than those on the trans (blue)(Figure 1E, ), whereas flows with θ = 135° do the opposite (Figure 1G). The selectivity also manifests in (the absolute values of) . We do notice that flows along θ = 135° are able to entrain the flagella with , meaning that the flagella are working against the flows, and this shall be discussed in later sections. Our computations demonstrate that flows along θ = 45° impose stronger loads on the cis flagellum, and we will refer to these as cis-flows, hereon forward. Likewise, flows on θ = 135° selectively load the trans and we denote these as trans-flows. Finally, the flows along θ = 90° that approach the cell from the front will be called frontal-flows.
Results
Experimental results
Frontal-flow entrains both the wt and ptx1 cells
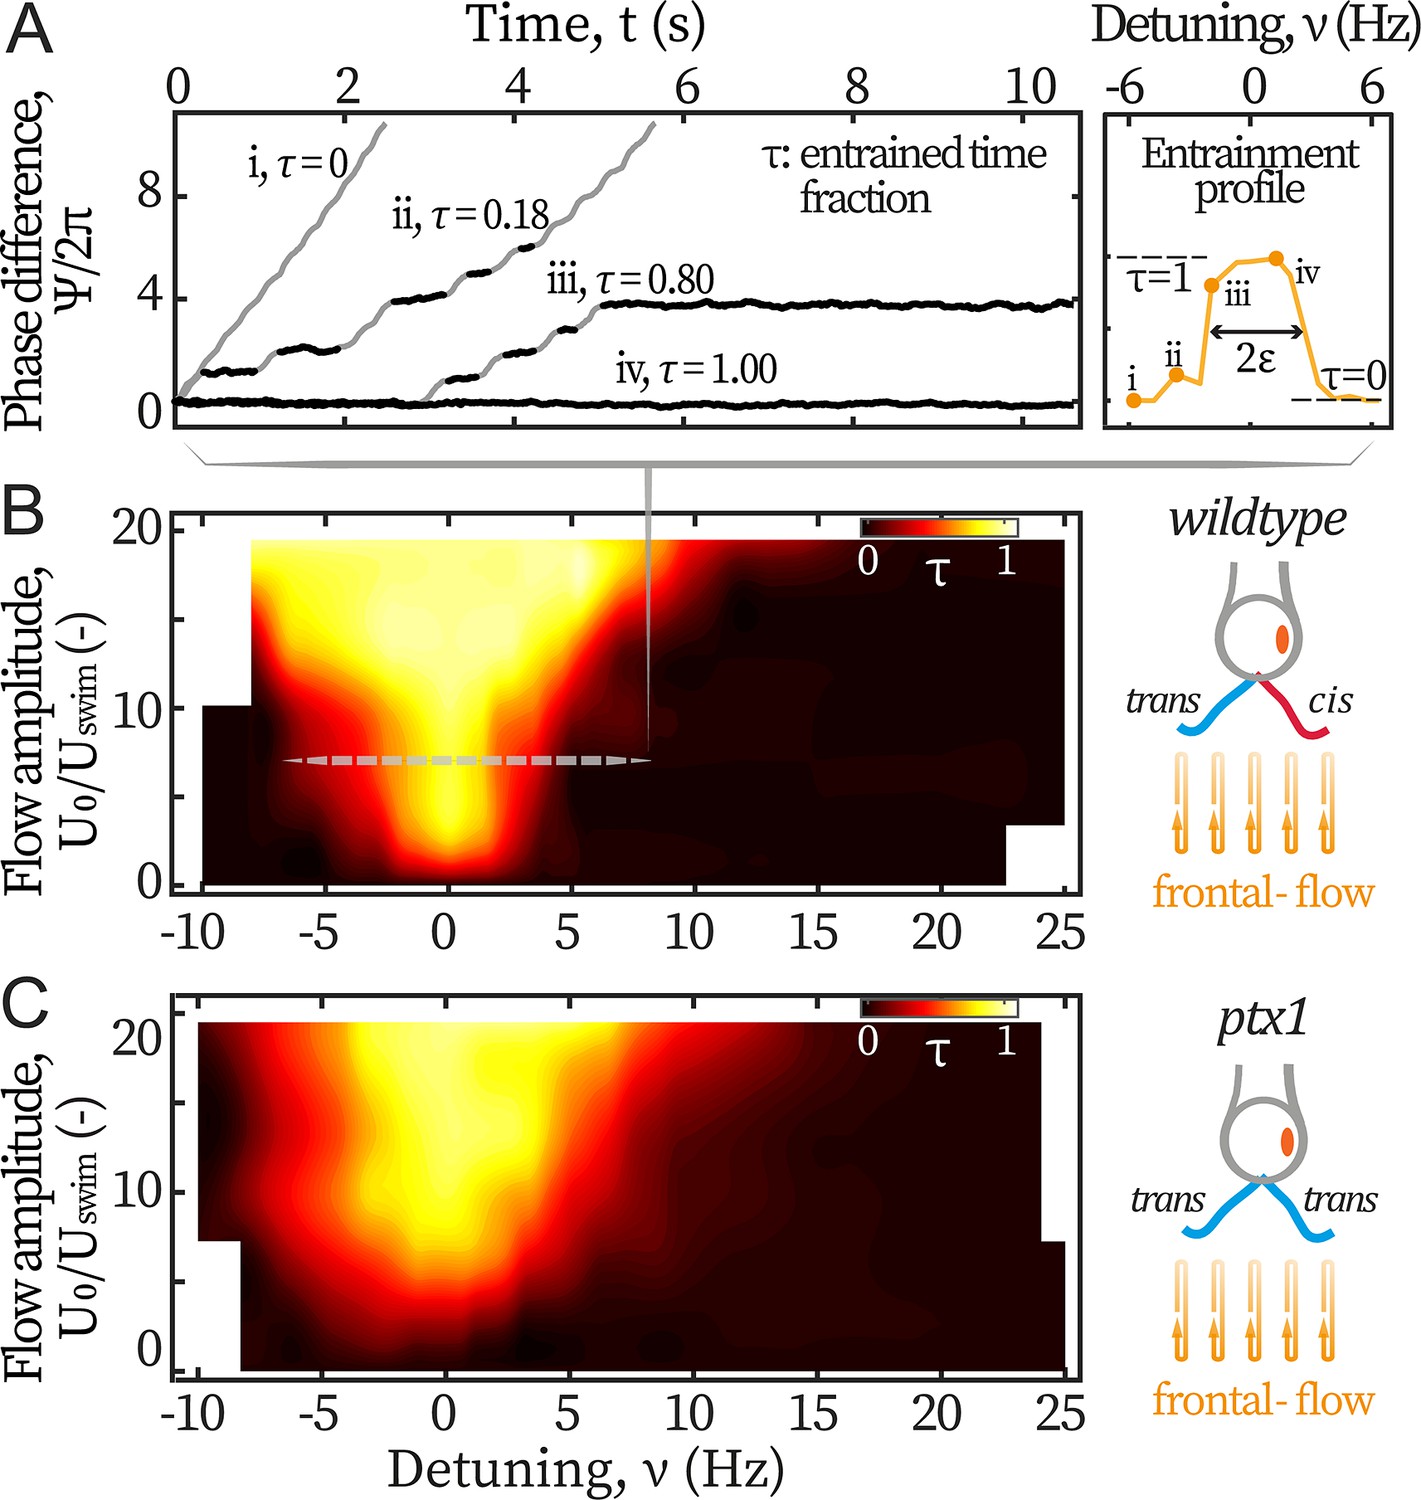
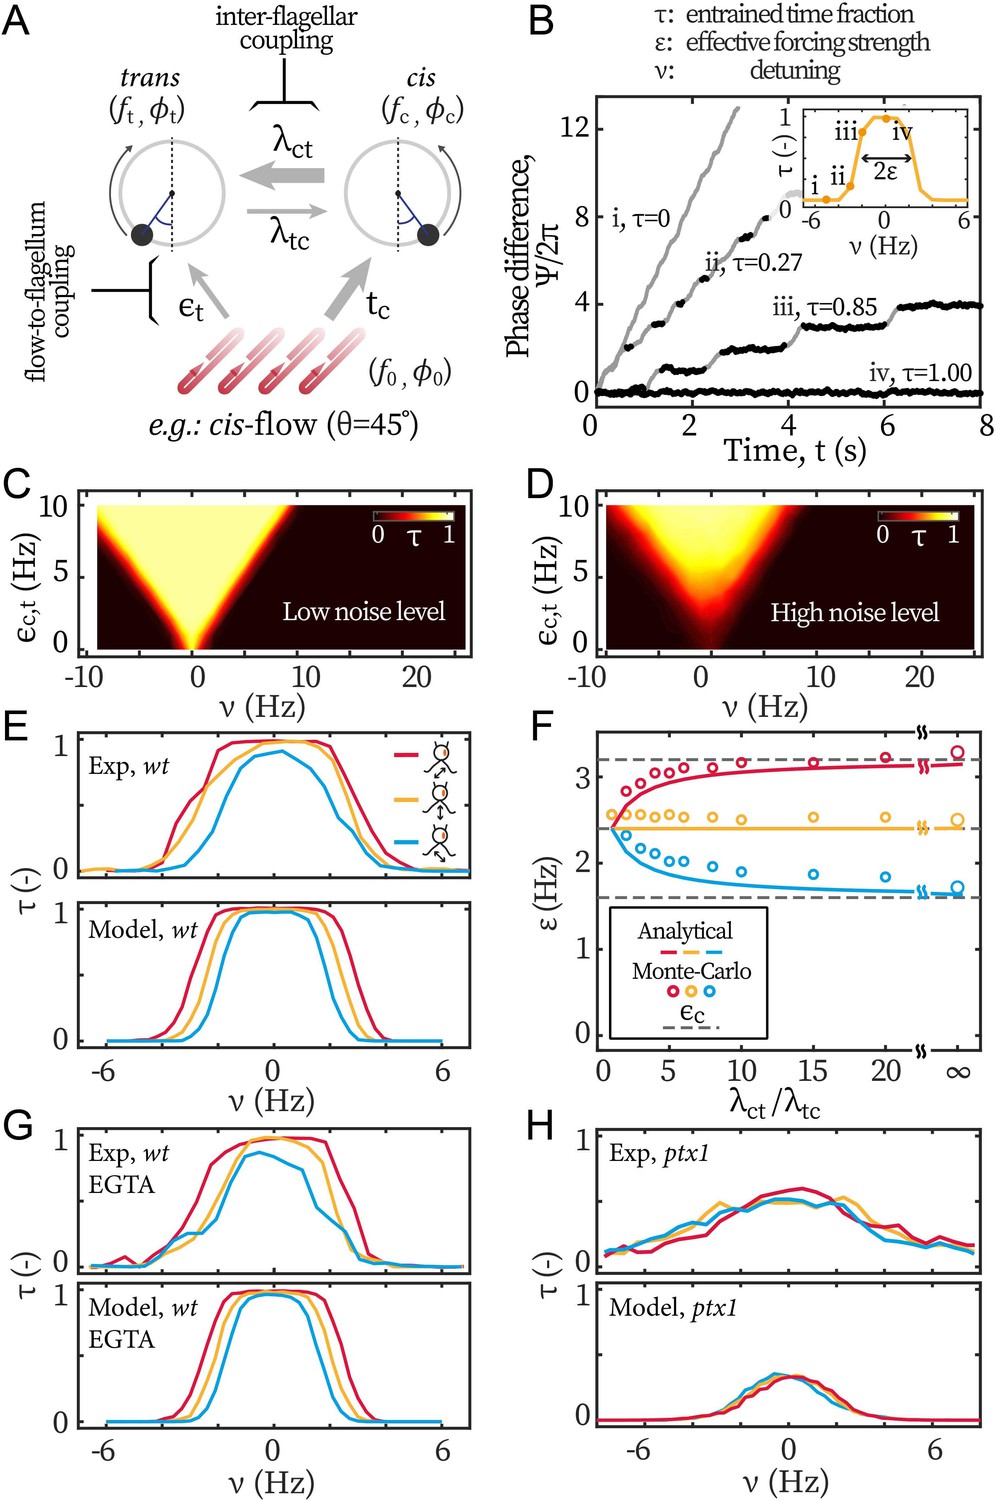
We first study the cells’ response to symmetric hydrodynamic loads, i.e., frontal-flows. Captured cells are subjected to flows of various amplitudes varying between 390 and 2340 µm/s, and frequencies varying between 40 and 75 Hz. The scanned range covers reported intrinsic frequencies of both the cis and trans flagellum (Kamiya and Witman, 1984; Kamiya and Hasegawa, 1987; Rüffer and Nultsch, 1987; Takada and Kamiya, 1997), while the amplitude reaches the maximum instantaneous speed of a beating flagellum (~ 2000 µm/s). Figure 2A displays representative variations of the phase difference between the flagella and the flow, for different frequencies of the forcing (expressed in terms of the detuning , Pikovsky et al., 2001). Entrainment of the flagella by the flow is characterized by plateaus in the phase difference , marked in black on Figure 2A. This typical dynamics of the phase difference between the flagella and the external periodic forcing is well captured by the Adler equation (Pikovsky et al., 2001; Polin et al., 2009; Friedrich, 2016):
(1)
Figure 2
Entrainment of wt and ptx1 cells by frontal-flows.
(A) Phase dynamics of at varying detunings . Traces i to iv are taken at detunings marked as shown in the right panel. denotes interchangeably. Plateaus marked black represent flow entrainment () whose time fractions / are noted. is the total time of recording. Right panel: The ‘flow entrainment profile’, , whose width () measures the flow’s effective forcing strength . Arnold tongue diagram of a representative wt cell (B) and a representative ptx1 cell (C) tested with frontal-flows. The dashed slice in B corresponds to the data shown in A. The contour is interpolated from N=132 measurements (6 equidistant amplitudes × 22 equidistant frequencies). Color bar for ptx1: with the total time of in-phase synchronous beating.
with the flow’s effective forcing strength. describes the sensitivity of the flagellar phase to the external stimuli, and it thus depends on both the absolute strength of the flow as well as the biological susceptibility of the flagella. In this study, is experimentally measured from the phase dynamics to quantify the flow entrainment effectiveness. represents a white noise that satisfies , with an effective temperature and the Dirac delta function.
By definition, entrainment corresponds to a constant phase difference (). Solving Equation 1 under this condition, one sees that entrainment is only possible when the effective forcing strength is strong enough: . Therefore, we can experimentally vary and measure directly by the frequency range where flow entrainment is established. The quality of entrainment is described by the entrained time fraction /, where is the total time where the beating is entrained and the flow’s duration, see Materials and methods.
In Figure 2A, the traces range from: no entrainment (=0, i) and unstable entrainment (, ii-iii), to stable entrainment (=1, iv). In this study, the frequency range of for which is considered as the region where entrainment is established, and is used as a measure for the flagellum-flow coupling strength (see Figure 2A right panel). This method measures accurately when noises are low ( rad2/s for typical values of frequencies and couplings used in this work). In this regime, this straightforward method is equivalent to previous methods based on multi-parameter curve fitting (Wan et al., 2014; Quaranta et al., 2015) but is more robust (Appendix 1: Extracting coupling strength by fitting phase dynamics).
The flow entrainment landscape over the entire scanned ranges is presented in Figure 2B. Up until the strongest flow amplitude, the external forces cannot disrupt the synchronized flagellar beating. In addition, entrainment is never established around frequencies other than Hz. Both phenomena indicate that the inter-flagellar coupling is much stronger than the flows’ maximum effective forcing ( Hz, see Appendix 1: Monte-Carlo simulations).
We also examine the flagellar dominance mutant ptx1 whose two flagella are both putatively considered trans flagella (Horst and Witman, 1993; Rüffer and Nultsch, 1997; Rüffer and Nultsch, 1998; Okita et al., 2005; Leptos et al., 2013): they respond similarly to changes of calcium concentrations (Horst and Witman, 1993) and have similar beating frequencies when demembranated and reactivated (Okita et al., 2005). Ptx1 mutants have two modes of synchronous beating, namely, the in-phase (IP) mode and the anti-phase (AP) mode (Rüffer and Nultsch, 1998; Leptos et al., 2013). By applying frontal-flows over the same ranges of frequencies and amplitudes, we find that the IP beating, which is in a similar breaststroke-like pattern to that of wt and is also around Hz, is the only mode that can be flow-entrained. We focus on this mode and report as for this mutant, where is the total time of IP-beating under the applied flows, see Figure 2C. Albeit noisier, the Arnold tongue of ptx1 covers a slightly larger width compared to wt’s, meaning that the breaststroke beating of two trans flagella is similarly entrainable as that by one cis and one trans (Figure 2B–C right panels). This finding indicates that the trans flagellum is at least as susceptible to hydrodynamic loads as the cis.
Cis-flow entrains wt cells more effectively than trans-flow
Next, we study how a cell is entrained by asymmetric flagellar loads. To each captured cell, we apply cis-flows and trans-flows of a fixed amplitude () but at varying detunings (see Materials and methods), and we compare the flows’ effective forcing to quantify the cells’ differential response.
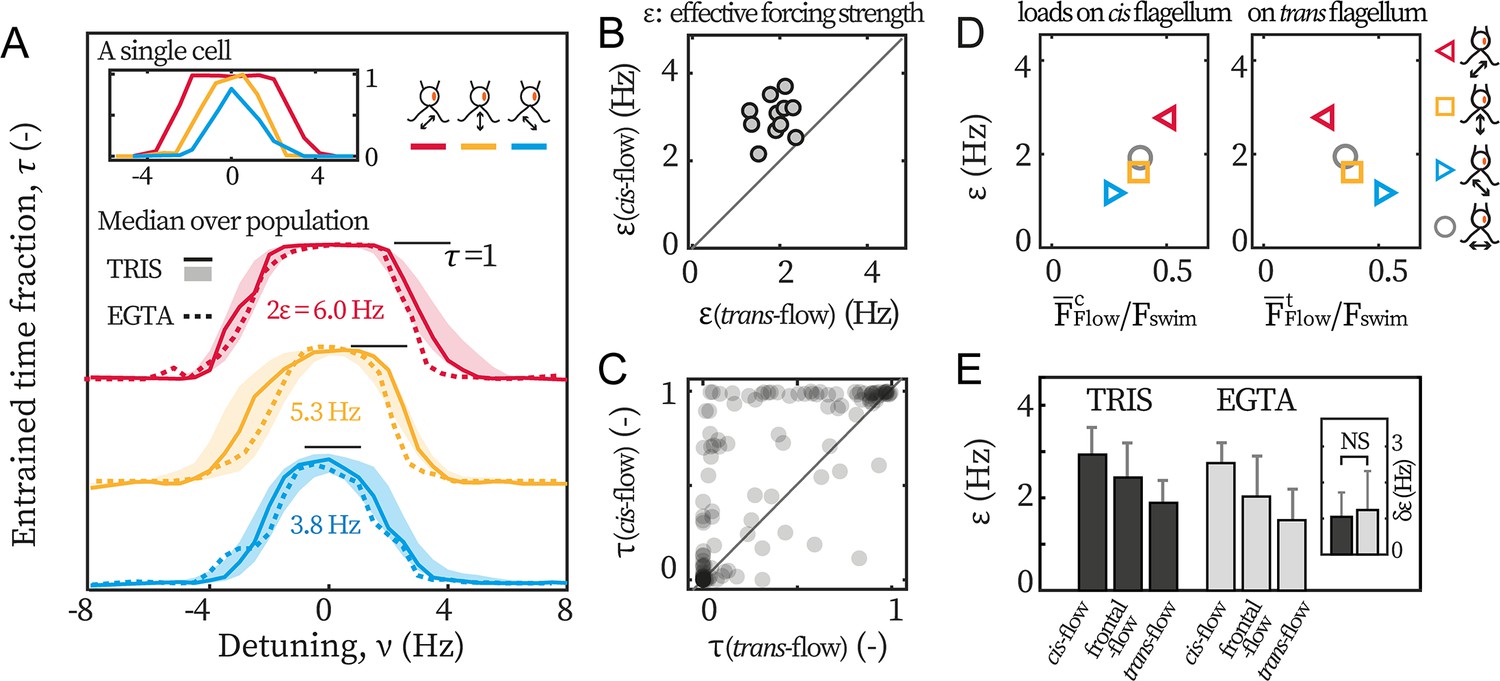
We find that cis-flows are the most effective in entraining the beating (Figure 3A). We illustrate this point with the entrainment profiles of an exemplary cell (Figure 3A inset). First, although both the cis-flow (red) and the trans-flow (blue) can entrain the cell at small detunings ( Hz), the cis-flow entrainment is more robust and lasts over the entire duration of the experiment (=1), while the trans-flow for a smaller time fraction ( ≈0.85). This is due to phase-slips (step-like changes in in Figure 2A) between flagella and the flow, and means that the trans-flow entrainment is less stable. Additionally, for intermediate detuning (), is always larger than . In some cases, the cis-flow entrains the cell fully whereas the trans-flow fails completely (e.g. at Hz). Together, these results imply that a flow of given amplitude entrains flagellar beating more effectively if it selectively loads the cis flagellum.
Figure 3
Cis-flow entrains wt cells the most effectively.
(A) The entrainment profiles of a representative wt cell (inset), the median profile of the TRIS group wt cells (N=11, solid lines) and the EGTA group (N=6, dashed lines), with either cis-flows (red), frontal-flows (yellow) or trans-flows (blue). Shaded areas are the interquartile ranges for the TRIS group. (B) Comparing against for each wt cells (TRIS group) tested. Solid line: the first bisector line (). (C) Comparing against for each cell at each flow frequency. Each point represents the time fractions of a particular cell entrained respectively by cis-flow and trans-flow of the same frequency. More than 90% of N=132 points are above the first bisector line (solid line). (D) Relations between and the loads on the cis and the trans flagellum. Markers represent different flow directions, see the drawings. (E) The effective forcing strengths of the TRIS group (black) and the EGTA group (gray). Bars and error bars: mean and 1 std., respectively. Inset: . NS: not significant, p>0.05, Kruskal-Wallis test, one-way ANOVA.
We repeat the experiments with cells from multiple cultures, captured on different pipettes, and with different eyespot orientations (~50% heading rightward in the imaging plane) to rule out possible influence from the setup. The entrainment profile of N=11 wt cells tested in the TRIS-minimal medium (pH = 7.0) are displayed in Figure 3A (labeled as ‘TRIS’). On average, = 2.9 Hz and is 70% larger than = 1.7 Hz. It bears emphasis that for every single cell tested (11/11), the relation holds true. In Figure 3B, we show this by representing each cell as a point whose - and coordinates are respectively its and . A point being above the first bisector line () indicates that for this cell. All cells cluster clearly above the line. The entrainment asymmetry is very robust and is observed in almost all separate experiments for each cell and each flow condition. In Figure 3C, each point corresponds to the time fractions of the same cell entrained by the cis-flow and the trans-flow at the same frequency. Most points (>90%) are above the first bisector line, meaning that . Altogether, all results show that selectively loading the cis flagellum better enables flow entrainment, pointing to cis and trans flagella playing differential roles in the synchronous beating.
To highlight the differential roles, we resolve how the flows’ effective forcing strengths depend on the actual hydrodynamic loads on each flagellum, see Figure 3D. The loads are characterized by the beat-averaged force, , on each flagellum (see corresponding horizontal lines in Figure 1E–G). These loads are computed for the cis-flow, trans-flow, and frontal-flow. Experimental and computational data of flows along θ = 0° (circles, Appendix 1: Hydrodynamic computation for asymmetric loading) are also included to substantiate the results. From Figure 3D, we see that the effective forcing strength scales with the beat-averaged drag on the cis, while we find no such correlation between and . Notably, the linear relation between and has an intercept near zero (). Given the total forces on both flagella () for these flows remains almost constant (0.74–0.79 ), the zero-intercept implies that for a hypothetical flow that exerts no load on the cis but solely forces the trans, it will not entrain the cell at all. This suggests that the hydrodynamic loads on the trans flagellum do not significantly contribute to flow entrainment for wt cells. We will later discuss the implications of this result in the context of our earlier observation that the trans flagella of ptx1 are susceptible to entrainment by external hydrodynamic loads.
Depletion of environmental calcium does not affect the asymmetric flow response
We examine whether this newly observed cis-trans asymmetry is affected by calcium depletion. Calcium is a critical second messenger for modulating flagellates’ motility and is deeply involved in phototaxis (Yoshimura, 2011). The depletion of the free environmental calcium is known to degrade flagellar synchronization and exacerbate flagellar asymmetry (Kamiya and Witman, 1984). Here, we focus on whether calcium depletion affects the asymmetry . We deplete environmental calcium by EGTA-chelation, following the protocol in Wakabayashi et al., 2009. Similar to previous reports (Kamiya and Witman, 1984; Pazour et al., 2005), the number of freely swimming cells drops significantly in EGTA-containing medium. However, the remaining cells beat synchronously for hours after capture. For these beating cells, calcium depletion is first confirmed by characterizing their deflagellation behavior. Indeed, calcium depletion is reported to inhibit deflagellation (Wan et al., 2014; Quarmby and Hartzell, 1994). In experiments with standard calcium concentration, all cells deflagellated under pipette suction (20/20). For experiments conducted in calcium depleting EGTA-containing medium, we observe deflagellation to occur in none but one cell (1/19).
After confirming the calcium depletion in our experiments, we perform the same sets of flow entrainment experiments. The dashed lines in Figure 3A show the median entrainment profiles for N=6 cells (labeled as ‘EGTA’). Clearly, the asymmetry is unaffected and it again applies for every single cell tested. The mere effect of calcium depletion appears to be a drop in the mean values of (Figure 3E). However, the difference between and is not affected, see for the two experimental conditions in Figure 3E inset.
ptx1 mutant loses the asymmetric flow response
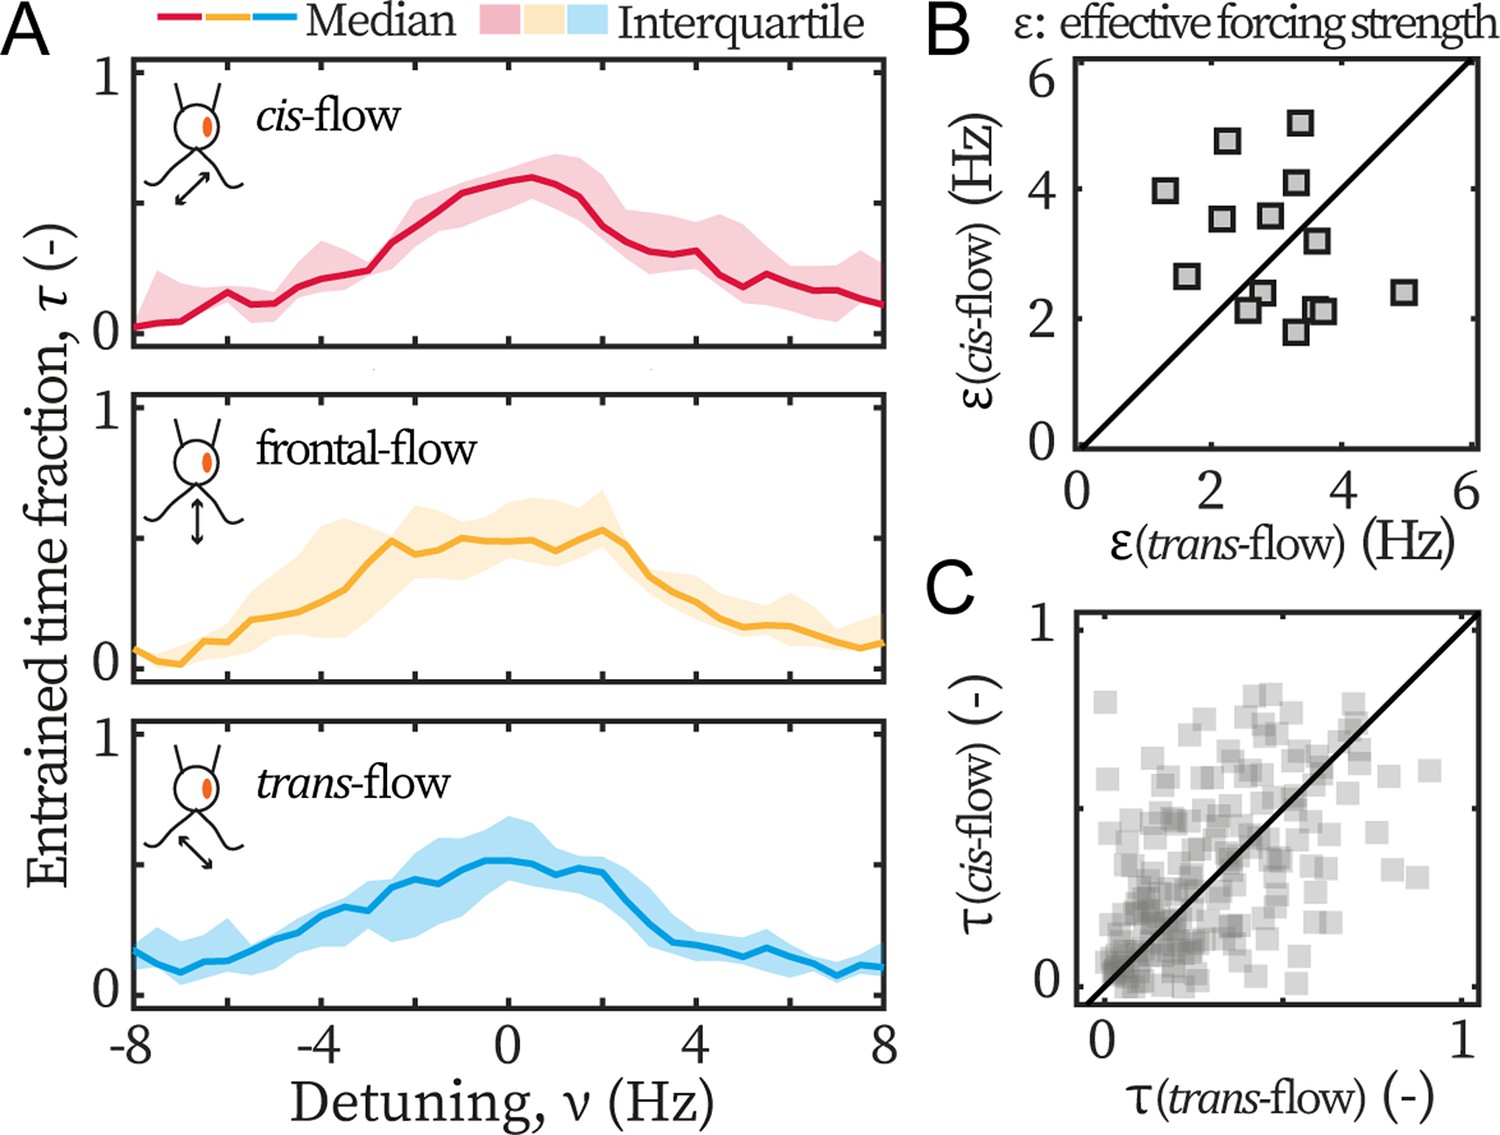
Lastly, we examine the asymmetry in ptx1. The entrainment profiles of ptx1 are shown in Figure 4A. The median profiles are of similar width and height, indistinguishable from each other, and hence indicate a loss of asymmetric susceptibility to flow entrainment, which are in sharp contrast to the profiles of wt (Figure 3A). The loss is further confirmed by the extracted and presented in Figure 4B-C, which are also significantly different from our results for wt cells (Figure 3B-C). For ptx1, cells and entrainment attempts are distributed evenly across the first bisector lines: 7/14 cells are above in Figure 4B, and ~50% points are above in Figure 4C. Altogether, all results consistently show that the asymmetry is lost in ptx1.
Figure 4
Ptx1 mutant loses the asymmetric flow response.
(A) Flow entrainment profiles of N=14 ptx1 cells, tested with cis-flows (red), frontal-flows (yellow) and trans-flows (blue). (B) and of the tested cells. The first bisector line (solid): . (C) and for each cell at each applied frequency (N=154 points). and denote respectively the effective coupling strength and the entrained time fraction during IP beating.
In addition, it is noteworthy that the measured for both wt and ptx1 are within the same range (2–4 Hz), indicating that both strains are similarly susceptible to external flow. Furthermore, the transition to flow entrainment is sharper for wt cells, in Figure 3A, compared to ptx1 cells, in Figure 4A. For wt, the flow entrainment is robustly established for the entire length of the experiment and for a range of . For frequencies further away from the intrinsic flagellar beating frequency (), the entrainment time sharply decreases to (Figure 3A). For ptx1 on the other hand, the transition is not as sharp (Figure 4A). This difference can be explained by a larger stochasticity in the beating of ptx1 compared to wt, which can be represented by a stronger noise for ptx1 compared to wt in Equation 1.
Model
Model experimental findings by three coupled oscillators
To investigate the implications of our experimental results on the coupling between flagella and their dynamics, we develop a model for the system (Appendix 1: Monte-Carlo simulations), representing flagella and external flows as oscillators with directional couplings:
(2)
respectively represent the phase of the flow, the cis, and the trans flagellum. represents the (inherent) frequency of the flow, the cis, and the trans, respectively. The first equation represents the imposed periodic forcing, while the other equations represent the Langevin dynamics for the phases of the cis and trans flagella. The phase dynamics of each flagellum is influenced by the interactions with the other flagellum as well as the interactions with the periodic hydrodynamic forcing. Here, represents the forcing exerted by the trans on the cis and , the forcing of the cis on the trans. is the hydrodynamic forcing on the cis and the one on the trans. In this simple model, we differentially vary and to match the values of the selective hydrodynamic loads () measured for each flow condition (Figure 1E–G). It bears emphasis that are input parameters of our model, whereas is measured from the phase dynamics to characterize the entrainment. In our simulations, is extracted following the same approach as in the experiments, see Figure 2A. Lastly, represent the uncorrelated white noises in the cis and trans flagellum respectively, whose strengths are . Figure 5A illustrates our model for flagellar beating subjected to cis-flows. The direction and thickness of arrows represent the coupling direction and strength respectively.
Figure 5
Modeling the asymmetric flow entrainment.
(A) Modeling scheme describing a cell beating under directional flow (cis-flow as an example). Arrows represent the directional coupling coefficients with line thickness representing the relative strength. For example, points from cis to trans and represents how sensitive the latter’s phase () is to the former’s phase (). Meanwhile, the arrow of being thicker than means that is much more sensitive to than the other way around. denote the sensitivity of to the flow’s phase . (B) Modeled phase dynamics of flow entrainment under frontal-flows, analogous to Figure 2A. Reproducing the Arnold tongue diagrams at the noise level of wt (C) and ptx1 (D), analogous to Figure 2B and Figure 2C respectively. (E) Flow entrainment profiles obtained experimentally (upper panel) and by modeling (lower panel). (F) as a function of the inter-flagellar coupling asymmetry . Points: measured from simulation; lines: analytical approximation (Equation 3); dashed lines: respectively for the cis-flow, frontal-flow, and trans-flow (from top to bottom). (G) Reproducing the flow entrainment of wt cells under calcium depletion. (H) Reproducing results of ptx1. See Table 1 for the modeling parameters.
Table 1
Modeling parameters.
| variable | symbol (unit) | TRIS | EGTA | ptx1 |
|---|---|---|---|---|
| Intrinsic freq. Kamiya and Hasegawa, 1987; Okita et al., 2005 | (Hz) | 45,65 | 45,65 | 45,65 |
| Basal coupling* | (Hz) | 60 | 60 | 60 |
| cis dominance Okita et al., 2005; Horst and Witman, 1993 | (-) | 4:1 | 4:1 | 1:1 |
| Flow detuning | (Hz) | [–10,10] | [–10,10] | [–10,10] |
| Total forcing Klindt et al., 2016 | (Hz) | 4.8 | 4.08 | 4.8 |
| Noise† Quaranta et al., 2015 | (rad2/s) | 1.57, 9.42 | 1.57, 9.42 | 9.42, 9.42 |
-
*
detailed in Appendix 1: Monte-Carlo simulations.
-
†
detailed in Appendix 1: Noise in the beating of the ptx1 mutant.
Equation 2 can be combined and readily reduced to a single equation, which has the form of the Adler equation (Equation 1) in the asymptotic limit of , see Appendix 1: Monte-Carlo simulations for detail. From this equation, we can directly write the quantities , and measured in our experiments as a function of the parameters from our model , , , and as
(3)
with . Remarkably, our experimental results are reproduced by the simple theoretical limit of , for which the beating dynamics of the cell, frequency and noise become equal to those of the cis flagellum, and the flow entrainment strength only depends on the forcing strength on the cis . approaching unity corresponds to the limit when for which the beating of the cis sets the beating of the trans and is not influenced by the trans. It should be mentioned that our main observation about the measured entrainment strength only depending on the cis-loading, can also be reproduced by assuming . This alternative limit implies that the trans flagellum has no susceptibility to hydrodynamic loads, which is inconsistent with our entrainment experiments of . In addition, is also necessary to explain the difference in noise and effective temperature between the wt and ptx1 experiments.
We perform Monte-Carlo simulations to solve the stochastic Equation 2, and determine the parameters of our simulations that reproduce our experimental results.
Coordinated beating under symmetric forcing
The values of the parameters used in our simulations are summarized in Table 1. We first model the flow entrainment induced by frontal-flow, for which the flagella are loaded symmetrically and . We take Hz and Hz following Kamiya and Hasegawa, 1987; Okita et al., 2005. We set as 2.4 Hz to match the measured from Figure 3A. The noises for cis and trans flagellum are rad2/s and rad2/s respectively. At similar detunings as in the experimental results in Figure 2A, our Monte-Carlo simulations reproduce the phase dynamics with: (i) no flow entrainment, (ii-iii) unstable entrainment, and (iv) stable entrainment (Figure 5B). Repeating the simulations for varying forcing strengths and frequencies yields Arnold tongue diagrams in agreement with those reported from our experiments. For wt, we assume asymmetric coupling strength, , while we assume a symmetric coupling strength for ptx1. With these values, the Arnold Tongue for wt in Figure 2B and ptx1 in Figure 2C are reproduced with simulations shown in Figure 5C and D respectively. For wt, the asymmetry does not affect the overall shape of the Arnold tongue but leads to a low noise level, which is induced by the cis, and is much lower than the noise of ptx1.
Coordinated beating under selective loading
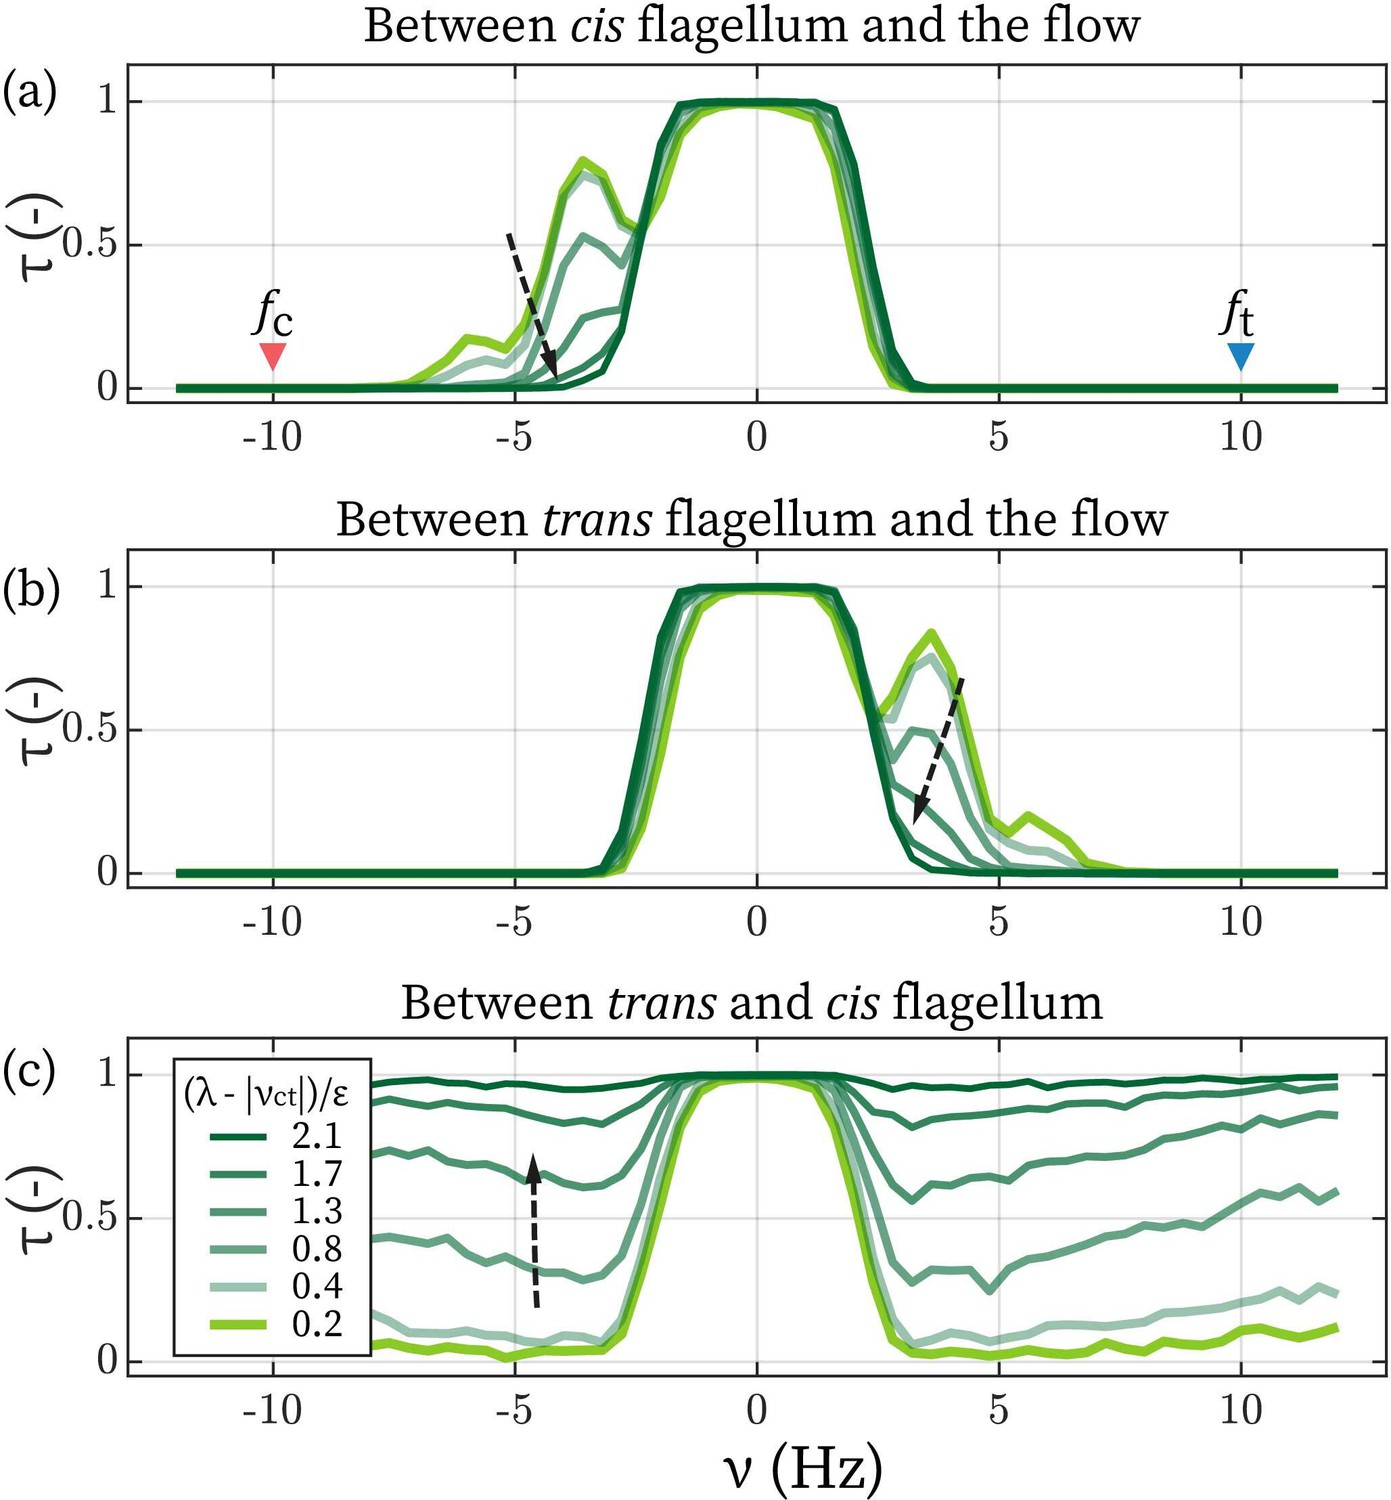
Next, we model flow entrainment by the cis-flows and the trans-flows. The selective forcing () allows the effect of flagellar dominance () to manifest in the effective forcing strength and hence in the entrainment profiles , Figure 5E. We derive the ratio between and from our computations, see Figure 1E–G, such that 2:1, 1:1, and 1:2 for the cis-flows, the frontal-flows, and the trans-flows respectively. With this setting, the model reproduces the experimental observations that the entrainment profile of cis-flow is consistently broader than that of frontal-flow (i.e. larger ), and the profile of trans-flow is always the narrowest (smallest ), see Figure 5E. Figure 5F shows how the asymmetry of inter-flagellar coupling () affects the asymmetry between the entrainment strength for the cis-flows and the trans-flows. The open symbols represent measured from modeled entrainment profiles and the lines represent Equation 3. The difference between and increases with . At large , the saturates to the forcing on the cis flagellum (, see the grey dashed lines in Figure 5F).
Our experimental results for wt cells under calcium depletion are reproduced with a lower total forcing strength (Figure 5G). is set to 4.08 Hz (15% lower) to reflect the 7% − 20% decrease in induced by calcium depletion (Figure 3E).
To reproduce the entrainment profiles of ptx1 in Figure 5H, both a stronger noise and a symmetric inter-flagellar coupling are needed: while the stronger noise lowers the maximal values of , setting would still result in in the central range ( Hz). Finally, it is noteworthy that the noise in ptx1 increases not only because of a higher noise value for individual flagella, but also because the cis-trans coupling has become symmetric. As shown by Equation 3, the unilateral coupling promotes not only the cis-frequency in the synchrony but also the cis-noise. Given and , we confirm with simulations that, for wt, the cis stabilizes the beating frequency of the trans. The simulations are in good agreement with experimental noise measurements, see Appendix 1: Noise in the beating of the ptx1 mutant for details.
Discussion
The two flagella of C. reinhardtii have long been known to have inherently different dynamic properties such as frequency, waveform, level of active noise, and responses to second messengers (Kamiya and Hasegawa, 1987; Okita et al., 2005; Leptos et al., 2013; Wan, 2018; Saegusa and Yoshimura, 2015). Intriguingly, when connected by basal fibers and beating synchronously, they both adopt the kinematics of the cis-(eyespot) flagellum, which led to the assumption that the flagella may have differential roles in coordination. In this work, we test this hypothesis by employing oscillatory flows applied from an angle with respect to the cells’ symmetry axis and thus exert biased loads on one flagellum.
In all our experiments with wt cells, we robustly observe that cis-flows, the ones that selectively load the cis flagellum, are always more effective in entraining the flagellar beating than the trans-flows. This is shown by the larger effective forcing strengths (, Figure 3B) and larger entrained time fractions (, Figure 3C). Mapping as a function of the loads, we find empirically that the flow entrainment strength scales with the hydrodynamic load on the cis, (Figure 3D) and that trans-loads appear to matter negligibly. These observations all indicate that the cis-loads determine whether an external forcing can entrain the cell. Moreover, this point is further highlighted by an unexpected finding: when trans-flows are applied, the trans flagellum always beats against the external flow () and the only stabilizing factor for flow entrainment is the cis flagellum working transiently along with the flow () during the recovery stroke (Figure 1G lower panel). These observations definitively prove that the two flagella have differential roles in the coordination and interestingly imply that flagella are coupled to external flow only through the cis.
To elucidate the mechanisms at the origin of this asymmetry, we develop a reduced stochastic model for the system, see Equation 2. In the model, selective hydrodynamic loading and flagellar dominance in the coordinated beating are respectively represented by and . Using this model, we express and , which we can measure experimentally (Equation 3), as a function of , , and to illustrate how the flagellar dominance and selective loading affect the coordinated flagellar beating. Moreover, with Monte-Carlo simulations, we clarify the interplay between flows and flagella (Appendix 1: Monte-Carlo simulations), and reproduce all experimental observations. We show that a ‘dominance’ of the cis () is sufficient to explain the experimental phenomenology comprehensively. This dominance means that the cis-phase is much less sensitive to the trans-phase than the other way around. We then reproduce the phase dynamics of flow entrainment at varying detunings (Figure 5B), amplitudes (Figure 5C), and noises (Figure 5D). Exploiting the observation that the coordination between flagella cannot be broken by external flows up to the strongest ones tested ( Hz, Figure 2B), we quantify the lower limit of the total basal coupling, , to be approximately 40 Hz (deduced in Appendix 1: Monte-Carlo simulations), which is an order magnitude larger than the hydrodynamic inter-flagellar coupling (Quaranta et al., 2015; Brumley et al., 2014; Klindt et al., 2016; Pellicciotta et al., 2020).
Dynamic modulation of flagellar dominance during synchronous beating is the basis of C. reinhardtii’s tactic motility (Kamiya and Witman, 1984; Horst and Witman, 1993; Pazour et al., 2005; Okita et al., 2005). Calcium has long been speculated to facilitates such dynamic modulation (Rüffer and Nultsch, 1997; Wan et al., 2014; Guo et al., 2021) because it is involved in switching the beating mode (Hayashi et al., 1998) and in tuning flagellar beating amplitude (Kamiya and Witman, 1984; Okita et al., 2005), and calcium influx comprises the initial step of the cell’s photo- (Harz and Hegemann, 1991) and mechanoresponses (Yoshimura, 2011). We therefore investigate flagellar coupling in the context of tactic steering by depleting the environmental free calcium and hence inhibiting signals of calcium influxes. Cells are first acclimated to calcium depletion, and then tested with the directional flows. Our results show that the cis dominance in the synchronous beating does not require the involvement of free environmental calcium. Calcium depletion merely induces an overall drop in the forcing strength perceived by the cell (), which is captured by reducing for 15% (mean drop) in the model (Figure 5G). In contrast to the speculation that calcium is involved in the dynamic modulation of ciliary dominance in synchronous beating (Rüffer and Nultsch, 1997; Wan et al., 2014; Guo et al., 2021), our results indicate that the leading role of cis (i.e., ) is an inherent property, which does not require active influx of external calcium, and possibly reflects an intrinsic mechanical asymmetry of the cellular mesh that anchors the two flagella into the cell body.
In ptx1 cells, a lack of flagellar dominance () and a stronger noise level are necessary to reproduce our experimental observations. Previous studies suggested that both flagella of ptx1 are similar to the wildtype trans (Horst and Witman, 1993; Rüffer and Nultsch, 1997; Okita et al., 2005), and that the noise levels of this mutant’s synchronous beating are much greater than those of wt (Leptos et al., 2013) (see also Appendix 1: Noise in the beating of the ptx1 mutant). If both flagella and their anchoring roots indeed have the composition of the wildtype trans, such symmetry would predict . This symmetric coupling leads to a noise for ptx1 (Equation 3), which is about an order of magnitude larger than the noise of wt .
The comparison between ptx1 and wt highlights an intriguing advantage of the observed unilateral coupling (); that is, it strongly suppresses the high noise of the trans. Considering that the trans is richer in CAH6 protein and this protein’s possible role in inorganic carbon sensing (Mackinder et al., 2017; Choi et al., 2016), the trans may function as a more active sensor than the cis. Assuming the sensing-related bio-activities is at the origin of trans’ strong noise, then because the unilateral coupling prevents the noise from disrupting the cell’s synchronous beating and effective swimming, it allows the cell to combine the benefit of having a stable cis as the driver and a noisy trans as a sensor.
Materials and methods
Cell culture
Request a detailed protocolC. reinhardtii wildtype (wt) strain cc125 (mt+) and flagellar dominance mutant ptx1 cc2894 (mt+), obtained from the Chlamydomonas Resource Center, are cultured in TRIS-minimal medium (pH = 7.0) with sterile air bubbling, in a 14 hr/10 hr day-night cycle. Experiments are performed on the fourth day after inoculating the liquid culture, when the culture is still in the exponential growth phase and has a concentration of ∼2 × 10⁵ cells/ml. Before experiments, cells are collected and resuspended in fresh TRIS-minimal (pH = 7.0).
Calcium depletion
Request a detailed protocolIn calcium depletion assays, cells are cultured in the same fashion as mentioned above but washed and resuspended in fresh TRIS-minimal medium +0.5 mM EGTA (pH = 7.0). Free calcium concentration is estimated to drop from 0.33 mM in the TRIS-minimal medium, to 0.01 µM in the altered medium (Wakabayashi et al., 2009). Experiments start at least one hour after the resuspension in order to acclimate the cells.
Experimental setup
Request a detailed protocolSingle cells of C. reinhardtii are studied following a protocol similar to the one described in Quaranta et al., 2015. Cell suspensions are filled into a customized flow chamber with an opening on one side. The air-water interface on that side is pinned on all edges and is sealed with silicone oil. A micropipette held by micro-manipulator (SYS-HS6, WPI) enters the chamber and captures single cells by aspiration. The manipulator and the captured cell remain stationary in the lab frame of reference, while the flow chamber and the fluid therein are oscillated by a piezoelectric stage (Nano-Drive, Mad City Labs), such that external flows are applied to the cell. Frequencies and amplitudes of the oscillations are individually calibrated by tracking micro-beads in the chamber. Bright field microscopy is performed on an inverted microscope (Nikon Eclipse Ti-U, 60× water immersion objective). Videos are recorded with a sCMOS camera (LaVision PCO.edge) at 600–1000 Hz.
Measurement scheme
Request a detailed protocolThe flagellar beating of each tested cell is recorded before, during, and after the application of the flows. We measure the cell’s average beating frequency over 2 s (~100 beats). For ptx1 cells, is reported for the in-phase (IP) synchronous beating. Unless otherwise stated, directional flows (θ = 0°, 45°, 90°, 135°) are of the same amplitude (780±50 µm/s, mean±std), similar to those used in Quaranta et al., 2015. Flow frequencies are scanned over [, ] Hz for each group of directional flows.
Computation of the flagellar loads
Request a detailed protocolTo quantify the hydrodynamic forces on the flagella, we first track realistic flagellar deformation from videos wherein background flows are applied. Then we employ a hybrid method combining boundary element method (BEM) and slender-body theory (Keller and Rubinow, 1976; Wei et al., 2021) to compute the drag forces exerted on each flagellum and the forces’ rates of work. In this approach, each flagellum is represented as a slender-body (Keller and Rubinow, 1976) with 26 discrete points along its centerline and the time-dependent velocities of each of the 26 points are calculated by the point’s displacement across frames. The cell body and the pipette used to capture the cell are represented as one entity with a completed double layer boundary integral equation (Power and Miranda, 1987). Stresslet are distributed on cell-pipette’s surface; while stokeslets and rotlets of the completion flow are distributed along cell-pipette’s centerline (Keaveny and Shelley, 2011). The no-slip boundary condition on the cell-pipette surface is satisfied at collocation points. Lastly, stokeslets are distributed along the centerlines of the flagella, so that no-slip boundary conditions are met on their surfaces. Integrating the distribution of stokeslets over a flagellar shape, one obtains the total drag force . Similarly, the force’s rate of work is computed as , where is the velocity of the flagellum at the position along the centerline.
The computations shown in this study are based on videos of a representative cell which originally beats at ~50 Hz. The cell is fully entrained by flows along different directions (θ = 0°, 45°, 90°, 135°) at 49.2 Hz. In the computations, the applied flows are set to have an amplitude of 780 µm/s to reflect the experiments. Computations begin with the onset of the background flows (notified experimentally by a flashlight event), and last for ~30 beats (500 frames sampled at 801 fps). Additionally, we confirm the results of trans-flow-entrainment, that both flagella spend large fractions of time beating against the flows, with other cells and with trans-flows at other frequencies.
Isolate loads of external flows
Request a detailed protocolThe total loads ( and ) computed consist of two parts, one from the flow created by the two flagella themselves and the other from the flow imposed. In the low Reynolds number regime, the loads of the two parts add up directly (linearity): , and . To isolate and , we compute and by running the computation again but without the external flows, and obtain and .
Compute time fraction of phase-locking
Request a detailed protocolIn practice, phase-locking is considered established if phase difference, either between the two flagella (Δ) or between the flow and flagella (), varies slow enough over time. Here, we use to illustrate the process. We first break down an entire time series ( s) to segments of 0.1 s (~5 beats). A given segment is considered phase-locked if rad/s. This particular threshold ( rad/s) is equivalent to a frequency mismatch of 0.5 Hz, which is smaller than our frequency resolution in scanning the detuning (~0.8 Hz).
Modeling parameters
Request a detailed protocolWe assume the flagellar intrinsic frequencies and to be 45 Hz and 65 Hz respectively (Kamiya and Hasegawa, 1987; Okita et al., 2005; Wan et al., 2014). On this basis, is assumed to be 4:1 to account for the observed Hz. is set as 2:1, 1:1, and 1:2 for the cis-flows, the frontal-flows, and the trans-flows respectively, see Figure 1E–G. The underlying assumptions are: the two flagella are equally susceptible to loads, and the effective coupling strength is linearly proportional to the hydrodynamic load. Additionally, is assumed to be constant to reflect the fact that does not vary with flow directions (0.74–0.79 ). The noise levels for the cis- and the trans flagella are taken as rad2/s. Under unilateral flagellar coupling, the collective noise level approximates to and the value corresponds to typical experimental observations (Quaranta et al., 2015). The sum of inter-flagellar coupling is set to be large enough, i.e., , to account for the fact that: (1) the coordinated beating is approximated in-phase, and (2) up until the strongest flow applied, the inter-flagellar synchronization cannot be broken (quantitative evaluation is detailed in Appendix 1: Monte-Carlo simulations). To model wt cells under calcium depletion, we decrease by 15% - which is the mean decrease in the observed , , and (Figure 3E). For ptx1 cells, we assume a symmetric inter-flagellar coupling and set the noise level of both flagella to that of the trans, rad2/s. The parameters are summarized in Table 1.
Appendix 1
Hydrodynamic computation for asymmetric loading
Here, we present the computation results for the flagellar loads under flows of different directions, see Appendix 1—figure 1. Realistic flagellar shapes are tracked from the video recordings. Background flows begin with a marked event (flash light) which defines the zero time (see the dashed lines at t=0). After several beats (shaded in blue), the cell becomes entrained by the flows, see the left panels Appendix 1—figure 1A1-H1. Meanwhile, the right panels (A2-H2) show the median and the interquartile range of and over the flow-entrained beats, respectively. Force magnitudes are scaled by = 9.9 pN, which is the Stokes drag on a typical free-swimming cell (radius R=5 µm, swim velocity = 110 µm/s); while the viscous powers are scaled by = 1.1 fW. Here µ = 0.95 mPa·s is the dynamic viscosity of water at 22 °C. Panels A2-F2 are presented and described in the main text. For the flow along 0°, the mean force is 0.37 and 0.34 (panel G2) while the mean power is –0.2 and –0.4 (H2), for the cis and the trans flagellum respectively.
Appendix 1—figure 1
Hydrodynamic computations of the loads on the flagella.
Computations are based on recordings of different directional flows (49.2 Hz) entraining the same cell ( Hz). Computed drag forces (A1) and the force’s rate of work (B1) on the cis (red) and the trans (blue) flagellum for 30 cycles, when the cell is subjected to the frontal-flow (θ = 90°). Black dashed lines mark the onset of the applied flow. Blue shading in the background represents the beating cycles before the cell is entrained. Magnitude of the drag forces (A2) and the power of the flow (B2) averaged over the flow-entrained cycles. The solid lines and the shaded areas represent the median and the interquartile range respectively. (C–D) Same as (A–B) but for the cis-flow (θ = 45°). (E–F) Results for the trans-flow (θ = 135°). (G–H) Results for the flow with θ = 0°. Scaling factors =9.9 pN and =1.1 fW.
Extracting coupling strength by fitting phase dynamics
In the main text, the flagellum-flow forcing strength in wt cells is mainly extracted from the entrainment profile ( 0.5). Meanwhile, in previous works (Polin et al., 2009; Quaranta et al., 2015), fitting the distribution of phase dynamics is employed to extract . In the latter approach, the idea is that the phase locking during entrainment leads to a peaked probability distribution of (the difference between the flagellar phase and the flow’s phase), whose width is broadened by the noise. The distribution, , can be derived from the Adler equation (Equation 1 in the main text) as:
(4)
Here is a wash-board potential, is the effective temperature in phase dynamics.
Here, we demonstrate that these two approaches are equivalent in extracting . For all wt cells tested in the TRIS-minimal medium (N=11), their measured by the width and extracted from fitting are plotted against each other, Appendix 1—figure 2. All points center around the identity line (y=x), showing the equivalence in obtaining by the two methods. For the ptx1 dataset displayed in the main text, are extracted from fitting the phase dynamics.
Appendix 1—figure 2
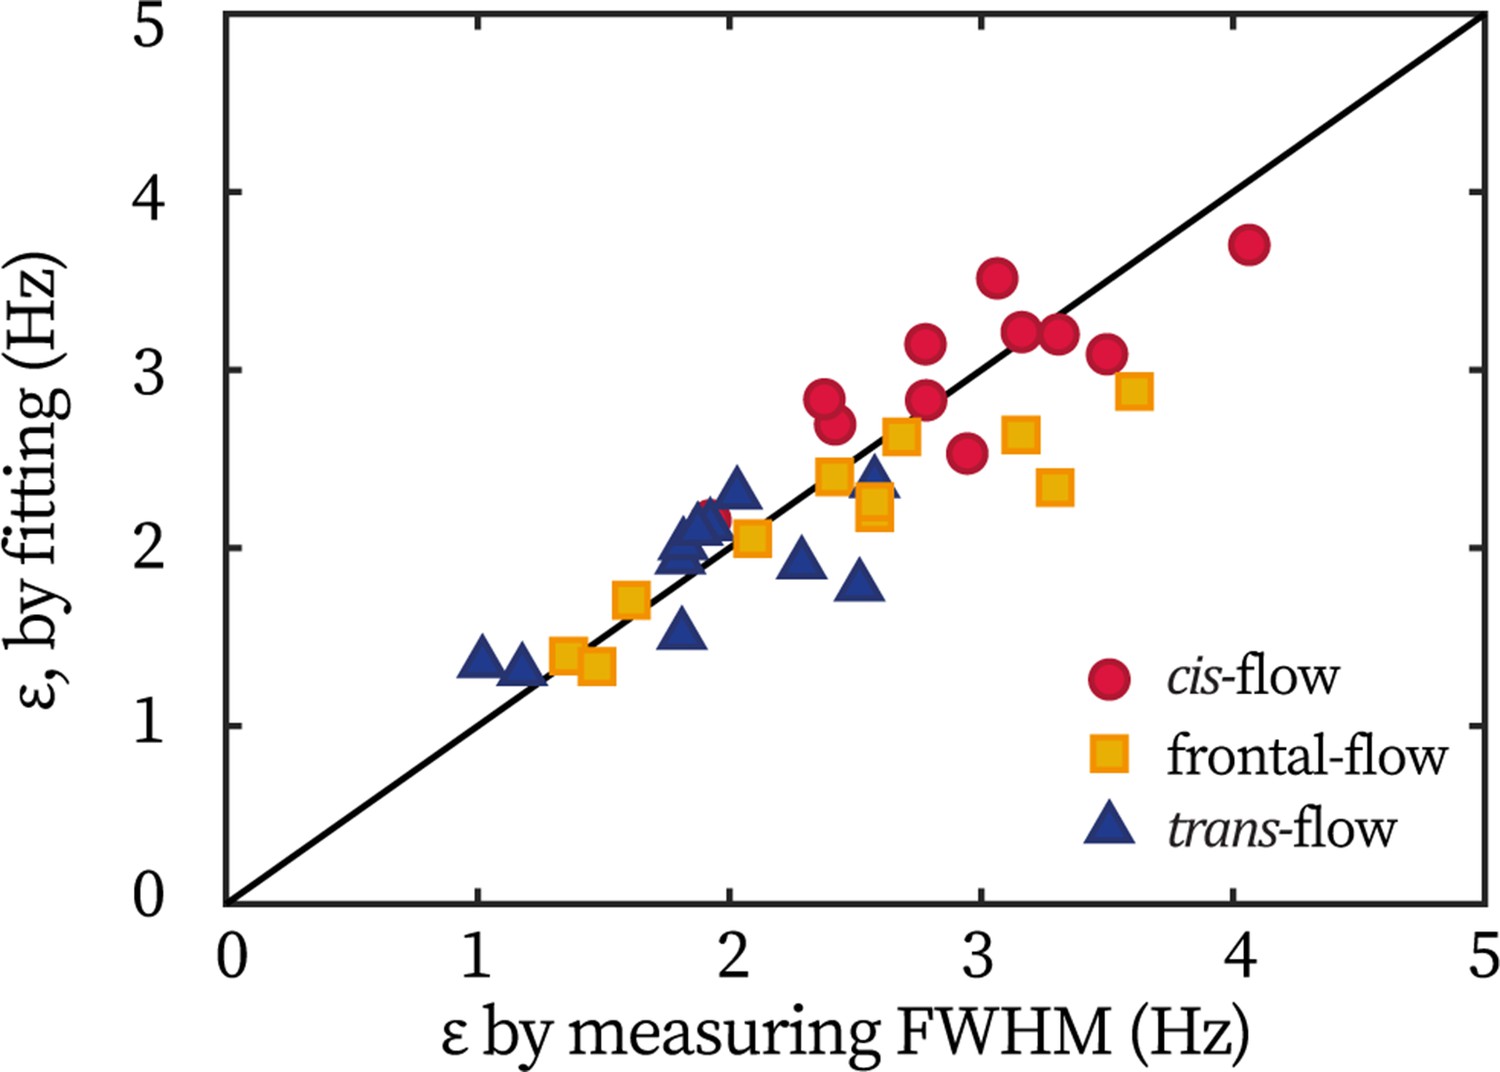
Equivalence of extracting coupling strength by different methods.
Each point represents one cell under either the frontal-flow (yellow square), the cis-flow (red circle), or the trans-flow (blue triangle). The coordinate is the coupling strength measured by the half width of entrainment profile, ; and the coordinate is obtained by fitting the flagellar phase dynamics.
Monte-Carlo simulations
Governing equations for the phase dynamics
The external flow and the two flagella are described by three coupled ordinary differential equations (ODEs), for the phase of the cis flagellum , the phase of the trans flagellum , and the phase of the external flow :
(5)
The phase dynamics , and depend on the intrinsic frequencies, with the frequency of the external flow, and the intrinsic beating frequencies of the cis and the trans flagellum respectively. represents the strength of the forcing exerted by the trans flagellum on the cis flagellum and the forcing exerted by the cis flagellum on the trans flagellum. Finally, represents the strength of the susceptibility of the cis flagellum to flow entrainment and the susceptibility of the trans flagellum to flow entrainment. The flow is assumed to be noise free (Equation 5), the cis and the trans-flagella are assumed to have noise levels and respectively. The noises are assumed to be Gaussian, such that = 2 . In this study, the phase dynamics of these equations are examined using Monte-Carlo simulation. The temporal resolution of the simulations () is 1ms, which corresponds to the experimental frame rates (801 Hz). Hereafter, we derive analytical solutions to these equations in the limits of oscillatory steady states. For this, we rewrite the phase dynamics as functions of the inter-flagellar phase difference Δ and the average flagellar phase defined as:
(6)
Here, represents the difference between the average phase and the phase of the flow forcing . For a complete summary of the symbols used throughout this article, please see Appendix 1—table 1. Equation 5 can be rewritten as:
(7)
where , , , , . The phases from both flagella can be easily recovered from the phase difference and the average phase, as: , .
Appendix 1—table 1
Summary of the symbols used in both the main text and the Appendix 1.
| Frequency of the synchronous beating without external flow | |
|---|---|
| Intrinsic frequencies of the cis or trans flagellum | |
| Frequency of the external flow | |
| Detuning, the flow-flagella frequency mismatch, | |
| Flagellar phase | |
| Phase of the cis or trans flagellum | |
| Phase of the external flow | |
| Phase difference between flagella, | |
| Mean flagellar phase | |
| Phase difference between the flow and the flagella, | |
| Effective forcing strength, describing flow-flagella coupling | |
| Forcing strength of external flow on the cis or trans flagellum | |
| Influence of the cis flagellar phase on the trans flagellar phase | |
| Influence of the trans-phase on the cis-phase | |
| Noise of the synchronous beating | |
| Noise of the cis or trans flagellum | |
| Effective temperature of the synchronous beating | |
| Effective temperature of the cis or trans flagellum |
Flagellar synchronization
We first consider the synchronization between the cis- and the trans flagella, in the absence of external flow, such that we assume: and . When the flagella are synchronized to one another, , we can directly deduce from Equation 7 that the two flagella beat synchronously at the frequency:
(8)
In addition, from Equation 7 we can deduce the steady-state phase difference , which satisfies:
(9)
It is therefore obvious that the two flagella can only synchronize () when .
Interaction between three oscillators
We focus our discussion on the case when the cis and the trans flagella are synchronized in phase, as is observed in all of our experiments. Here, and , which is realized for values of the parameters such that: . Equation 7 reduces to:
(10)
with . For the sake of clarity, we recall here that , , and . It is noteworthy that Equation 10 is the same Adler equation as the one introduced in Equation 1 of the main text. This equation represents the phase dynamics of a single phase oscillator evolving under external periodic forcing (Pikovsky et al., 2001). In this strong-coupling limit, when inter-flagellar coupling strength are much larger than flow’s effective forcing strength , the coupled flagella simply work as one single oscillator of intrinsic frequency . The phase dynamics is characterized by , and , which are weighted averages of , and - the characteristics of the cis and trans flagella. Our main experimental observations can all be explained by the limit when the inter-flagellar forcing of the cis on the trans is much larger than that of the trans on the cis, such that . In this case, , which is consistent with the observation that flow entrainment is only a function of the hydrodynamic loads on the cis flagellum. Lastly, is consistent with the observation that the noise in the phase dynamics when wt cells are entrained by the flow, is much smaller than the noise recorded for ptx1, which is putatively considered to have two trans flagella. In fact, when , satisfies even in the absence of imposed flows, which explains why the breaststroke beating (IP mode) of ptx1 is much noisier than that of wt (see the last section of Appendix 1).
Lower limit of inter-flagellar coupling
Lastly, we turn to the model’s behaviors when two flagella are not necessarily in synchrony, and we focus on the regime where is comparable to . The primary question is: from the fact that even the strongest flow in our experiment could not disrupt inter-flagellar synchrony, can we infer a lower limit of λ? We assume Hz (Kamiya and Hasegawa, 1987; Kamiya, 2000; Okita et al., 2005; Wan et al., 2014) and focus on the entrainment by the frontal-flow. To further simplify the picture, coupling between cis and the trans are set as equal, .
Appendix 1—figure 3
Determine the lower limit of λ.
The time fractions of the cis (a) and the trans flagellum (b) entrained by the flow. (c) The time fraction of where cis and trans are synchronized. Arrows points towards increasing .
The value with determines if the flow can disrupt the synchrony between cis and trans. We plot the synchronization/entrainment profiles with increasing λ in Appendix 1—figure 3. When it satisfies , external flows cease to affect the flagellar synchronization observably. As the strongest flow () applied experimentally corresponds to Hz, altogether, we conclude that Hz. In the main text, we set Hz, which satisfies this relation and matches the observation that the phase lag between the flagella (Δ) is small.
Noise in the beating of the ptx1 mutant
Here, we show an as-yet uncharacterized strong noise present in the synchronous beating of the mutant ptx1. The in-phase (IP) mode of ptx1 cells and the breaststroke beating of the wt cells are similar in waveform and frequency (Horst and Witman, 1993; Rüffer and Nultsch, 1997; Leptos et al., 2013). However, the former has a much stronger noise.
Appendix 1—figure 4
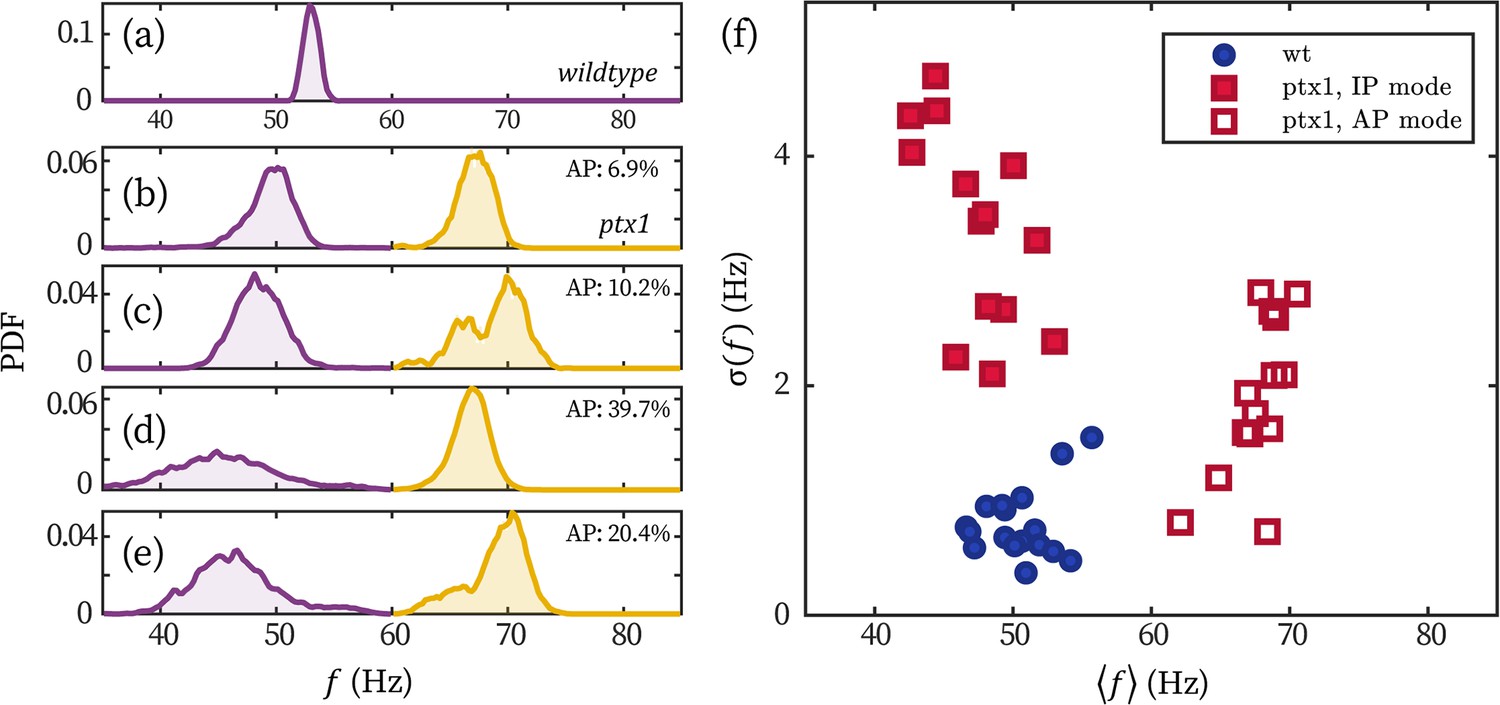
Stronger frequency fluctuation of the IP mode of ptx1 cells.
(a–e) Representative probability distributions of the beating frequency of a wt (a) and four ptx1 cells (b–e) over 30 seconds. Probability distributions of the IP (purple) and AP mode (yellow) are respectively normalized for better visualization. The time fractions of the AP mode are noted in each panel. (f) The wt and ptx1 cells represented by its mean beating frequency and the standard deviation of the beating frequencies over time .
The strong noises show obviously in fluctuations of IP beating frequencies (similar to data shown in Leptos et al., 2013). In Appendix 1—figure 4, we display the distribution of beating frequency of a representative wt cell (panel a) and four representative ptx1 cells (panels b-e). The broad peaks of the IP (purple) and AP (yellow) beating of ptx1 sharply contrast the narrow peak of wt. We quantify the frequency fluctuations of all the cells displayed in the main text (N=11 for wt and N=14 for ptx1) in Appendix 1—figure 4f. The cells are represented by their mean beating frequencies over time and the standard deviations . Clearly, the breaststroke beating of wt, the IP, and the AP mode of ptx1 each forms a cluster. The wt cluster is at Hz (mean±1 std. over cell population); and is less dispersed than both the IP- and the AP modes of ptx1, which are at Hz and Hz, respectively. Under the assumption of a white (Gaussian) noise, is proportional to the amplitude of phase noise , and thus scales with . Considering that for ptx1 is three- to fivefolds larger than that of wt, we conclude that the effective temperature of phase dynamics in ptx1 is an order of magnitude larger than wt, .
Appendix 1—figure 5
Effect of a low-noise cis in stabilizing the beating of the trans.
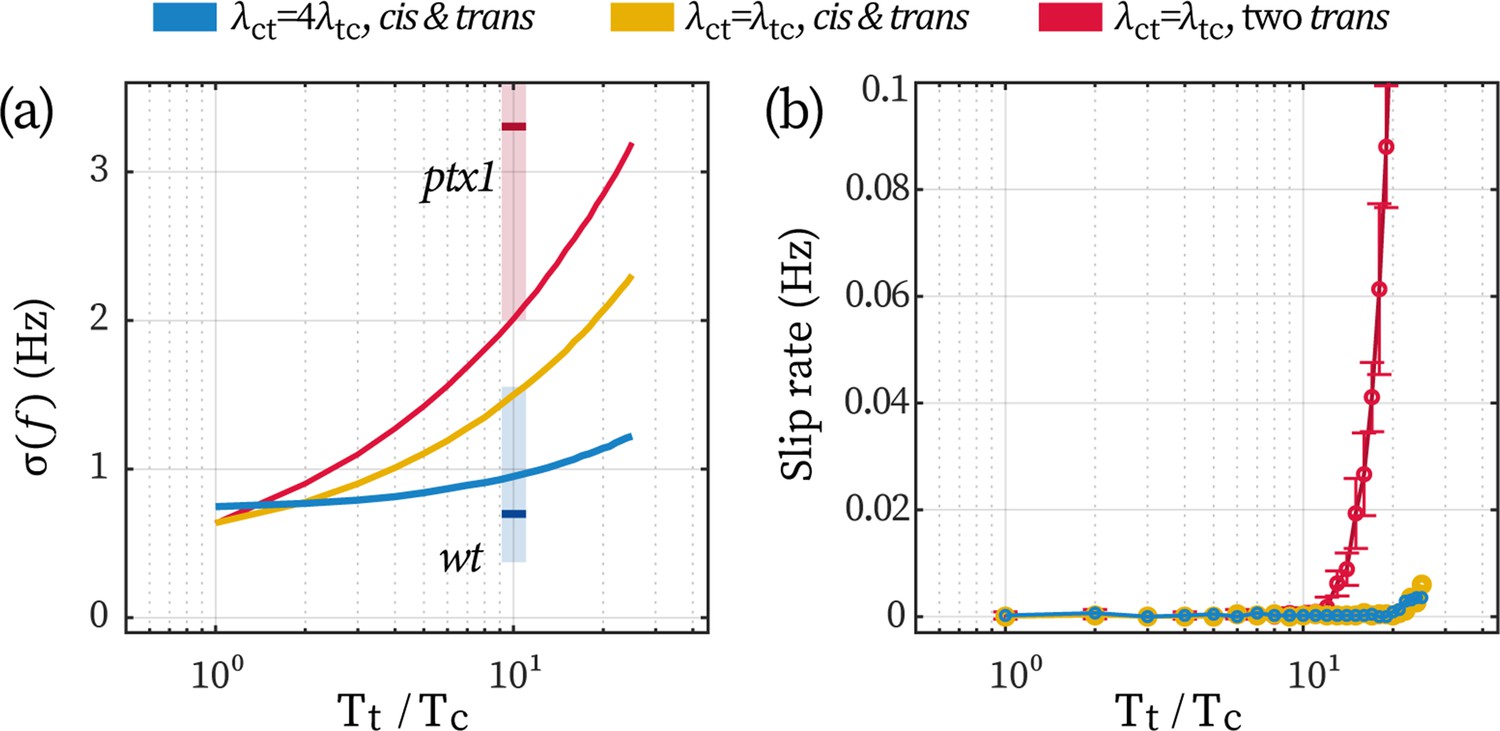
(a) Fluctuations in beating frequency () under different coupling schemes and flagellar noises. Other model parameters are the same as used in the main text. The colors of the lines correspond to the three cases explained in the text hereafter. The red and blue vertical shades represent the experimentally observed range for ptx1 and wt cells, respectively, with short bars marking the mean values. (b) The rate of slip under the conditions. Error bars correspond to 1 std. over N=9 repetitions.
The stronger noise in ptx1 can be attributed to two sources, namely, the loss of a stable cis and the loss of the unilateral coupling, Appendix 1—figure 5. We perform Monte-Carlo simulations of the coupled beating of two flagella under three conditions (see the blue, yellow, and red data in Appendix 1—figure 5 respectively): (1) a cis coupled with a trans unilaterally (); (2) a cis coupled with a trans reciprocally (); and (3) two trans flagella coupled with each other reciprocally. We fix the noise level of the cis at and we vary the noise of the trans to compare how the increase in trans-noise would destabilize the synchronous flagellar beating.
When a trans is unilaterally following the cis, increasing the trans-noise over an order of magnitude only leads to a ~20% stronger frequency fluctuation (the blue line in Appendix 1—figure 5a). On the contrary, lacking either the unilateral coupling or the low-noised cis would increase the fluctuation for 200% (yellow line) or 300% (red line). Qualitatively, simulation results are in agreement with experimental measurements assuming that , see the red and blue shaded areas in Appendix 1—figure 5a. Additionally, even when the cis- and trans flagella exert equal forcing on one another (), having a low-noise cis flagellum already helps prevent phase slips from interrupting the inter-flagellar synchrony. This can be seen from Appendix 1—figure 5b: as long as a low-noise cis is present (yellow and blue data), slips will be sparse (< 0.01 Hz). Together, these simulation results highlight the stabilizing effect of a low-noise cis flagellum, and illustrate that a unilateral coupling further enhances the stabilization.
Data availability
The data and the code underlying this study is openly available at the 4TU. ResearchData repository: https://doi.org/10.4121/21972695. Codes for modeling and plotting, and the hydrodynamic computations' data are included.
-
4TU.ResearchDataDataset and codes underlying "The younger flagellum sets the beat for C. reinhardtii".https://doi.org/10.4121/21972695
References
-
A steering mechanism for phototaxis in ChlamydomonasJournal of the Royal Society, Interface 12:20141164.https://doi.org/10.1098/rsif.2014.1164
-
Calcium ion regulation of flagellar beat symmetry in reactivated sea urchin spermatozoaBiochemical and Biophysical Research Communications 58:795–800.https://doi.org/10.1016/s0006-291x(74)80487-0
-
Hydrodynamic synchronization of flagellar oscillatorsThe European Physical Journal Special Topics 225:2353–2368.https://doi.org/10.1140/epjst/e2016-60056-4
-
The steering gaits of spermPhilosophical Transactions of the Royal Society B 375:20190149.https://doi.org/10.1098/rstb.2019.0149
-
Intracellular coupling modulates biflagellar synchronyJournal of the Royal Society, Interface 18:20200660.https://doi.org/10.1098/rsif.2020.0660
-
Real-time observation of Ca2+-induced basal body reorientation in ChlamydomonasCell Motility and the Cytoskeleton 41:49–56.https://doi.org/10.1002/(SICI)1097-0169(1998)41:1<49::AID-CM4>3.0.CO;2-A
-
BookChapter 13 - sensory Photoreceptors and light control of Flagellar activityIn: Harris EH, Stern DB, Witman GB, editors. The Chlamydomonas Sourcebook. Academic Press. pp. 395–429.https://doi.org/10.1016/B978-0-12-370873-1.00050-2
-
ptx1, a nonphototactic mutant of Chlamydomonas, lacks control of flagellar dominanceThe Journal of Cell Biology 120:733–741.https://doi.org/10.1083/jcb.120.3.733
-
Intrinsic difference in beat frequency between the two flagella of Chlamydomonas reinhardtiiExperimental Cell Research 173:299–304.https://doi.org/10.1016/0014-4827(87)90357-0
-
Applying a second-kind boundary integral equation for surface tractions in Stokes flowJournal of Computational Physics 230:2141–2159.https://doi.org/10.1016/j.jcp.2010.12.010
-
Slender-body theory for slow viscous flowJournal of Fluid Mechanics 75:705–714.https://doi.org/10.1017/S0022112076000475
-
Load response of the flagellar beatPhysical Review Letters 117:1–5.https://doi.org/10.1103/PhysRevLett.117.258101
-
Phase dynamics of coupled oscillators reconstructed from dataPhysical Review E 77:066205.https://doi.org/10.1103/PhysRevE.77.066205
-
Antiphase synchronization in a flagellar-dominance mutant of ChlamydomonasPhysical Review Letters 111:1–5.https://doi.org/10.1103/PhysRevLett.111.158101
-
Transitions in synchronization states of model cilia through basal-connection couplingJournal of the Royal Society, Interface 15:20180450.https://doi.org/10.1098/rsif.2018.0450
-
Asymmetric properties of the Chlamydomonas reinhardtii cytoskeleton direct rhodopsin photoreceptor localizationThe Journal of Cell Biology 193:741–753.https://doi.org/10.1083/jcb.201009131
-
Proteomic analysis of a eukaryotic ciliumThe Journal of Cell Biology 170:103–113.https://doi.org/10.1083/jcb.200504008
-
BookSynchronization: A Universal Concept in Nonlinear SciencesCambridge University Press.https://doi.org/10.1017/CBO9780511755743
-
Second kind integral equation formulation of stokes’ flows past a particle of arbitrary shapeSIAM Journal on Applied Mathematics 47:689–698.https://doi.org/10.1137/0147047
-
Hydrodynamics versus intracellular coupling in the synchronization of eukaryotic flagellaPhysical Review Letters 115:238101.https://doi.org/10.1103/PhysRevLett.115.238101
-
Two distinct, calcium-mediated, signal transduction pathways can trigger deflagellation in Chlamydomonas reinhardtiiThe Journal of Cell Biology 124:807–815.https://doi.org/10.1083/jcb.124.5.807
-
Flagellar photoresponses ofptx1, a nonphototactic mutant ofChlamydomonasCell Motility and the Cytoskeleton 37:111–119.https://doi.org/10.1002/(SICI)1097-0169(1997)37:2<111::AID-CM3>3.0.CO;2-B
-
Flagellar coordination in Chlamydomonas cells held on micropipettesCell Motility and the Cytoskeleton 41:297–307.https://doi.org/10.1002/(SICI)1097-0169(1998)41:4<297::AID-CM3>3.0.CO;2-Y
-
A Chlamydomonas outer arm dynein mutant missing the alpha heavy chainThe Journal of Cell Biology 113:615–622.https://doi.org/10.1083/jcb.113.3.615
-
BookDynein-mediated Photobehavioral responses in ChlamydomonasIn: Ueki N, editors. Dyneins. Elsevier Ltd. pp. 368–385.
-
Calcium-dependent flagellar motility activation in Chlamydomonas reinhardtii in response to mechanical agitationCell Motility and the Cytoskeleton 66:736–742.https://doi.org/10.1002/cm.20402
-
Rhythmicity, recurrence, and recovery of flagellar beatingPhysical Review Letters 113:238103.https://doi.org/10.1103/PhysRevLett.113.238103
-
Lag, lock, sync, slip: the many “phases” of coupled flagellaJournal of the Royal Society, Interface 11:20131160.https://doi.org/10.1098/rsif.2013.1160
-
Coordination of eukaryotic cilia and flagellaEssays in Biochemistry 62:829–838.https://doi.org/10.1042/EBC20180029
-
Is the zero reynolds number approximation valid for ciliary flows?Physical Review Letters 122:124502.https://doi.org/10.1103/PhysRevLett.122.124502
-
Measurements of the unsteady flow field around beating ciliaJournal of Fluid Mechanics 915:A70.https://doi.org/10.1017/jfm.2021.149
-
BookStimulus perception and membrane Excitation in Unicellular Alga ChlamydomonasIn: Luan S, editors. Coding and Decoding of Calcium Signals in Plants. Springer. pp. 79–91.https://doi.org/10.1007/978-3-642-20829-4
Article and author information
Author details
Marie-Eve Aubin-Tam

Funding
European Research Council (101042612)
- Marie-Eve Aubin-Tam
European Research Council (716712)
- Daniel SW Tam
European Research Council (101045302)
- Daniel SW Tam
The funders had no role in study design, data collection and interpretation, or the decision to submit the work for publication.
Acknowledgements
The authors thank Roland Kieffer for technical support. DW thanks Ritsu Kamiya for helpful discussions. The authors acknowledge support by the European Research Council (ERC starting grants no. 716712 and no. 101042612, and ERC consolidator grant no. 101045302).
Copyright
© 2024, Wei et al.
This article is distributed under the terms of the Creative Commons Attribution License, which permits unrestricted use and redistribution provided that the original author and source are credited.
Metrics
-
- 1,787
- views
-
- 186
- downloads
-
- 8
- citations
Views, downloads and citations are aggregated across all versions of this paper published by eLife.
Citations by DOI
-
- 8
- citations for umbrella DOI https://doi.org/10.7554/eLife.86102
Download links
A two-part list of links to download the article, or parts of the article, in various formats.
Downloads (link to download the article as PDF)
Open citations (links to open the citations from this article in various online reference manager services)
Cite this article (links to download the citations from this article in formats compatible with various reference manager tools)
The younger flagellum sets the beat for Chlamydomonas reinhardtii
eLife 13:e86102.
https://doi.org/10.7554/eLife.86102


