Conditional blastocyst complementation of a defective Foxa2 lineage efficiently promotes the generation of the whole lung
- Columbia Center for Human Development and Division of Pulmonary, Allergy, Critical Care, Department of Medicine, Columbia University Medical Center, United States
- Department of Thoracic, Breast and Endocrinological Surgery, Okayama University Graduate School of Medicine, Dentistry and Pharmaceutical Sciences, Japan
- The Pulmonary Center and Department of Medicine, Boston University School of Medicine, United States
- Center for Regenerative Medicine, Boston University and Boston Medical Center, United States
- Department of Cell, Developmental and Regenerative Biology, Icahn School of Medicine at Mount Sinai, United States
- Department of Pathology, University of Washington, United States
- Department of Molecular Biology, University of Texas Southwestern Medical Center, United States
- Bernard and Shirlee Brown Glaucoma Laboratory, Department of Pathology and Cell Biology, College of Physicians and Surgeons, Columbia University Irving Medical Center, United States
Figures
Figure 1
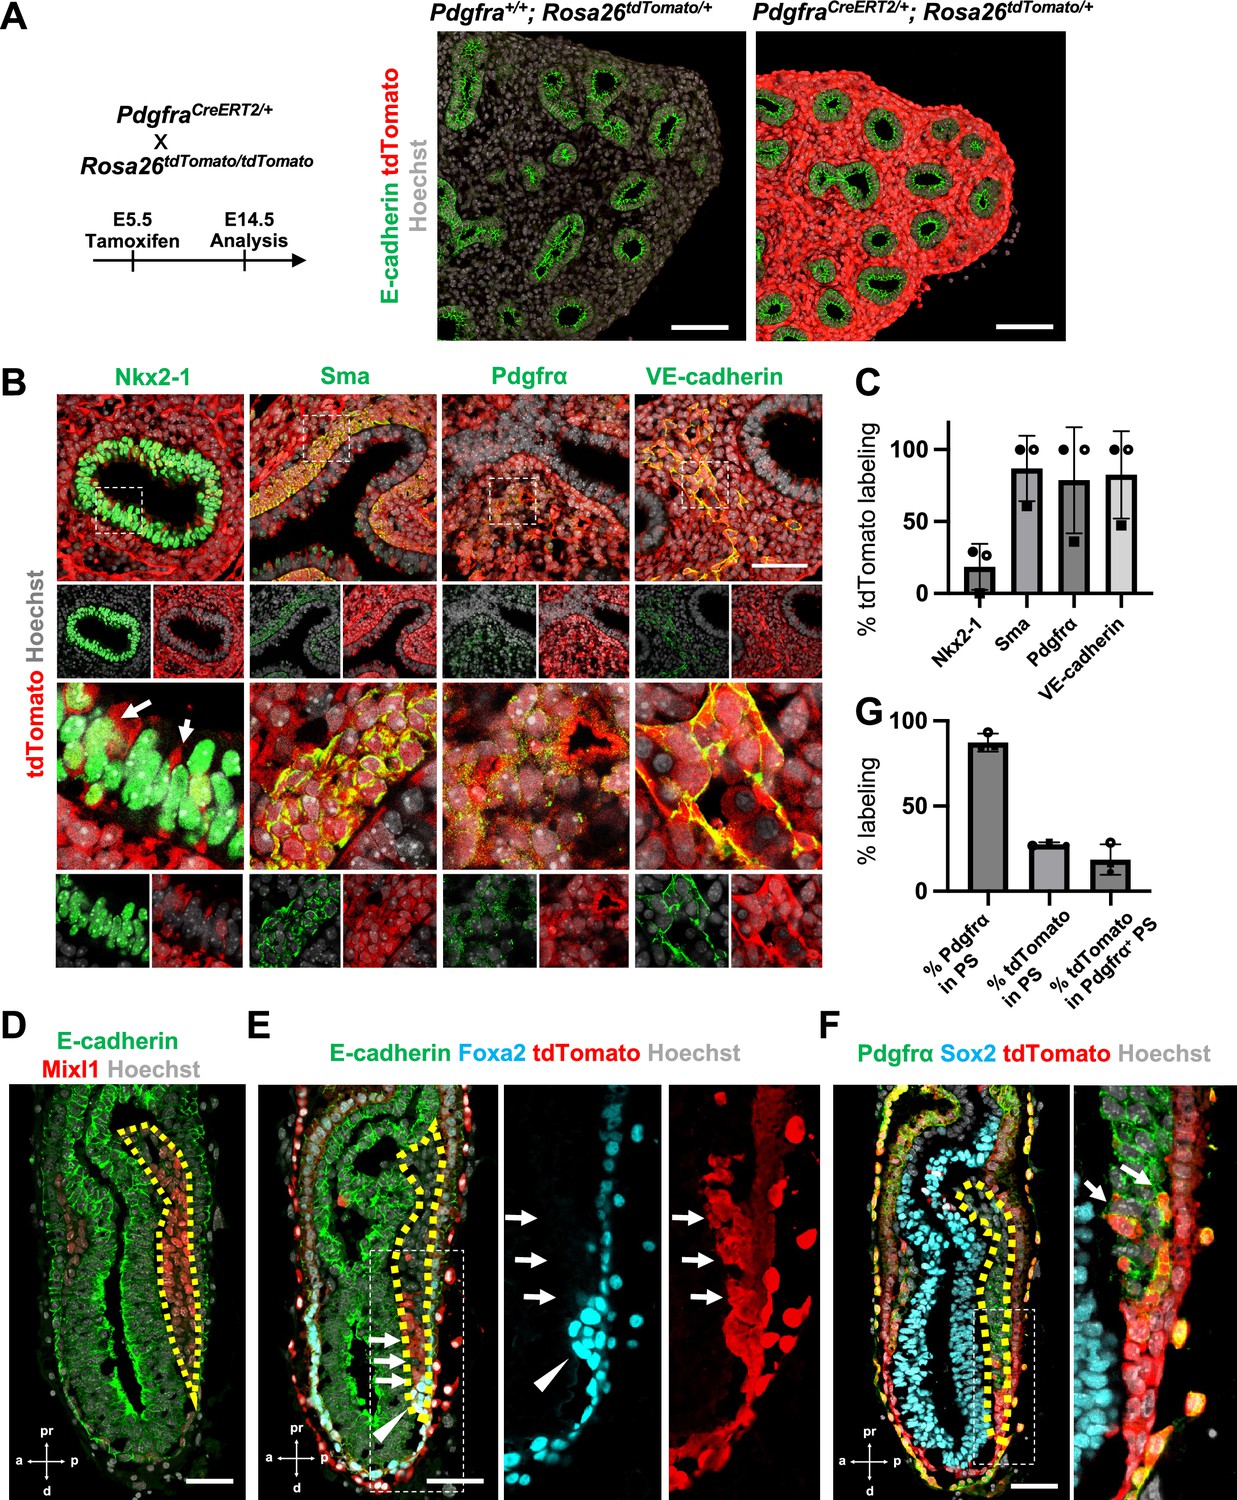
Pdgfrα lineage during gastrulation is the origin of the entire pulmonary mesenchyme.
(A) Left: Schematic of tamoxifen administration. Right: Representative immunofluorescence (IF)-confocal imaging of E14.5 PdgfraCreERT2/+; Rosa26tdTomato/+ lineage tracing mouse lungs. Scale bars = 100 μm. (B) Tamoxifen administration at E5.5 and analyzed at E12.5. Pdgfrα-lineage-driven tdTomato (red) labeled the part of lung epithelium (arrows) and entire lung mesenchyme, including Sma+ airway smooth muscle cells, Pdgfrα+ mesenchyme, and VE-cadherin+ capillaries. Enlarged box: dotted box. Scale bar = 50 μm. (C) Quantification of PdgfraCreERT2/+; Rosa26tdTomato/+ lineage labeling (n = 3 per group, each plot showed different embryos). Error bars represent mean ± standard deviation (SD). (D–F) Representative IF-confocal imaging of E6.5 Foxa2Cre/+; Rosa26tdTomato/+ embryo. E-cadherin or Sox2 indicates epiblast. (D) Mixl1 (red) expression represents primitive streak (PS) (yellow dotted area). (E) Foxa2-lineage (red) marked a broader region of the distal component of the anteriolarizing PS (arrows), expressing Foxa2 protein (arrowhead). (F) Foxa2-lineage (red)-labeled Pdgfrα (green) expressing mesendoderm (arrows). Scale bars = 50 μm. (G) Quantification of Foxa2-lineage labeling in PS (n = 3 per group, each plot showed different embryos). Error bars represent mean ± SD.
-
Figure 1—source data 1
Quantification of PdgfraCreERT2/+; Rosa26tdTomato/+ lineage labeling by immunofluorescence (IF) morphometric analysis.
- https://cdn.elifesciences.org/articles/86105/elife-86105-fig1-data1-v2.xlsx
-
Figure 1—source data 2
Quantification of Foxa2-lineage labeling in PS by immunofluorescence (IF) morphometric analysis.
- https://cdn.elifesciences.org/articles/86105/elife-86105-fig1-data2-v2.xlsx
Figure 2 with 1 supplement
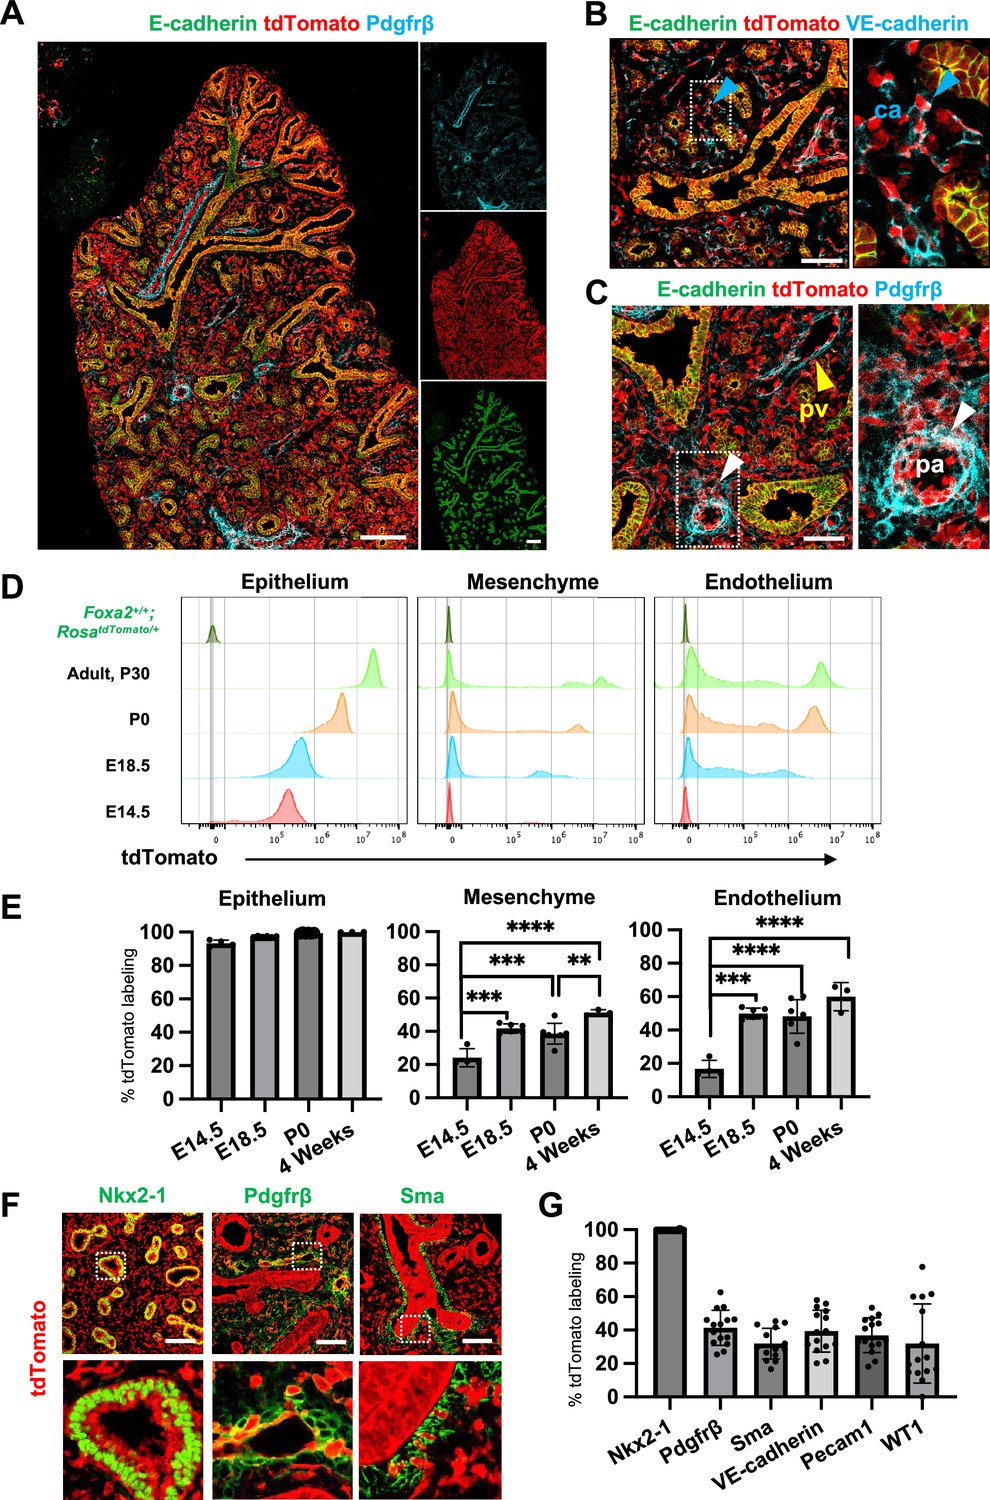
Foxa2-lineage gradually increased during lung development and labeled the entire lung epithelium and half of the mesenchyme.
(A–C) Immunofluorescence (IF)-confocal imaging of E16.5 Foxa2Cre/+; RosatdTomato/+ embryonic lung: (A) Foxa2-lineage (red)-labeled E-cadherin+ lung epithelium (green) entirely and Pfgfrβ+ mesenchyme (cyan) partially. (B) Foxa2-lineage partially labeled VE-cadherin+ capillary (ca) (enlarged box, blue arrowhead). (C) Foxa2-lineage-labeled Pdgfrβ+ smooth muscle cells of the pulmonary artery (pa) (enlarged box, white arrowhead) and pulmonary vein (pv, yellow arrowhead). Scale bars (A), (B), and (C) = 200, 100, and 100 μm, respectively. (D, E) Representative histograms and the graphs of flow cytometry (FCM) quantitative analyses for CD31−Epcam+ lung epithelium, CD31−Epcam− mesenchyme, and CD31+Epcam− endothelium at E14.5, E18.5, P0, and 4 weeks adult (n = 4, 6, 7, and 3, independent biological replicates, respectively) of Foxa2Cre/+; RosatdTomato/+ mouse lungs. The gradual increase of % tdTomato+ lineage labeling in both lung mesenchyme and endothelium. Statistical analysis: one-way analysis of variance (ANOVA) with the Tukey post hoc test; statistically significant if **p < 0.01, ***p < 0.001, ****p < 0.0001. Error bars represent mean ± standard deviation (SD). (F) Representative IF-confocal imaging of E14.5 Foxa2Cre/+; RosatdTomato/+ embryonic lungs. tdTomato labeled entirely with lung epithelial markers Nkx2-1 (left) but a relatively low proportion of mesenchyme (Pdgfrβ: middle and Sma: right). Scale bar = 50 µm. (G) Graphs: The morphometric analysis: % of E14.5 Foxa2-lineage labeling in Nkx2-1+ epithelium, Pdgfrβ+ mesenchyme, Sma+ airway smooth muscle, VE-Cadherin+ capillaries, Pecam1+ arteries, or WT1+ mesothelium (n = 3 per biological replicates, 5 fields per group). Error bars represent mean ± SD.
-
Figure 2—source data 1
Flow cytometry (FCM) quantitative analyses for CD31-Epcam+ lung epithelium, CD31−Epcam− mesenchyme, and CD31+Epcam− endothelium at E14.5, E18.5, P0, and 4 weeks adult.
- https://cdn.elifesciences.org/articles/86105/elife-86105-fig2-data1-v2.xlsx
-
Figure 2—source data 2
The morphometric analysis: % of E14.5 Foxa2-lineage labeling with each lung marker.
- https://cdn.elifesciences.org/articles/86105/elife-86105-fig2-data2-v2.xlsx
Figure 2—figure supplement 1
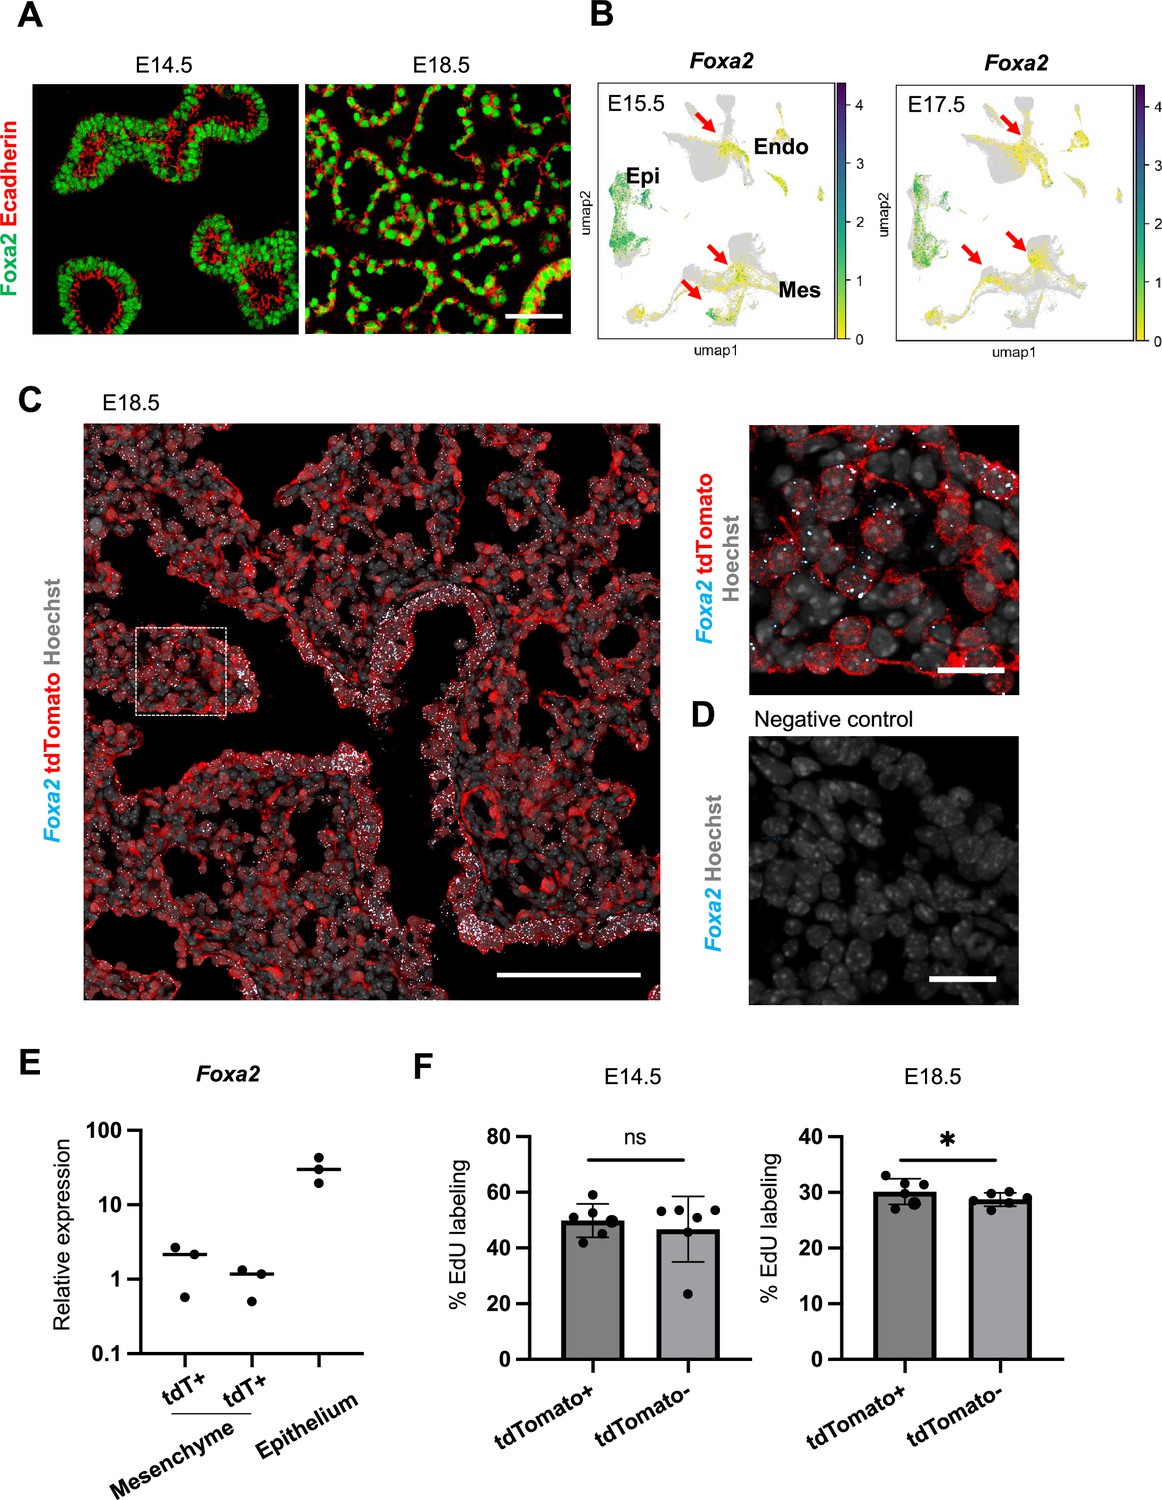
Foxa2-lineage gradually increased in the mesenchyme and endothelial cells during mouse lung development.
(A) Representative immunofluorescence (IF)-confocal imaging of E14.5 and E18.5 mouse embryonic lungs. Foxa2 (green) was expressed in lung epithelial cells labeled by E-cadherin (red) but not in E-cadherin negative lung mesenchymal area. Scale bar = 50 µm (B) Single-cell analysis of mouse LungMAP. Foxa2 expression was observed in lung mesenchyme and endothelium in E15.5 and E17.5 (arrows). (C, D) Representative IF and in situ hybridization-confocal imaging of E18.5 mouse embryonic lungs. Dotted lines: enlarged image. Foxa2 mRNA was expressed in lung epithelial cells and lung mesenchyme. Most of the Foxa2 mRNA expression was colocalized with tdTomato. Scale bars (left, right) = 50 µm, 20 µm. (E) Graphs: Foxa2 qPCR for tdTomato+ (tdT+) or tdTomato− (tdT−) CD45−CD31−EPCAM− mesenchymal cells and CD45−CD31−EpCAM+ epithelial cells sorted by Fluorescence-activated cell sorting (FACS) from E18.5 Foxa2-lineage-tracing mice (n = 3, each biological replicate). (F) Flow cytometry quantitative analyses: 5-ethynyl-2-deoxyuridine (EdU) labeling cells in CD31+Epcam− endothelium at E14.5 and E18.5 (n = 6, each independent biological replicate, respectively) of Foxa2Cre/+; RosatdTomato/+ lungs. Statistical analysis: paired Student’s t-test, significance at *p < 0.05, ns: non-significant. Error bars represent mean ± standard deviation (SD).
-
Figure 2—figure supplement 1—source data 1
Foxa2 qPCR for tdTomato+ (tdT+) or tdTomato− (tdT−) CD45−CD31−EPCAM− mesenchymal cells and CD45−CD31−EpCAM+ epithelial cells.
- https://cdn.elifesciences.org/articles/86105/elife-86105-fig2-figsupp1-data1-v2.xlsx
-
Figure 2—figure supplement 1—source data 2
Flow cytometry quantitative analyses: EdU labeling cells in CD31+Epcam− endothelium at E14.5 and E18.5 of Foxa2Cre/+; RosatdTomato/+ lungs.
- https://cdn.elifesciences.org/articles/86105/elife-86105-fig2-figsupp1-data2-v2.xlsx
Figure 3 with 1 supplement
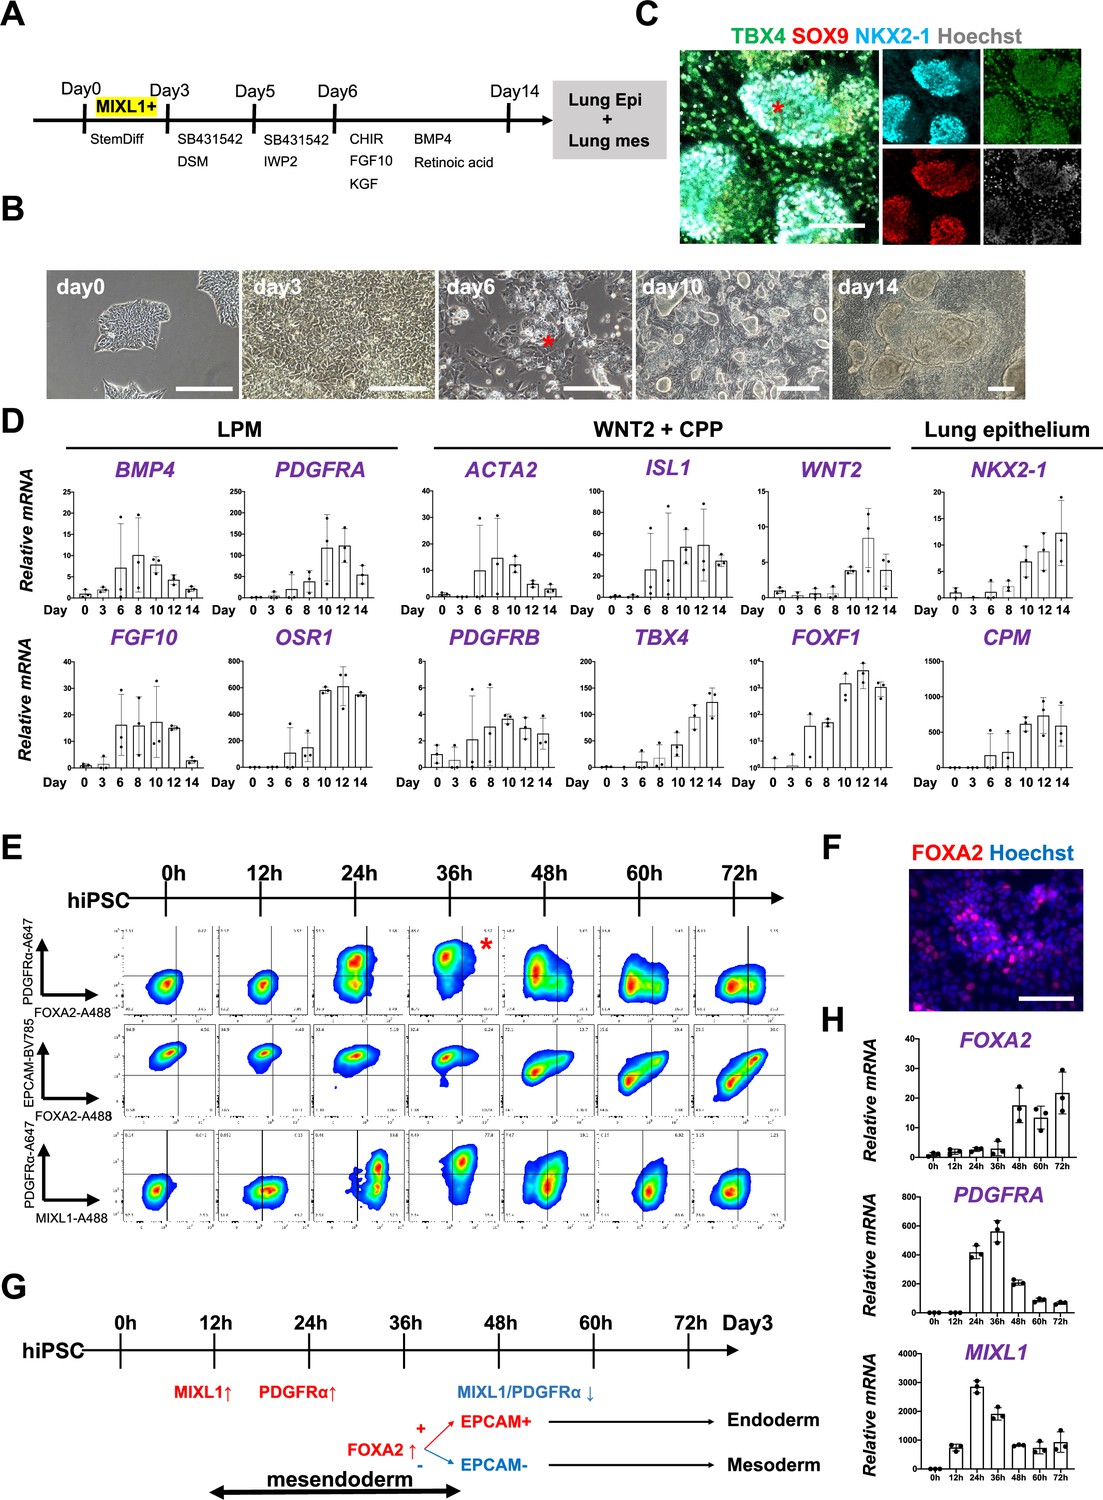
Co-development of endodermal and mesodermal lung progenitors derived from MXIL1+ PDGFRα+ FOXA2+ mesendoderm in the directed differentiation protocol using hiPSC.
(A) Schematic culture protocol of hiPSC-derived endodermal and mesodermal lung progenitor cell co-differentiation. (B) Representative phase-contrast images of the directed differentiation time course. Bud structure appeared on day 6 (asterisk). Scale bars = 100 μm. (C) Representative immunofluorescence (IF)-confocal imaging of differentiating hiPSCs at day 14 culture. Lung epithelium (NKX2-1), distal lung bud epithelium (SOX9), mesenchyme (TBX4), and nucleus (Hoechst) markers. The budding structures expressed SOX9 and NKX2-1 (asterisk), and monolayer cells expressed TBX4. Scale bar = 100 μm. (D) RT-PCR analyses of lung mesenchyme and epithelium markers in time course according to the protocol shown in (A). Each plot showed a different biological experiment (n = 3 independent experiments). Error bars represent mean ± standard deviation (SD). (E) Flow cytometry (FCM)-based protein kinetic analyses during definitive endoderm (DE) and lateral plate mesoderm (LPM) induction; MIXL1 expression preceded compared to PDGFRα or FOXA2. FOXA2 appearance in the subset of the PDGFRα+ population (red asterisk) (n = 3 independent experiments). (F) Representative IF imaging of 36-hr-cultured hiPSCs. Scale bar = 100 μm. (G) Schematic summary of FCM analysis. (H) Quantitative Reverse Transcription Polymerase Chain Reaction (qRT-PCR) analyses further confirmed the preceded MIXL1 induction and subsequent expression of PDGFRα and FOXA2. All graphs: Data normalized by undifferentiated induced pluripotent stem cells (iPSCs). Each plot showed a different biological experiment (n = 3 independent experiments). Error bars represent mean ± SD.
-
Figure 3—source data 1
qRT-PCR analyses of lung mesenchyme and epithelium markers in time course of directed differentiation.
- https://cdn.elifesciences.org/articles/86105/elife-86105-fig3-data1-v2.xlsx
-
Figure 3—source data 2
qRT-PCR analyses of mesendoderm markers in time course of directed differentiation.
- https://cdn.elifesciences.org/articles/86105/elife-86105-fig3-data2-v2.xlsx
Figure 3—figure supplement 1
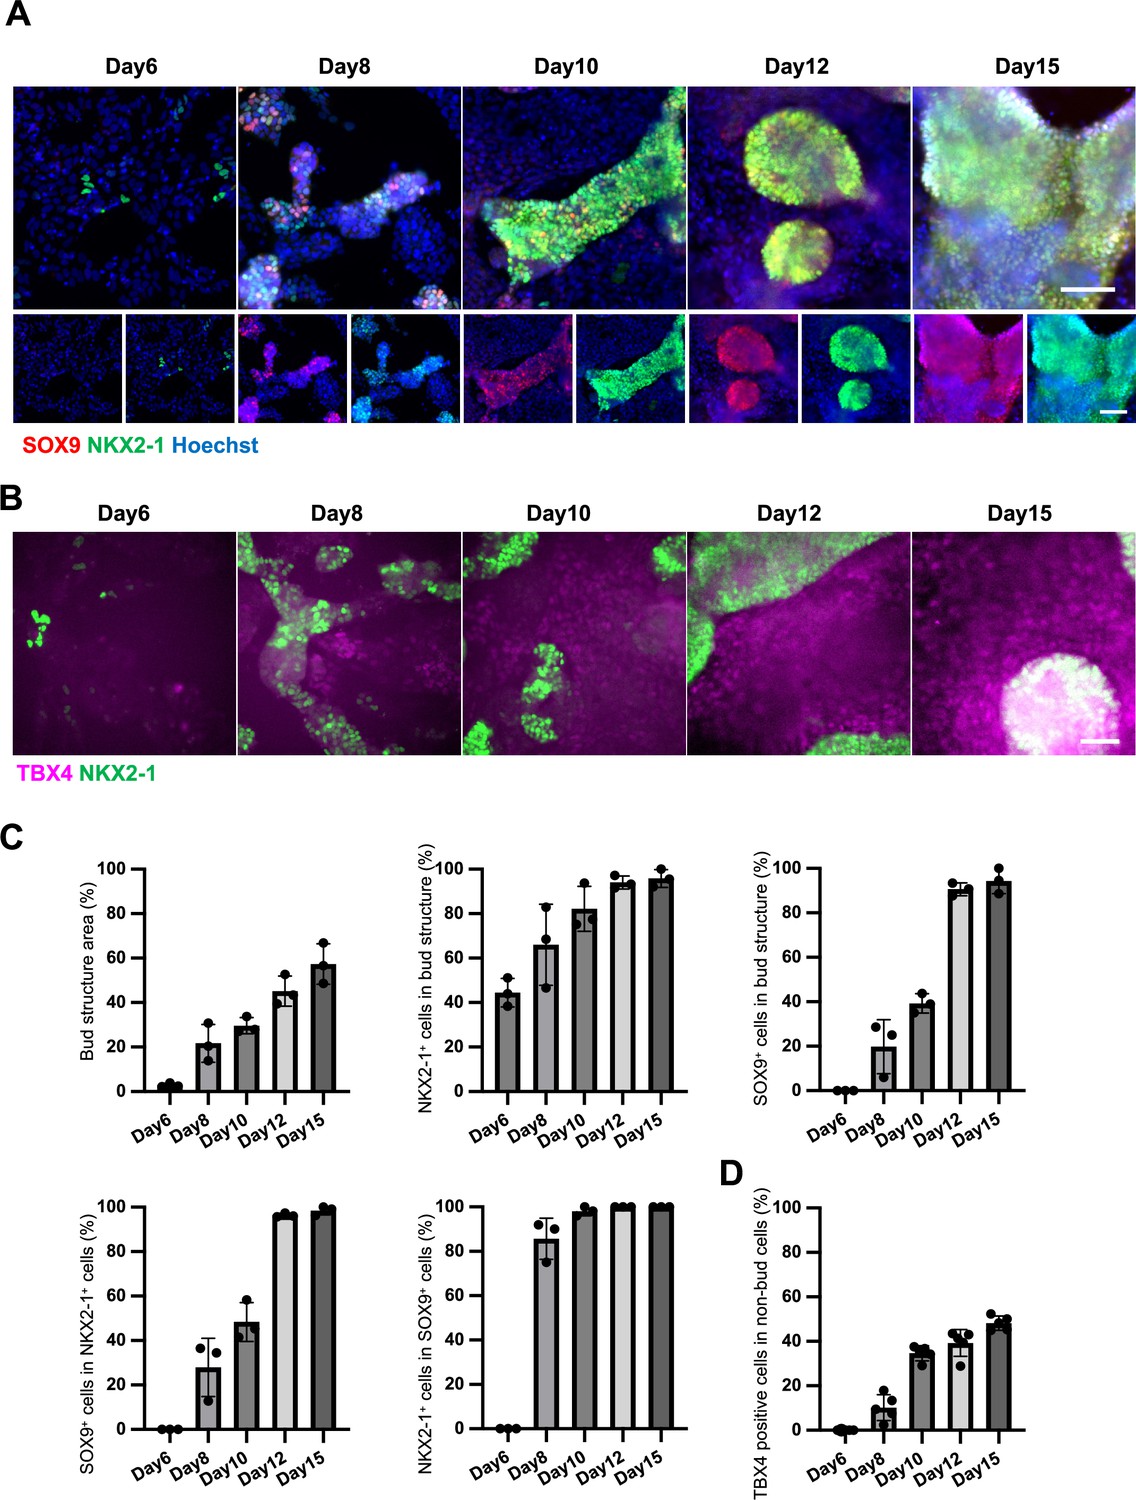
Endodermal and mesodermal lung progenitors develop together in the directed differentiation using hiPSC.
(A, B) Representative immunofluorescence (IF) imaging of days 6, 8, 10, 12, and 15 directed differentiations. Bud structure gradually formed larger colonies with NKX2-1 (green) and SOX9 (red) expression over time. In contrast, nuclear TBX4+ cells (magenta) emerged in the area of non-bud structures over time. Scale bar = 100 µm. (C, D) Graphs: Quantification of morphometric analyses (A), % bud structure area, % NKX2-1+ or SOX9+ cells in bud structure, and % SOX9+ cells in NKX2-1+ cells or NKX2-1+ cells in SOX9+ cells, % TBX4+ cells in non-bud structure. Each plot showed different experimental replicates (5 fields per each group). Error bars represent mean ± standard deviation (SD).
-
Figure 3—figure supplement 1—source data 1
% GFP in CD31+Epcam− lung endothelium analyzed by flow cytometry.
- https://cdn.elifesciences.org/articles/86105/elife-86105-fig3-figsupp1-data1-v2.xlsx
-
Figure 3—figure supplement 1—source data 2
% GFP in CD45+ hematopoietic cells analyzed by flow cytometry.
- https://cdn.elifesciences.org/articles/86105/elife-86105-fig3-figsupp1-data2-v2.xlsx
Figure 4 with 5 supplements
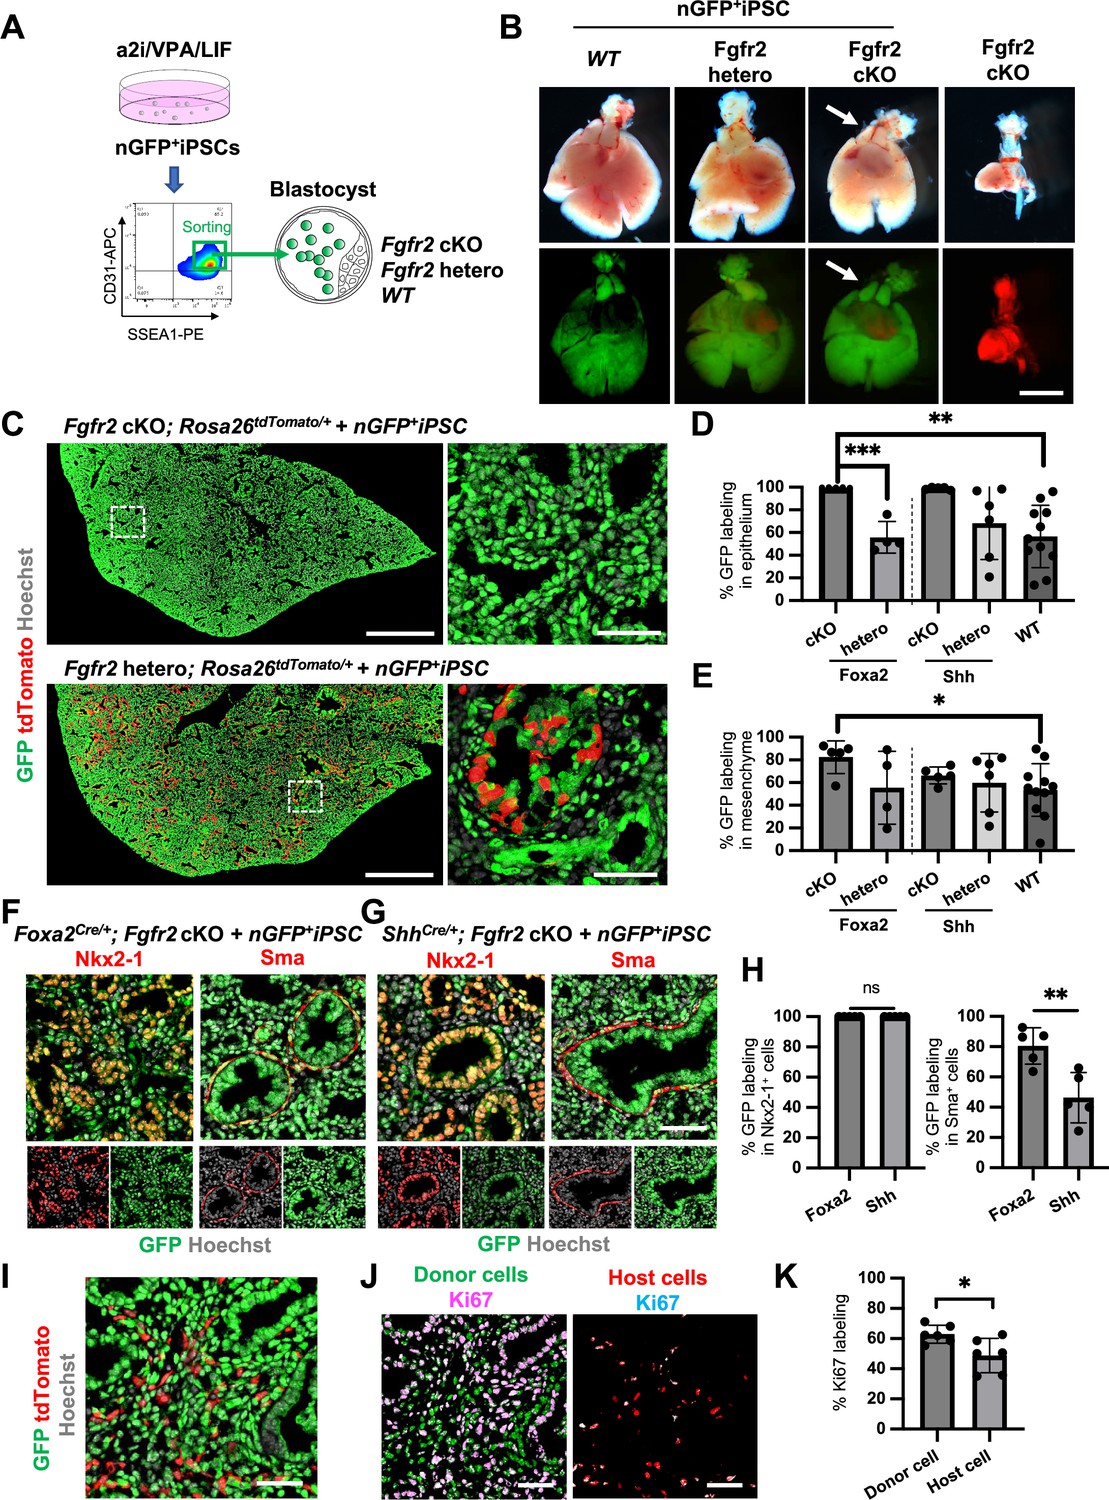
Generation of the entire lungs in Foxa2-driven Fgfr2-deficient mice via conditional blastocyst complementation (CBC) at E17.5.
(A) Schema of CBC experiment: a2i/VPA/LIF-treated SSEA1high CD31high nGFP+iPSCs were sorted and injected into WT, Fgfr2 hetero (heterozygous: Foxa2cre/+; Fgfr2flox/+; Rosa26tdTomato/+), and Fgfr2 cKO (homozygous: Foxa2cre/+; Fgfr2flox/flox; Rosa26tdTomato/+) blastocysts. (B) Gross morphology, GFP (green: donor nGFP+iPSCs-derived signals) and tdTomato (host Foxa2-lineage-derived signals) fluorescence of freshly isolated lungs from E17.5 chimeric WT (left), Fgfr2 hetero (left middle) and Fgfr2 cKO (right middle) that were injected with nGFP+iPSCs. Control: littermate Fgfr2 cKO mouse without nGFP+iPSCs injection (right). Arrows: rescued thymus formation. (C) Representative immunofluorescence (IF)-confocal imaging of E17.5 Fgfr2 cKO or Fgfr2 hetero lungs injected with nGFP+iPSCs. Dotted lines: enlarged images: Fgfr2 hetero lungs holding host-derived cells. On the other hand, Fgfr2 cKO lungs were entirely composed of donor-derived nGFP+ cells. Scale bars left and right = 0.5 mm and 50 μm. Graphs: % GFP in (D) CD31−Epcam+ lung epithelium and (E) CD31−Epcam− mesenchyme analyzed by flow cytometry. Each plot showed different biological animals. Foxa2Cre; Fgfr2 cKO; RosatdTomato (n = 5, independent biological replicates), Foxa2Cre; Fgfr2 hetero; RosatdTomato (n = 4), ShhCre; Fgfr2 cKO; RosatdTomato (n = 5), ShhCre/+; Fgfr2 hetero; RosatdTomato (n = 6), and WT (n = 11). Statistical analyses: unpaired Student’s t-test, significance at *p < 0.05, **p < 0.01, ***p < 0.001. Error bars represent mean ± standard deviation (SD). Representative IF-confocal imaging of (F) Foxa2Cre; Fgfr2 cKO; RosatdTomato and (G) ShhCre; Fgfr2 cKO; RosatdTomato injected with nGFP+iPSCs. (H) Morphometric analysis: % GFP in Nkx2-1+ epithelial cells (left) and Sma+ airway smooth muscle cells (right) in Foxa2Cre; Fgfr2 cKO; RosatdTomato and ShhCre; Fgfr2 cKO; RosatdTomato. Statistical analyses: unpaired Student’s t-test, significance if *p < 0.05, **p < 0.01, ns: non-significant. Error bars represent mean ± SD. Scale bars = 50 μm. (I) Representative IF-confocal imaging of E14.5 lung of Fgfr2 cKO injected with nGFP+iPSCs. GFP and tdTomato indicate donor and host-derived cells, respectively. Scale bar = 20 μm. (J) Split images of (I) visualizing GFP+ donor cells and tdTomato+ host cells, co-stained with Ki67. Scale bar = 20 μm. (K) Graphs: % Ki67 labeling in mesenchymal cells of E14.5 Foxa2Cre/+; Fgfr2 cKO chimeric lungs. Statistical analyses: paired Student’s t-test, significance if *p < 0.05, ns: non-significant. Error bars represent mean ± SD.
-
Figure 4—source data 1
Morphometric analysis: % GFP in Nkx2-1+ epithelial cells and Sma+ airway smooth muscle cells in Foxa2Cre; Fgfr2 cKO; RosatdTomato and ShhCre; Fgfr2 cKO; RosatdTomato.
- https://cdn.elifesciences.org/articles/86105/elife-86105-fig4-data1-v2.xlsx
-
Figure 4—source data 2
Morphometric analysis: % Ki67 labeling in mesenchymal cells of E14.5 Foxa2Cre/+; Fgfr2 cKO chimeric lungs.
- https://cdn.elifesciences.org/articles/86105/elife-86105-fig4-data2-v2.xlsx
Figure 4—figure supplement 1
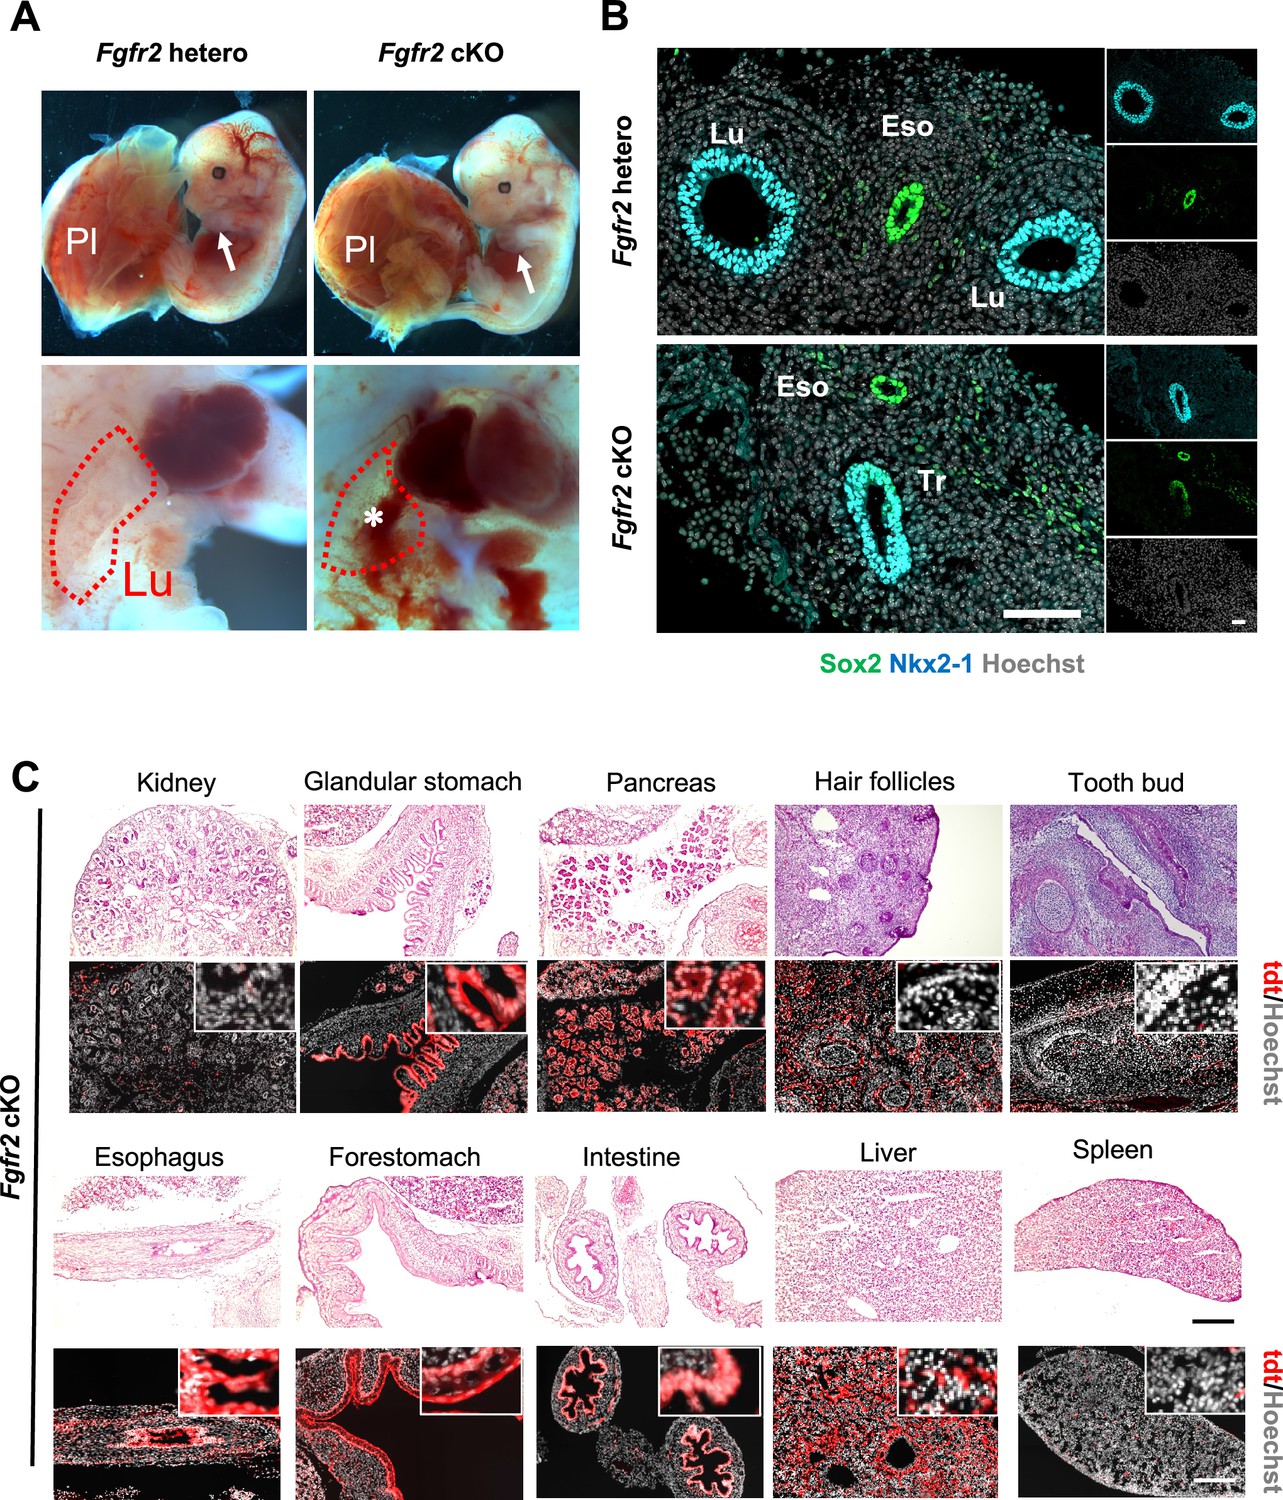
Lung agenesis phenotype in the Foxa2Cre/+Fgfr2 cKO mice.
(A) Representative gross morphology of E14.5 Foxa2Cre/+; Fgfr2 hetero and Foxa2Cre/+; Fgfr2 cKO. There were no differences in the appearance of the embryos between Fgfr2 hetero and Fgfr2 cKO. Limb (arrows) and placenta (pl) are present in all genotypes. Conversely, the Fgfr2 cKO embryo showed lung agenesis phenotype (bottom, asterisk) (n = 6 per each group). (B) Representative immunofluorescence (IF)-confocal imaging of E10.5 Foxa2Cre/+; Fgfr2 hetero and Foxa2Cre/+; Fgfr2 cKO: Fgfr2 cKO did not form Sox2+NKX2-1+ proximal airway bifurcation. Scale bar = 20 μm. Lu: lung, Eso: esophagus, Tr: trachea. (C) HE stains and IF imaging of Foxa2Cre/+; Fgfr2 cKO; Rosa26tdTomato/+ at E16.5. tdTomato (red) signal indicate Foxa2 lineage. The internal organs such as the intestine, pancreas, kidney, tooth buds, and hair follicles were normally formed in Fgfr2 cKO. Scale bar = 200 µm.
Figure 4—figure supplement 2
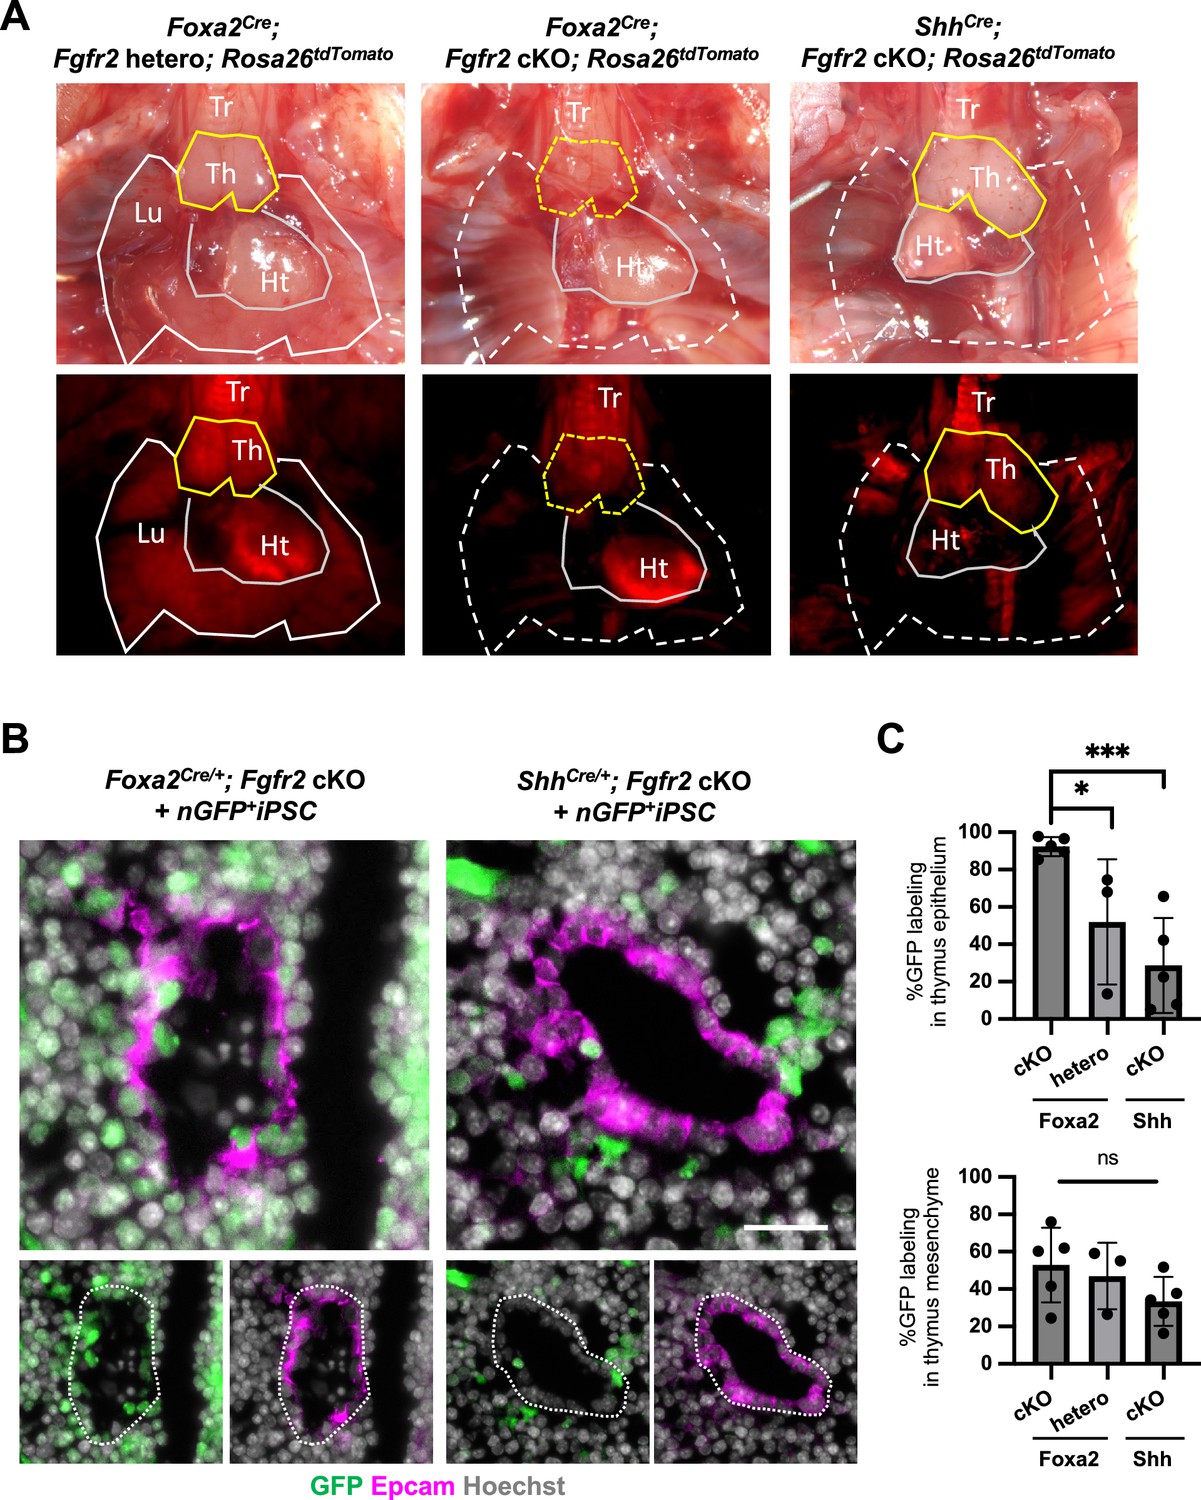
The complemented embryos of Foxa2Cre/+; Fgfr2 cKO and ShhCre/+; Fgfr2 cKO + nGFP+iPSCs showed different chimerism in thymus epithelial cells.
(A) Representative image of Foxa2Cre/+; Fgfr2 cKO; Rosa26tdTomato/+, Foxa2Cre/+; Fgfr2 hetero; Rosa26tdTomato/+, and ShhCre/+; Fgfr2 cKO; Rosa26tdTomato/+. Foxa2Cre/+; Fgfr2 cKO; Rosa26tdTomato/+ showed thymus and lung agenesis, while ShhCre/+; Fgfr2 cKO; Rosa26tdTomato/+ showed only lung agenesis. Lu: lung, Ht: heart, Tr: trachea, Th: thymus. (B) Representative immunofluorescence (IF) imaging of E17.5 thymus of Foxa2Cre/+; Fgfr2 cKO; Rosa26tdTomato/+ and ShhCre/+; Fgfr2 cKO; Rosa26tdTomato/+ injected with nGFP+iPSCs. GFP indicates donor cells. Dotted line: Epcam+ thymic epithelial cells. Scale bar = 20 μm. (C) Graphs: % chimerism of thymus epithelium and mesenchyme. Each plot showed different embryos. Foxa2Cre; Fgfr2 cKO; RosatdTomato (n = 5, independent biological replicates), Foxa2Cre; Fgfr2 hetero; RosatdTomato (n = 3), ShhCre; Fgfr2 cKO; RosatdTomato (n = 5). Statistical analysis: one-way analysis of variance (ANOVA) with the Tukey post hoc test; statistically significant at *p < 0.05, ***p < 0.001, ns: non-significant. Each plot showed different embryos. Error bars represent mean ± standard deviation (SD).
-
Figure 4—figure supplement 2—source data 1
Morphometric immunofluorescence (IF) analysis of chimeric thymus: % chimerism of thymus epithelium and mesenchyme.
- https://cdn.elifesciences.org/articles/86105/elife-86105-fig4-figsupp2-data1-v2.xlsx
Figure 4—figure supplement 3
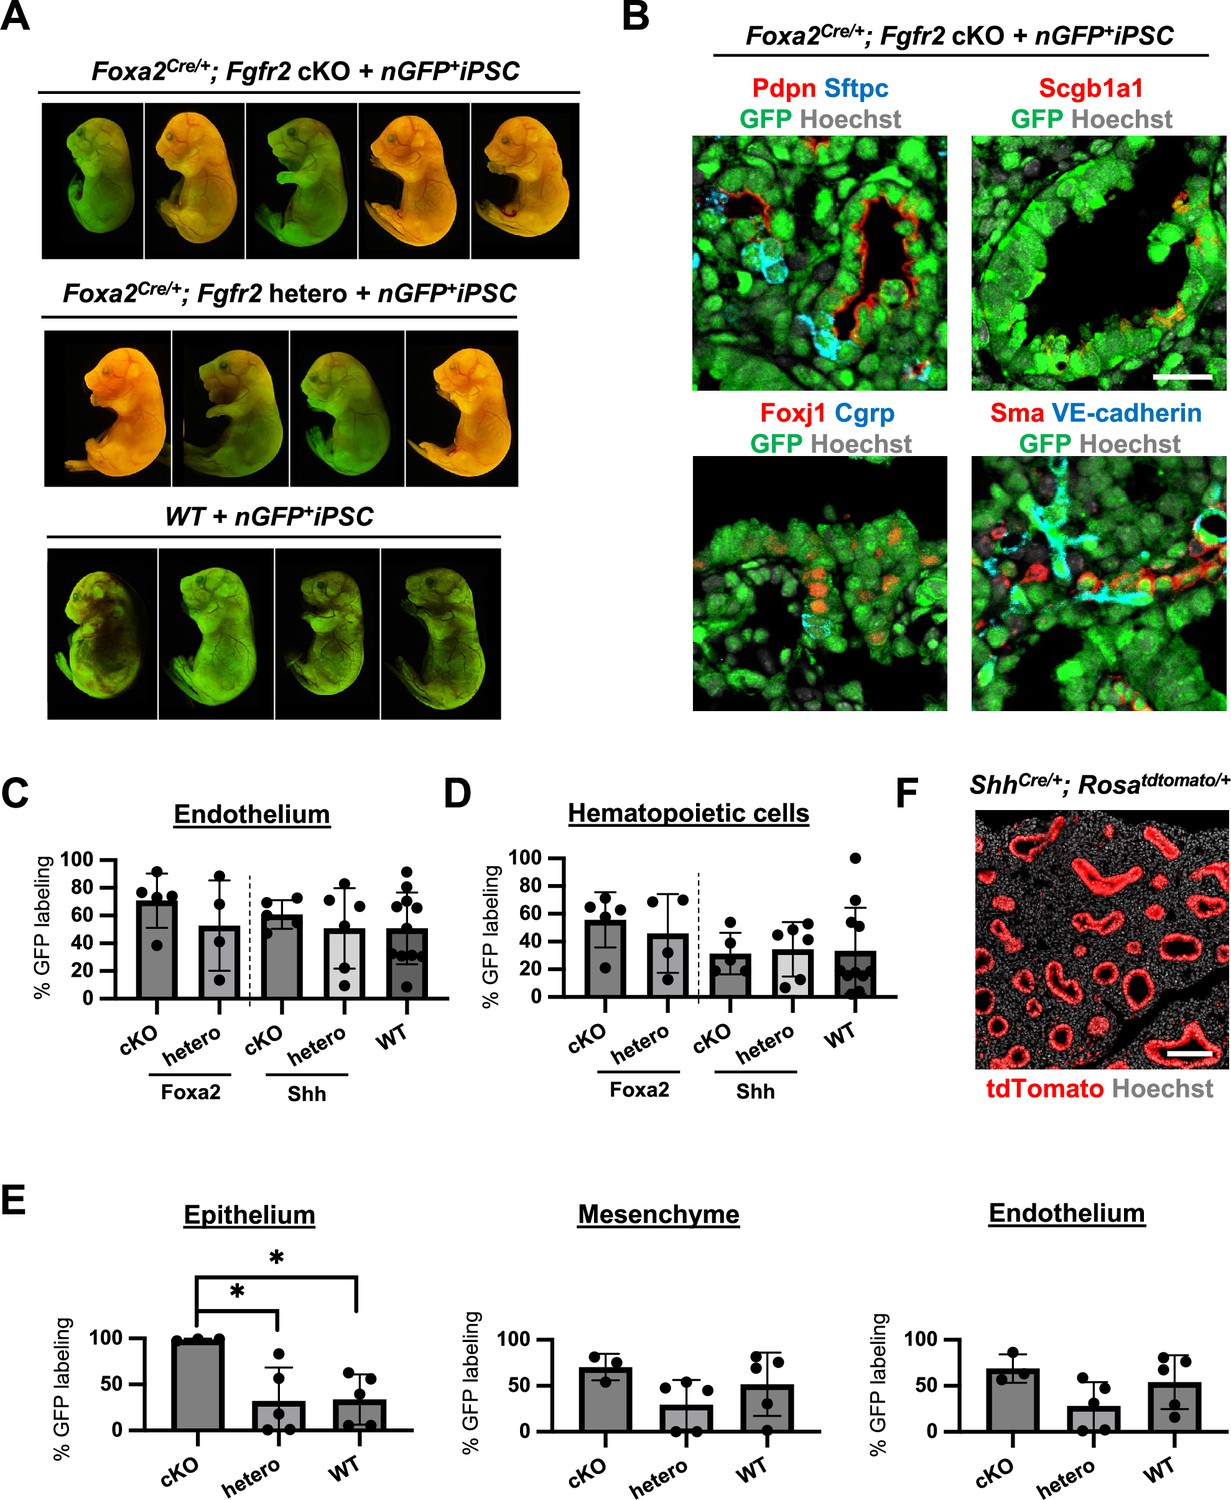
The complemented embryos of Foxa2Cre/+; Fgfr2 cKO + nGFP+iPSCs showed normal gross morphology and various chimerism.
(A) Representative gross morphology of chimeric embryos of WT + nGFP+iPSCs, Foxa2Cre/+; Fgfr2 hetero; Rosa26tdTomato/+ + nGFP+iPSCs, Foxa2Cre/+; Fgfr2 cKO; Rosa26tdTomato/+ + nGFP+iPSCs. The color indicated various GFP+ chimerism on the skin of those embryos and the residual host Foxa2-lineage tdTomato signals. (B) Representative immunofluorescence (IF)-confocal imaging of E17.5 lungs of chimeric Foxa2Cre/+; Fgfr2 cKO; Rosa26tdTomato/+ + nGFP+iPSCs. The E17.5 rescued lungs expressed differentiated cell markers such as Pdpn (alveolar type1 cells), Sftpc (type 2 cells), Scgb1a1 (club cells), Foxj1 (multiciliated cells), Cgrp (neuroendocrine cells), Sma (smooth muscle cells), and VE-cadherin (endothelial cells). Scale bar = 20 μm. Graphs: % GFP in (C) CD31+Epcam− lung endothelium and (D) CD45+ hematopoietic cells analyzed by flow cytometry. Each plot showed different biological animals. Foxa2Cre; Fgfr2 cKO; RosatdTomato (n = 5, independent biological replicates), Foxa2Cre; Fgfr2 hetero; RosatdTomato (n = 4), ShhCre; Fgfr2 cKO; RosatdTomato (n = 5), ShhCre/+; Fgfr2 hetero; RosatdTomato (n = 6), and WT (n = 11). Error bars represent mean ± standard deviation (SD). Statistical analyses: unpaired Student’s t-test, significance at *p < 0.05, ns: non-significant. (E) Graphs: % of donor cell chimerism at E14.5: % of GFP in CD31−Epcam+ lung epithelium fraction, CD31−Epcam− mesenchyme, and CD31+Epcam− endothelium analyzed by flow cytometry. Each plot: a different biological animal (see Table 2). Foxa2Cre; Fgfr2 cKO; RosatdTomato (n = 3, independent biological replicates), Foxa2Cre; Fgfr2 hetero; RosatdTomato (n = 5), and WT (n = 5) at E14.5. Error bars represent mean ± SD. Statistical analyses: unpaired Student’s t-test, significance at *p < 0.05, ns: non-significant. (F) Representative IF-confocal imaging of E14.5 Shh-lineage-tracing mouse lungs (ShhCre/+; RosatdTomato/+). Shh-lineage labeled the entire lung epithelium but rarely mesenchyme, distinct from Foxa2 lineage mice (see Figure 2F). Scale bar = 100 μm.
Figure 4—figure supplement 4
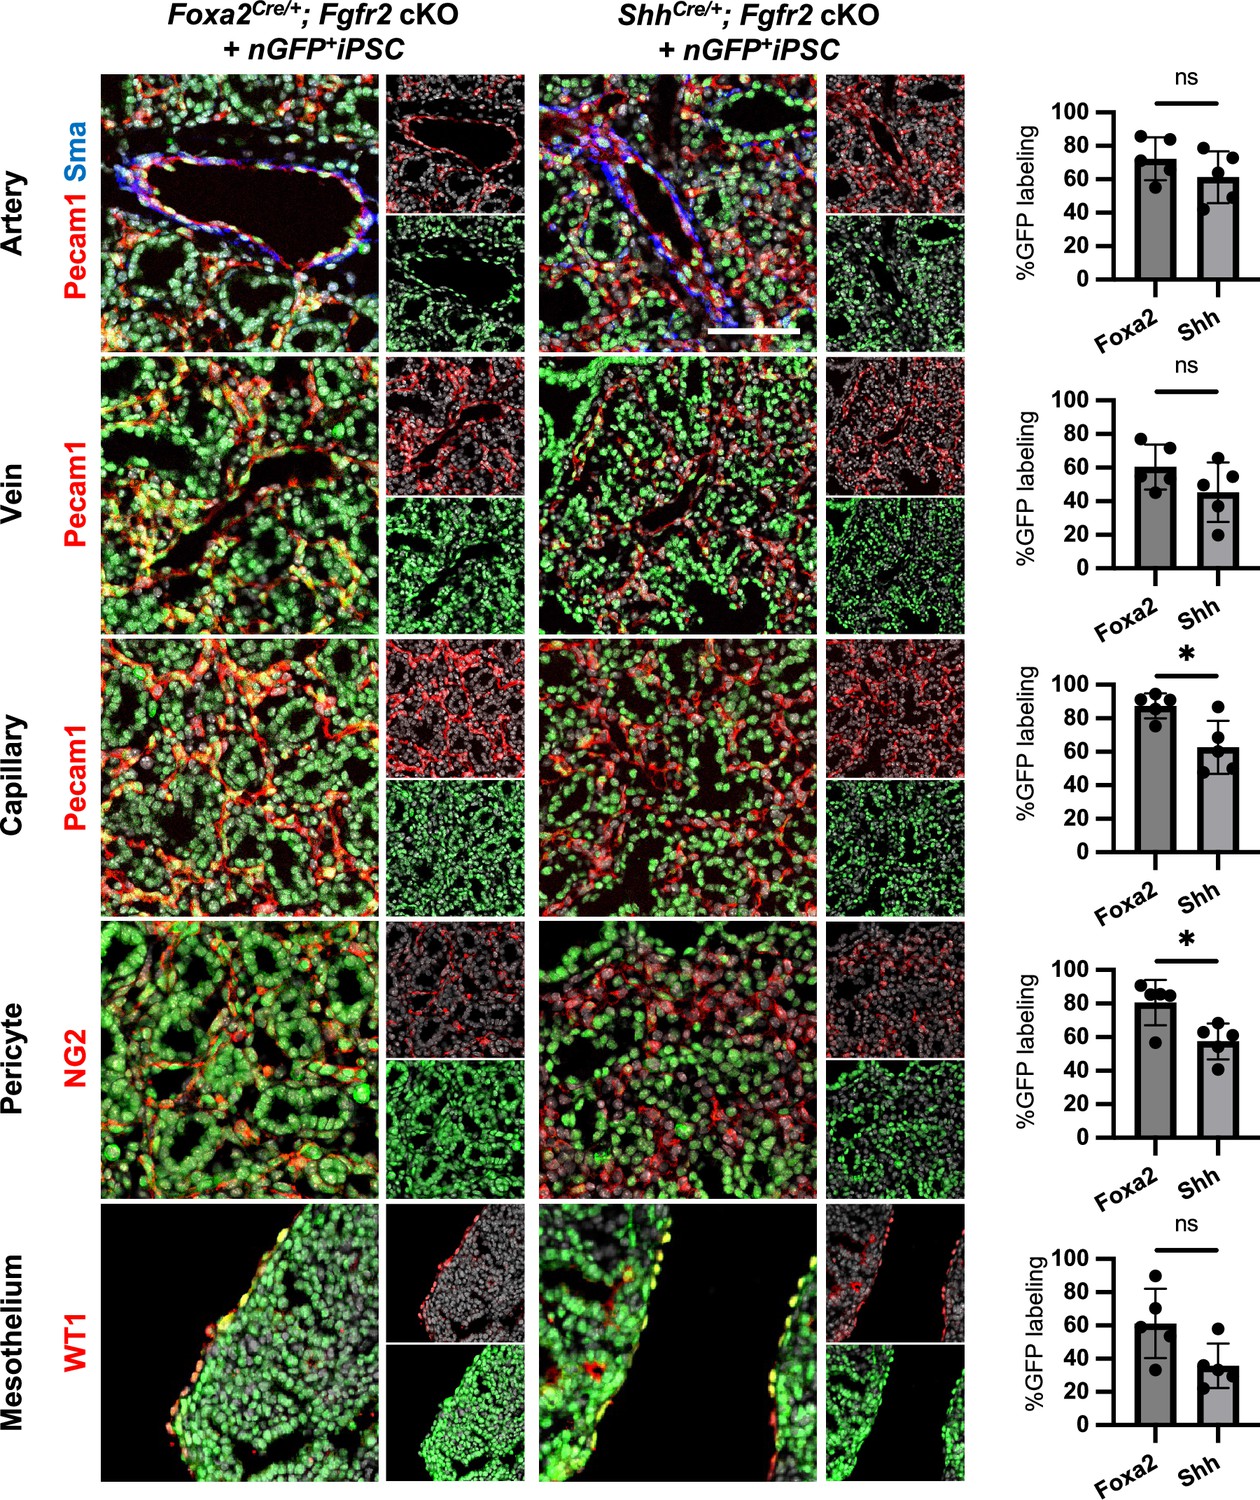
The complemented embryos of Foxa2Cre/+; Fgfr2 cKO and ShhCre/+; Fgfr2 cKO + nGFP+iPSCs showed different chimerism in each lung cell type.
Representative immunofluorescence (IF)-confocal imaging of E17.5 lung of Foxa2Cre/+; Fgfr2 cKO and ShhCre/+; Fgfr2 cKO injected with nGFP+iPSCs. GFP indicates donor cells. Graphs: % chimerism of GFP+ donor cells with E17.5 lung mesenchyme markers such as SMA+ PECAM+ artery, SMA- PECAM+ veins, PECAM+ capillaries, NG2+ pericytes, and WT1+ mesothelium. Each plot showed different embryos. Foxa2Cre; Fgfr2 cKO; RosatdTomato (n = 5, independent biological replicates) and ShhCre; Fgfr2 cKO; RosatdTomato (n = 5). N = 5 biological replicates. Error bars represent mean ± standard deviation (SD). Statistical analyses: unpaired Student’s t-test, significance at *p < 0.05, ns: non-significant. Scale bar = 20 μm.
-
Figure 4—figure supplement 4—source data 1
Morphometric analysis of E17.5 chimeric lungs in each lung mesenchyme marker.
- https://cdn.elifesciences.org/articles/86105/elife-86105-fig4-figsupp4-data1-v2.xlsx
Figure 4—figure supplement 5
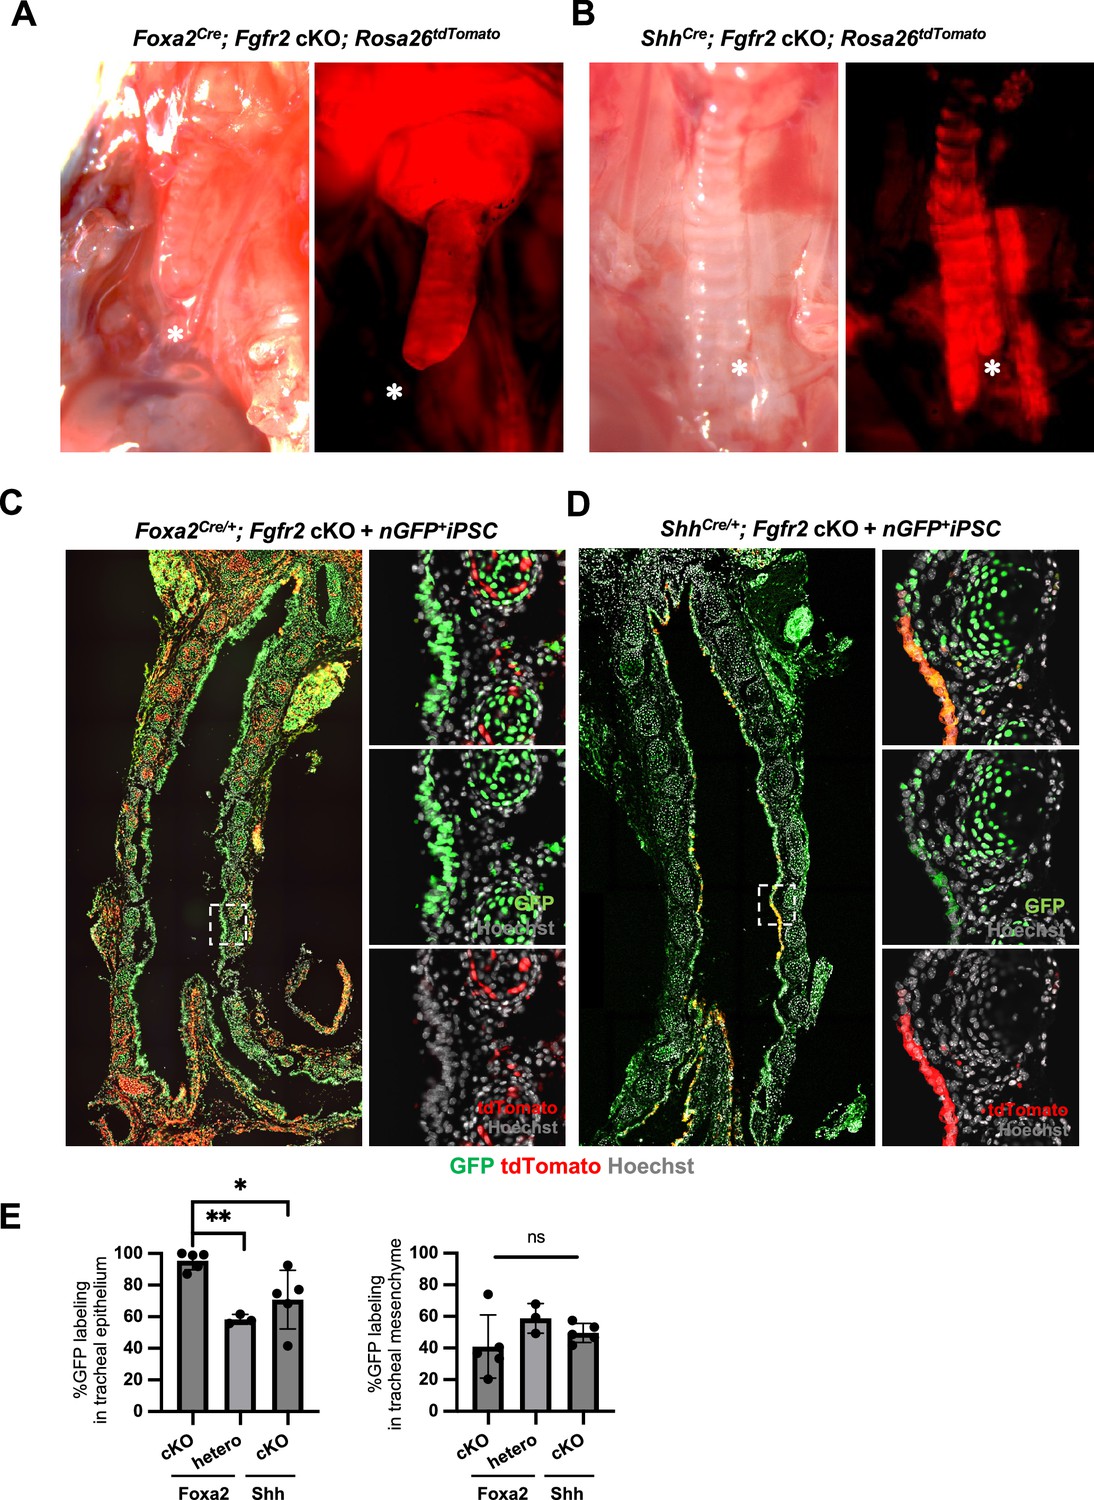
The complemented embryos of Foxa2Cre/+; Fgfr2 cKO and ShhCre/+; Fgfr2 cKO + nGFP+iPSCs showed different chimerism in tracheal epithelial cells.
(A, B) Representative image of Foxa2Cre/+; Fgfr2 cKO; Rosa26tdTomato/+ and ShhCre/+; Fgfr2 cKO; Rosa26tdTomato/+trachea. Asterisks indicate the trachea end. Foxa2 trachea ends in the middle of the thoracic cavity, while Shh ends after bifurcation. (C, D) Representative immunofluorescence (IF)-confocal imaging of E17.5 trachea of (C) Foxa2Cre/+; Fgfr2 cKO; RosatdTomato and (D) ShhCre/+; Fgfr2 cKO; RosatdTomato injected with nGFP+iPSCs. GFP and tdTomato indicate donor cells and host lineage cells, respectively. Dotted lines: enlarged images. (E) Graphs: % chimerism of tracheal epithelium and mesenchyme. each plot showed different embryos. Foxa2Cre; Fgfr2 cKO; RosatdTomato (n = 5, independent biological replicates), Foxa2Cre; Fgfr2 hetero; RosatdTomato (n = 3), ShhCre; Fgfr2 cKO; RosatdTomato (n = 5). Statistical analysis: one-way analysis of variance (ANOVA) with the Tukey post hoc test; statistically significant at *p < 0.05, **p < 0.01, ns: non-significant. Error bars represent mean ± standard deviation (SD).
-
Figure 4—figure supplement 5—source data 1
Morphometric immunofluorescence (IF) analysis of the chimeric trachea: % chimerism of tracheal epithelium and mesenchyme.
- https://cdn.elifesciences.org/articles/86105/elife-86105-fig4-figsupp5-data1-v2.xlsx
Figure 5 with 1 supplement
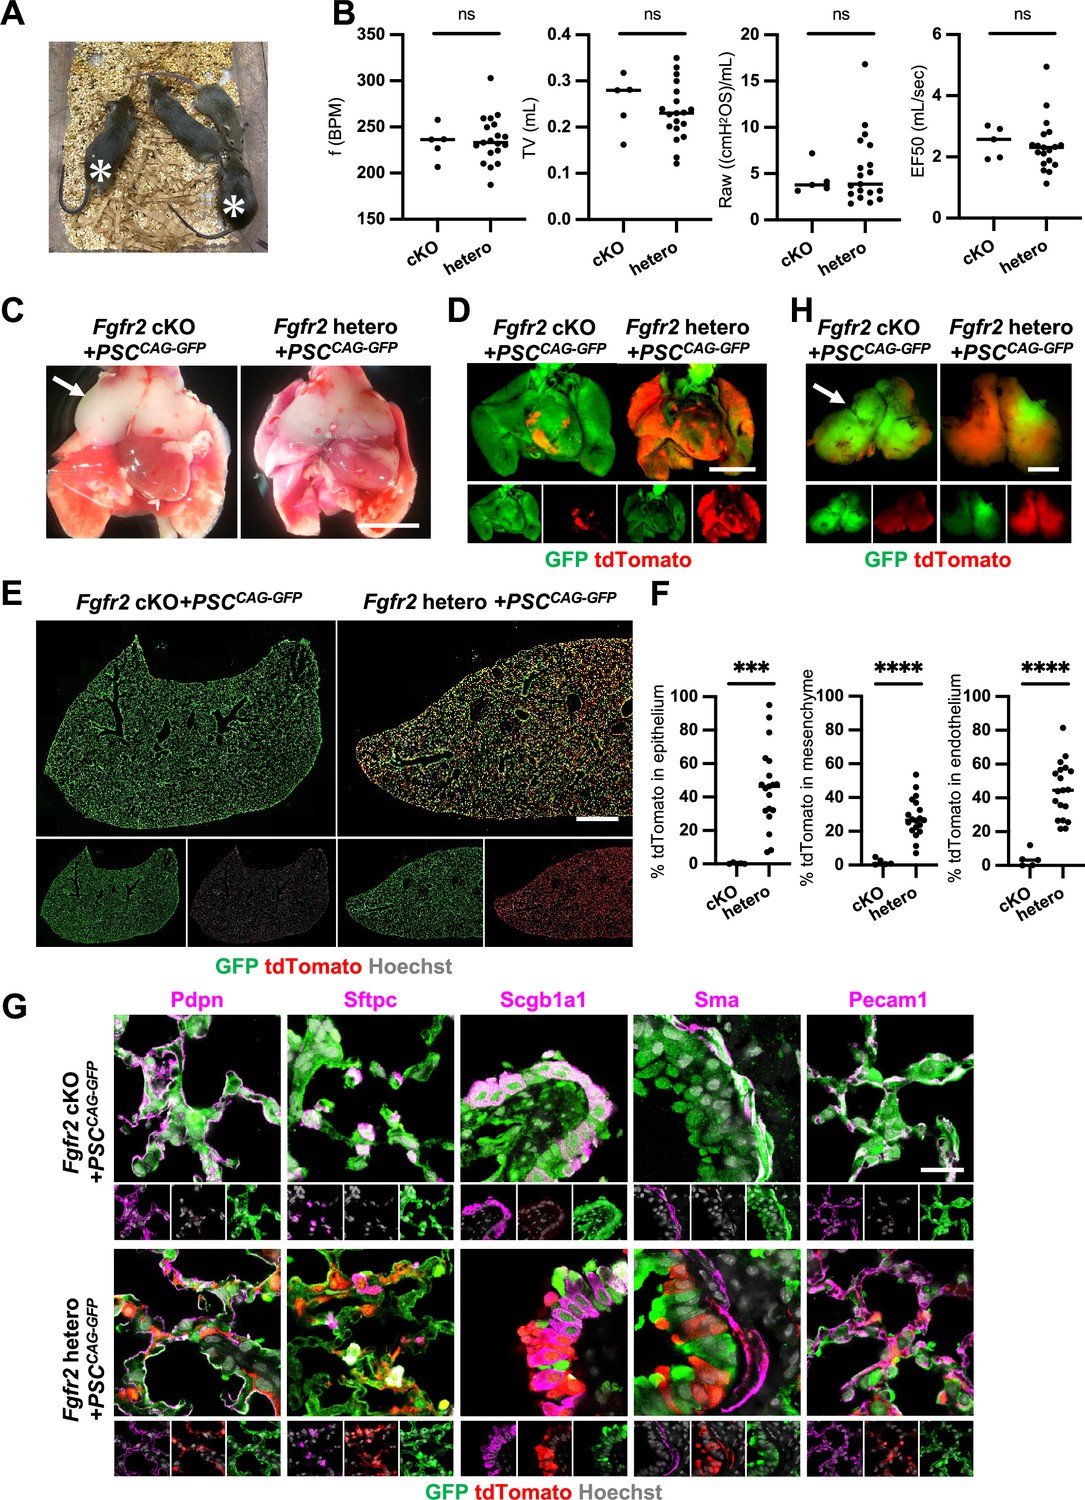
Generation of fully functional adult lungs in Foxa2-driven Fgfr2-deficient mice via conditional blastocyst complementation (CBC).
(A) Adult mice of Foxa2Cre/+; Fgfr2 cKO; RosatdTomato (asterisks) or Foxa2Cre/+; Fgfr2 hetero; RosatdTomato injected with PSCCAG-GFP. (B) Graphs: Respiratory function analysis of f (frequency), TV (tidal volume), Raw (airway resistance), and EF50 (expiratory flow at the point 50% of TV is expired) of Foxa2Cre/+; Fgfr2 cKO; RosatdTomato (n = 5, independent biological replicates), Foxa2Cre/+; Fgfr2 hetero; RosatdTomato (n = 19). Statistical analyses: unpaired Student’s t-test, significance at ns: non-significant. (C) Gross morphology of 4 weeks rescued lung and thymus from Foxa2Cre/+; Fgfr2 cKO; RosatdTomato (Fgfr2 cKO) or Foxa2Cre/+; Fgfr2 hetero; RosatdTomato (Fgfr2 hetero) injected with PSCCAG-GFP. Scale bar = 5 mm. (D) Fluorescent signals of 4 weeks chimeric lungs. GFP (green: donor PSCCAG-GFP-derived signals) and tdTomato (red: host Foxa2-lineage-derived signals) fluorescence of freshly isolated lungs after removing thymus. Scale bar = 5 mm. (E) Representative immunofluorescence (IF) tiled-scan confocal-IF imaging of 4 weeks Fgfr2 cKO or Fgfr2 hetero lungs injected with PSCCAG-GFP. Fgfr2 cKO lungs showed less host origin tdTomato+ cells compared to Fgfr2 hetero. Scale bar = 3 mm. (F) Flow cytometry (FCM) analysis: Graphs: Remaining tdTomato+ cell population of each cell type in 4 weeks Fgfr2 cKO or Fgfr2 hetero lungs injected with PSCCAG-GFP. Statistical analyses: unpaired Student’s t-test, significance if ***p < 0.001 and ****p < 0.0001. (G) Representative IF-confocal imaging of 4 weeks chimeric lungs from Fgfr2 cKO or Fgfr2 hetero injected with PSCCAG-GFP expressed differentiated cell markers such as Pdpn (alveolar type1 cells), Sftpc (type 2 cells), Scgb1a1 (club cells), Sma (smooth muscle cells), and VE-cadherin (endothelial cells). Scale bar = 20 μm. (H) Fluorescent signals of 4 weeks chimeric thymus. Arrows in C and H: rescued thymus formation, Scale bar = 1 mm.
-
Figure 5—source data 1
Respiratory function analysis of f (frequency), TV (tidal volume), Raw (airway resistance), and EF50 (expiratory flow at the point 50% of TV is expired) of Foxa2Cre/+; Fgfr2 cKO; RosatdTomato.
- https://cdn.elifesciences.org/articles/86105/elife-86105-fig5-data1-v2.xlsx
-
Figure 5—source data 2
Flow cytometry (FCM) analysis: remaining tdTomato+ cell population of each cell type in 4 weeks Fgfr2 cKO or Fgfr2 hetero lungs injected with PSCCAG-GFP.
- https://cdn.elifesciences.org/articles/86105/elife-86105-fig5-data2-v2.xlsx
Figure 5—figure supplement 1
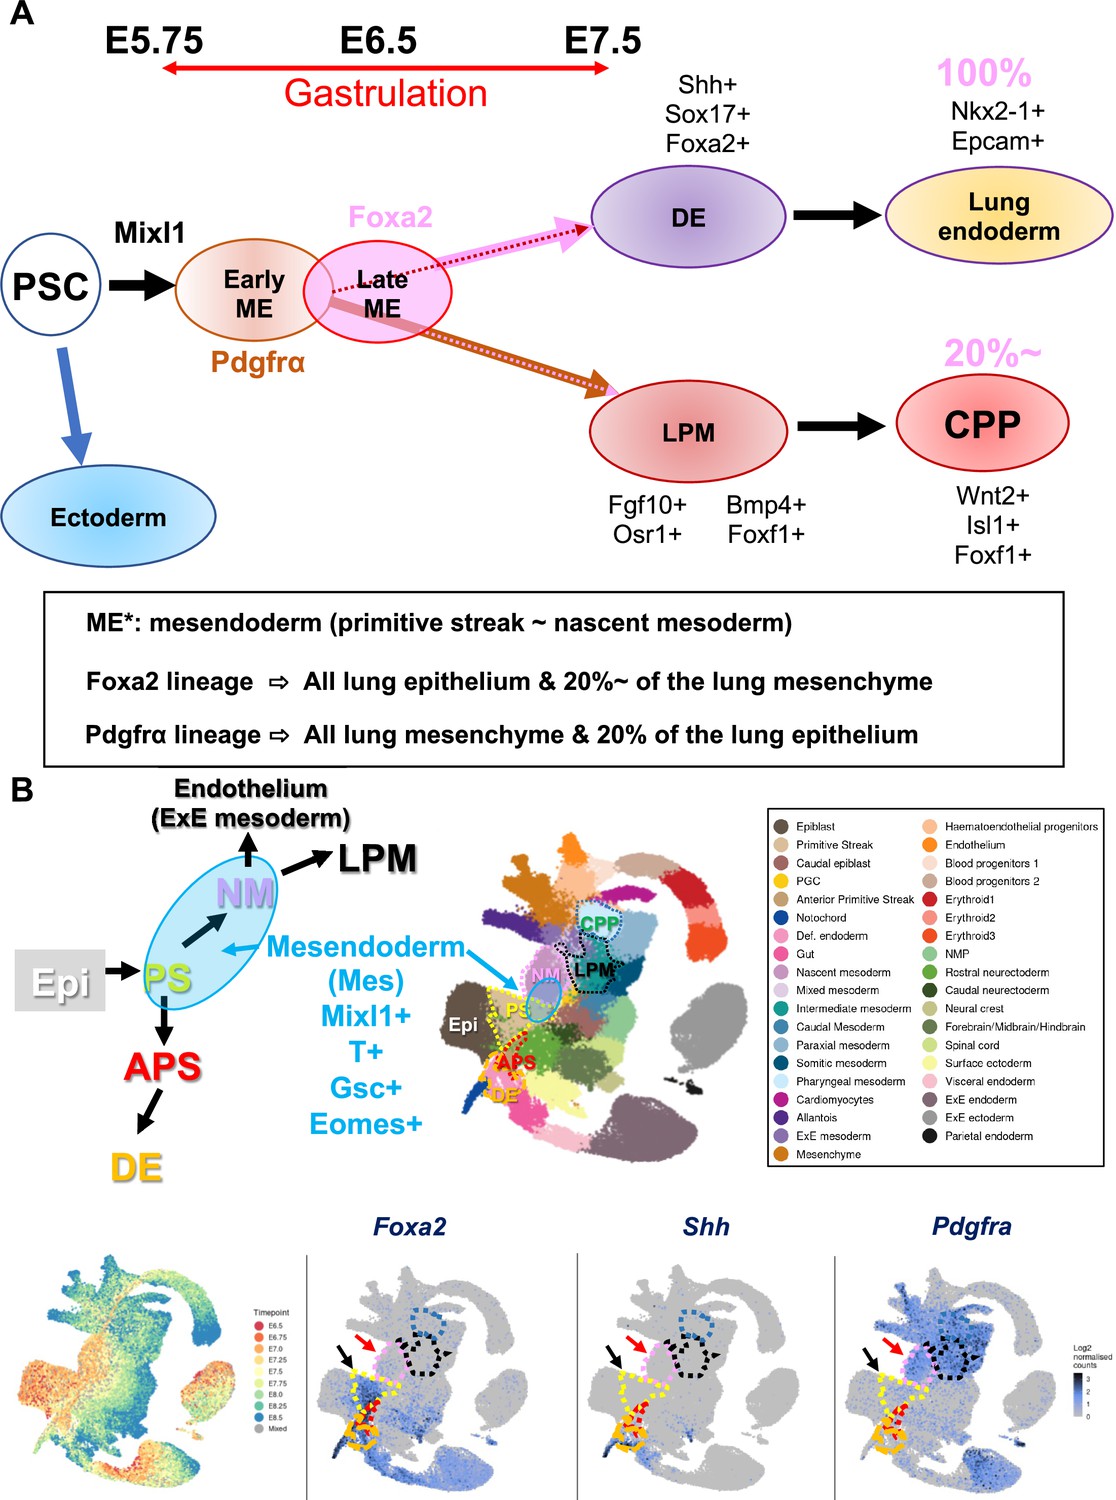
Summary of the results and proposed models.
(A) Pluripotent stem cell (PSC) differentiation will be initiated by the Mixl1+ induction and the subsequent temporal expression of an early mesendoderm (ME) marker, Pdgfrα. After that, the late mesendoderm marker marked by Foxa2 will turn on. Pdgfrα and Foxa2 lineage partially overlap at the distal component of primitive streak stage during gastrulation. Pdgfrα+ early ME lineage gives rise to the partial lung epithelial cells, most likely by the overlapping Foxa2+ lineage and entire lung mesenchyme through lateral plate mesoderm (LPM) induction and cardiopulmonary lineage (CPP). On the other hand, the Foxa2 lineage gives rise to the whole lung epithelium and about 20% of CPP in early lung development at E12.5–E14.5. Strikingly, the whole lungs, including lung epithelium, mesenchyme, and endothelial cells, were produced solely by donor induced pluripotent stem cells (iPSCs) via complementing the Foxa2-lineage’s mitotic defective lung niches. (B) Top left panel: Schematic diagram of mesendoderm lineage trajectory for lung formation based on the single-cell RNA-seq (scRNA-seq) deposited database (Pijuan-Sala et al., 2019). During gastrulation, a bipotent mesendoderm (Mes: rounded blue area) appears in the transition from primitive streak (PS) and NM, labeled by Mixl1, T, Gsc, and Eomes. NM forms LPM. Mesendoderm also gives rise to anteriolar PS (APS) and, subsequently, definitive endoderm (DE). Top right panel: Clustering of scRNA-seq provided in the deposited database (Pijuan-Sala et al., 2019). Bottom left panel: Time point of scRNA-seq provided in the deposited database (Pijuan-Sala et al., 2019). Bottom: Foxa2 is expressed in the PS (black arrow) and the part of NM (red arrow). In contrast, Shh appeared in DE but not in PS, NM, or APS. A few cells showed Pdgfrα in PS (black arrow) but most expressed Pdgfra in NM (red arrow) and LPM.
Tables
Table 1
E17.5 chimerism of Foxa2 or Shh promoter-driven conditional blastocyst complementation.
| Liver | Hematopoietic cells | Lung | |||||
|---|---|---|---|---|---|---|---|
| Whole | Epithelium | Mesenchyme | Endothelium | ||||
| Foxa2-Cre | Fgfr2 cKO | 56.2 | 71.3 | 91.8 | 99.8 | 92.3 | 73.1 |
| 54.5 | 64.9 | 90.6 | 99.7 | 89.8 | 91.7 | ||
| 48.3 | 62.9 | 90.3 | 99.6 | 86.7 | 76.7 | ||
| 39.4 | 57.8 | 87.7 | 99.8 | 86.2 | 73.9 | ||
| 14.4 | 21.1 | 58.9 | 99.5 | 57 | 38.6 | ||
| Fgfr2 hetero | 60.2 | 68.7 | 65.9 | 51.6 | 75 | 68.1 | |
| 55.8 | 70 | 88.8 | 76.1 | 89 | 88.5 | ||
| 24.8 | 32 | 42.1 | 44.6 | 38.4 | 41.1 | ||
| 9.7 | 12.6 | 21.2 | 50.7 | 19.3 | 13.4 | ||
| Shh-Cre | Fgfr2 cKO | 35.7 | 38.9 | 73.6 | 99.7 | 70.2 | 69.3 |
| 13 | 18.8 | 79.2 | 99.9 | 75.3 | 72.6 | ||
| 28.8 | 26.6 | 68.3 | 97.3 | 66 | 47.3 | ||
| 43.1 | 53.8 | 67.5 | 98 | 64.8 | 54.9 | ||
| 19.2 | 18.9 | 63.7 | 99.5 | 55.1 | 60.1 | ||
| Fgfr2 hetero | 57.4 | 12.7 | 33.6 | 38.3 | 33.4 | 22.1 | |
| 44.4 | 44.8 | 84.3 | 96.8 | 81.8 | 71.2 | ||
| 13.8 | 52.8 | 83.1 | 98.3 | 79.1 | 82.9 | ||
| 16.2 | 6.8 | 26.1 | 20.9 | 21.6 | 9.58 | ||
| 41.2 | 48.6 | 70.3 | 83.6 | 66.3 | 52.6 | ||
| 40 | 41.5 | 76.8 | 71 | 76.5 | 66.6 | ||
| Wild type | 79.1 | 100 | 89.5 | 90.4 | 83.2 | 80.7 | |
| 60.1 | 53.8 | 68.5 | 77.6 | 65.3 | 66.4 | ||
| 22.3 | 17.8 | 56.7 | 17.8 | 60.8 | 65.6 | ||
| 20.1 | 15.4 | 53.1 | 54.5 | 52 | 50.8 | ||
| 2.64 | 4.08 | 8.82 | 13.8 | 6.48 | 8.69 | ||
| 24.3 | 19.1 | 54.9 | 65.1 | 51.1 | 30.4 | ||
| 23.9 | 18.6 | 54.2 | 44 | 55.3 | 30.9 | ||
| 49 | 51 | 59.6 | 76.7 | 56.5 | 31.3 | ||
| 19.8 | 15.6 | 45.7 | 47.4 | 30.4 | 70.4 | ||
| 2.9 | 2.19 | 43.3 | 39.4 | 37 | 32.5 | ||
| 77.1 | 69.7 | 91.3 | 96.2 | 89.7 | 91.3 | ||
Table 2
E14.5 chimerism of Foxa2 promoter-driven conditional blastocyst complementation.
| Liver | Lung | |||||
|---|---|---|---|---|---|---|
| Whole | Epithelium | Mesenchyme | Endothelium | |||
| Foxa2-Cre | Fgfr2 cKO | 59.9 | 81.9 | 99.4 | 81.4 | 86.2 |
| 51 | 75.4 | 99.4 | 75.4 | 56.8 | ||
| 25.3 | 56.5 | 97.4 | 54.1 | 63.2 | ||
| Fgfr2 hetero | 37.1 | 54.4 | 56.9 | 54 | 58.9 | |
| 29.8 | 48.6 | 83.3 | 47.7 | 47.3 | ||
| 18.7 | 43.4 | 18 | 45 | 31 | ||
| 0.54 | 0.24 | 0.91 | 0.1 | 2.11 | ||
| 0.4 | 0.17 | 1.02 | 0.058 | 1.23 | ||
| Wild type | 39 | 68.7 | 56.2 | 69.2 | 67.5 | |
| 29.4 | 81.1 | 62.7 | 81.8 | 80.8 | ||
| 28.6 | 73.9 | 39.6 | 75.6 | 76.4 | ||
| 13.8 | 29.5 | 5.57 | 30.4 | 29.6 | ||
| 0 | 2.22 | 5.52 | 1.5 | 16 | ||
Additional files
-
MDAR checklist
- https://cdn.elifesciences.org/articles/86105/elife-86105-mdarchecklist1-v2.docx
-
Supplementary file 1
The antibody list used for the immunostainings and flowcytometry analyses in this article.
- https://cdn.elifesciences.org/articles/86105/elife-86105-supp1-v2.xlsx
-
Supplementary file 2
The primer list used for qPCR analysis in the article.
- https://cdn.elifesciences.org/articles/86105/elife-86105-supp2-v2.xlsx
-
Supplementary file 3
Summary of PSC donor lines, culture conditions, host mouse strains, and data for chimera formation, lung complementation, and survival in mice subjected to CBC.
- https://cdn.elifesciences.org/articles/86105/elife-86105-supp3-v2.xlsx
Download links
A two-part list of links to download the article, or parts of the article, in various formats.
Downloads (link to download the article as PDF)
Open citations (links to open the citations from this article in various online reference manager services)
Cite this article (links to download the citations from this article in formats compatible with various reference manager tools)
Conditional blastocyst complementation of a defective Foxa2 lineage efficiently promotes the generation of the whole lung
eLife 12:e86105.
https://doi.org/10.7554/eLife.86105


