Spatial determination and prognostic impact of the fibroblast transcriptome in pancreatic ductal adenocarcinoma
- Institute of Immunology and Immunotherapy, College of Medical and Dental Sciences, University of Birmingham, United Kingdom
- Centre for Computational Biology, University of Birmingham, United Kingdom
- Cancer Research Horizons, The Francis Crick Institute, United Kingdom
- University Hospitals Birmingham NHS Foundation Trust, Queen Elizabeth Hospital Birmingham, United Kingdom
Figures
Figure 1
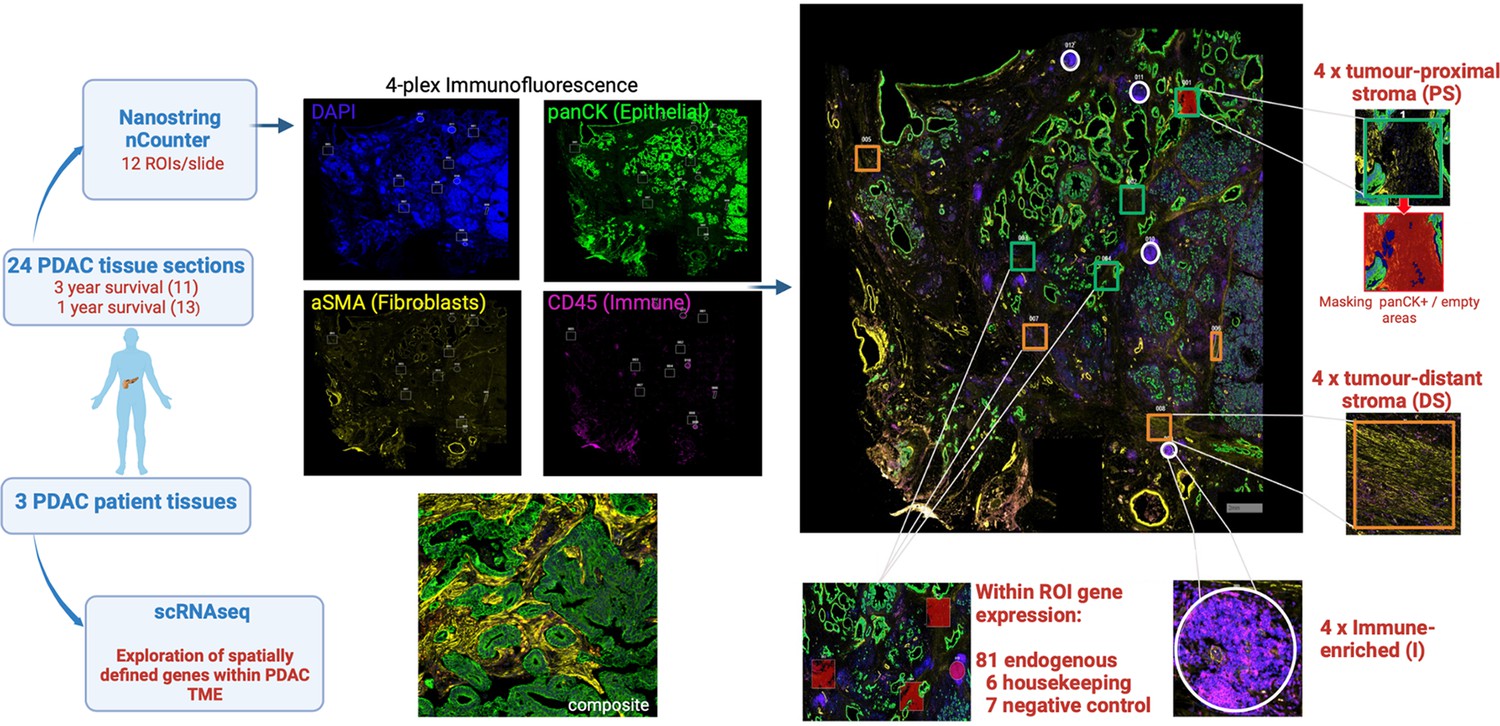
Schematic representation of experimental approach.
Histological slides of 24 surgical resection specimens from patients with PDAC were stained with DAPI (‘nuclear’), anti-pan-CK (‘epithelial’), anti-α-SMA (‘fibroblast’) and anti-CD45 (‘immune’) to identify tumor cells and primarily to define three domains: ‘tumor-proximal stroma’ (PS), ‘tumor-distant stroma’ (DS) and ‘immune-enriched’ (I). The NanoString Immuno-oncology RNA probe set, in combination with a custom panel of 10 fibroblast-targeted RNA probes, was used to interrogate four areas (termed ‘Regions of Interest’; ROI) from each of the three domains using the NanoString GeoMx Digital Spatial Profiler (DSP) platform. The transcriptional profile of spatially-defined tumor-proximal or tumor-distant fibroblast cells was subsequently aligned to scRNA-Seq datasets from three additional patients with PDAC.
Figure 2 with 5 supplements
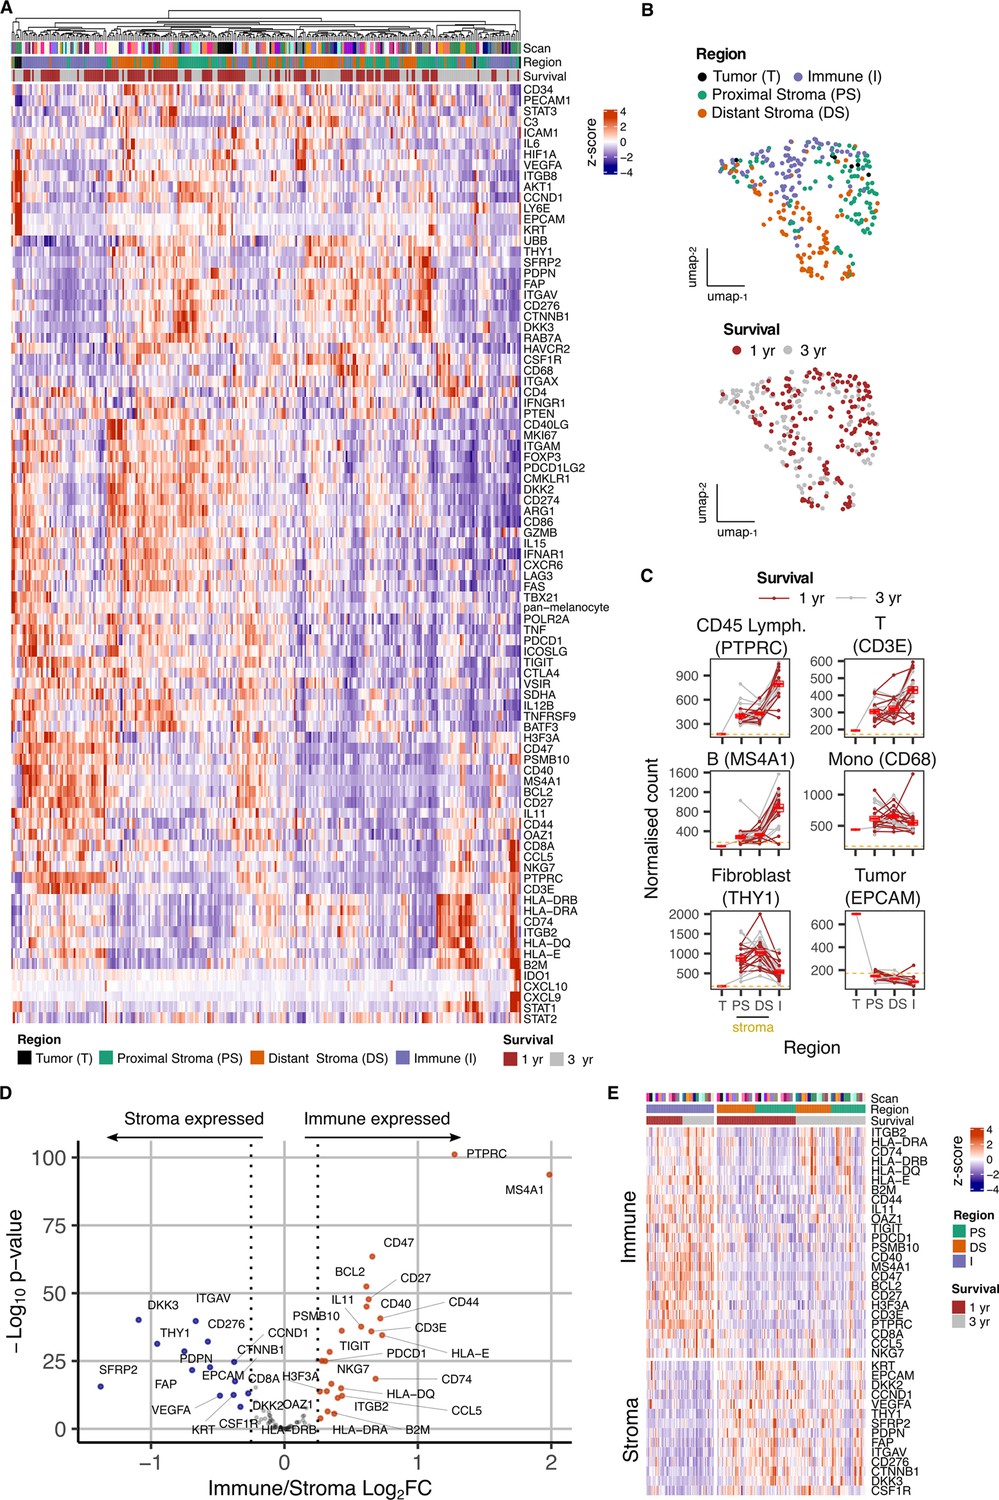
Overview of gene expression data from spatially-defined stromal and immune regions within the PDAC tumor microenvironment using NanoString GeoMx DSP.
(A) Expression profile of all endogenous probes across regions of interest (ROI) with hierarchical clustering of ROIs. (B) UMAP embedding from normalized count data showing all ROIs overlaid with ROI-specific annotations of Region (Immune/Stroma/Tumor type) and Survival (1 yr/3 yr). (C) Mean normalized count of cell type marker genes within regions. Lines indicate regions from the same patient; dashed line represents mean background threshold from negative probes; Mean +/-SE of mean shown in red. (D) Differential expression analysis to identift genes expressed differentially between Immune and Stroma ROIs. Colored points indicate differentially expressed genes (DEG) (BH adjusted p<0.05 and absolute log2FC >0.25). (E) Immune and Stroma expression signatures from DEGs identified in D.
Figure 2—figure supplement 1
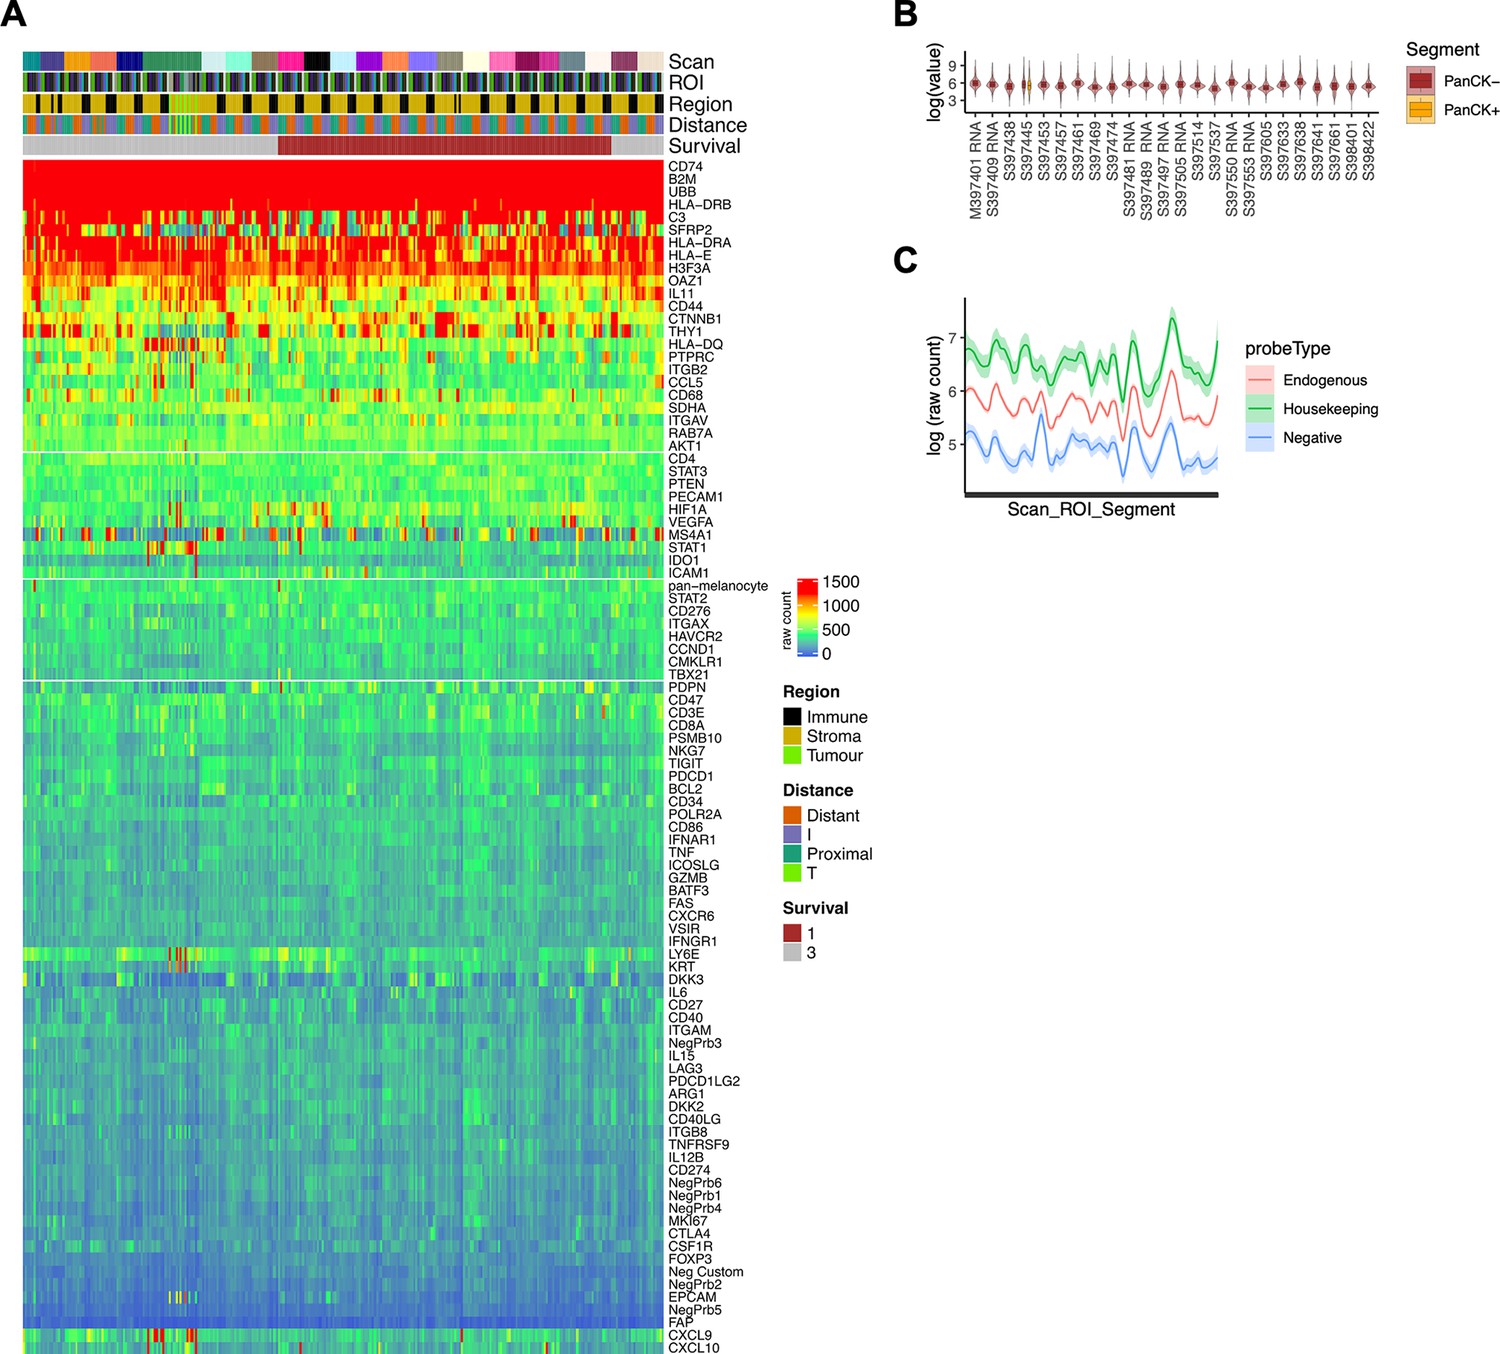
Raw count expression profiles.
(A) Heatmap of raw expression profile for the complete probeset (colour scale = raw count). (B) Per patient (scan) expression distributions for PanCK+ (tumor) and PanCK- (non-tumor) regions of interest. (C) Per patient (scan) expression profiles (mean +/-SE) for Endogenous, Housekeeping and Negative control probesets.
Figure 2—figure supplement 2
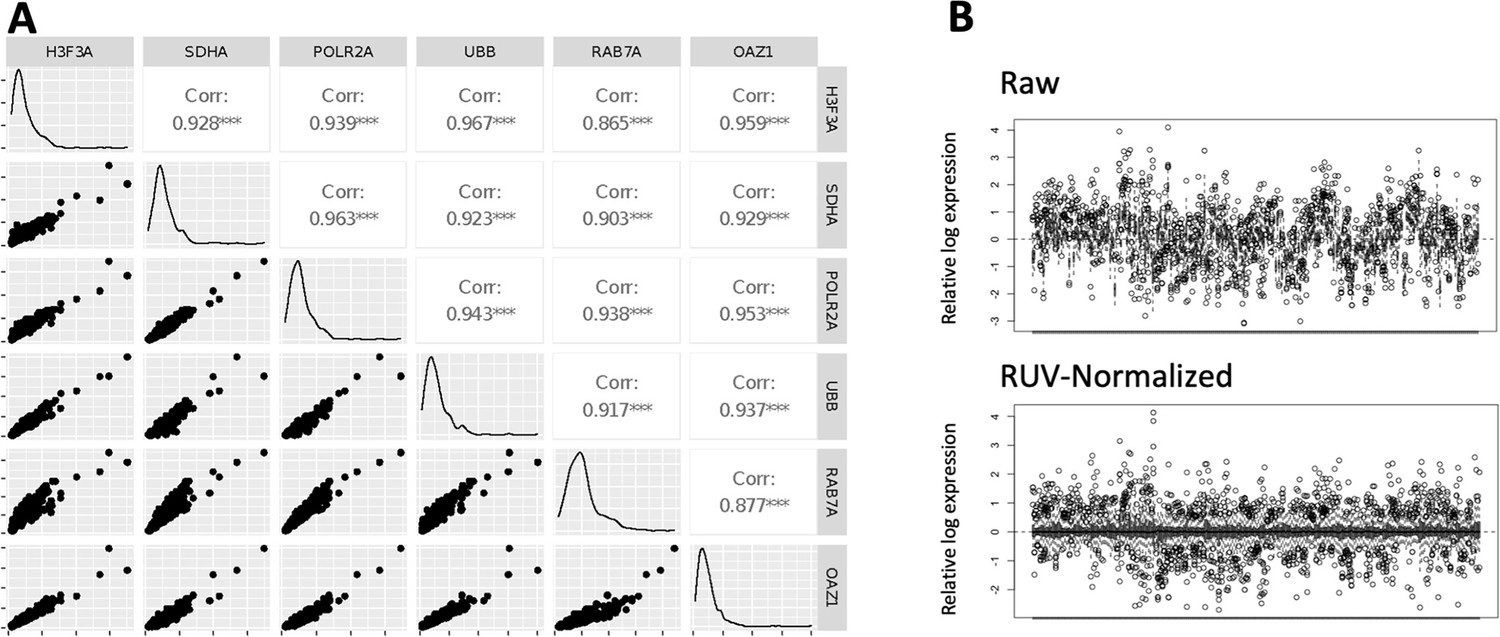
Housekeeping gene correlations and data normalisation.
(A) Pairwise correlation scatter plots for 6 housekeeping control probes. Raw housekeeping gene counts from all regions of interest (ROIs) were correlated against each other. Plots display the scatter, distribution histogram and Pearson correlation coefficient and significance (***p<0.001). (B) Relative log expression plots of raw count data and post normalization with the top two most-correlated housekeeping genes (H3F3A and UBB) to remove unwanted variation (RUV method).
Figure 2—figure supplement 3
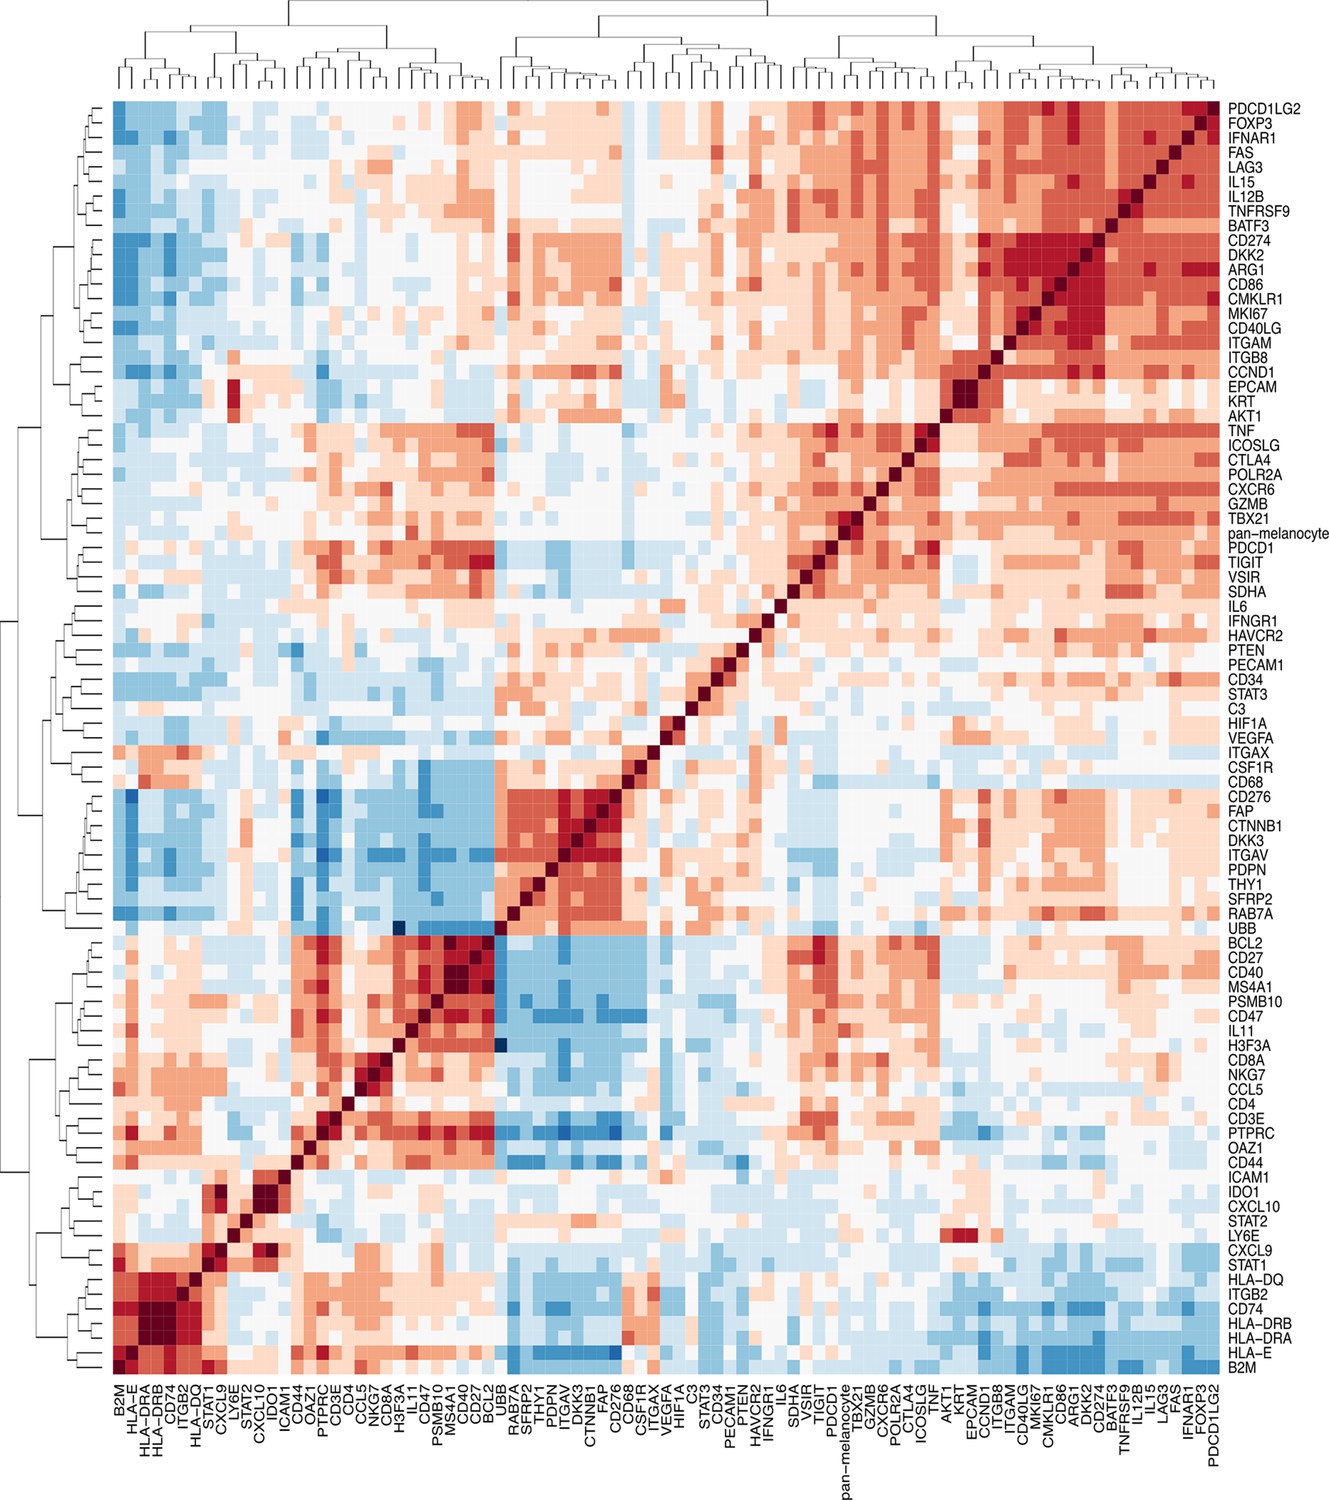
Correlation matrix of endogenous probes.
Pairwise correlations of normalized gene count data represented as a matrix of Pearson correlation coefficients.
Figure 2—figure supplement 4
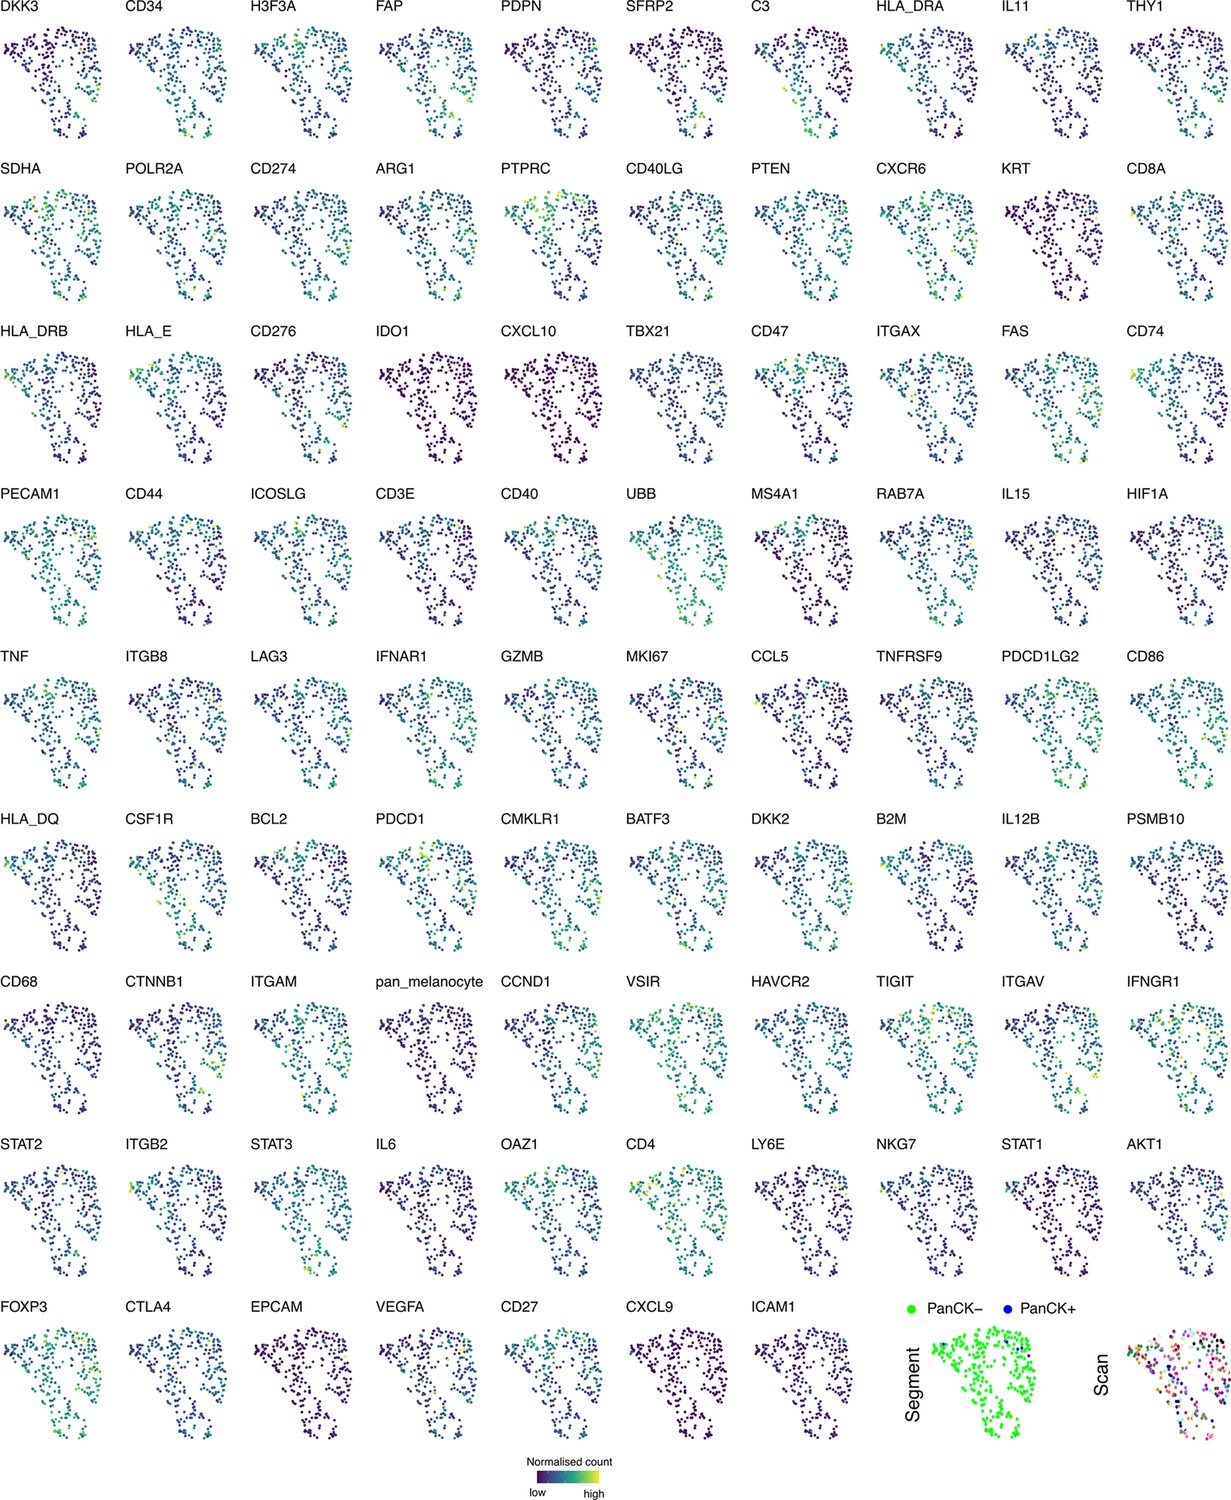
Individual gene expression profiles on UMAP embeddings of all regions of interest (ROIs).
UMAP embedding generated from normalized count data of all probes in all REIs overlaid with ROI-specific normalized gene count.
Figure 2—figure supplement 5
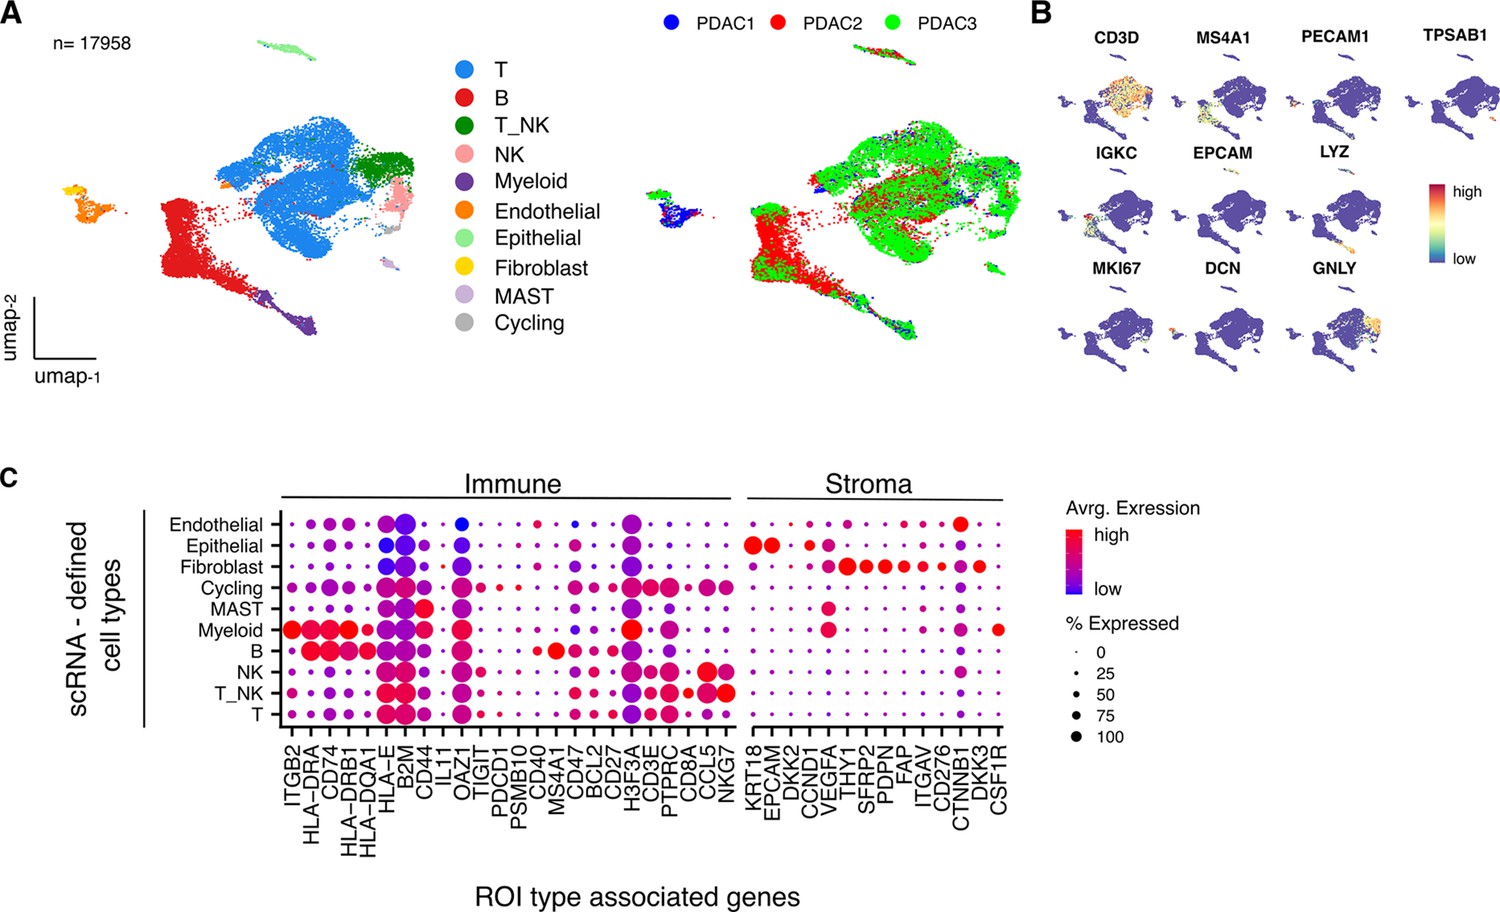
High level cell type contexture of PDAC tumor microenvironment.
(A) (left), UMAP embedding of transcriptional data for 17,958 cells in the tumor microenvironment of 3 x PDAC patient tissue samples overlaid with high level cell type identified from unsupervised clustering. A (right), UMAP embedding overlaid with source sample identifier. (B) UMAP embedding overlaid with the expression profile of canonical high level cell type marker genes. (C) Average scRNA expression profile of spatial profiling defined Immune and Stroma ROI type-associated genes within high level cell types defined by scRNA-seq (n=3 PDAC samples).
Figure 3 with 1 supplement
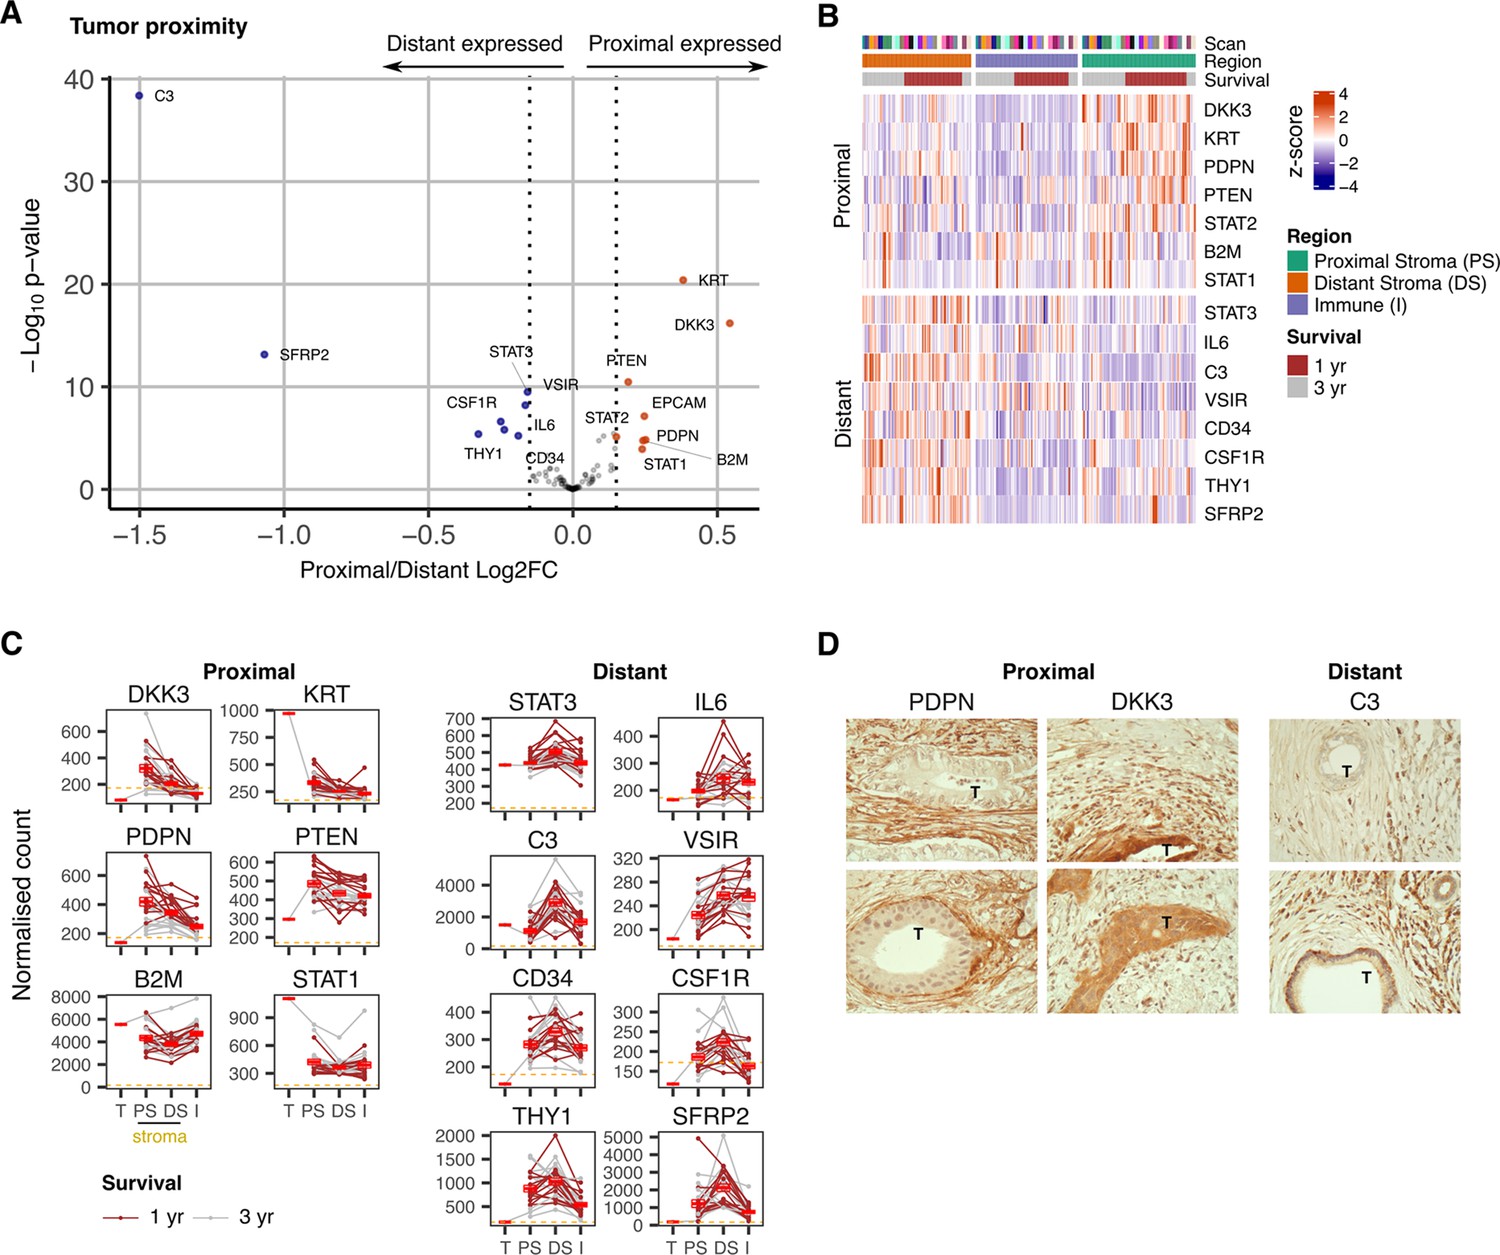
Expression signature of PDAC tumor-proximal and tumor-distal stromal cells.
(A) Differentially expressed genes (DEGs) between stroma regions proximal (P) or distal (D) from tumor. Colored points indicate differentially expressed genes (BH adjusted P<0.05 & absolute log2FC >0.25). (B) Stroma proximity-to-tumor expression signature from DEGs identified in A. (C) Relative expression of genes within four PDAC regions: Tumor (T), proximal-tumor stroma (PS), distal-tumor stromal (DS) and immune (I). Lines indicate paired regions from the same patient; dashed line represents mean background threshold from negative probes; Mean +/-SE of mean shown in red. Shown as within patient mean normalized count vs region type for DEG identified in A. (D) Representative immunohistochemical staining of podoplanin, DKK3 and C3 proteins in relation to tumor cells (T) in PDAC tissue.
Figure 3—figure supplement 1
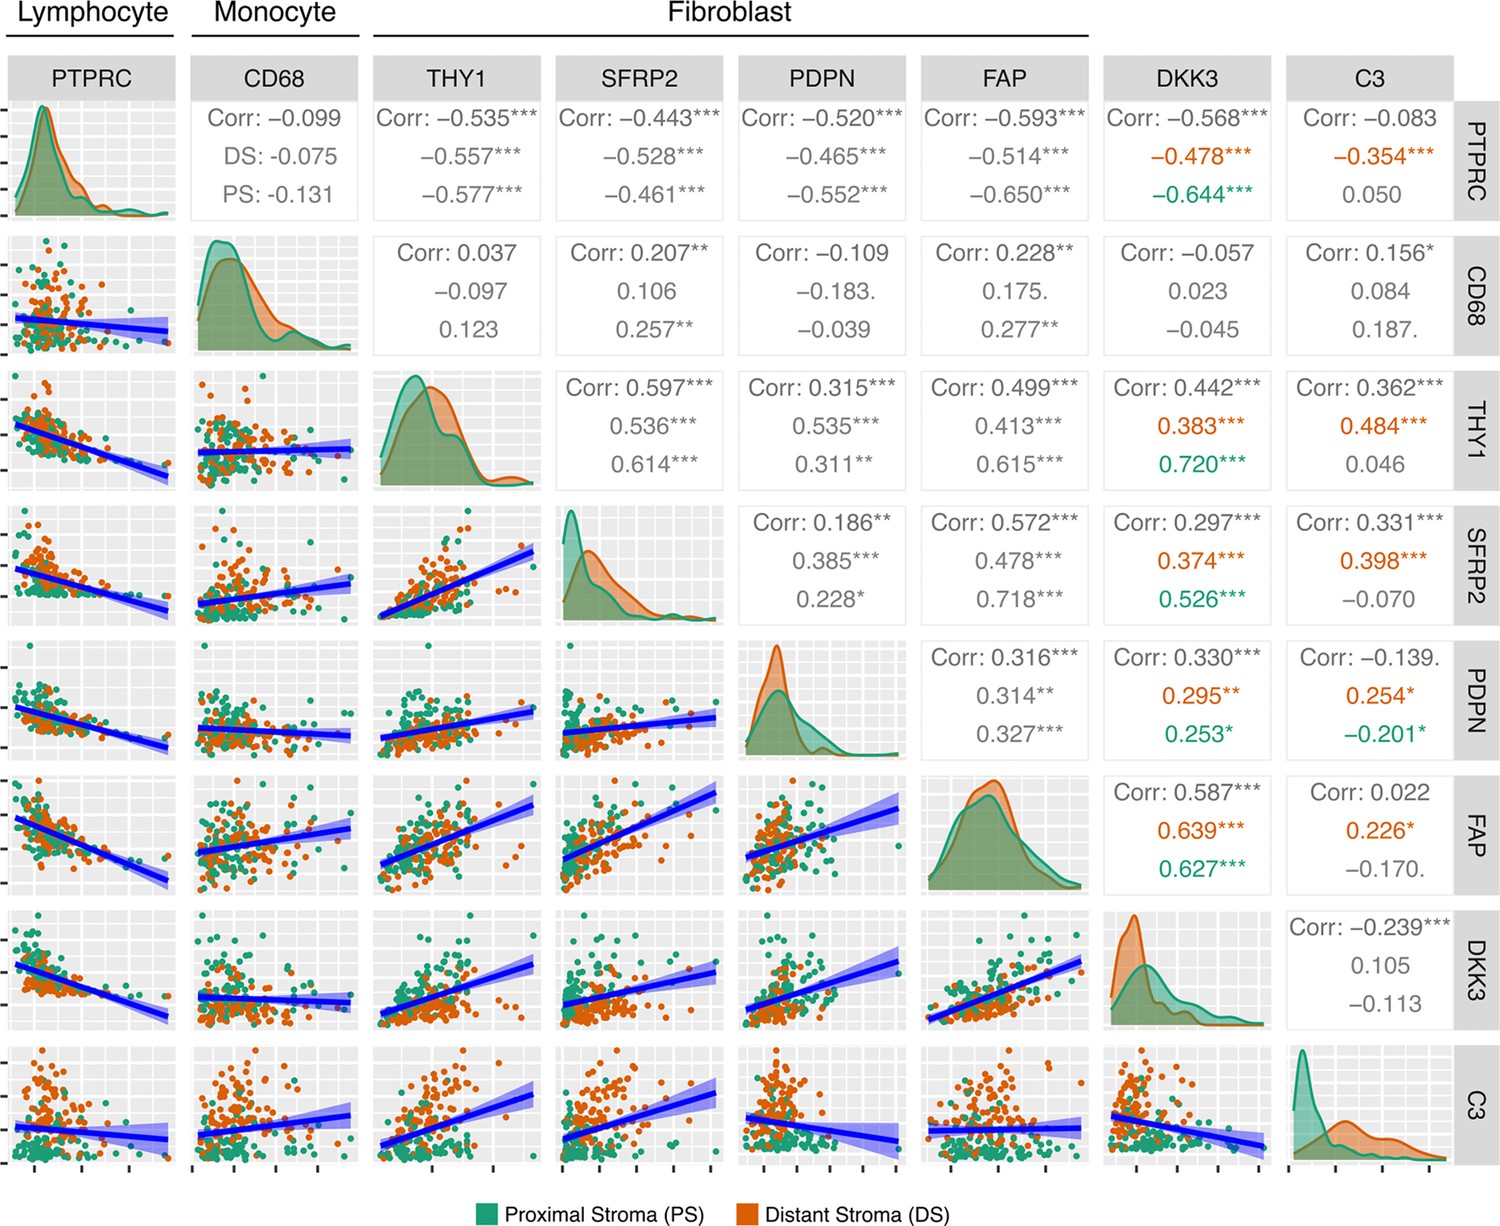
Correlations of proximity specific markers DKK3 and C3.
Pairwise Pearson correlations of tumor-proximity specific markers C3 and DKK3 against marker genes for Lymphocytes, Monocytes and Fibroblast cells. Coefficients are highlighted where there are significant correlations of either DKK3 or C3 within Proximal (green) or Distant (orange) Stroma ROIs.
Figure 4
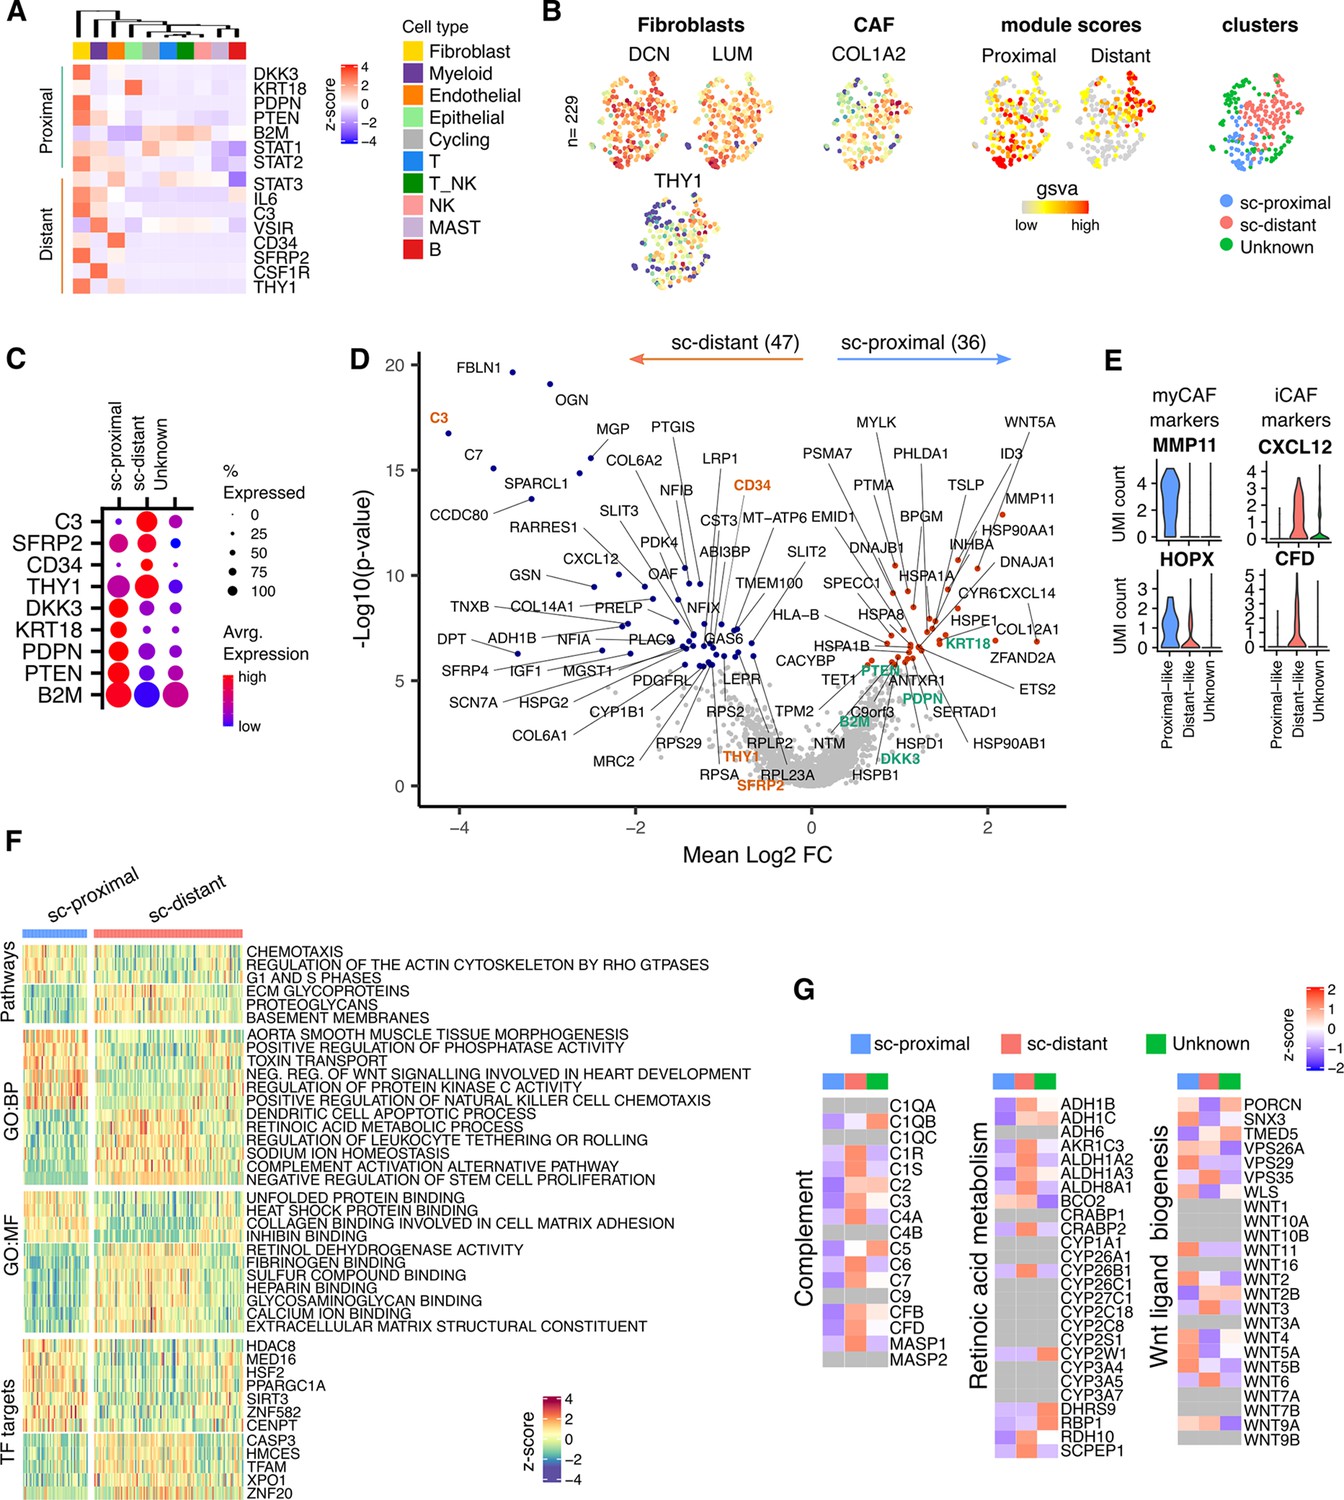
Proximal and Distal Fibroblast populations identified in single cell transcriptome data of PDAC.
(A) Average expression of spatially defined tumor-proximal or tumor-distant stromal genes within cell types defined by scRNA-seq (n=3). (B) UMAP embedding of scRNA-Seq data from fibroblasts overlaid with (left to right) expression of the canonical fibroblast marker genes DCN, LUM and THY1; COL1A2 found in CAFs; gene set variation analysis (GSVA) signature score for tumor-proximal (DKK3, PDPN, PTENSTAT2, B2 and STAT1) or tumor-distal (STAT3, IL6, C3, VSIR, CD34, CSF1R, THY1, SFRP2) associated stromal genes; Clustering based on unsupervised Louvain assignment. n=229 Fibroblast cells.(C) Average cluster-wise expression profile of selected proximal and distant stroma associated genes as identified by spatial profiling. (D) Differential expression analysis between sc-proximal and sc-distant fibroblast cells. Colored points indicate differentially expressed genes (BH adjusted p<0.05 & absolute log2FC >0.5). (E) Violin plots depicting cluster-wise expression distribution of canonical myCAF and iCAF marker genes. (F) GSVA score profiles identified as differentially enriched (BH adjusted p<0.001) in sc-distant vs sc-proximal cells. (G) Average within-cluster expression profile of Complement, Retinoic acid metabolism and Wnt ligand biogenesis gene sets. Grey = no detectable expression.
Figure 5 with 1 supplement
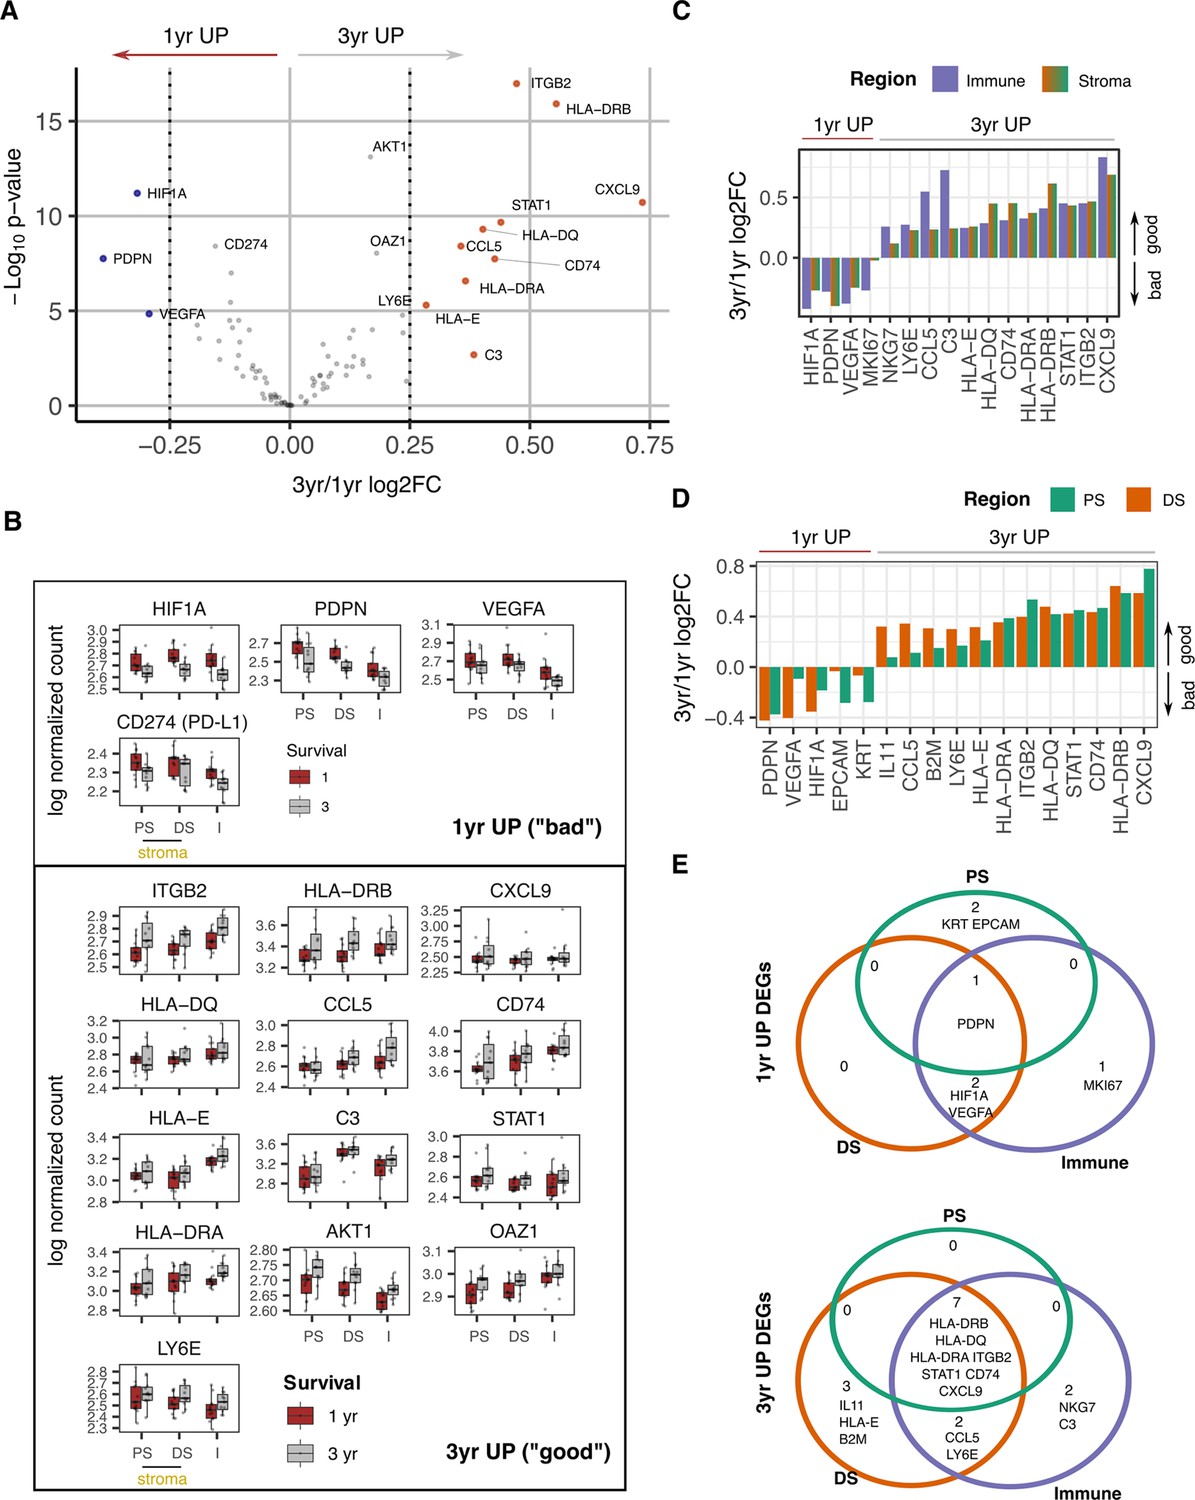
Survival expression signatures within spatially defined regions of PDAC.
(A) Differential gene expression from all regions in relation to poor (<1 year) or good (3+year) survival. Coloured points indicate differentially expressed genes (BH adjusted p<0.05 and absolute log2FC >0.25). (B) Regional expression of survival-associated genes identified in A. Mean +/-SE of mean. PS = Proximal Stroma; DS = Distant Stroma; I=Immune. (C) 3 yr/1 yr fold change in expression of survival-associated genes within Immune and Stroma regions. (BH adjusted p<0.05 and absolute log2FC >0.25). (D) 3 yr/1 yr fold change in expression of survival-associated genes within Tumor-Proximal and Tumor-Distal regions. (BH adjusted p<0.05 and absolute log2FC >0.25). (E) Venn displaying overlaps of 3 yr vs 1 yr survival DEGs (BH adjusted p<0.05 and absolute log2FC >0.25) within tumor-proximal stroma (PS), tumor-distal stroma (DS) and Immune (I) regions.
Figure 5—figure supplement 1
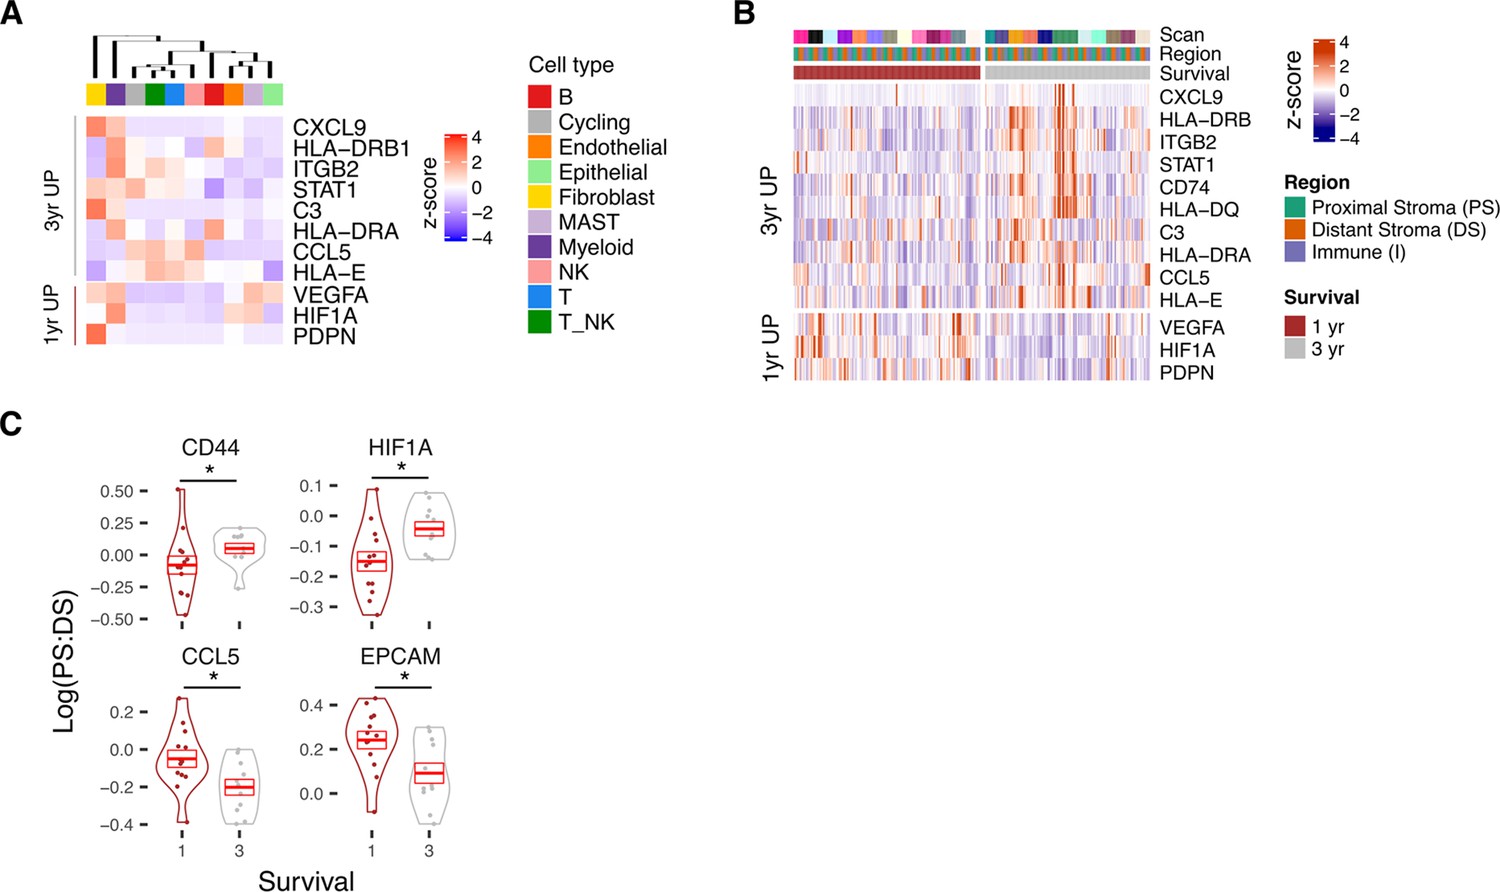
Profile of Survival expression signatures within PDAC TME.
(A) Average scRNA expression profile of Survival associated genes within high level cell types of scRNA-seq dataset (n=3). (B) Expression profile of Survival associated genes identified by 3 yr vs 1 yr differential expression analysis. (C) Proximal Stroma (PS): Distant Stroma (DS) ratios stratified by survival outcome for selected genes with significant difference in ratio when stratified by survival.
Figure 6
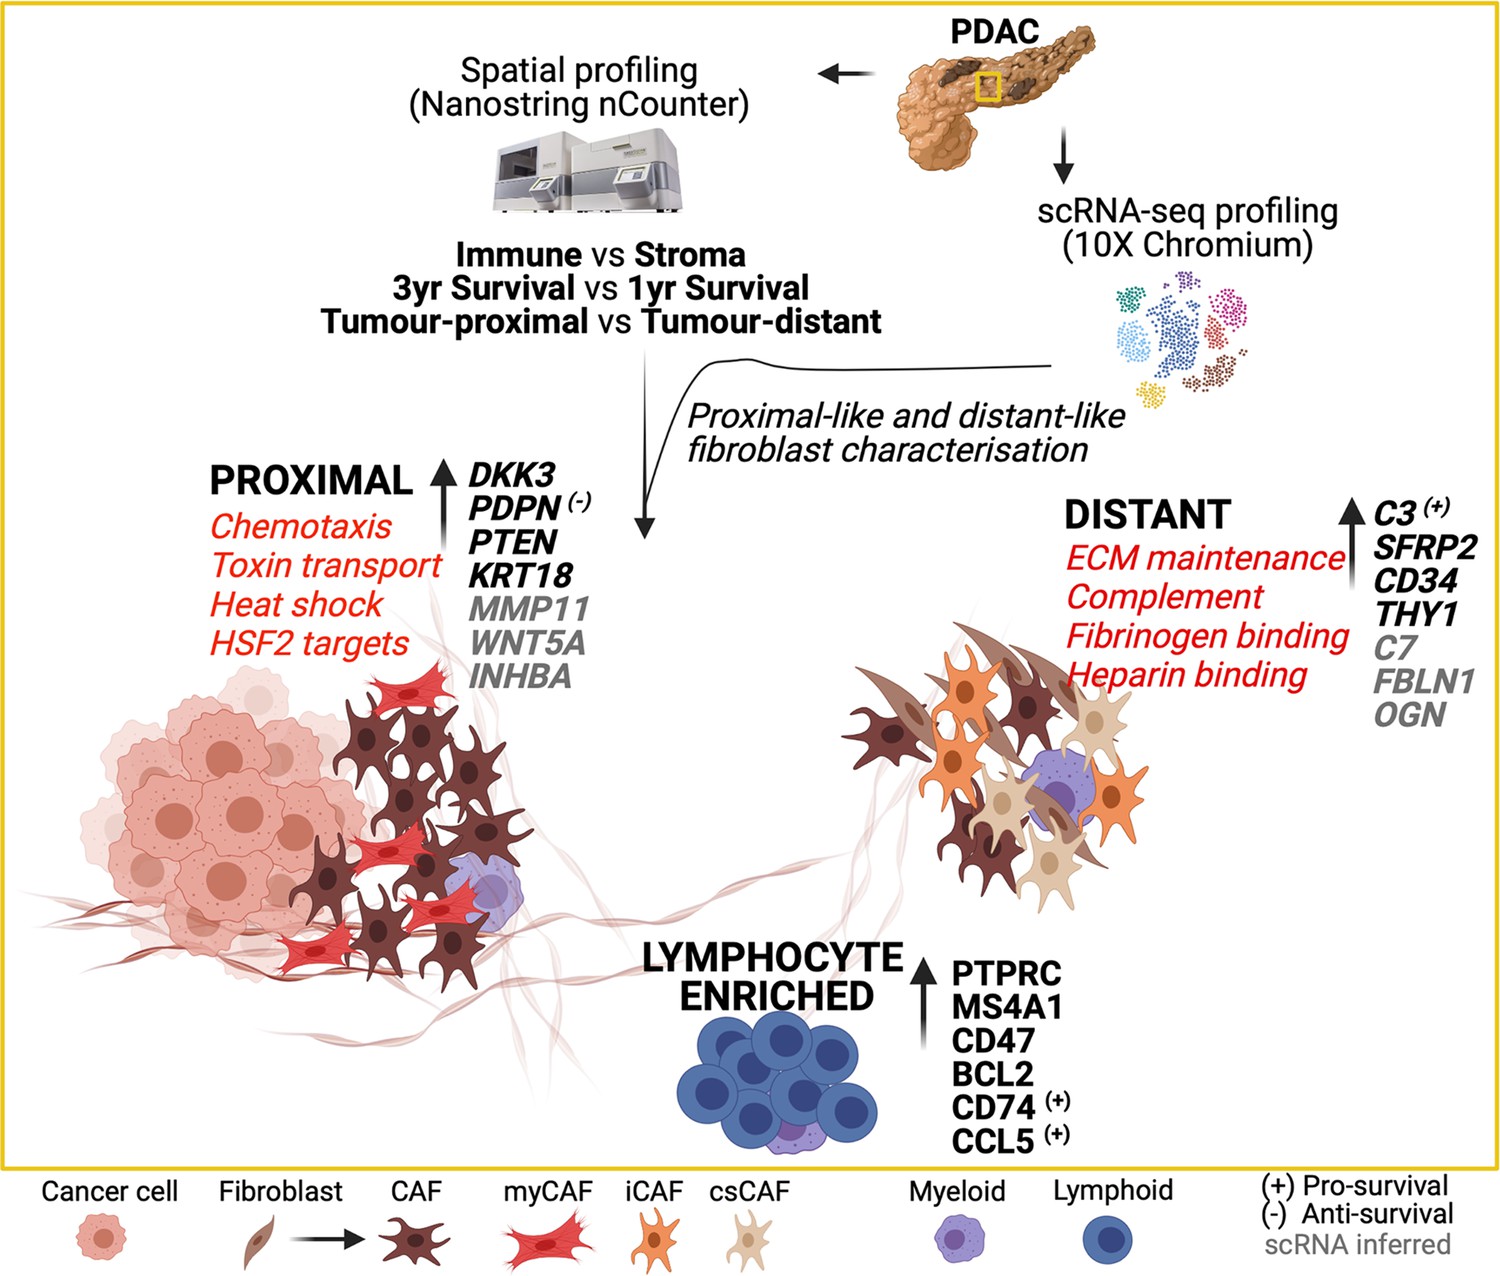
Graphical summary of the transcriptional features of spatially defined regions in the PDAC tumor microenvironment.
Tables
Table 1
Morphology marker antibodies.
| Name | Channel | Host | Company | Clone # | Catalog # | Concentration used |
|---|---|---|---|---|---|---|
| SMA | 488 | Mouse | Invitrogen | 1A4 | 53-9760-82 | 1:200 |
| Syto83 | 532 | Thermo fisher | 400 nM | |||
| PanCk | 594 | Mouse | Novus | AE1/AE3 | NBP2-33200DL594 | 1:500 |
| CD45 | 647 | Mouse | Novus | 2B11+PD7/26 | NBP2-34528AF647 | 1:200 |
Additional files
-
Supplementary file 1
NanoString nCounter RNA hybridisation probeset.
List of RNA probe panels used for Nanostring nCounter data collection including the immunoncology core panel, fibroblast-specific, housekeeping and negative control probe sets.
- https://cdn.elifesciences.org/articles/86125/elife-86125-supp1-v2.docx
-
MDAR checklist
- https://cdn.elifesciences.org/articles/86125/elife-86125-mdarchecklist1-v2.docx
-
Source data 1
Raw NanoString nCounter data.
- https://cdn.elifesciences.org/articles/86125/elife-86125-data1-v2.csv
Download links
A two-part list of links to download the article, or parts of the article, in various formats.
Downloads (link to download the article as PDF)
Open citations (links to open the citations from this article in various online reference manager services)
Cite this article (links to download the citations from this article in formats compatible with various reference manager tools)
Spatial determination and prognostic impact of the fibroblast transcriptome in pancreatic ductal adenocarcinoma
eLife 12:e86125.
https://doi.org/10.7554/eLife.86125


