Bacterial meningitis in the early postnatal mouse studied at single-cell resolution
- Department of Molecular Biology and Genetics, Johns Hopkins University School of Medicine, United States
- Howard Hughes Medical Institute, Johns Hopkins University School of Medicine, United States
- Department of Neuroscience, Johns Hopkins University School of Medicine, United States
- Department of Ophthalmology, Johns Hopkins University School of Medicine, United States
Figures
Figure 1 with 3 supplements
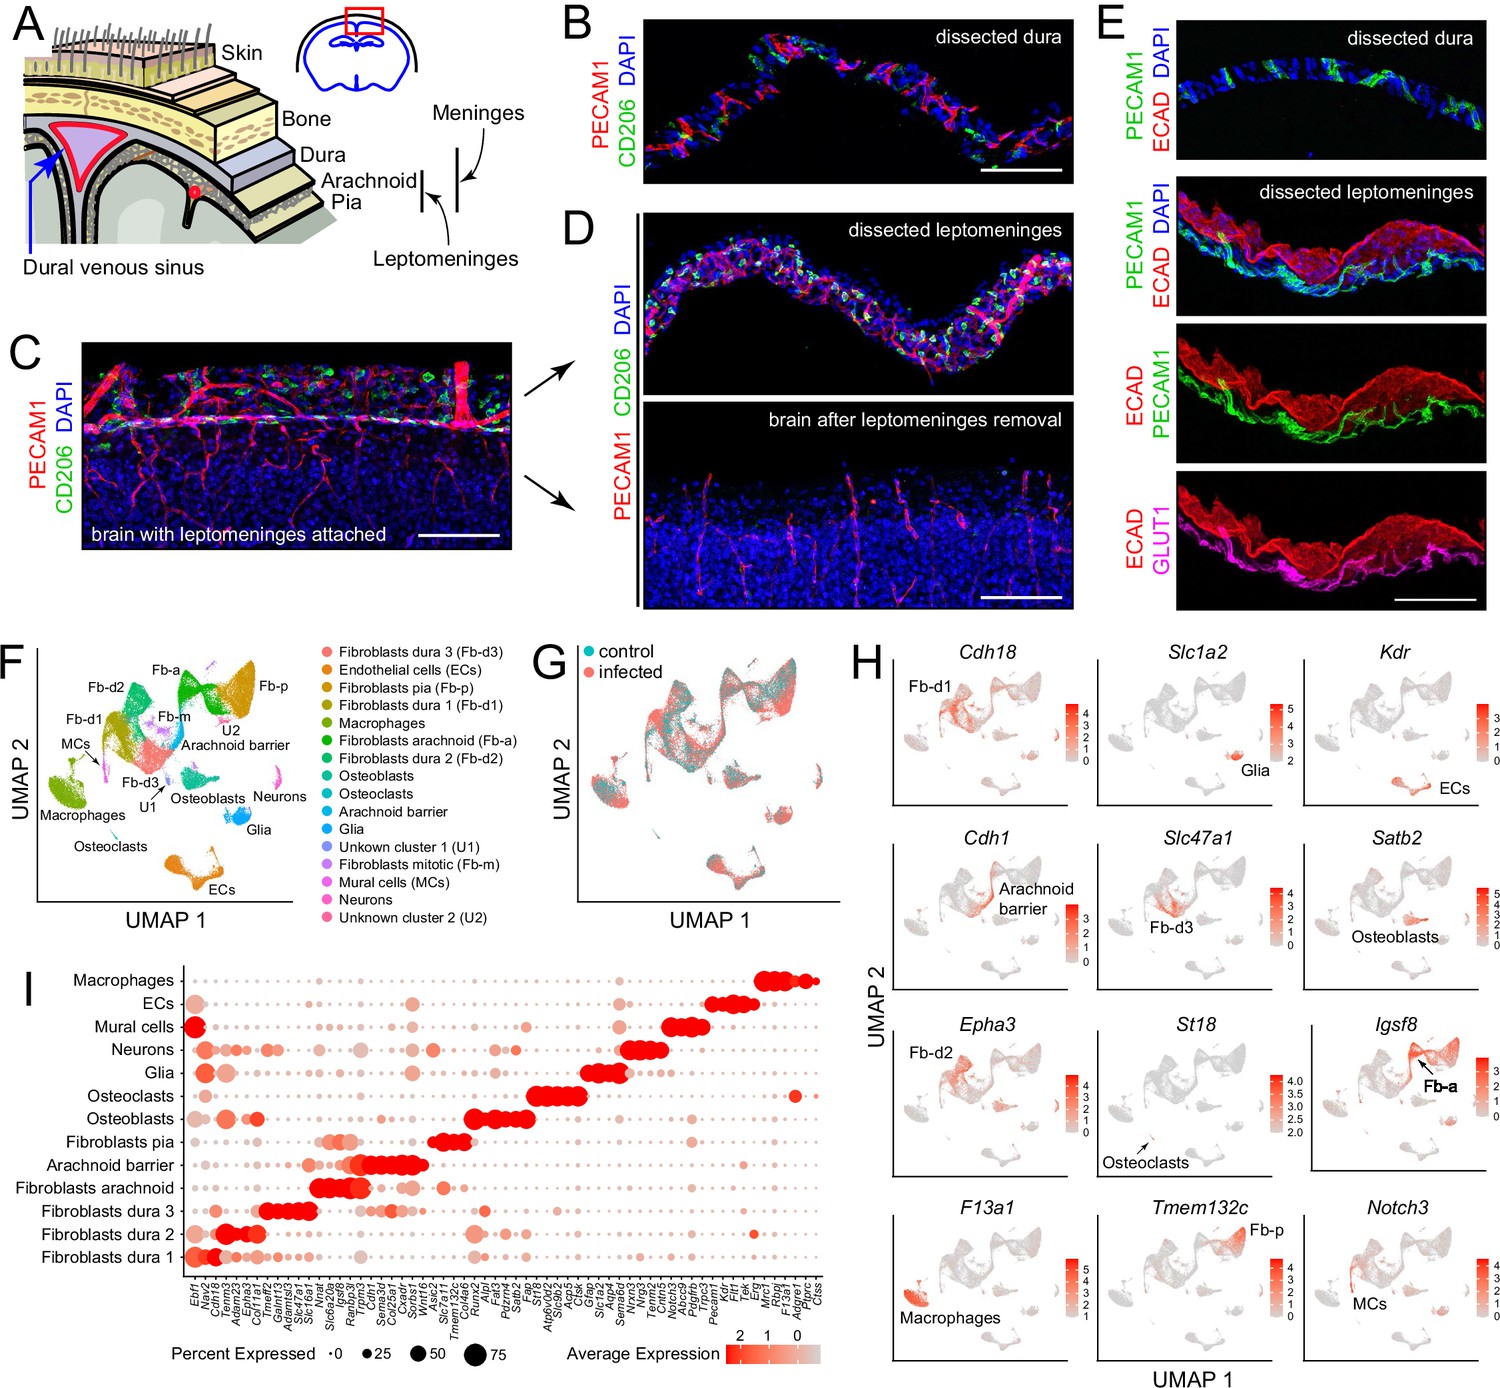
Dissection and single nucleus (sn) RNAseq of mouse meninges.
(A) Diagram of the tissue layers between brain and skin, corresponding to the red rectangle in the coronal section through the brain and skull (upper right). (B) Cross-section of dissected dura stained for PECAM1 (endothelial cells) and CD206 (macrophages). (C) Coronal section through cortex (lower) and overlying leptomeninges (upper) stained for PECAM1 and CD206. (D) Cross-scetion of the isolated leptomeninges (upper panel) and the denuded brain (lower) stained for PECAM1 and CD206. (E) Dissected dura and leptomeninges stained for PECAM1 and ECAD (arachnoid barrier epithelium); the leptomeninges is also stained for GLUT1 (a BBB marker; bottom panel). (F) UMAP plot of combined control and infected meninges snRNAseq datasets with cell clusters differentially colored and labeled. The macrophage cluster includes a small upward extension that represents monocytes and monocyte-derived cells. (G) UMAP plots of separated control and infected meninges snRNAseq datasets. (H) UMAP plots, as in panel (F) showing transcripts that are highly enriched in each of 12 cell clusters (labels in each panel). (I) Dot plot showing some of the transcript abundances that most clearly discriminate among major meningeal cell types, as well as contaminating neurons and glia. Scale bars: B-E, 100 um. All tissue and data in this and other figures are from P6 mice. The immunostaining and histochemical probes in this and other figures are indicated adjacent to the corresponding panel(s), with lettering color-coded to match the corresponding fluorescent color.
Figure 1—figure supplement 1

Pairwise Pearson correlations among snRNAseq datasets.
Correlation coefficients and hierarchical clustering are shown for two control and three infected snRNAseq datasets from P6 mice. Each snRNAseq dataset is derived form the combined leptomeninges and dura from one mouse. The sex of the mice is indicated.
Figure 1—figure supplement 2

Flatmount images of control (i.e. uninfected) leptomeninges and dura.
(A) snRNAseq UMAP plots of markers used in (B)-(D). (B) Immunostaining for macrophage markers CD206 and LYVE: a comparison between a vibratome cross-section of the cortical surface (upper panels) and a leptomeninges flatmount (lower panels). In the upper panels, the cortex occupies the lower ~60% of the image, and the leptomeninges occupies most of the upper 40%. (C) Immunostaining of leptomeninges flatmounts for macrophage markers CD206 (cytoplasmic/surface), PU.1 (nuclear), and CD45 (cytoplasmic/surface) (upper two panels) and for EC markers OCLN, PECAM1, and ZO1 (lower six panels). (D) Flatmounts of dura, with bone attached, stained for macrophage markers CD206, CD45, and LYVE1 (top panels); EC marker PECAM1 and fibroblast markers COL14A1 (extracellular) and FOXP2 (nuclear) (central panels); and EC marker PECAM1, fibroblast marker FOXP2 (nuclear), and osteoblast marker SATB2 (nuclear) (bottom panel). Scale bars: B-D, 100 µm.
Figure 1—figure supplement 3
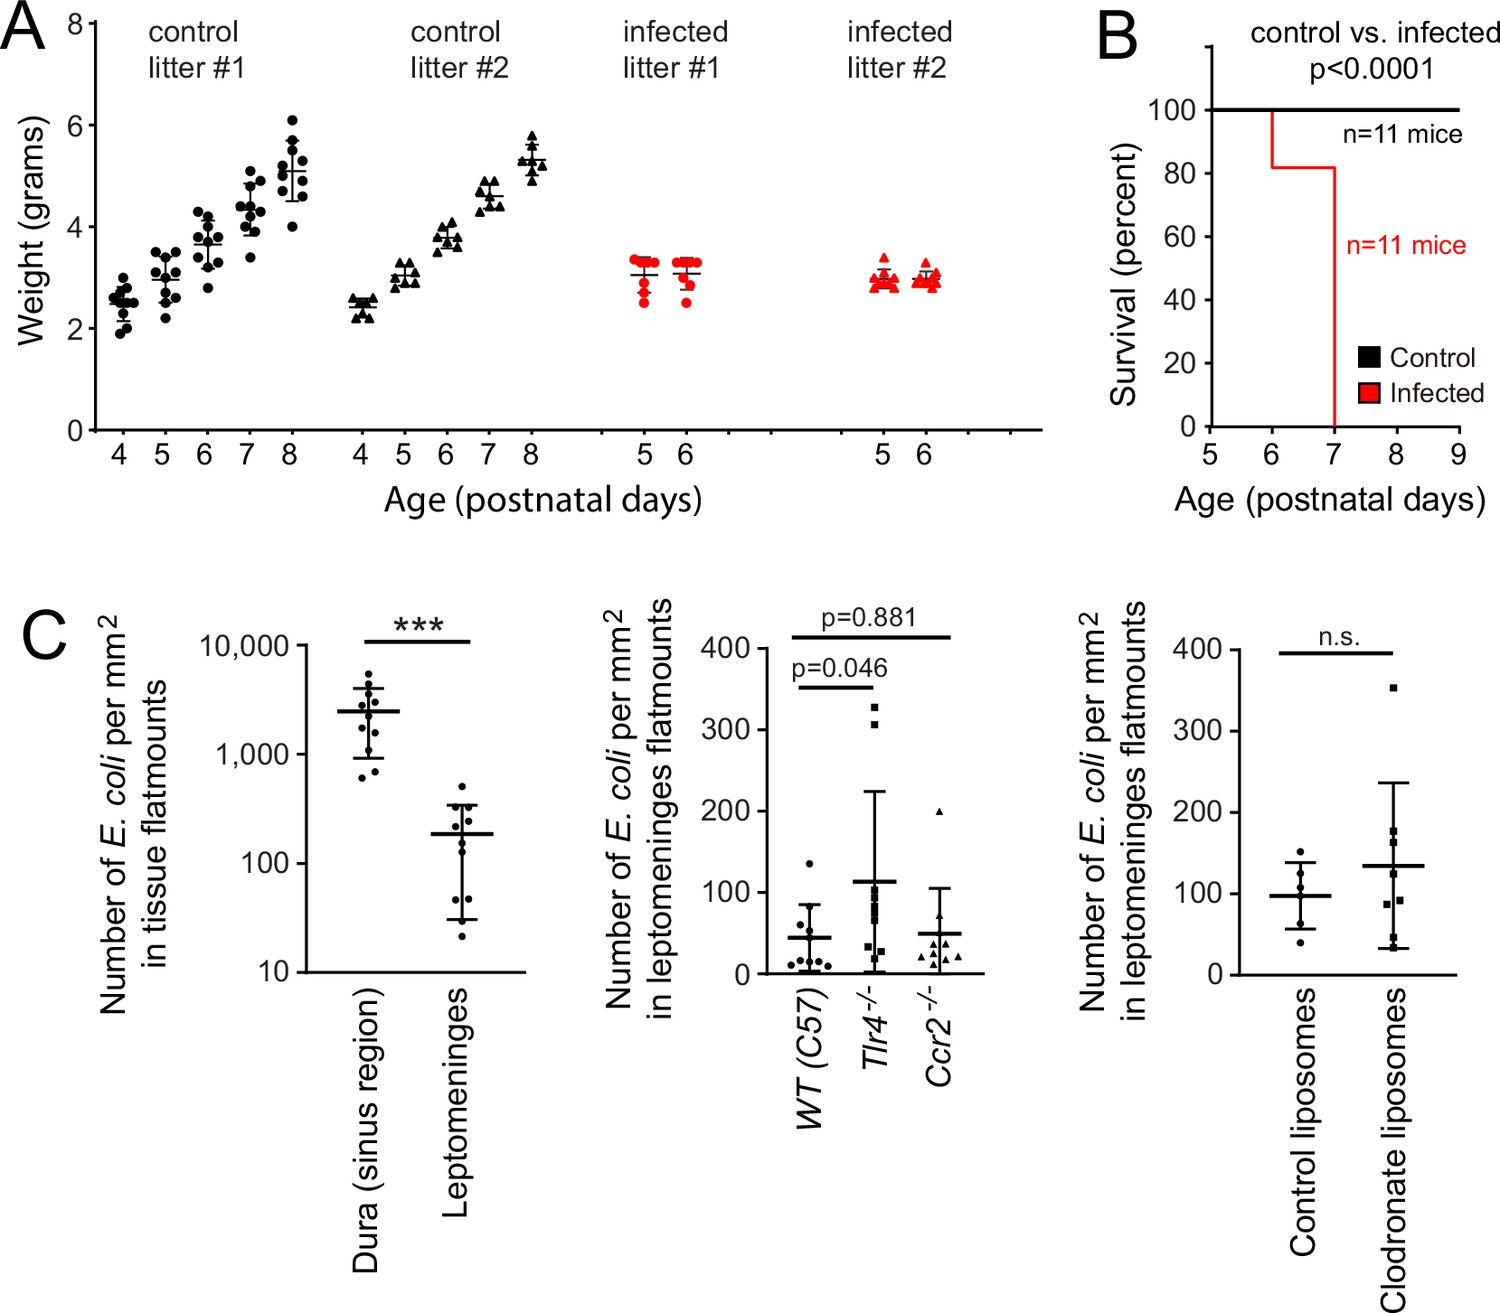
Characteristics of the P5-P6 model of E. coli meningitis.
(A) Daily weights of individual pups in two control litters from P4-P8 (left) and in two litters in which each pup received the standard subcutaneous injection of E. coli at P5 (right). All mice are FVB/NJ. (B) Kaplan-Meier survival curve for control and injected mice. E. coli injection was at P5. (C) Counts of RFP-expressing E.coli in tissue flatmounts at P6, expressed as number of bacterial cells per square millimeter in Z-stacked images that encompass the full width of the lepomeninges or dura central sinus. In the left plot, the greater number of bacteria in the dura sinus region compared to the leptomeninges partly reflects the several-fold greater depth (i.e. greater tissue volume) of the dura sinus relative to the leptomeninges.
Figure 2 with 4 supplements
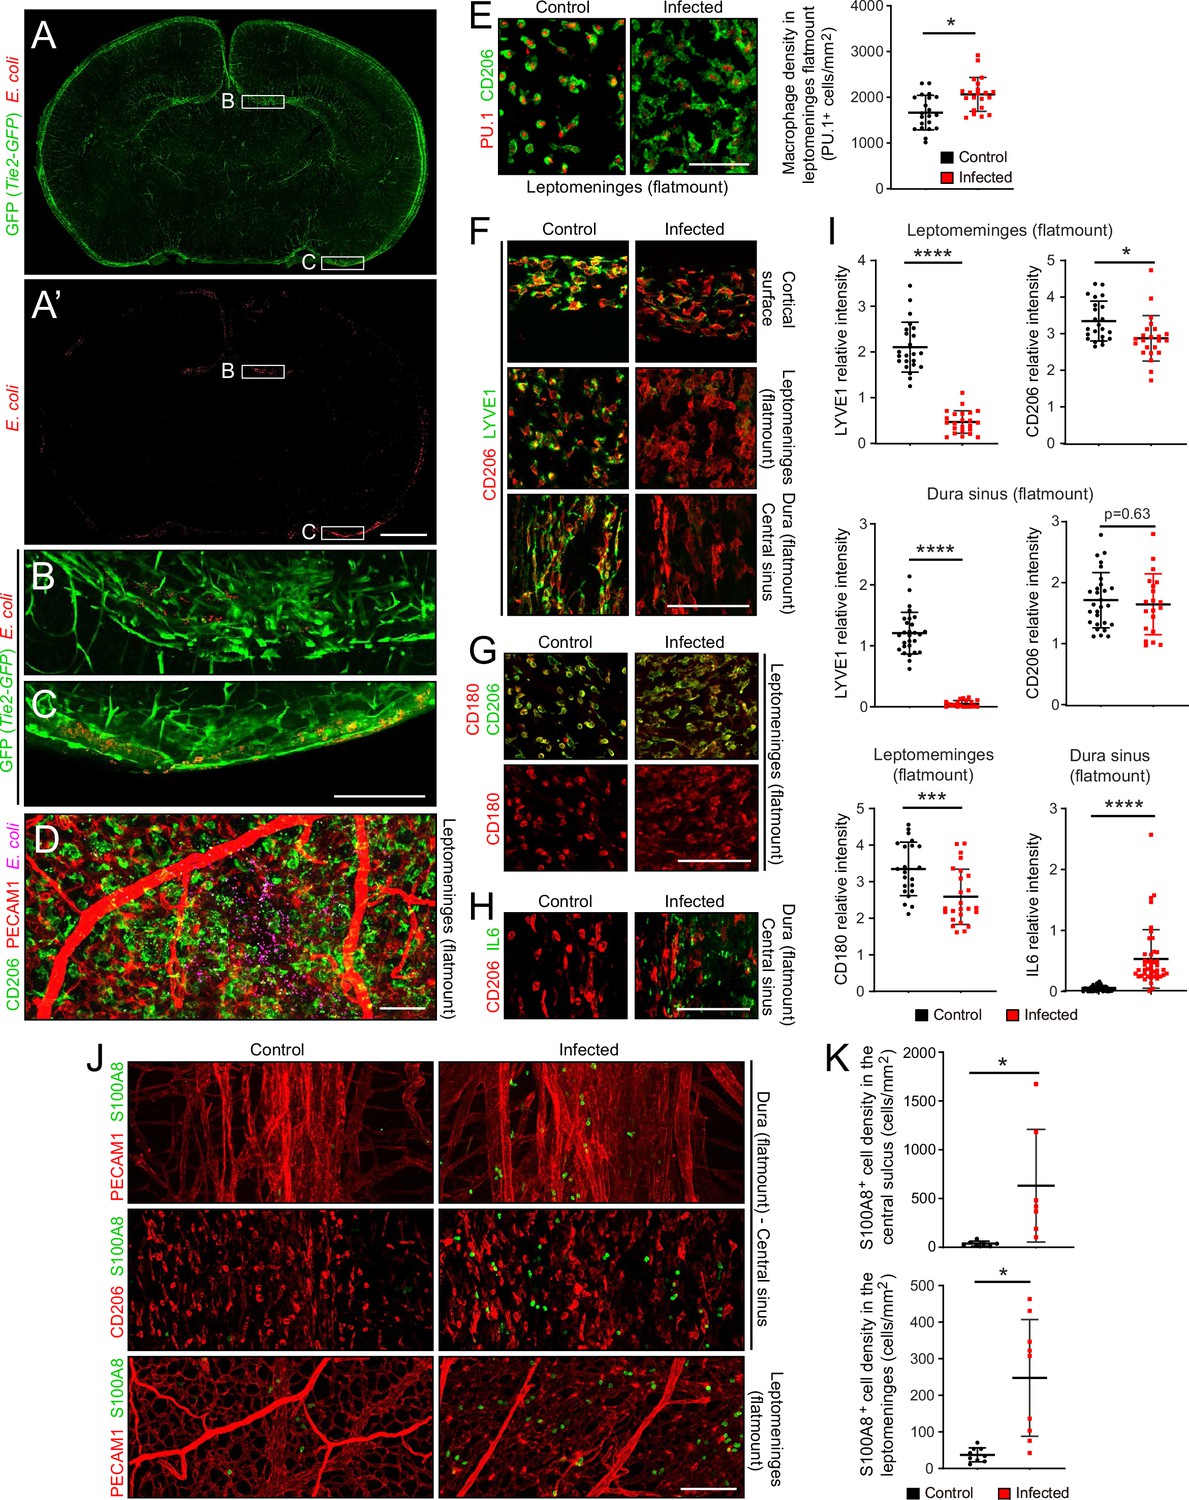
The E. coli meningitis model and some immune cell responses.
(A–C) Coronal sections of P6 brain with leptomeninges, 1 day after a subcutaneous injection of 1.2×10⁵ RFP-expressing E. coli K1. Regions within the rectangles labeled (B) and (C) are enlarged below. The Tie2-GFP transgene is expressed in ECs. (D) Leptomeninges flatmount showing scattered E. coli (RFP; false colored magenta). (E) Leptomeningeal macrophages, visualized with nuclear immunostaining for transcription factor PU.1 and cytoplasmic staining for CD206, show cytoplasmic enlargement upon infection (left), but only a small increase in cell number (right). (F) Infection leads to a selective reduction in LYVE1 immunostaining, and little or no change in CD206 immunostaining, in macrophages in the leptomeninges and dura. (G) Infection leads to little or no change in CD180 and CD206 immunostaining in macrophages in the leptomeninges. (H) IL6 increases in dural fibroblasts in the central sinus. (I) Quantification of images in F-H, in arbitrary units. Each point in this and other quantifications of immunofluorescent data represents the analysis of a single Z-stacked confocal image that encompasses the full depth of the tissue (leptomeninges or dura), unless noted otherwise. (J and K) Increase in cells immunostained for S100A8 in the leptomeninges and dura of infected mice. All infected tissue and data in this and other figures are from P6 mice that had been infected 22 hr earlier. Scale bars: A and A’, 500 µm; B-I, 100 µm. In this and all other figures showing quantification: (1) unless stated otherwise, each symbol in the immunofluorescent quantifications represent a single confocal image, (2) the bars show mean ± SD; (3) the number of mice used for each sample are listed in Supplementary file 4; (4) the Wilcoxon rank sum test was used to measure statistical significance, except for Figure 5D and G, in which the sample size is too small and the student t-test was used instead; and (5) abbreviations are: n.s., not significant (i.e. p>0.05); *, p<0.05; **, p<0.01; ***, p<0.001; ****, p<0.0001.
Figure 2—figure supplement 1
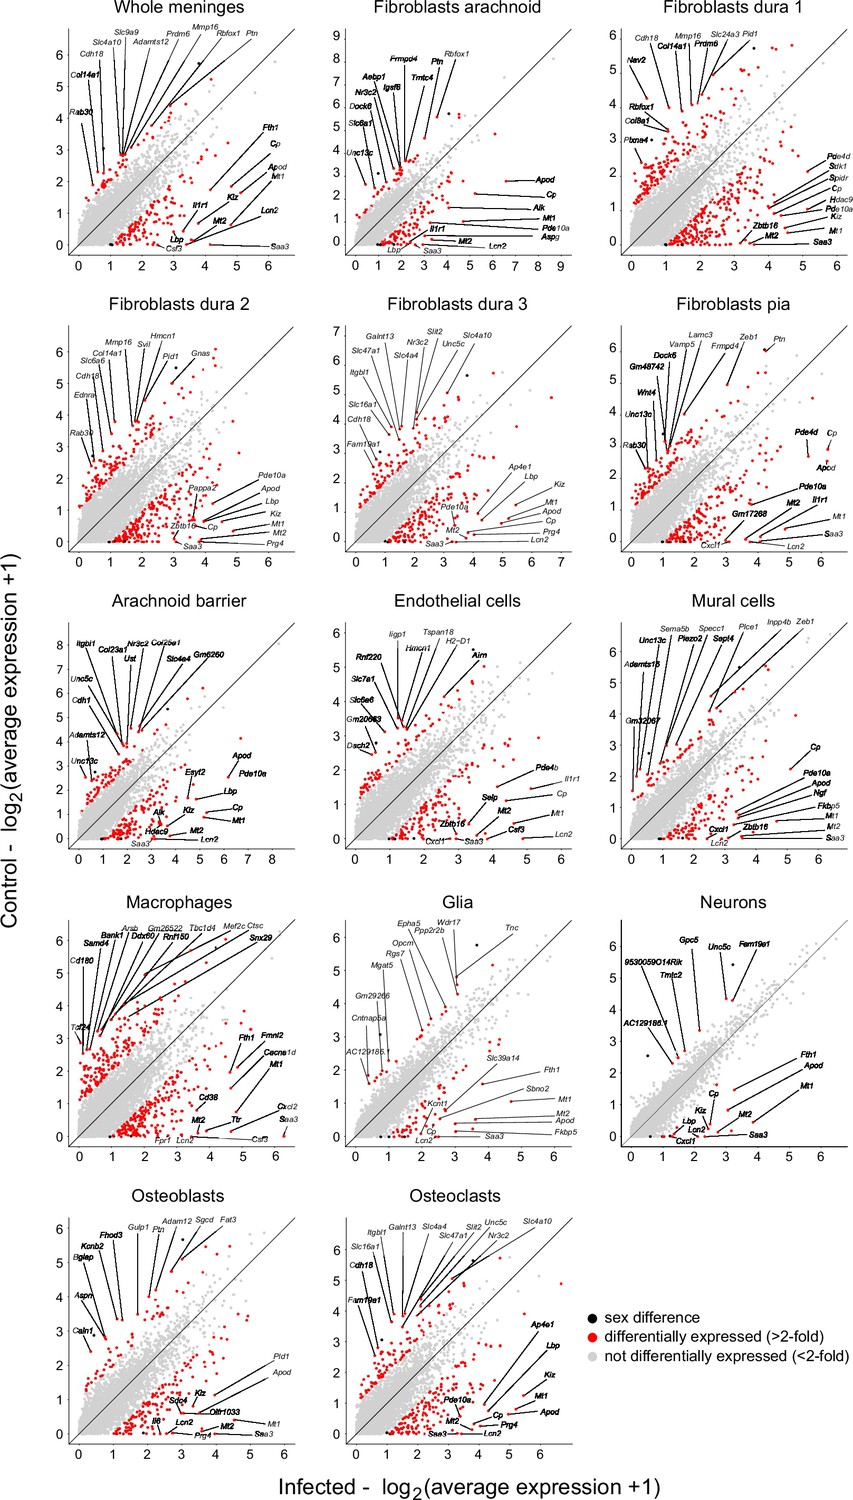
Scatterplots for the major meningeal cell types comparing snRNAseq transcript abundances in control vs. infected mice.
Transcripts with a<2 fold abundance difference are shown as light grey dots; transcripts with a > twofold abundance difference are shown as red dots. Several datapoints with > twofold abundance difference are due to sex differences between control and infected datasets (e.g. Xist); these are shown as unlabeled black dots.
Figure 2—figure supplement 2
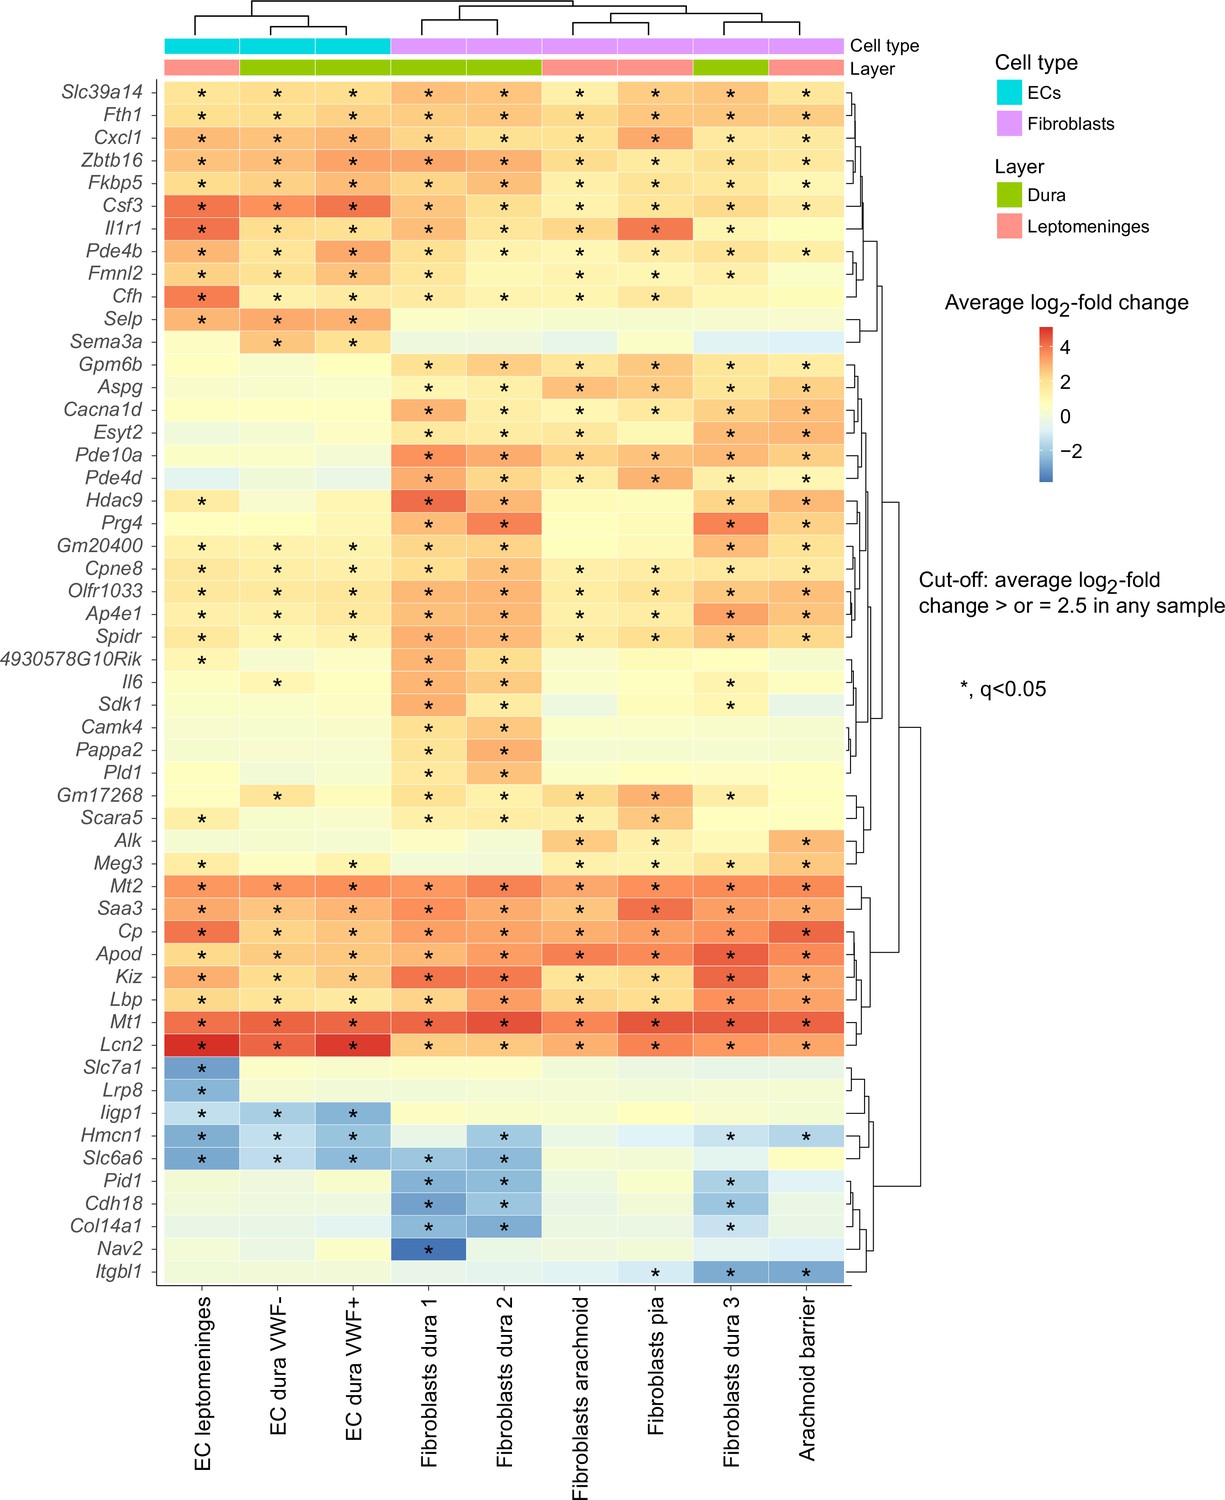
Heatmap of non-immune meningeal cells showing all transcripts with log2-fold change greater than 2.5 in control vs. infection conditions in any one or more of the listed cell types.
Contaminating non-meningeal cells (neurons, glia, osteoblasts, and osteoclasts) have been omitted from this analysis. Asterisk, q value <0.05.
Figure 2—figure supplement 3
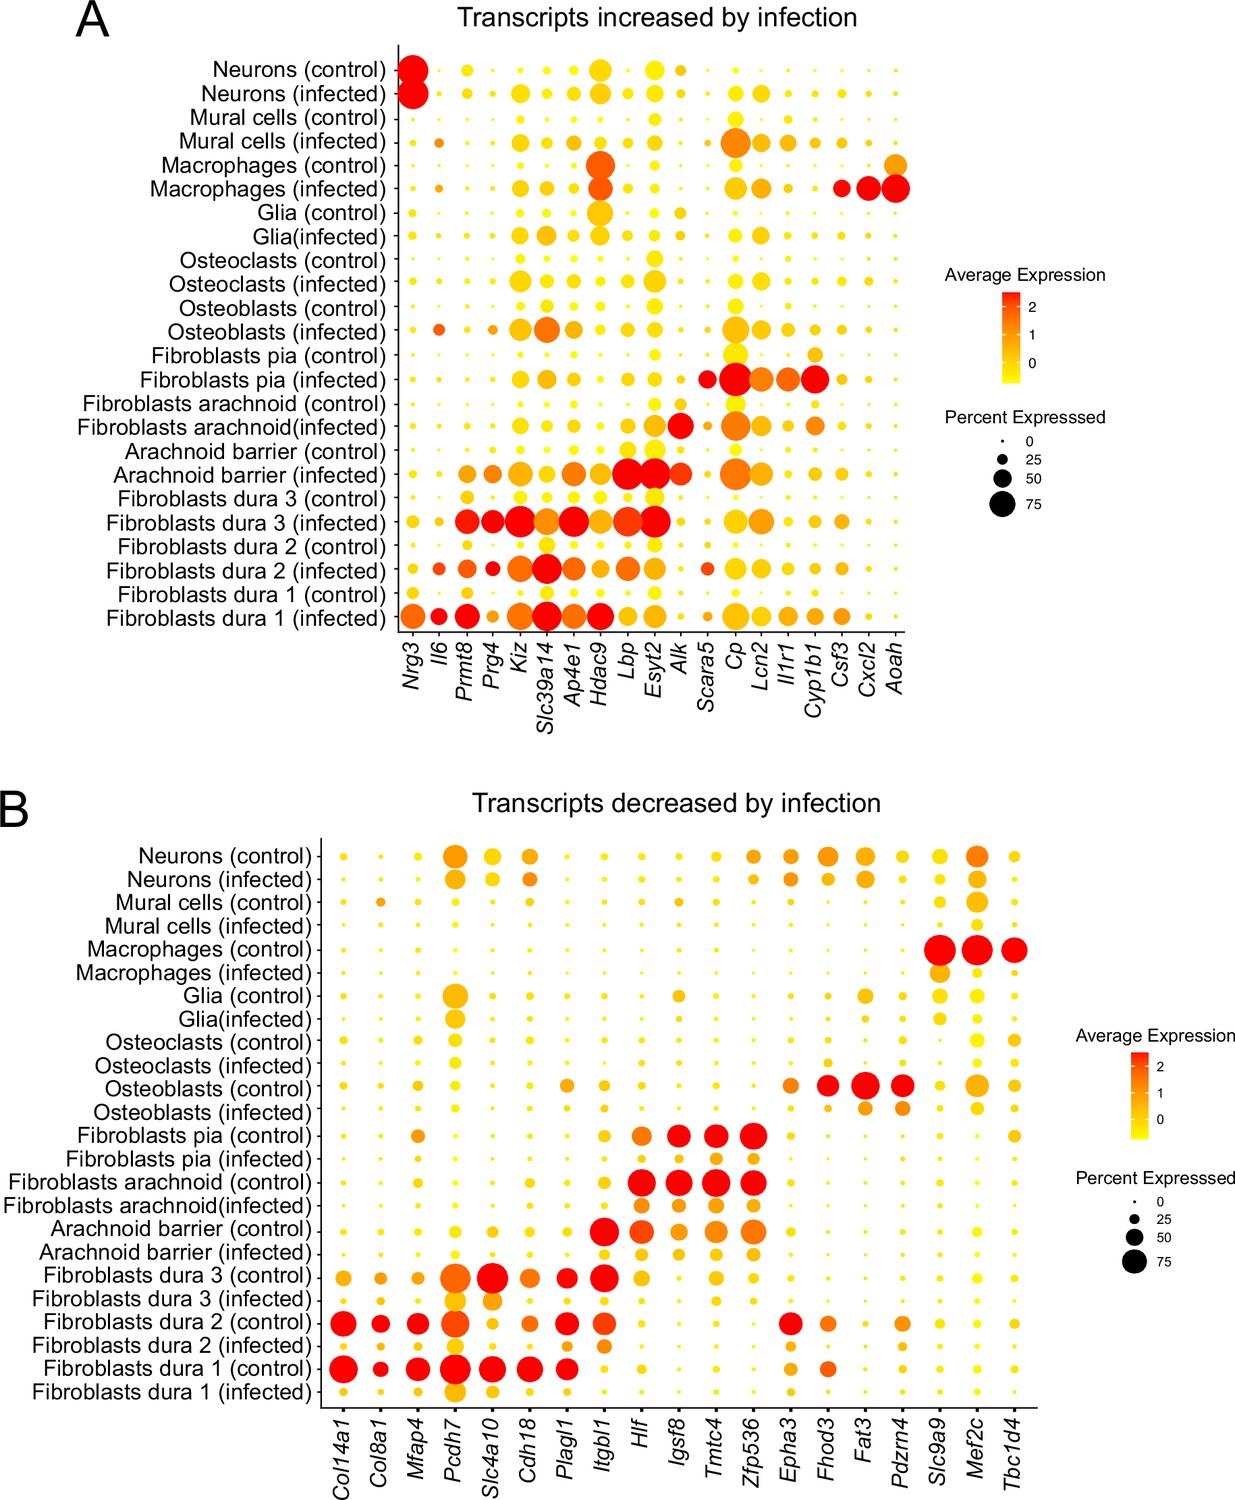
Dot plot showing some of the transcript abundance patterns that distinguish control vs. infected meninges, plotted by cell type.
Upper dot plot, transcripts that increase in abundance with infection. Lower dot plot, transcripts that decrease in abundance with infection. These transcripts were chosen to illustrate the main patterns of cell-type-specific increases or decreases with infection.
Figure 2—figure supplement 4

Gene set enrichment analysis (GSEA) for individual cell types in a comparison of control vs. infected meninges.
Hierarchical clustering is shown for both gene sets and cells types. Red, transcript abundances increased with infection. The figure shows those gene sets with a q value <0.05 for any of the listed meningeal cell types. Blue, transcript abundances decreased with infection. NES, normalized enrichment score. Asterisk, q value <0.05.
Figure 3 with 4 supplements
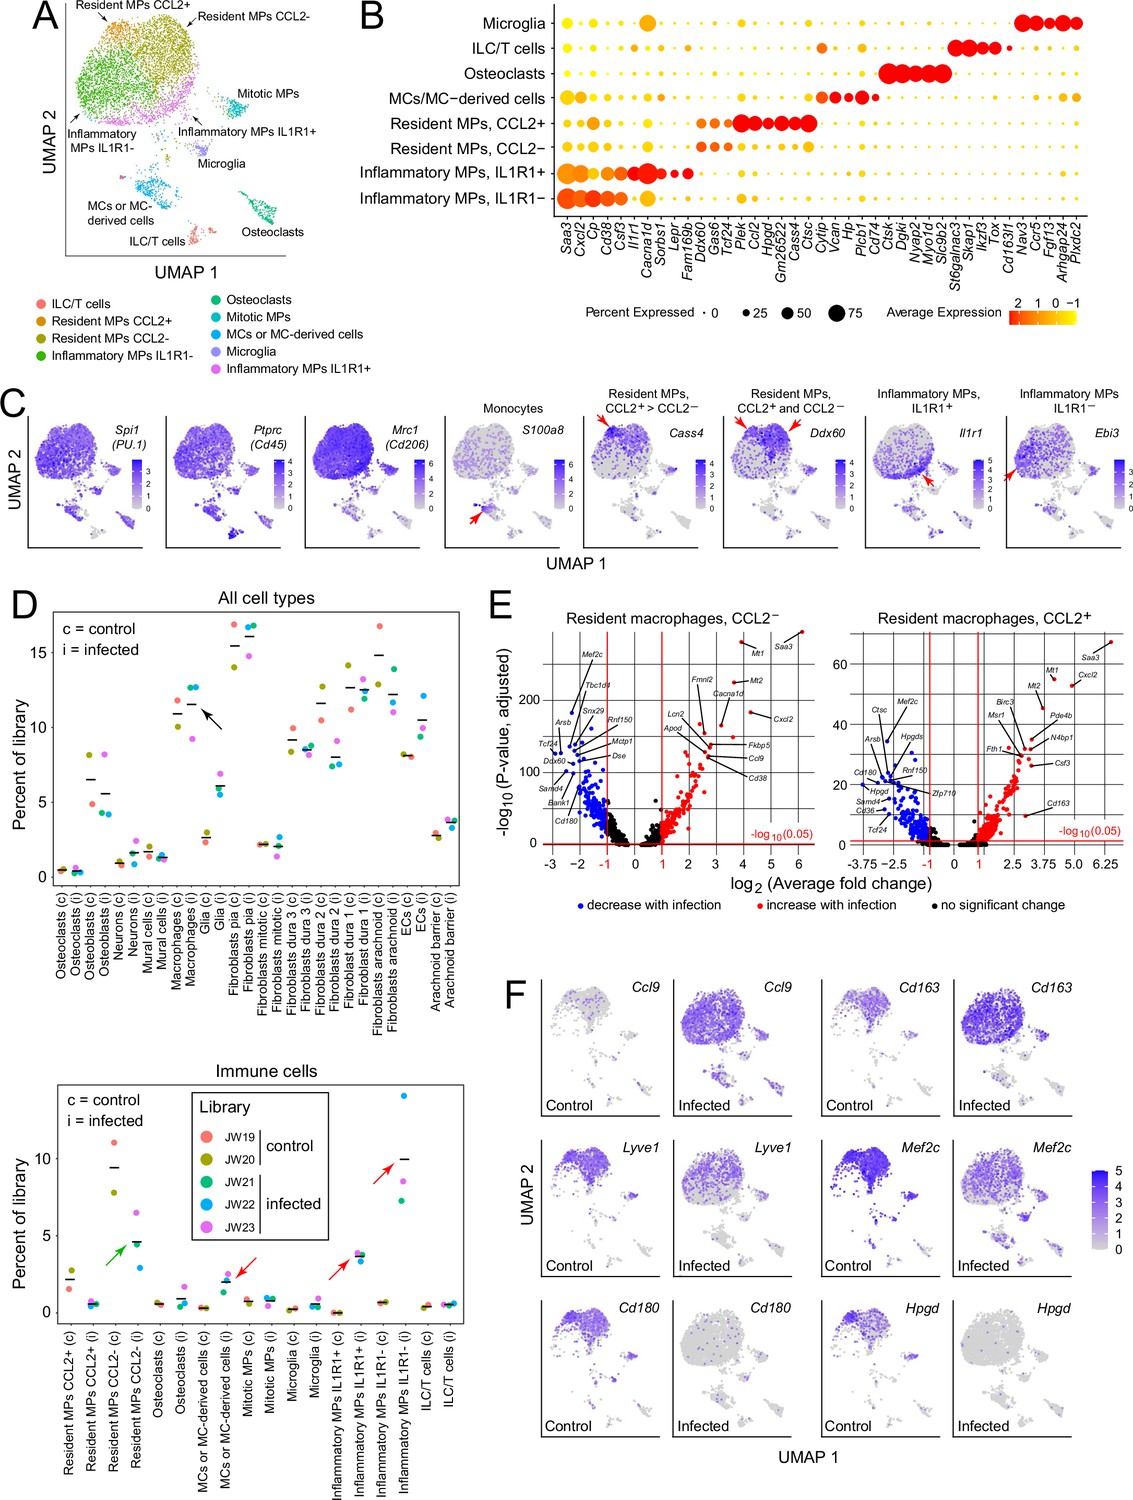
Immune subtypes and their responses to infection.
(A) snRNAseq UMAP plot for immune cells from combined control and infected meninges. (B) Dot plot showing some of the transcript abundances that most clearly distinguish among meningeal immune cells. (C) UMAP plots, as in panel (A) showing eight transcripts that are expressed by all (left three panels) or by distinct subsets (right five panels) of macrophage subtypes and macrophage-like cells. Red arrows highlight regions within the UMAP clusters that correspond to distinct cell types, as defined in panel (A). (D) Comparing the number of nuclei in control (c) vs. infected (i) snRNAseq datasets across all meningeal cell types (upper panel) and across immune cells (bottom panel). The fraction of cells comprising the general category ‘macrophages’ shows no change with infection (black arrow in upper panel). However, the lower panel shows that several macrophage subsets decrease (green arrow) or increase (red arrows) in abundance with infection. (E) Volcano plots for CCL2- and CCL2+ macrophages showing control vs. infected snRNAseq transcript abundances (see Supplementary file 5). (F) UMAP plots, as in (A), comparing control vs. infected snRNAseq for six genes.
Figure 3—figure supplement 1
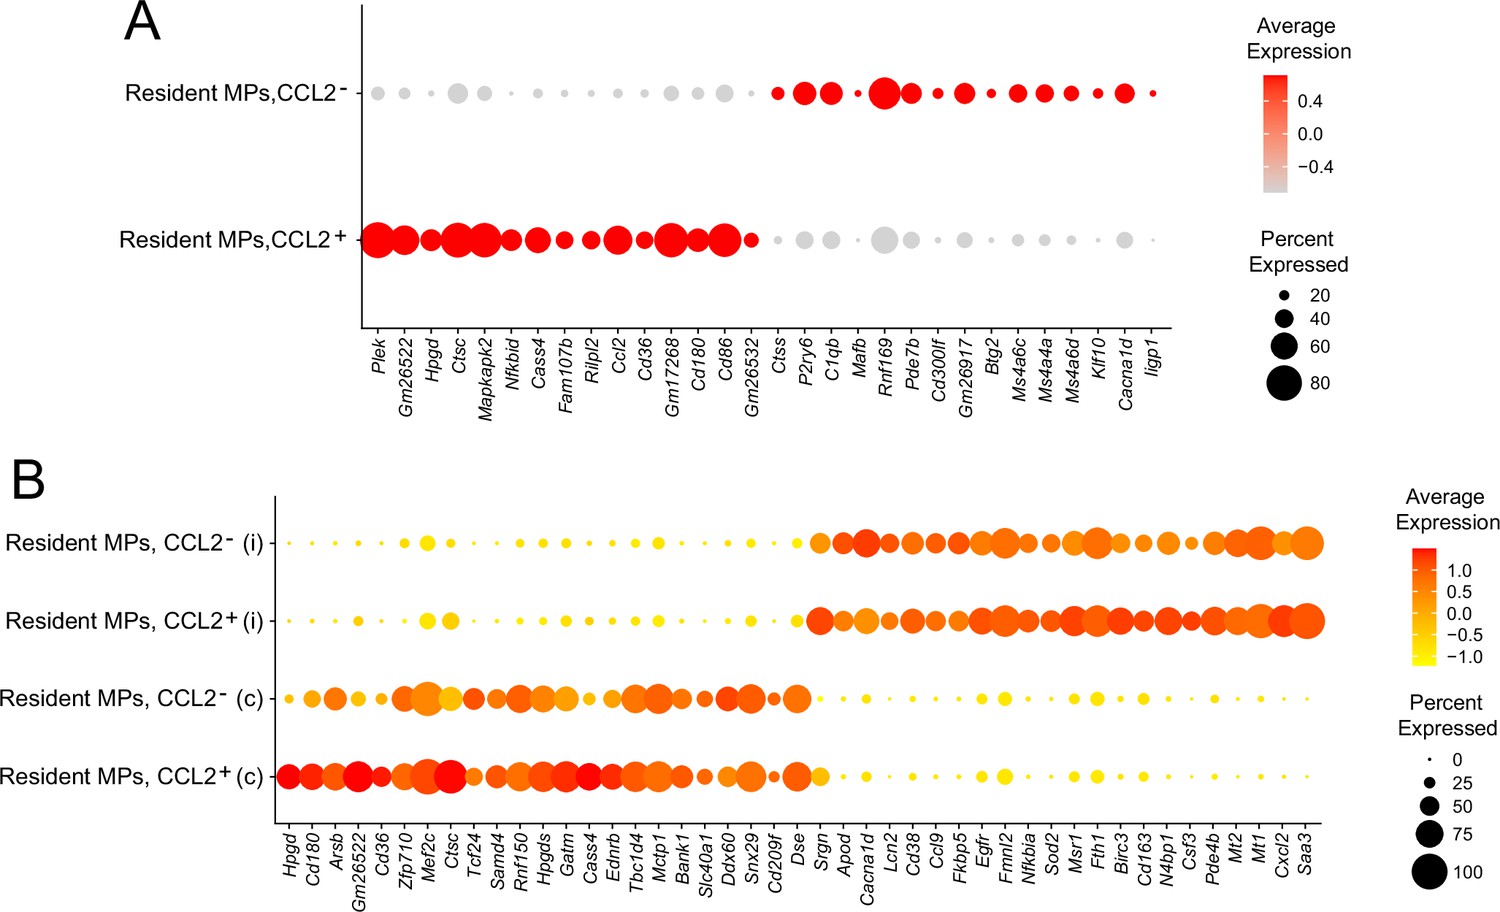
Comparisons between CCL2- and CCL2+ macrophages.
(A) Dot plot showing the 30 transcripts with the greatest differential abundances between CCL2- and CCL2+ macrophages – the 15 that are most enriched in CCL2- macrophages and the 15 that are most enriched in CCL2+ macrophages. (B) Dot plot showing the 45 transcripts with the greatest differential abundances between infected (i) and control (c; i.e., uninfected) CCL2- and CCL2+ macrophages – the 22 that are most enriched in infected CCL2- and CCL2+ macrophages and the 23 that are most enriched in control CCL2- and CCL2+ macrophages.
Figure 3—figure supplement 2
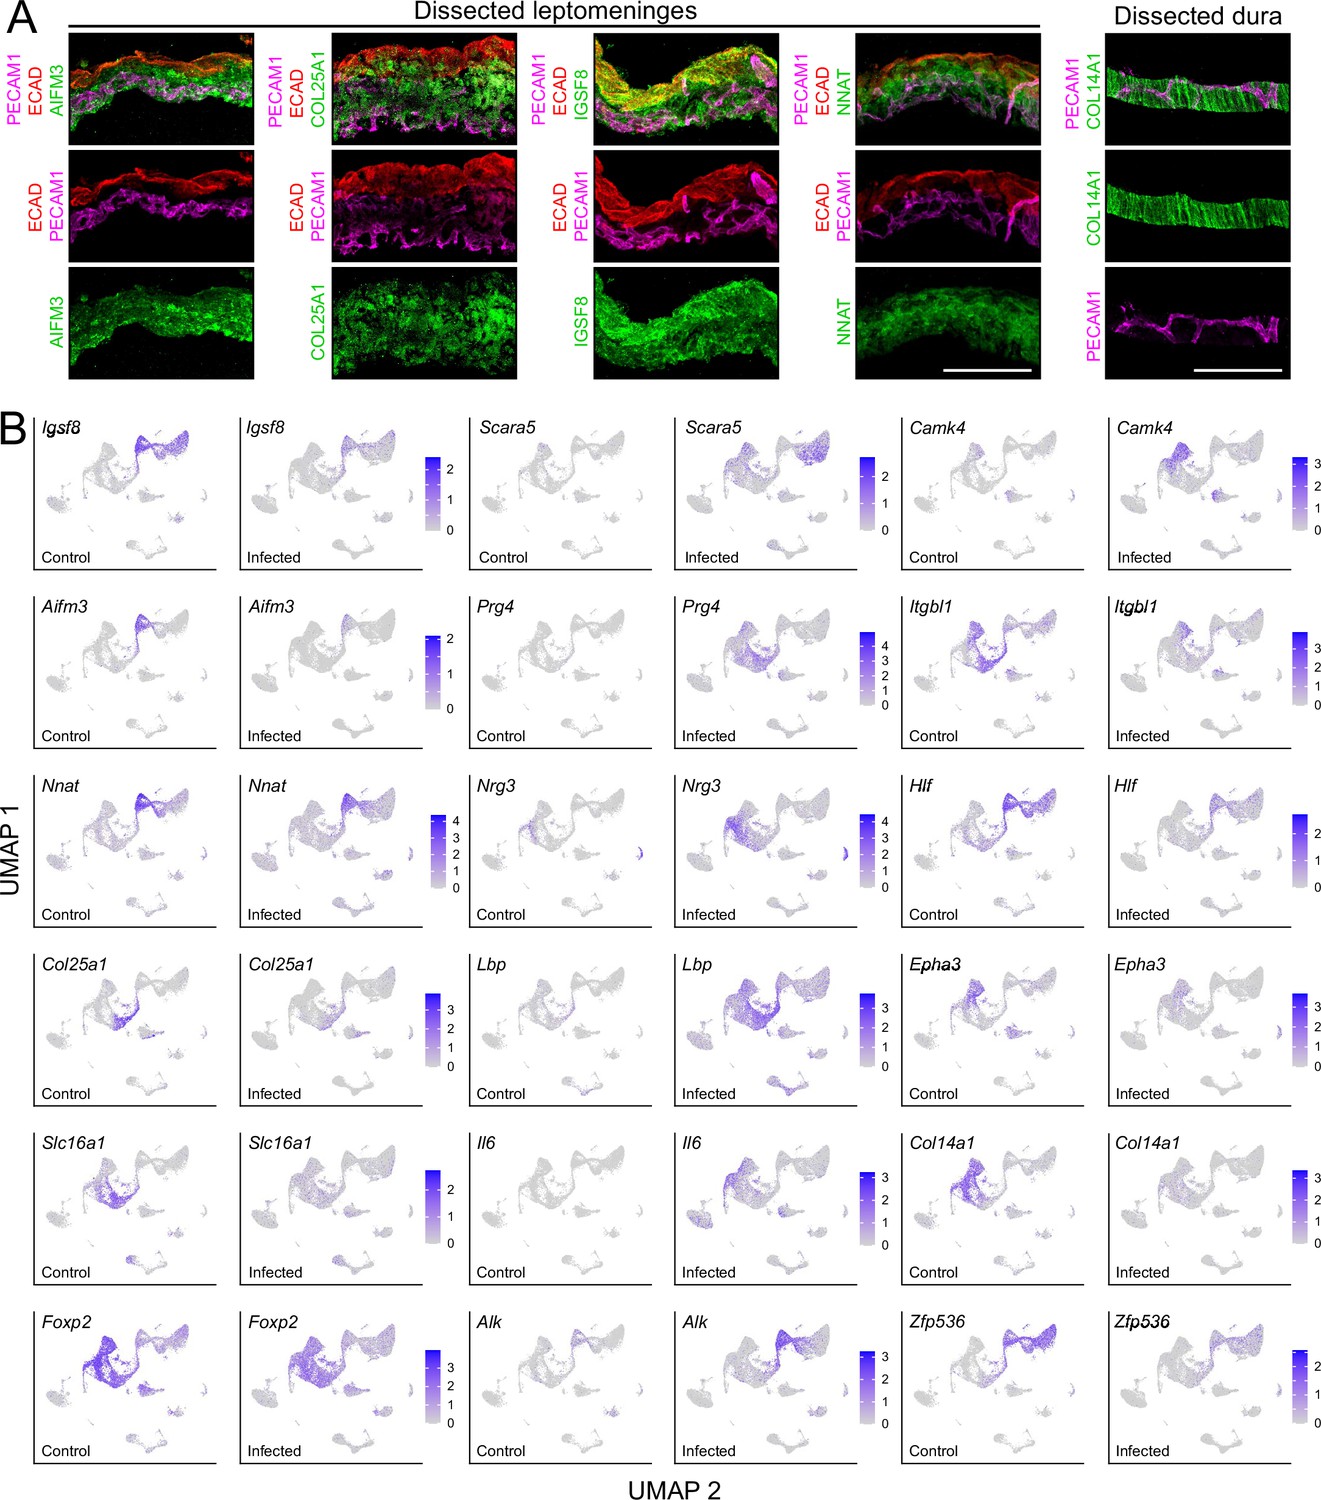
Leptomeningeal and dura fibroblast markers and fibroblast responses to infection.
(A) Cross-sections of dissected leptomeninges immunostained for fibroblast markers AIFM3, COL25A1, IGSF8, and NNAT, and of dissected dura immunostained for fibroblast marker COL14A1. (B) UMAP plots from combined control and infected meninges snRNAseq datasets showing changes in abundance in control vs. infected samples for 18 transcripts. Scale bars: A, 100 µm.
Figure 3—figure supplement 3

Collagen transcripts in individual meningeal cell types from control vs. infected mice.
(A) Dot plot showing abundances for collagen transcripts with detectable expression in the meninges. (B) Fold change in transcript abundances summed over all meninges cell types. Only transcripts with a log2-fold change >0.25 are plotted.
Figure 3—figure supplement 4

SLC transporter transcripts in individual meningeal cell types from control vs. infected mice.
(A) Dot plot showing abundances for SLC transcripts with detectable expression in the meninges. (B) Fold change in transcript abundances summed over all meninges cell types. Only transcripts with a log2-fold change >0.25 are plotted.
Figure 4
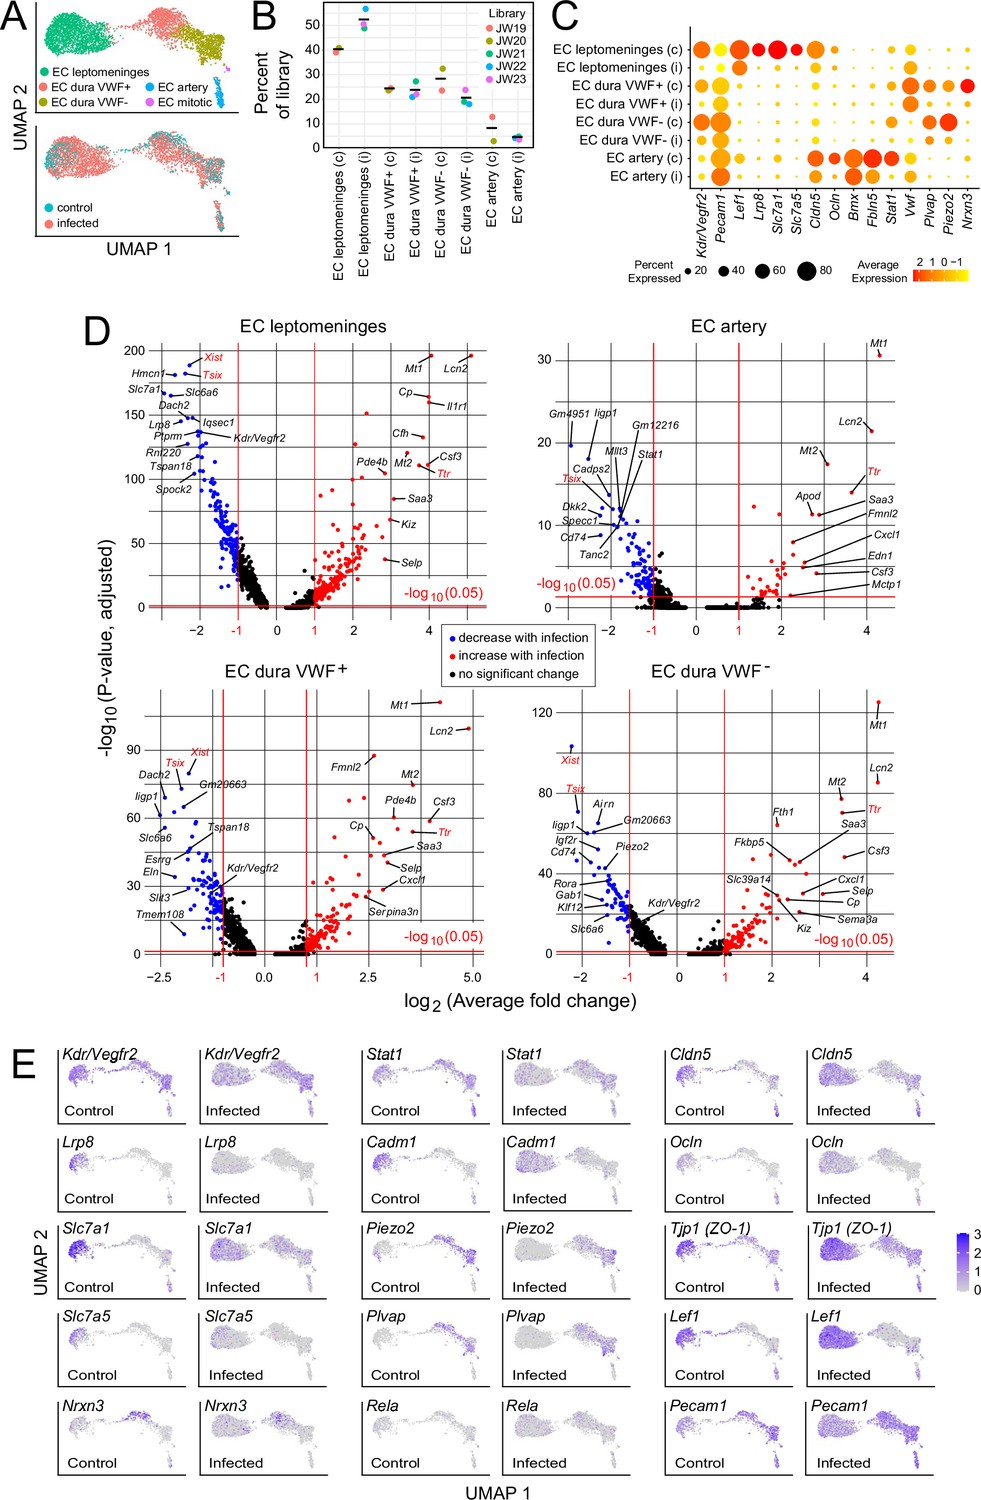
Changes in EC gene expression with infection in the leptomeninges and dura.
(A) snRNAseq UMAP plots for ECs from combined control and infected meninges. (B) The number of nuclei from different EC subtypes is consistent across the five snRNAseq libraries (control: JW19, JW20; infected: JW21-JW23). (C) Dot plot showing changes in transcript abundances in EC subtypes in control (c) vs. infected (i) snRNAseq datasets. (D) Volcano plots for four EC subtypes showing control vs. infected snRNAseq transcript abundances. Xist and Tsix transcripts, referable to sex differences among embryos, are marked in red. Ttr transcripts, also marked in red, likely represent contamination from choroid plexus RNA and are present in 2/3 infected snRNAseq samples (see Supplementary file 6). (E) UMAP plots, as in (A), comparing control vs. infected snRNAseq for 15 genes.
Figure 5
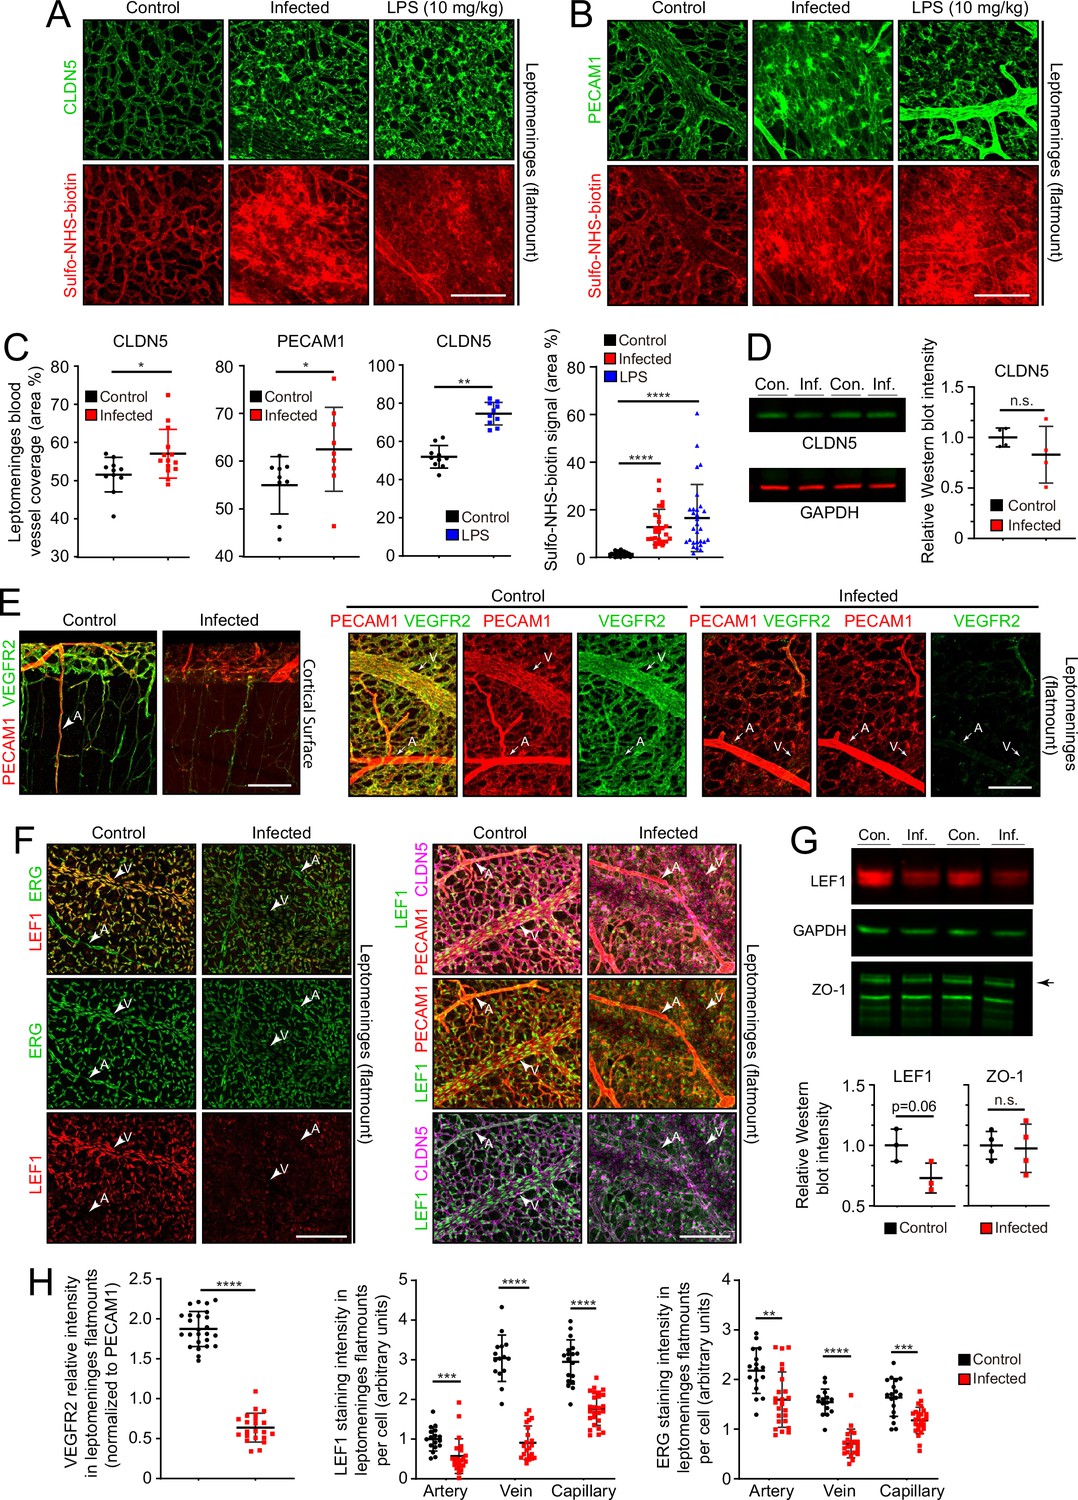
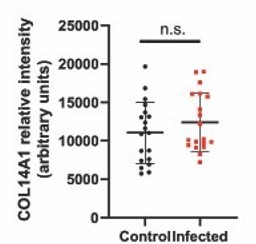
Changes in EC morphology and EC protein abundance and localization with infection.
(A) CLDN5 localization and Sulfo-NHS-biotin leakage in leptomeningeal vasculature following infection or LPS administration. (B) PECAM1 localization and Sulfo-NHS-biotin leakage in leptomeningeal vasculature following infection or LPS administration. (C) Infection or 10 mg/kg LPS treatment increases the area covered by vasculature in flatmounts of leptomeninges. (D) Immunoblotting shows a modest, but not statistically significant, reduction in CLDN5 level relative to GAPDH level in the leptomeninges with infection (n=4 independent experiments). (E) Reduced KDR (VEGFR2) immunstaining in leptomeninges ECs with infection. (F) Reduced EC nuclear LEF1 immunostaining in capillaries and veins, and reduced PECAM1 and CLDN5 staining in veins in the leptomeninges with infection. (G) Immunoblotting shows a modest reduction in LEF1 level and no change in ZO-1 level relative to GAPDH level in the leptomeninges with infection (n=3 independent experiments for LEF1 and n=4 independent experiments for ZO-1). (H) Quantification of images in E and F. For (D) and (G), the statistical signficance was calculated using the student’s t-test because the Wilcoxon rank sum test cannot be used on such small sample sizes. Scale bars: A and B, 100 µm; E and F, 100 µm.
Figure 6
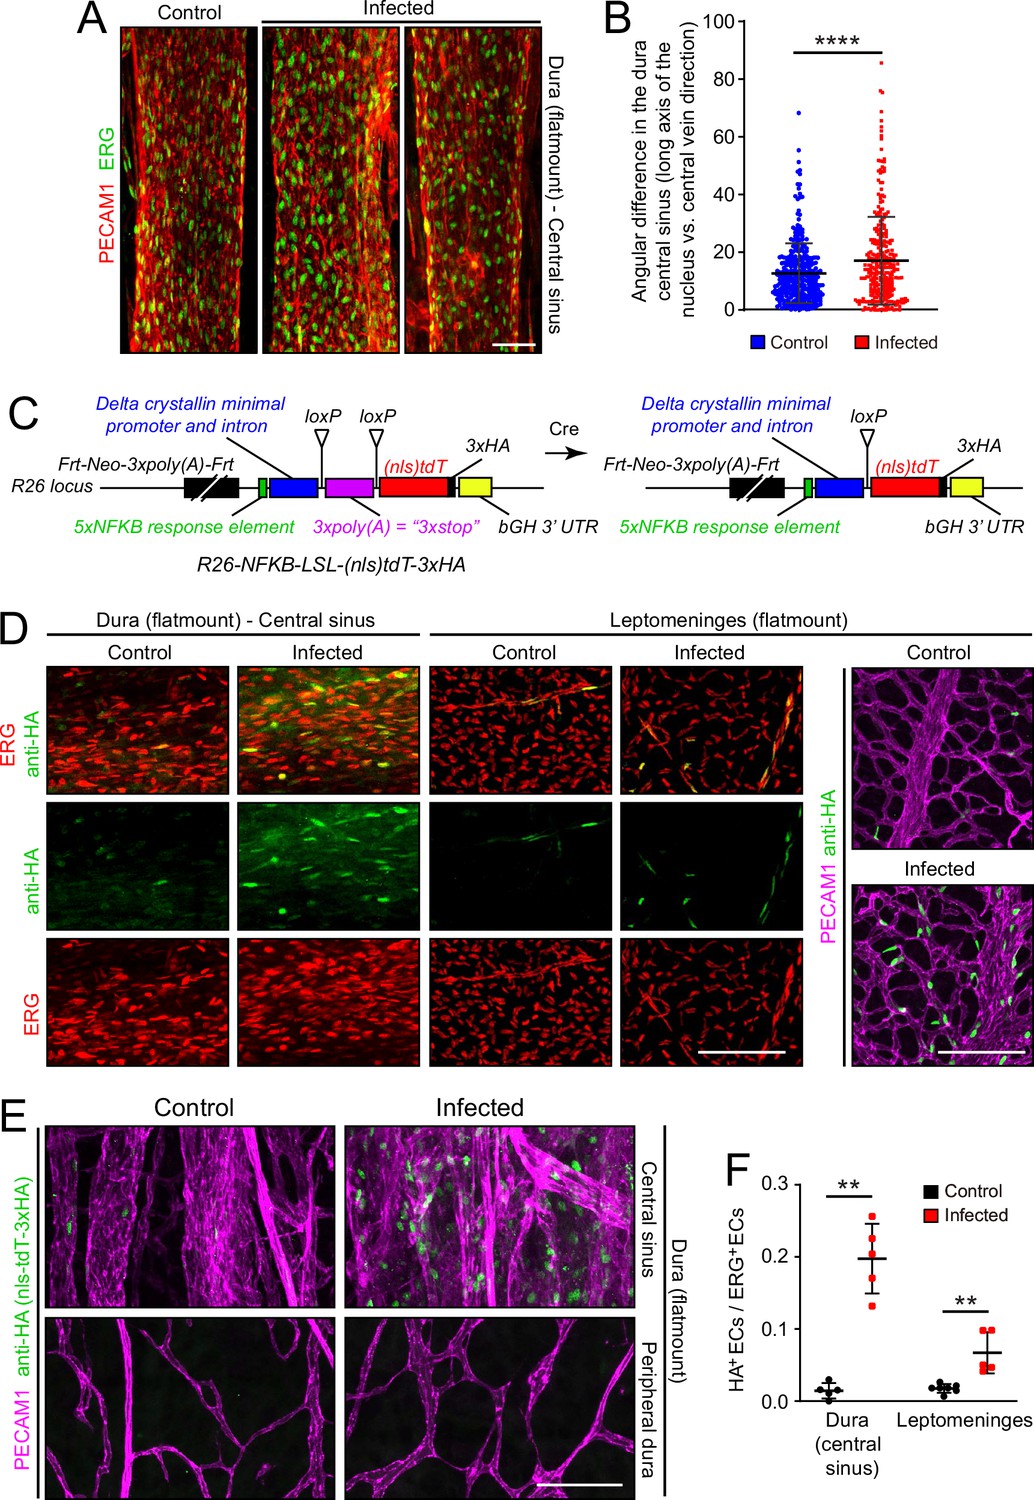
Infection causes disorganization of EC nuclear orientation in the dural venous sinus, and an increase in NF-kappa B signaling in ECs in the leptomeninges and dura.
(A) EC nuclei, visualized with ERG immunostaining, in the large vein of the central sinus. (B) Quantifying the orientation of the long axis of EC nuclei in the large vein of the central sinus, as shown in (A). Each data point represents one nucleus. (C) Structure of the NF-kappa B reporter before (left) and after (right) Cre-mediated recombination that removes a loxP-transcription stop-loxP (LSL) cassette. NF-kappa B reporter activation leads to expression of nls-tdT-3xHA. (D) Infection increases expression of the NF-kappa B reporter in a subset of ECs in the dura and leptomeninges, as determined by immunostaining for HA. (E) In the dura, NF-kappa B reporter activation is observed in both ECs and non-ECs in the central sinus, but the NF-kappa B reporter is not activated in the peripheral dura. (F) Quantification of NF-kappa B reporter activation in ECs in the central sinus of the dura and in the leptomeninges. Scale bars: A, 50 µm; D and E, 100 µm.
Figure 7 with 2 supplements
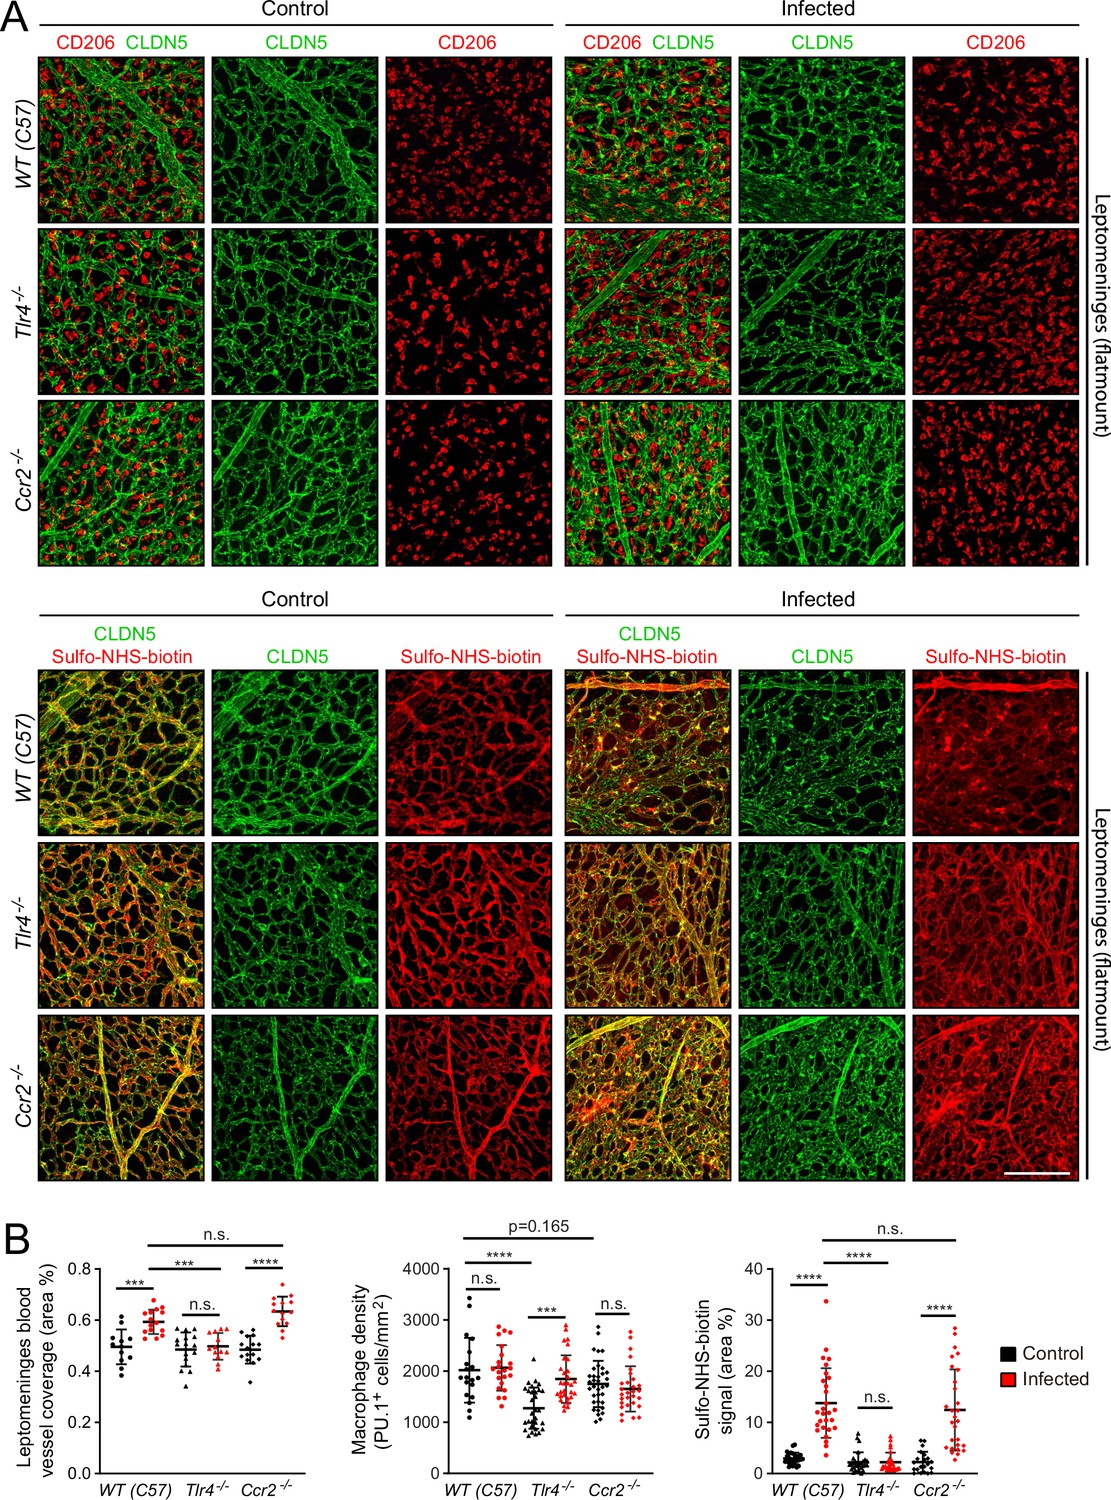
Effects of Tlr4 KO and Ccr2 KO on leptomeningeal EC responses to infection.
(A) Leptomeninges flatmounts of control vs. infected mice showing, in the upper panels, macrophage density (CD206) and vascular architecture (CLDN5) and, in the lower panels, vascular leakage (sulfo-NHS biotin). (B) Quantification of (left) vascular architecture based on CLDN5 immunostaining, (center) macrophage density, and (right) Sulfo-NHS-biotin leakage in WT, Tlr4-/-, and Ccr2-/- leptomeninges flatmounts in control vs. infected mice. Scale bar: A, 100 µm.
Figure 7—figure supplement 1
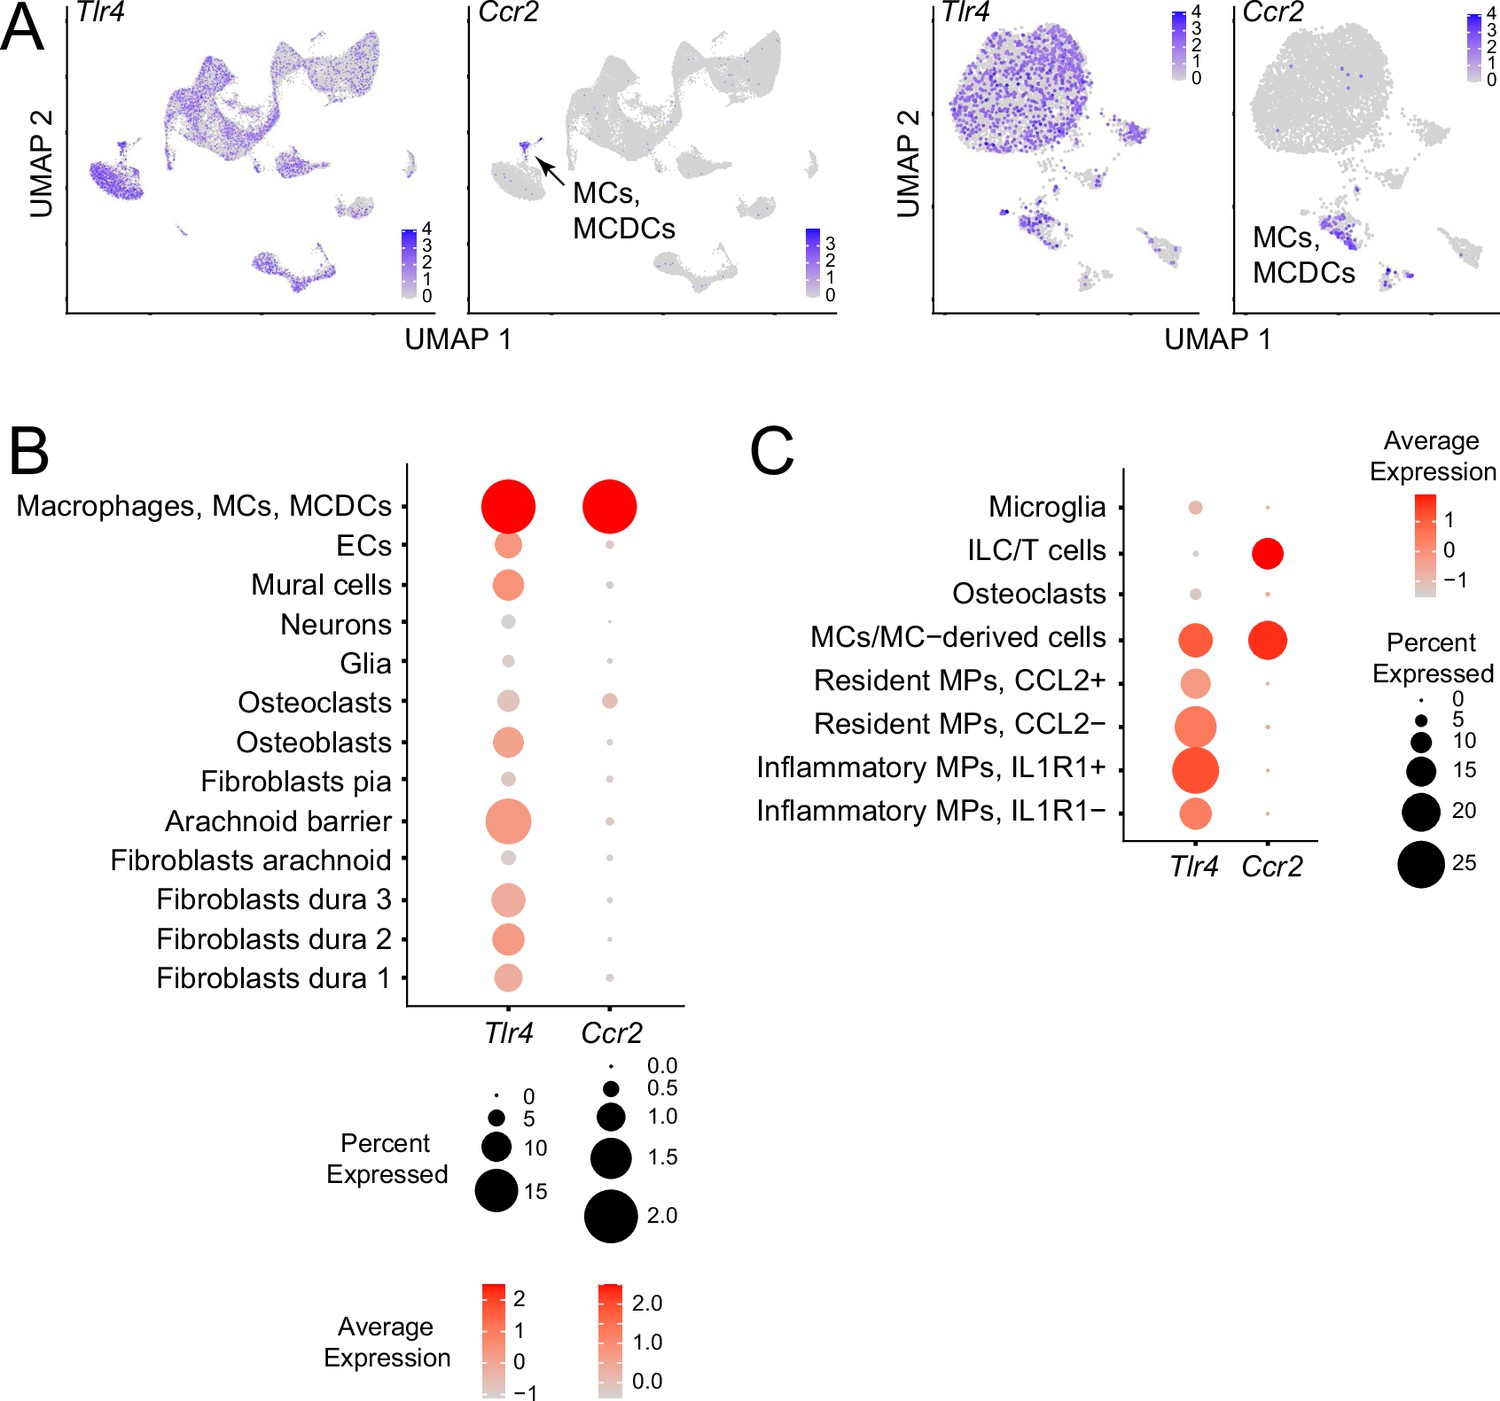
Expression of Tlr4 and Ccr2 in the major meningeal cell classes and in meningeal immune cells.
(A) Tlr4 and Ccr2 UMAP plots for (left) all meningeal cell types and (right) meningeal immune cells, as in Figures 1 and 3. MCs, monocytes; MCDCs, monocyte-derived cells. (B) Dot plot showing Tlr4 and Ccr2 transcript abundances among the major meningeal cell classes, with scales individualized for each gene. (C) Dot plot showing Tlr4 and Ccr2 transcript abundances among meningeal immune cells.
Figure 7—figure supplement 2

Comparison of leptomeningeal macrophage quantification by counting PU.1+vs. CD206 + cells, using as a test case the experiments presented in Figure 7.
The left plot of PU.1+ cells reproduces the plot shown in the center of Figure 7B. The two methods are in good agreement.
Figure 8
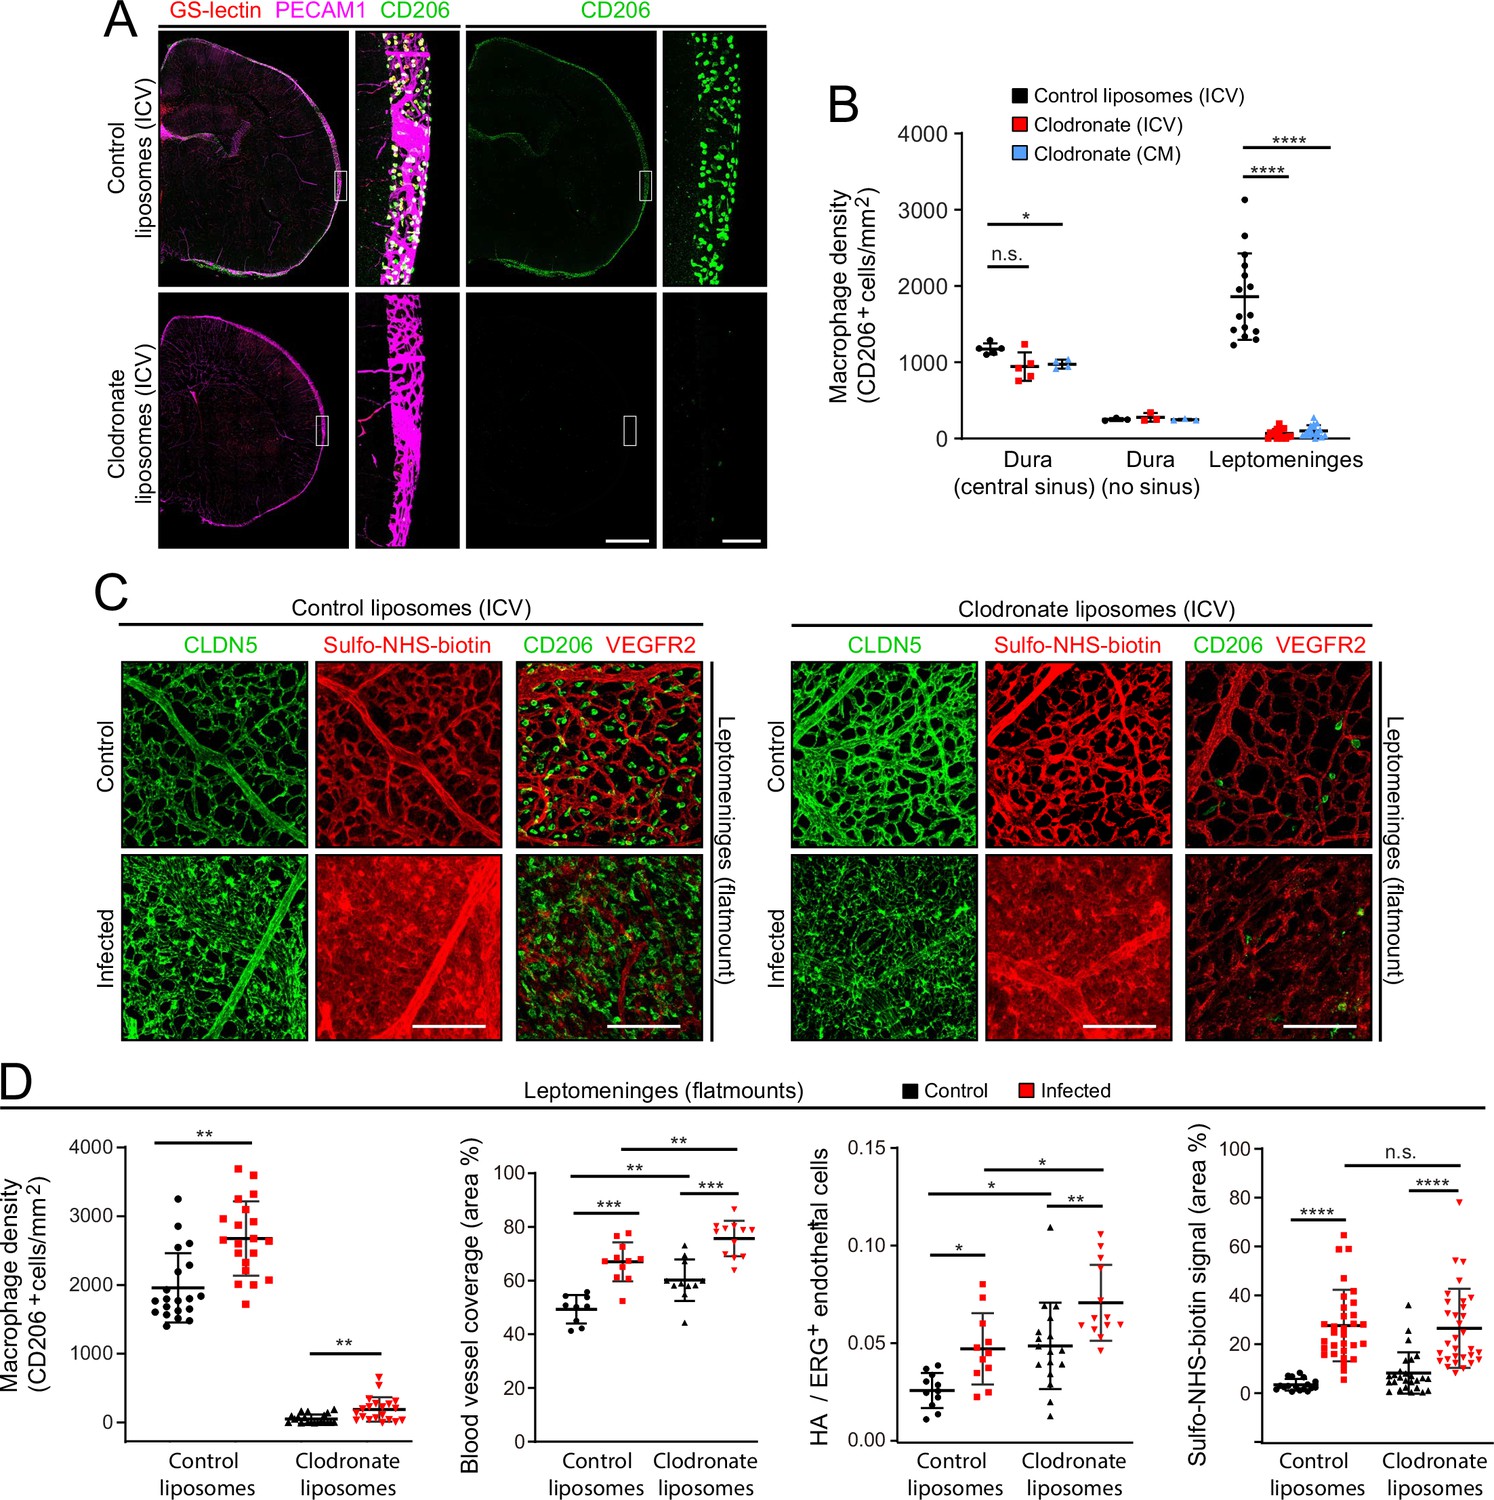
EC response to eliminating leptomeningeal macrophages with liposomal clodronate.
(A) Intracerebroventricular (ICV) injection at P3 of empty liposomes vs. clodronate liposomes shows that clodronate almost completely eliminates leptomeningeal macrophages at P6, as visualized with CD206 immunostaining. (B) Quantification of leptomeningeal and dural macrophage abundance following ICV or cisterna magna (CM) injection of clodronate liposomes vs. control liposomes. (C) Leptomeninges flatmounts show greatly reduced numbers of macrophages in mice with or without infection following P3 treatment with clodronate liposomes, and there is little or no effect of macrophage depletion on CLDN5 relocalization and on Sulfo-NHS-biotin leakage in leptomeningeal ECs in response to infection. (D) Quantification in leptomeninges flatmounts from control vs. infected mice (from left to right): (1) macrophage density (2) vascular density, (3) NF-kappa B reporter activation in ECs (as shown in Figure 6F), and (4) Sulfo-NHS-biotin leakage. Mice received an ICV injection at P3 of empty liposomes or clodronate liposomes. CD206 immunostaining was used for macrophage quantification. Figure 7—figure supplement 2 shows that counting PU.1 or CD206 immunstained cells gives closely similar results in leptomeninges flatmounts. Scale bars: A, 500 µm (low magnification) and 50 µm (inset); B, 100 µm.
Author response image 1
Additional files
-
Supplementary file 1
snRNAseq library statistics.
- https://cdn.elifesciences.org/articles/86130/elife-86130-supp1-v1.doc
-
Supplementary file 2
Criteria for assigning cell type clusters based on snRNAseq transcript profiles.
- https://cdn.elifesciences.org/articles/86130/elife-86130-supp2-v1.docx
-
Supplementary file 3
Differential transcript abundances among the major meningeal cell types in infected vs. control snRNAseq datasets.
FC, fold change.
- https://cdn.elifesciences.org/articles/86130/elife-86130-supp3-v1.xlsx
-
Supplementary file 4
Number of mice in each group in the image quantifications.
- https://cdn.elifesciences.org/articles/86130/elife-86130-supp4-v1.doc
-
Supplementary file 5
Differential transcript abundances among CCL2- and CCL2+ resident macrophages in infected vs. control snRNAseq datasets.
FC, fold change.
- https://cdn.elifesciences.org/articles/86130/elife-86130-supp5-v1.xlsx
-
Supplementary file 6
Differential transcript abundances among EC cell types in infected vs. control snRNAseq datasets.
FC, fold change.
- https://cdn.elifesciences.org/articles/86130/elife-86130-supp6-v1.xlsx
-
MDAR checklist
- https://cdn.elifesciences.org/articles/86130/elife-86130-mdarchecklist1-v1.docx
Download links
A two-part list of links to download the article, or parts of the article, in various formats.
Downloads (link to download the article as PDF)
Open citations (links to open the citations from this article in various online reference manager services)
Cite this article (links to download the citations from this article in formats compatible with various reference manager tools)
Bacterial meningitis in the early postnatal mouse studied at single-cell resolution
eLife 12:e86130.
https://doi.org/10.7554/eLife.86130


