The neuronal calcium sensor NCS-1 regulates the phosphorylation state and activity of the Gα chaperone and GEF Ric-8A
- Department of Crystallography and Structural Biology, Institute of Physical-Chemistry 'Blas Cabrera', CSIC, Spain
- Center for Biomolecular Structure and Dynamics, and Division of Biological Sciences, University of Montana, United States
- Institute for Biocomputation and Physics of Complex Systems (BIFI) and Laboratorio de Microscopías Avanzadas (LMA), University of Zaragoza, Spain
- Department of Neurobiology, Instituto Ramón y Cajal de Investigación Sanitaria, Hospital Universitario Ramón y Cajal, Spain
- AFFINImeter Scientific & Development team, Software 4 Science Developments, Spain
- Departamento de Física Aplicada, Universidad de Santiago de Compostela, Spain
- Department of Biological Physical-Chemisty, Institute of Physical-Chemistry 'Blas Cabrera', CSIC, Spain
- Ciber of Respiratory Diseases, ISCIII, Spain
- Department of Systems Biology, Universidad de Alcala, Spain
Figures
Figure 1 with 1 supplement
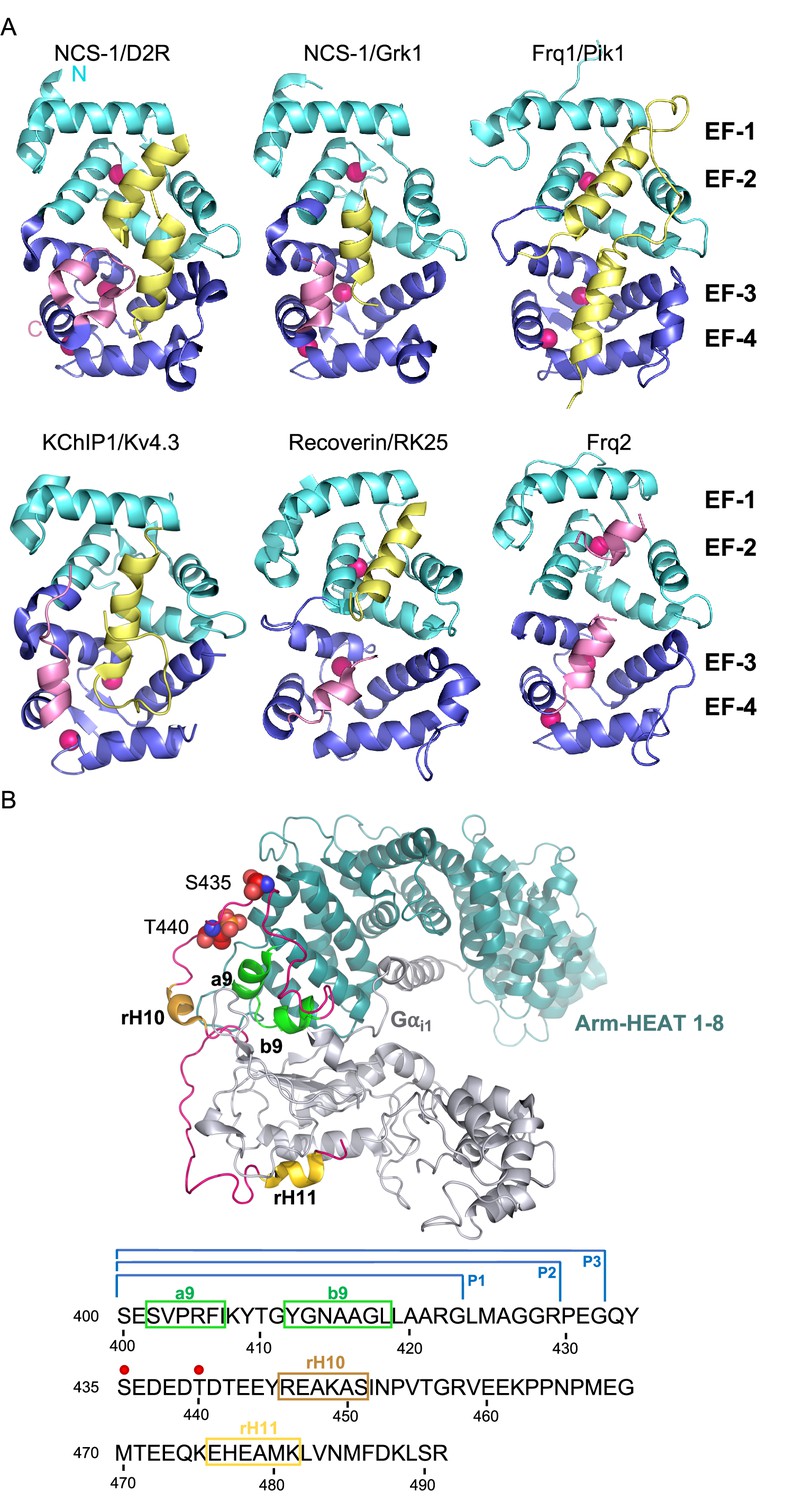
The structure of NCS/target complexes.
(A) Ribbon representation of NCS protein structures bound to their targets. NCS-1/D2R (PDB: 5AER, Pandalaneni et al., 2015), NCS-1/Grk1 (PDB: 5AFP, Pandalaneni et al., 2015), Frq1/Pik1 (PDB: 2JU0, Strahl et al., 2007), KChIP1/Kv4.3 (PDB: 2I2R, Pioletti et al., 2006), Recoverin/RK25 (PDB: 2I94, Ames et al., 2006), Frq2 (PDB: 4BY4, Romero-Pozuelo et al., 2014). The N and C-terminal pairs of EF-hands (EF-1–2 and EF-3–4) are shown in cyan and purple respectively. The C-terminal helix H10 is shown in pink and target proteins in yellow. Ca2+ is shown as hot pink spheres. (B) Top: Cryo-EM structure of the rRic-8A/Gαi1 complex (PDB: 6UKT, McClelland et al., 2020). Gαi1 is depicted in silver. Ric-8A ARM-HEAT repeats 1–8 in blue and repeat 9 in green and helices H10 (rH10) and H11 (rH11) in orange and gold respectively. The C-terminal coiled regions are shown in magenta. Phosphorylated residues S435 and T440 are depicted as spheres. Bottom: rRic-8A sequence from residue 400 to the end. Helices are squared following the same color code used above. Phosphorylation sites are indicated as red spheres. P1, P2, and P3 brackets indicate the boundaries of the synthesized Ric-8A peptides.
Figure 1—figure supplement 1

Structural comparison of hNCS-1/Ric-8A-P with other NCS-1 complexes.
(A, B) Superposition of NCS-1/Ric-8A-P (only Ric-8A is shown in pink ribbons) with other NCS-1 structures in complex with regulatory ligands, the protein-protein interaction (PPI) inhibitor FD-44 (Mansilla et al., 2017) and the PPI stabilizer 3b (Canal-Martín et al., 2019). The molecular surface of NCS-1 is represented except the helix H10 (ribbon). FD-44 and 3b compounds are represented in stick mode and yellow arrows indicate their position. (C) Superposition of the structure of hNCS-1 (light purple) bound to Ric-8A-P (pink) with that of hNCS-1 (light blue; helix H10 in dark blue) bound to 3b regulator (cyan sticks). Yellow arrows indicate the NCS-1 regions that rearrange to accommodate Ric-8A. (D) Superposition of the hNCS-1/Ric-8A-P (light purple/pink) complex with that of the KChIP1/Kv4.3 (orange/green) complex (PDB: 2I2R (52)). N- and C-terminal end of the different polypeptide chains are indicated following the same color code.
Figure 2
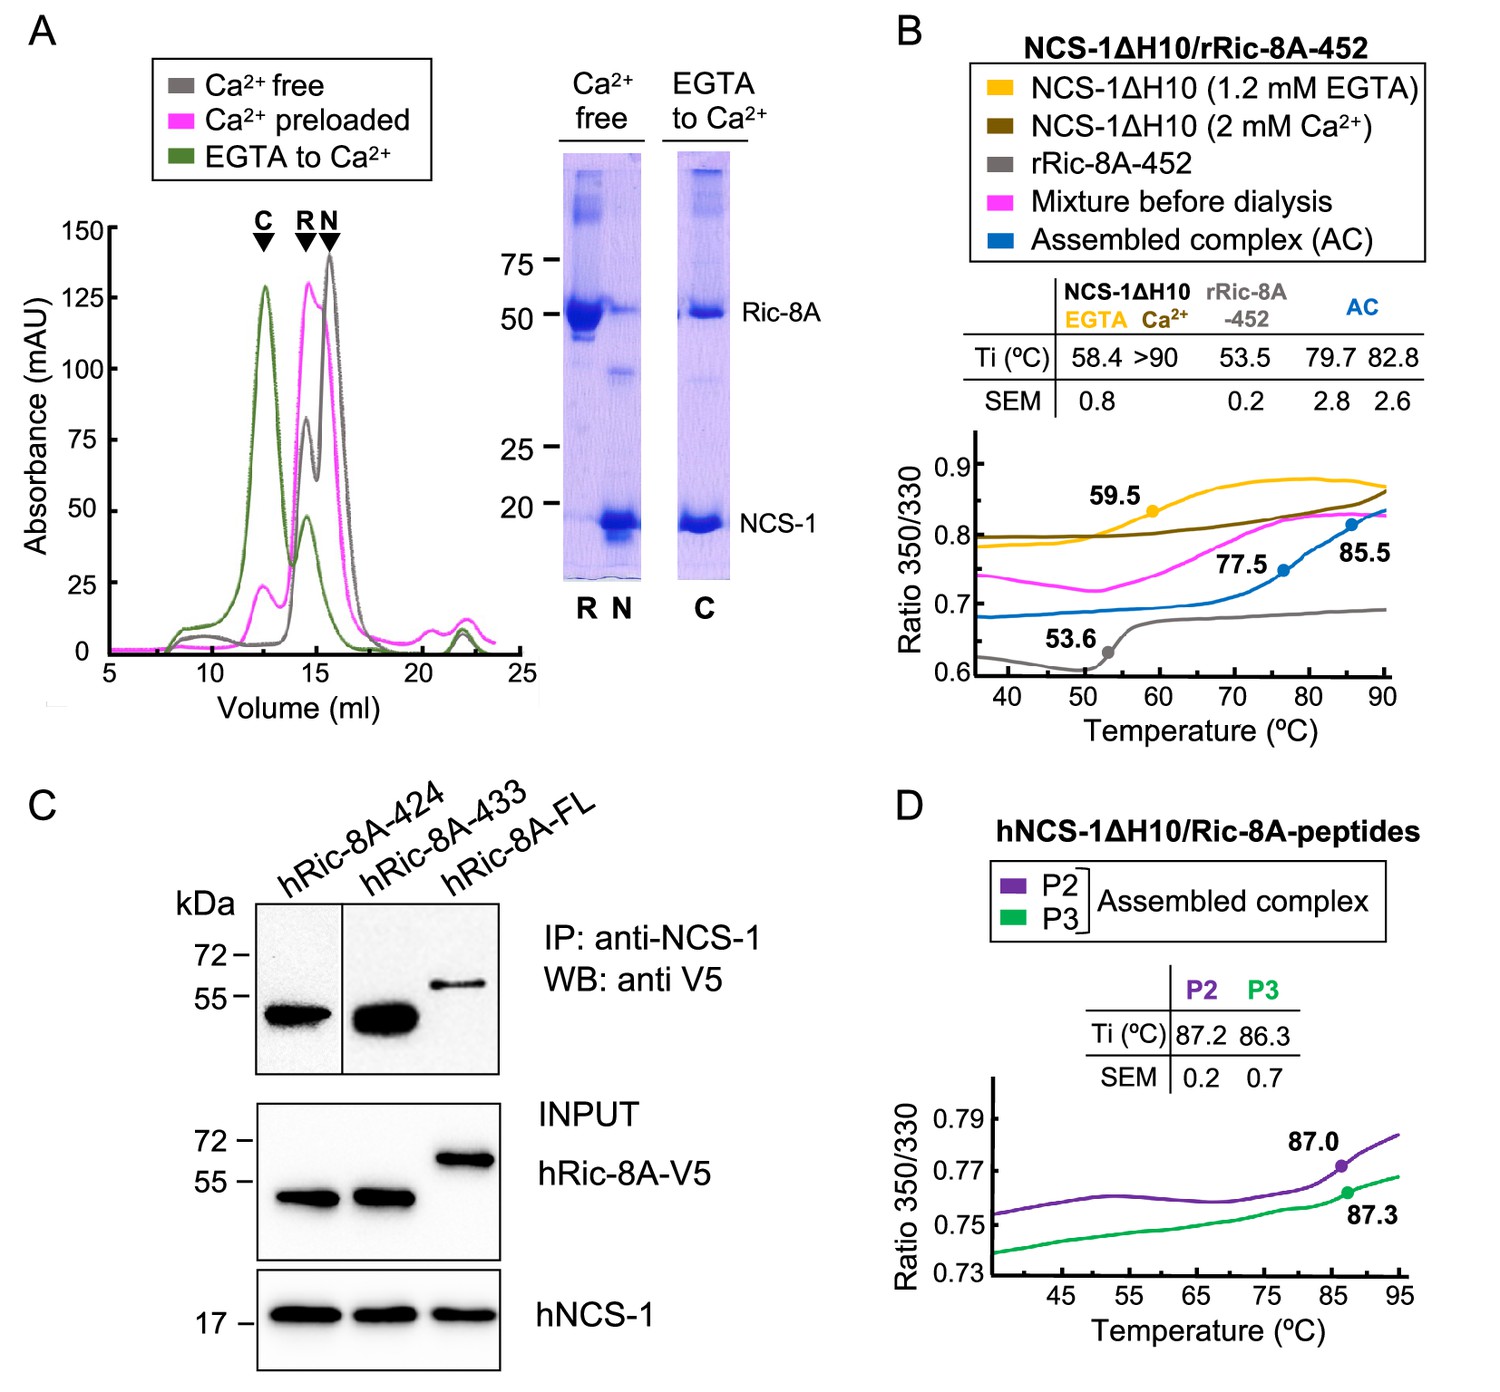
The assembly of rat and human NCS-1/Ric-8A complexes.
(A) Ca2+ dependency of the interaction of the rat complex. Size exclusion chromatograms after assemblies: (i) in Ca2+-free conditions (gray), (ii) with Ca2+-preloaded NCS-1ΔH10 (magenta), and (iii) with a dialysis from EGTA to Ca2+ (green). 12% SDS-PAGE gels analyzing elution of NCS-1ΔH10 (N) and rRic-8A-452 (R) after Assembly (i) and the NCS-1/rRic-8A-452 complex (C) after Assembly (iii). (B) Representative nano-differential scanning fluorimetry (nano-DSF) curves of the different samples during Assembly (iii). The ratio between the emission fluorescence at 350 nm and 330 nm vs the temperature is shown and dots indicate the inflexion temperature (Ti). Curves corresponding to the EGTA-purified NCS-1 (NCS-1 2 mM EGTA), the fully Ca2+ saturated protein (NCS-1 2 mM Ca2+) and rRic-8A-452 are shown as references in yellow, brown, and gray, respectively. The mixture of proteins before dialysis (0.6 mM EGTA) and afterward (assembled complex, 2 mM CaCl2) are shown in magenta and blue, respectively. NCS-1 refers to NCS-1ΔH10, while Ric-8A to Ric-8A-452 construct. Three independent measurements were acquired and the inset table summarizes the mean Ti and standard error of the mean (SEM) values of each sample. (C) Co-IP protein-protein interaction assay in HEK293 cells of full-length human NCS-1 and V5-tagged hRic-8A constructs: full-length (hRic-8A-FL) and C-terminally truncated hRic-8A-424 (residues 1–424) and hRic-8A-433 (residues 1–433). (D) Representative nano-DSF curves of hNCS-1 bound to different Ric-8A peptides. NCS-1 refers to NCS-1ΔH10, P2 and P3 refer to Ric-8A peptides P2 (purple) and P3 (green). Three independent measurements were acquired and the inset table shows the mean Ti and SEM values of each sample.
-
Figure 2—source data 1
Original gels, WBs and SEC and nano-DSF raw data.
- https://cdn.elifesciences.org/articles/86151/elife-86151-fig2-data1-v2.zip
Figure 3 with 2 supplements
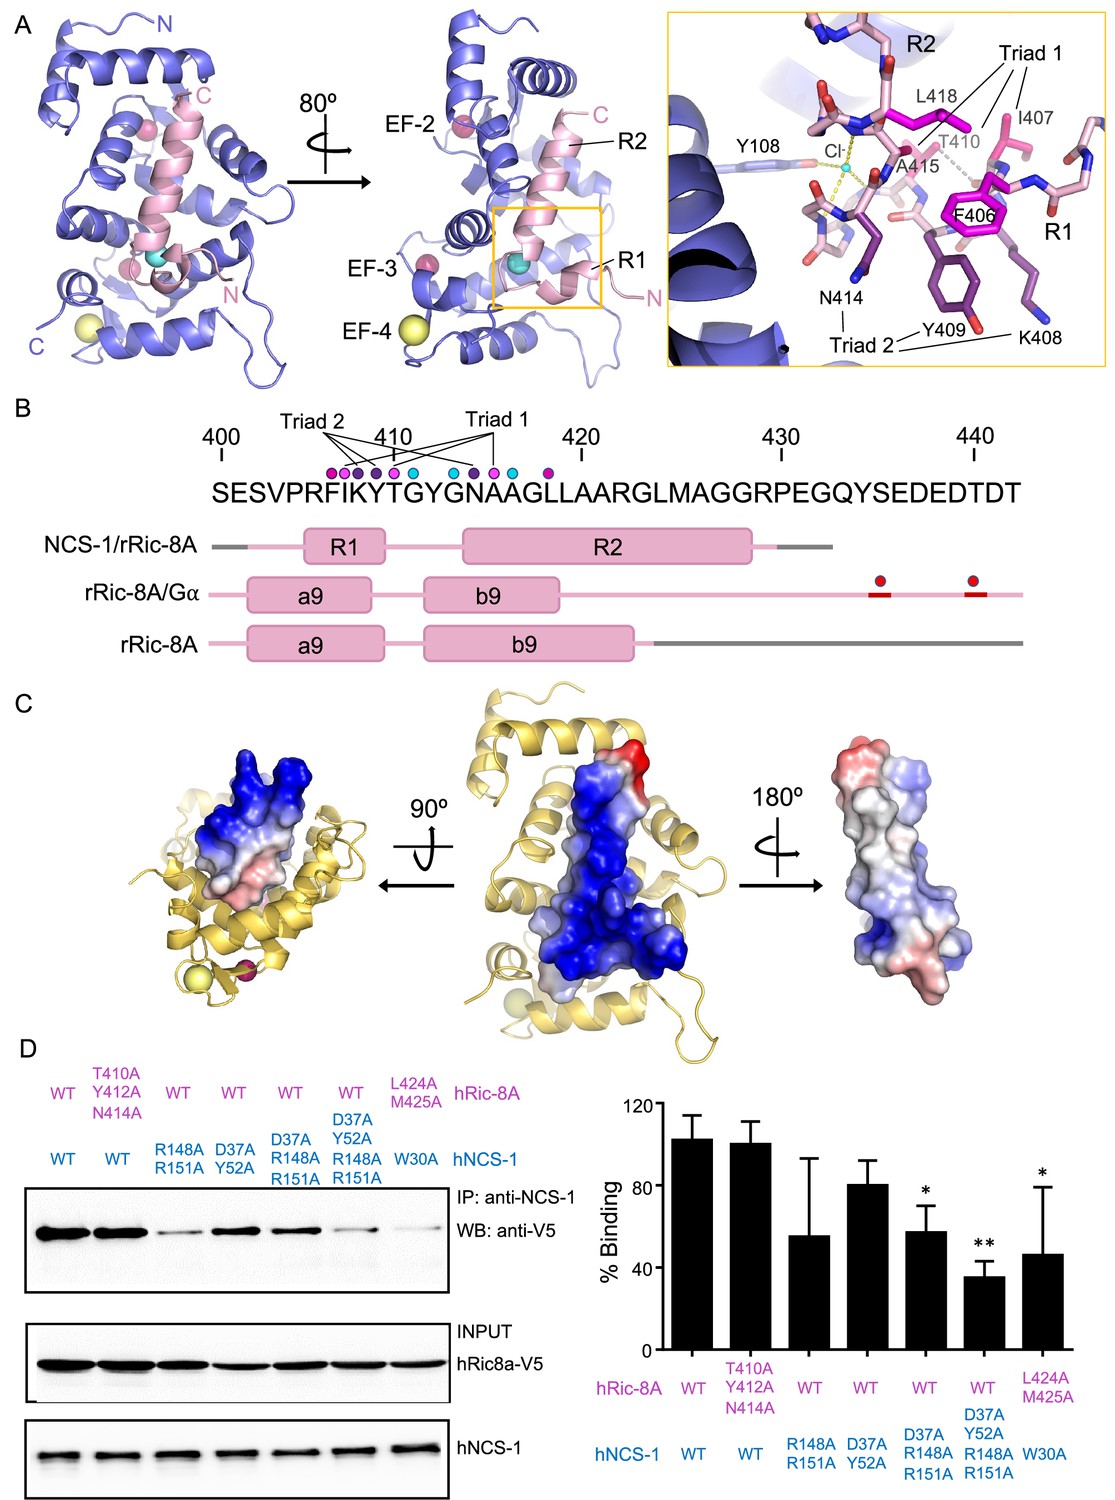
The structure of hNCS-1 bound to a Ric-8A peptide.
(A) Ribbon representation of the hNCS-1ΔH10/Ric-8A-P3 complex. Two views are displayed. The NCS-1 structure is shown in light purple, while Ric-8A-P3 is shown in light pink. The N- and C-termini are indicated. Ca2+, Na+, and Cl- ions are shown in hot pink, yellow, and cyan, respectively. R1 and R2 helices, and EF-hands 2, 3, and 4 are indicated. The orange square represents a zoomed view of the R1-R2 loop in stick mode, Cl- coordination and H-bonds are displayed as yellow and gray dashes, respectively. Residues participating in R1-R2 contacts are displayed in hot pink (triad 1: I407-T410-A415), magenta (F406-L418), and purple (triad 2: K408-Y409-N414). (B) rRic-8A sequence from 400 to 442 residues. The helix boundaries of Ric-8A sequence encompassing a9 and b9 in different structural contexts (NCS-1/Ric-8A-peptide [PDB: 8AHY], Ric-8A/Gα [PDB: 6UKT, McClelland et al., 2020] and uncomplexed Ric-8A [PDB: 6NMG, Zeng et al., 2019]) are indicated as pink boxes and labeled. Coiled regions are shown in pink. Disordered regions are shown in gray, while phosphorylated sites are shown as red spheres. The interacting residues shown in panel (A) are indicated with dots in the same color code as in A. (C) Electrostatic surface potential of rRic-8A-P3. NCS-1 is shown as yellow ribbons. Positive and negative potentials are represented in blue and red, respectively. On the right, the Ric-8A region that faces and contacts NCS-1 is shown with NCS-1 removed for proper visualization. (D) Representative co-immunoprecipitation assay in HEK293 cells transfected with full-length hNCS-1 and V5-tagged hRic-8A mutants. Mutations on NCS-1 and Ric-8A are indicated in blue and pink, respectively. The numbering of the rat Ric-8A sequence has been maintained for proper comparison with A and B. Quantifications of each lane from three independent experiments (mean ± SD) are shown on the right. Mean differences were analyzed by two-tailed, paired Student’s t-test, comparing with wild-type NCS-1 and Ric-8A. **p=0.01; *p=0.05.
-
Figure 3—source data 1
Original WBs.
- https://cdn.elifesciences.org/articles/86151/elife-86151-fig3-data1-v2.zip
Figure 3—figure supplement 1

Structure resolution of hRic-8A peptides bound to NCS-1.
(A) Structure 1 showing the 2Fo-Fc electron density map (green) of Ric-8A-P2 (stick mode, pink). The molecular surface of NCS-1 is depicted. Squares represent magnifications of R1 and R2 regions. (B) Left: Superimposition of Structures 1 and 2. NCS-1 and Ric-8A peptide threads in blue and in pink tones, respectively. The gray arrow indicates the main differences found in Ric-8A peptide structures. (C) Temperature factor representation of Structure 2 (blue and red, high and low values, respectively) in two rotated views.
Figure 3—figure supplement 2

The hNCS-1/Ric-8A-P protein-protein interface.
(A) Ribbon representation of NCS-1. Helices are labeled and residues implicated in Ric-8A recognition are displayed as light purple sticks. (B) H-bonds (black dashes) between NCS-1 (gray) and Ric-8A (pink). Interacting residues are shown as pink sticks and light-purple sticks, respectively. Water molecules are displayed as red spheres. (C) H-bonds found in the R1-R2 loop. A rotated and zoomed view of that shown in B is depicted. (D) Ric-8A residues implicated in van der Waals interactions are displayed in sticks and labeled. Ric-8A is shown as pink ribbon and the molecular surface of NCS-1 is represented. Residues that were mutated to alanine to verify the protein-protein interaction (PPI) interface (Figure 3D) are indicated in purple in A–D.
Figure 4 with 2 supplements
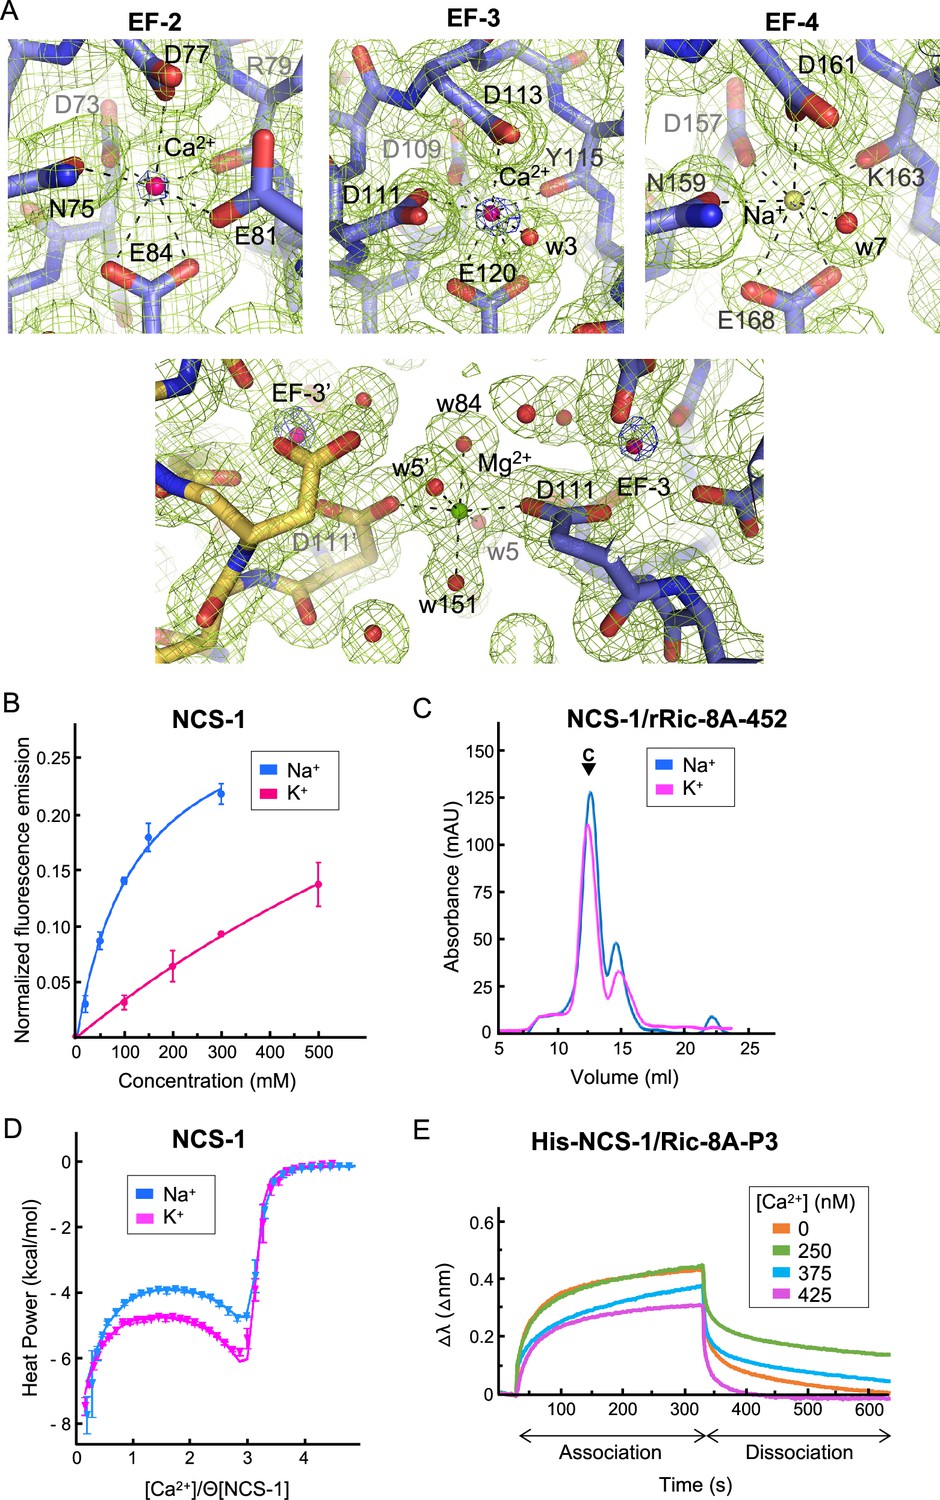
NCS-1 Ca2+ binding sites.
(A) Identification of Ca2+, Mg2+, and Na+ ions in the hNCS-1ΔH10/Ric-8A-P3 complex (Structure 2, see Table 1). Top: Electron density at EF-hands EF-2, -3 and -4. The 2Fo-Fc electron density map (contoured at 1.0σ) and the anomalous difference map (contoured at 6.0σ) are shown in green and blue, respectively. NCS-1 is shown in stick mode (light purple), Ca2+ and Na+ ions as hot pink and yellow spheres, respectively, and water molecules (w) as red spheres. Bottom: The Mg2+ ion (green sphere) found in Structures 1 and 2 (see Table 1). NCS-1 symmetry-related molecule is depicted in yellow. (B) The binding of Na+ to hNCS-1 in solution. Representation of the normalized fluorescence emission (mean ± standard error of the mean [SEM]; n=3) of full-length hNCS-1 at increasing concentrations of NaCl or KCl. The curves are the least squares fitting of the experimental data to a 1:1 stoichiometry equilibrium. Na+ and K+ titrations are shown in blue and magenta, respectively. (C) Assembly of the NCS-1ΔH10/rRic-8A-452 complex in the presence of 200 mM Na+ (blue) or K+ (magenta). Size exclusion chromatograms indicating the elution of the assembled complexes (C). (D) Isothermal titration calorimetry (ITC) binding isotherm at 25°C for Ca2+ to NCS-1 in 20 mM Tris pH 7.9 supplemented with 150 mM Na+ (blue) or 150 mM K+ (magenta). Solid lines show the best fits of the titration data in terms of a three-site sequential binding model using the thermodynamic parameters shown in Table 4. Θ is the fraction of sites available for each class of Ca2+ sites. (E) The binding of full-length His-NCS-1 to Ric-8A-P3 peptide at increasing Ca2+ concentrations. Representative biolayer interferometry (BLI) sensograms showing association and dissociation of Ric-8A-P3 over the time. Data are represented as the wavelength shift, △λ (nm), during the association and dissociation phases (s).
-
Figure 4—source data 1
Raw chromatograms, nano-DSF and Bli data.
- https://cdn.elifesciences.org/articles/86151/elife-86151-fig4-data1-v2.zip
Figure 4—figure supplement 1

Isothermal titration calorimetry.
Thermodynamics of Ca2+ binding to NCS-1 in Na+ (top panels) or K+ (bottom panels) containing buffers. Experimental conditions as in Figure 4D. Raw data (left panels) and binding isotherms (central panels) in both conditions are shown, together with the NCS-1 population containing one, two, or three sites occupied with Ca2+ as a function of the [Ca 2+]/[NCS-1] molar ratio (right panels). Best fits of titration isotherms using the three-site sequential binding model are shown as solid curves.
Figure 4—figure supplement 2

Biolayer interferometry (BLI) control experiments.
(A) Nano-differential scanning fluorimetry (nano-DSF) curve of the His-NCS-1 sample used in the BLI assay. (B) Representative BLI sensogram of the binding of His-NCS-1 to the Ni-NTA biosensor and negative control showing that Ric-8A-P3 peptide does not bind to the biosensor in the absence of NCS-1. (C) BLI sensograms at increasing concentrations of Ric-8A-P3 peptide.
Figure 5 with 1 supplement
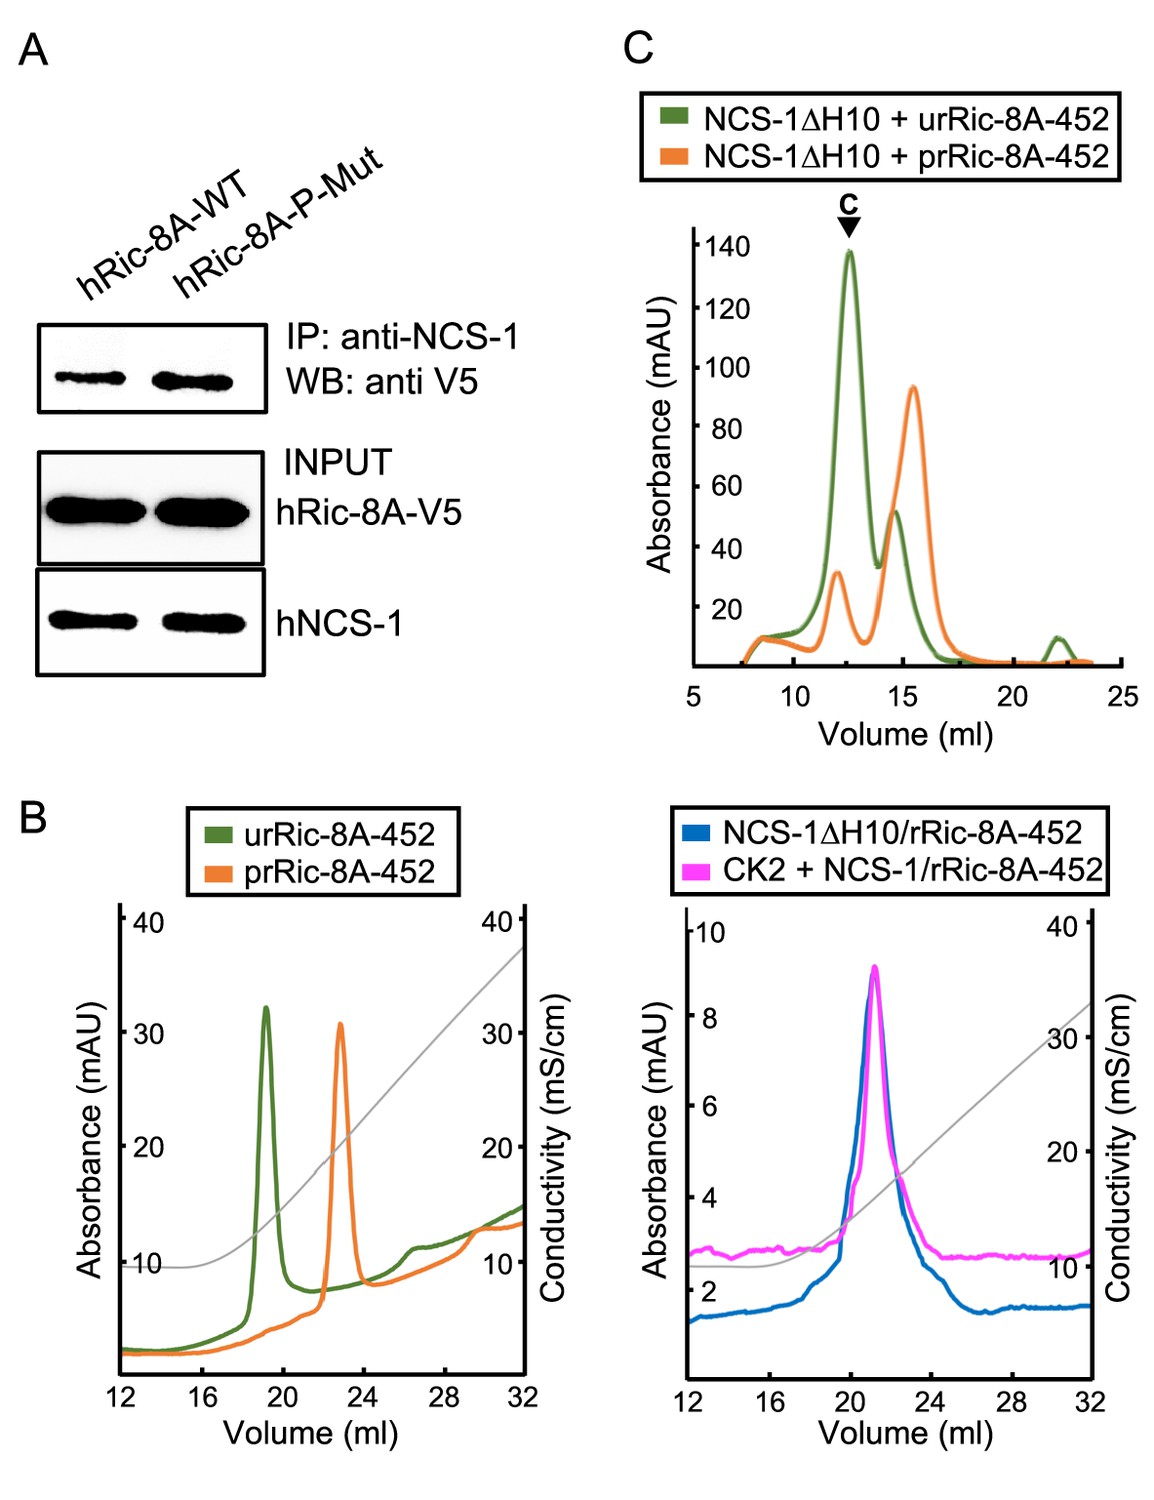
Ric-8A phosphorylation in the context of the NCS-1/Ric-8A complex.
(A) Co-IP protein-protein interaction assay of hNCS-1 and V5-tagged full-length hRic-8A wild-type (WT) (hRic-8A-WT) and a non-phosphorylatable mutant (Ric-8A-P-Mut; S436A, T441A) in HEK293 cells. (B) Anionic exchange chromatograms of casein kinase II (CK2)-treated samples eluted in a salt gradient. On the left, phosphorylated and unphosphorylated rRic-8A-452 prRic-8A-452 (orange) and urRic-8A-452 (green), respectively. On the right, CK2 treated (pink) or untreated (blue) NCS-1ΔH10/rRic-8A samples. Conductivity (mS/cm) is shown as gray lines. (C) Size exclusion chromatograms of the resulting samples after the assembly of NCS-1ΔH10 with unphosphorylated (green) and phosphorylated (orange) rRic-8A-452. C stands for assembled complex.
-
Figure 5—source data 1
Original WBs and raw chromatogram data.
- https://cdn.elifesciences.org/articles/86151/elife-86151-fig5-data1-v2.zip
Figure 5—figure supplement 1

Analysis of phosphorylated rRic-8A-452 by mass spectrometry.
MS/MS fragmentation spectra (top) and Mascot phospho-site assignment confidence (bottom) of the two phosphorylated peptides (A and B) detected at S435. Red and yellow signals correspond to the indicated y/b ion fragments. Those corresponding to phosphorylated fragments (labeled -98 due to the release of the phosphate molecule) are shown in yellow.
Figure 6 with 2 supplements
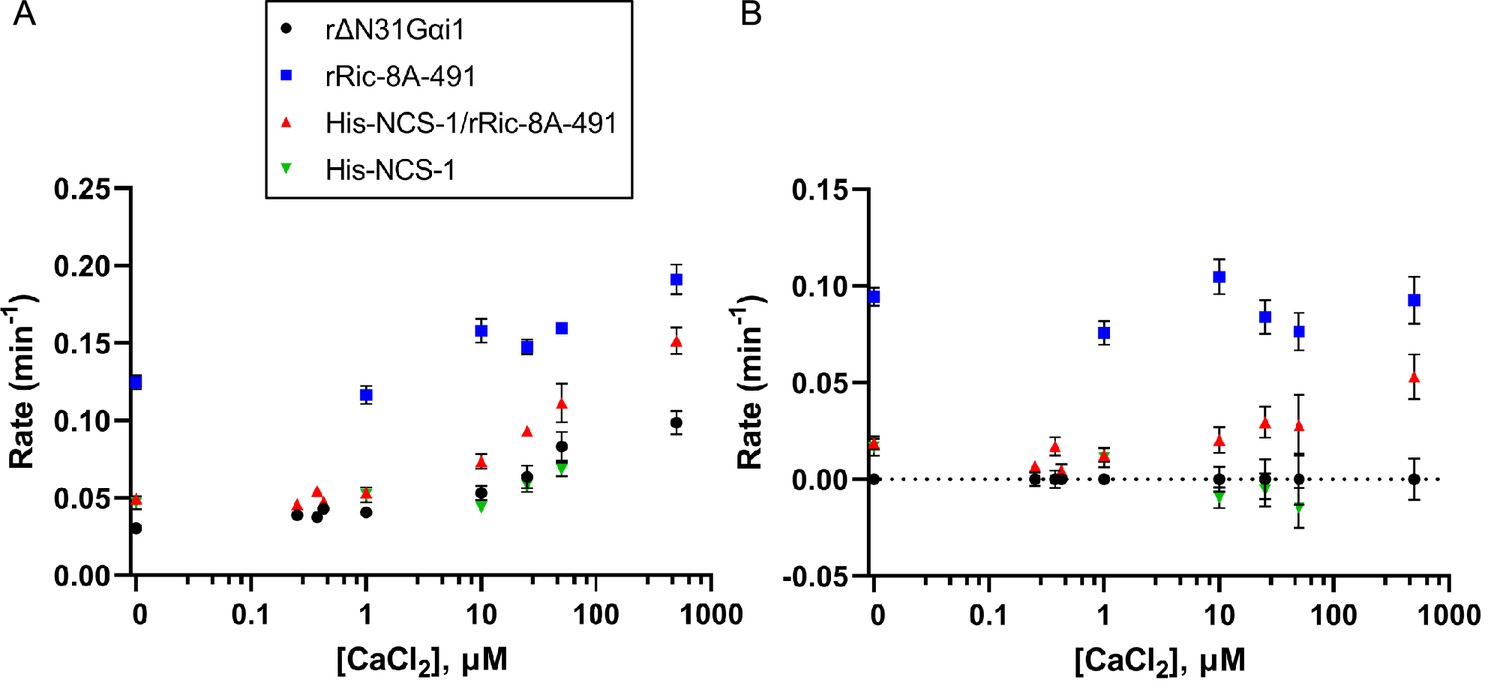
Effect of full-length NCS-1 on guanine nucleotide exchange factor (GEF) activity of rRic-8A-491.
(A) GTP binding rates were measured by following the increase in rΔN31Gαi1 tryptophan fluorescence following addition of 10 µM GTPγS. Prior to GTPγS addition, rΔN31Gαi1 (1 µM final concentration) was incubated with either rRic-8A-491 (0.5 µM final concentration), His-NCS-1/rRic-8A-491 complex (0.5 µM final concentration), or His-NCS-1 (0.5 µM final concentration) and 0–500 µM CaCl2 for 5 min before addition of GTPγS (buffer: 50 mM HEPES pH 8, 200 mM NaCl, 2 mM MgCl2, and 1 mM TCEP). In all cases means and standard error of the mean (SEM) are reported for a minimum of six experimental replicates. (B) GTP binding rates of rRic-8A-491, His-NCS-1/rRic-8A-491, and His-NCS-1 after subtraction of intrinsic binding rates of rΔN31Gαi1 at each corresponding CaCl2 concentration.
Figure 6—figure supplement 1

GTPγS binding progress curves.
Representative traces of progress curves in determining nucleotide exchange rates shown in Figure 6. Change in fluorescence intensity is measured at excitation/emission = 295 nm/345 nm, which is sensitive to GTPγS binding ΔN31Gαi1.
Figure 6—figure supplement 2

GTP binding rates vs CaCl2 concentration. GTP binding rates of rΔN31Gαi1 vs CaCl2 concentration, after subtraction of the intrinsic rate at 0 µM CaCl2 (black spheres).
GTP binding rates of His-NCS-1/rRic-8A-491 plotted vs CaCl2 concentration after subtraction of intrinsic binding rates of rΔN31Gαi1 at each corresponding CaCl2 concentration (red triangles). In all cases means and standard error of the mean (SEM) are reported for a minimum of six experimental replicates Data were fit to a one-site binding model (GraphPad Prism, 2023).
Figure 7
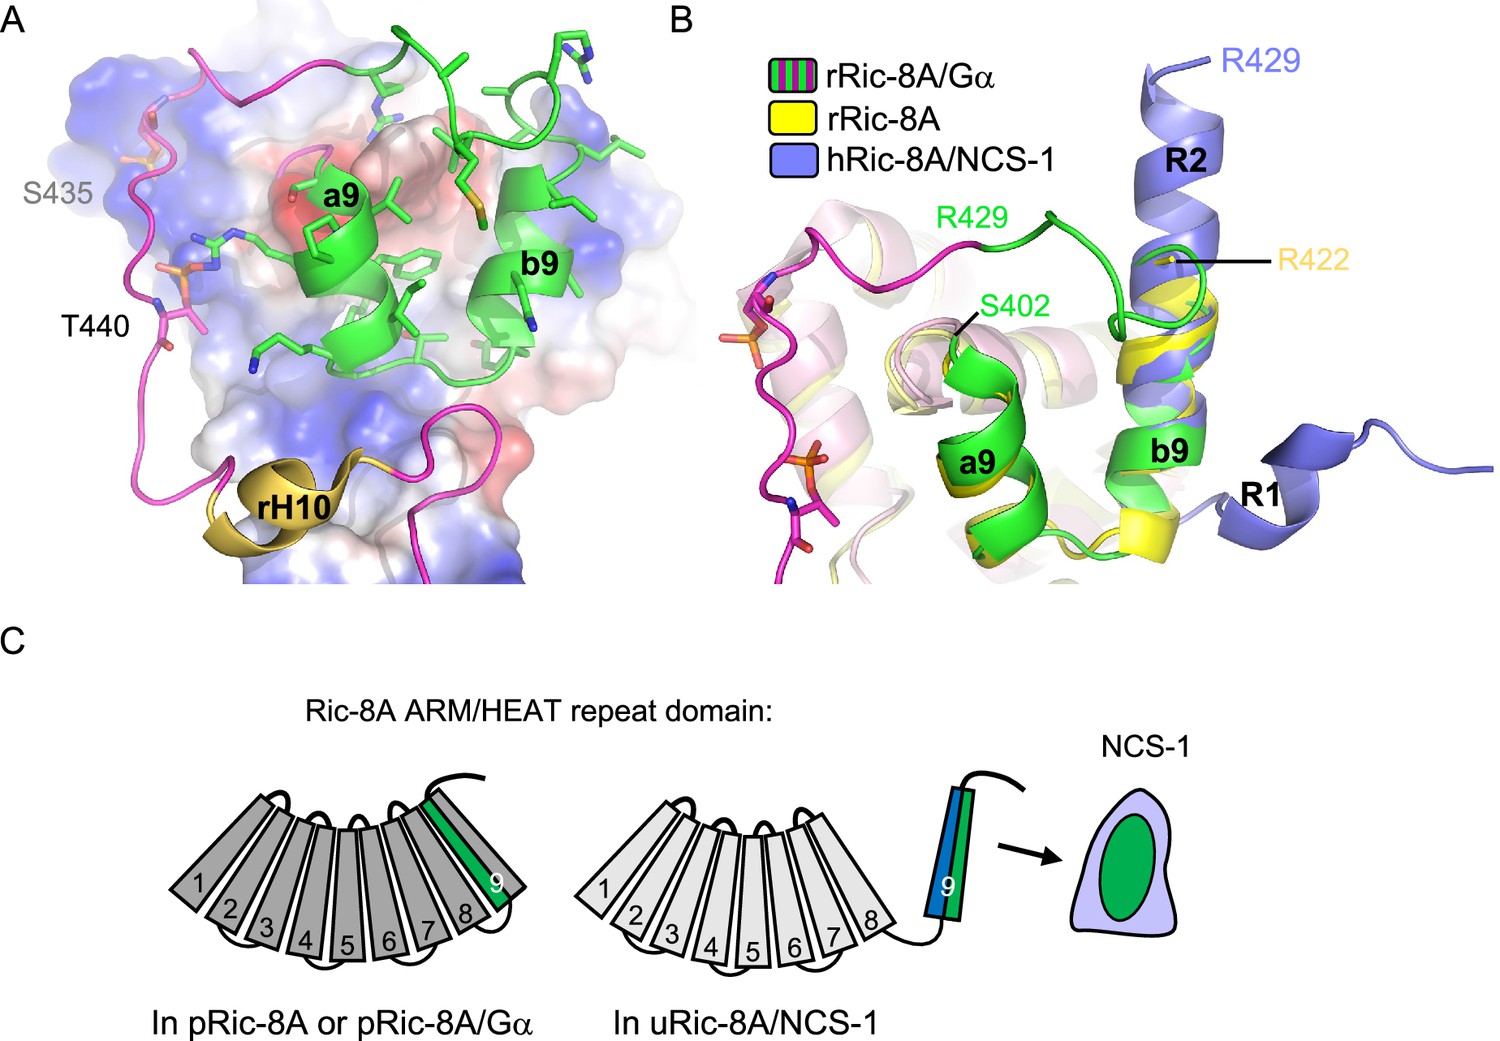
Structural reorganization of Ric-8A for NCS-1 recognition.
(A) The structure of the rRic-8A/G⍺i1 complex (PDB: 6UKT, McClelland et al., 2020). Electrostatic potential surface representation of ARM-HEAT domain (repeats 1–8). The repeat 9 is shown as ribbons. The Ric-8A region present in the NCS-1/Ric-8A-P crystal structure is shown in green and side chains of the corresponding residues in stick mode. Phosphorylated S435 and T440 are indicated. (B) Superposition of the structures of Ric-8A bound to G⍺ (magenta and green, PDB: 6UKT, McClelland et al., 2020), uncomplexed rRic-8A (yellow, PDB: 6NMG, Zeng et al., 2019), Ric-8A peptide (light purple) bound to hNCS-1. Ric-8A helix R2 of the complex with NCS-1 was superposed with helix b9 of uncomplexed Ric-8A. (C) Schematic representation of Ric-8A ARM/HEAT repeat domain (repeats 1–9 are indicated) explaining the detachment of 9 for NCS-1/Ric-8A assembly. The redistribution of charged (blue) and hydrophobic residues (green) in Ric-8A repeat 9 generates the platform for NCS-1 recognition. Repeats 1–8 have been colored in different gray tonalities since previous studies have shown global changes within the ARM-HEAT repeat domain of unphosphorylated Ric-8A compared to the phosphorylated version (Zeng et al., 2019).
Figure 8
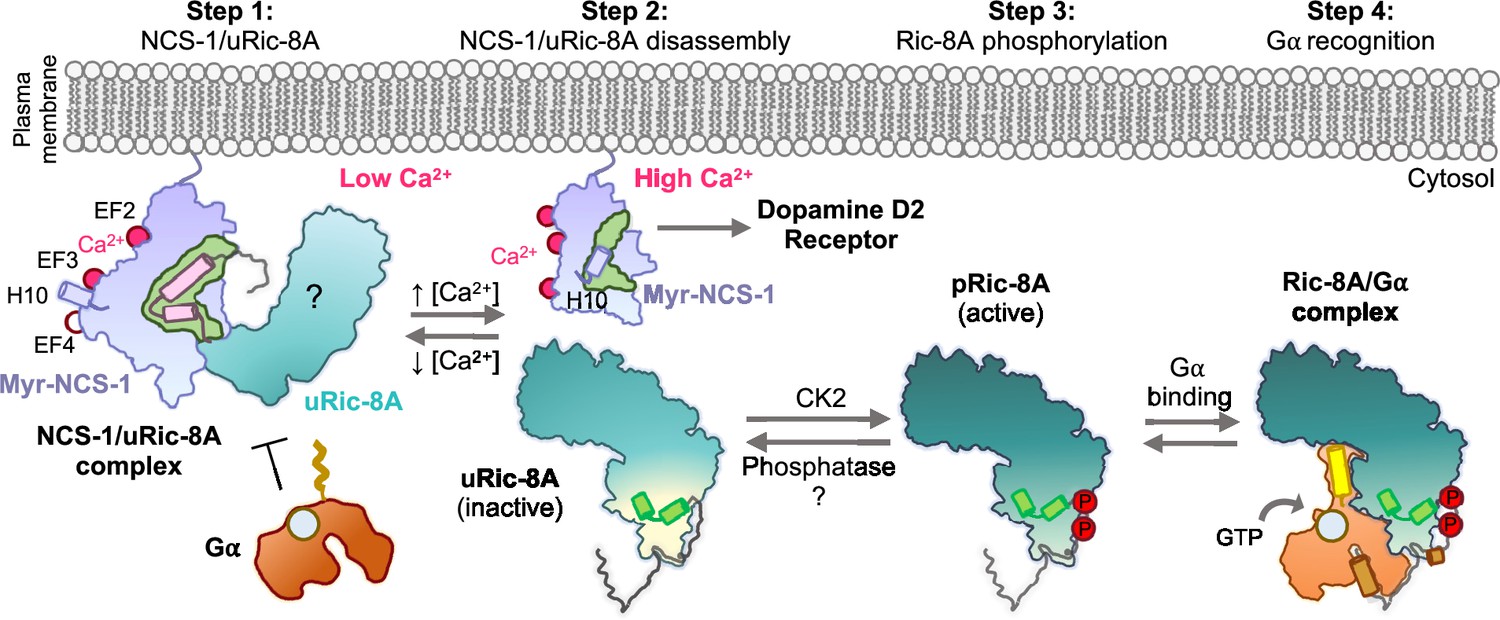
Schematic representation of the mechanism of Ric-8A activation regulated by NCS-1.
Step 1: At low Ca2+ concentrations NCS-1 interacts with unphosphorylated Ric-8A (uRic-8A), at the plasma membrane. NCS-1 protects Ric-8A from phosphorylation or Gα subunit binding. Ric-8A ARM-HEAT repeat domain is labeled with a question mark since the structure in the context of the NCS-1 complex is unknown. Step 2: When Ca2+ levels increase in the cytosol, NCS-1 binds Ca2+ at EF-4 and the complex is disassembled. NCS-1 helix H10 inserts in the hydrophobic crevice (green) and would be ready for dopamine D2 receptor recognition. Inactive uRic-8A, free of NCS-1, repacks repeats 8 and 9 (helices a9 and b9 in light green) and S335 and T440 are phosphorylated (P) by casein kinase II (CK2) (Step 3). In this state, phosphorylated Ric-8A (pRic-8A) is now active, recognizes prefolded Gα subunit and allows GTP loading (Step 4).
Author response image 1

Comparison of 2D averages and cryo-EM map of the previously presented model and the currently improved one.
(Top left) 2D averages from the previous and current models, generated with the final particles after 3D classification. The old and new cryo-EM maps with docked PDBs from a front (top right), side (bottom left) and top (bottom right) views. The cryo-EM map is displayed as a grey transparent surface with Ric-8A (red cartoon), NCS-1 (purple cartoon) and the three nanobodies (yellow, cyan and green cartoons) docked into it.
Videos
Video 1
Morph movie explaining the structural rearrangement of Ric-8A HEAT repeat 9 for NCS-1 recognition.
Ric-8A residues 402–429 are shown starting at the Gα-bound and ending at the NCS-1-bound conformations. The view is the same as that in Figure 7A. Side chains are displayed in stick mode. While in the Ric-8A/Gα structure hydrophobic residues are at the back, facing the ARM-HEAT repeat domain (not shown), they rearrange and expose to the solvent to recognize NCS-1. The resulting structure is amphipathic and positively charged residues concentrate at the opposite side.
Tables
Table 1
Diffraction data collection and refinement statistics of hNCS-1/Ric-8A-P crystals.
| Data collection | Structure 1 | Structure 2 | Structure 3 |
|---|---|---|---|
| PDB code | 8ALH | 8AHY | 8ALM |
| Peptide | P2 | P3 | P3 |
| Ions in solution | Mg2+, Ca2+, Na+ | Mg2+, Ca2+, Na+ | Ca2+, Na+ |
| Space group | P41212 | P41212 | P41212 |
| Cell dimensions | |||
| a, b, c (Å) | 56.86, 56.86, 134.61 | 56.64, 56.64, 135.30 | 56.64, 56.64, 134.53 |
| α, β, γ (°) | 90.00, 90.00, 90.00 | 90.00, 90.00, 90.00 | 90.00, 90.00, 90.00 |
| Resolution range (Å) | 52.38–1.86 (1.93-1.86)* [a*, b*=1.846, c*=1.917] | 52.24–1.70 (1.79-1.70)* [a*, b*=1.681, c*=1.891] | 52.20–1.85 (1.94-1.85)* [a*, b*=1.854, c*=1.920] |
| Rpim | 0.044 (0.803) | 0.036 (0.659) | 0.028 (0.616) |
| CC1/2 | 0.998 (0.445) | 0.997 (0.551) | 0.999 (0.467) |
| I/σI | 16.8 (1.2) | 13.5 (1.4) | 15.2 (1.3) |
| Completeness | |||
| Spherical (%) | 92.7 (41) | 88.0 (34.1) | 91.2 (36.1) |
| Ellipsoidal (%) | 94.9 (51.5) | 95.9 (65.4) | 94.0 (45.7) |
| Wilson B-factor | 31.12 | 26.90 | 37.80 |
| Multiplicity | 25.2 (26.5) | 25.5 (27.7) | 8.7 (9.8) |
| Refinement | |||
| Resolution (Å) | 52.38–1.86 | 52.24–1.70 | 52.20–1.85 |
| No. reflections | 18029 | 22008 | 17665 |
| Rwork/Rfree | 19.58/23.13 (26.31/28.49) | 18.64/20.76 (34.65/45.00) | 20.98/25.25 (36.89/46.21) |
| Asymetric unit content | |||
| No. atoms | 3454 | 3403 | 3374 |
| Protein (no. residues) | 171 | 171 | 171 |
| Peptide (no. residues) | 28 | 28 | 28 |
| PEG/GOL | 3/1 | 2/1 | 2/2 |
| Ca2+/Cl-/Mg2+/Na+ ions | 2/1/1/1 | 2/1/1/1 | 2/1/0/2 |
| Water molecules | 141 | 144 | 116 |
| B-factor (Å)2 | 31.27 | 27.28 | 37.18 |
| R.m.s. deviations protein | |||
| Bond lengths (Å) | 0.44 | 0.36 | 0.50 |
| Bond angles (°) | 0.63 | 0.56 | 0.65 |
| R.m.s. deviations peptide | |||
| Bond lengths (Å) | 0.45 | 0.57 | 0.33 |
| Bond angles (°) | 0.70 | 0.63 | 0.61 |
-
*
Values in parenthesis are for highest resolution shell.
Table 2
Residues mutated to alanine to validate the NCS-1/Ric-8A PPI interface.
| Residue | Position and interacting residues |
|---|---|
| NCS-1 D37 | Upper part of the crevice. Interacts with Ric-8A R429, which is located at the C-terminal end of R2 helix |
| NCS-1 Y52 | Middle of the crevice. Recognizes Ric-8A L419, which is found at the middle of R2 helix |
| NCS-1 R148 | Bottom of the crevice. Interacts with Ric-8A K408 (N-terminus of R1 helix) and Ric-8A T410 (R1-R2 loop) |
| NCS-1 R151 | Bottom of the crevice. Interacts with Ric-8A K408 (N-terminus of R1 helix) and Ric-8A Y412 (R1-R2 loop, water-mediated H-bond) |
| Ric-8A T410, Y412, N414 | R1-R2 loop. Mediate several water-mediated H-bonds and van der Waals contacts with the bottom surface of NCS-1 crevice |
| NCS-1 W30A | Upper part of the cavity. Important in the recognition of R2 helix. Establish van der Waals interactions with residues such as Ric-8A L424 and M425 |
| Ric-8A L424 and M425 | C-terminal part of helix R2. Interact with NCS-1 W30 and the hydrophobic environment that surrounds these residues |
Table 3
The Ca2+-dependent affinity of full-length NCS-1 for Ric-8A-P3 peptide.
Calculated apparent Kd and standard error of the mean (SEM) using biolayer interferometry. Three independent experiments were performed at each [Ca2+].
| [Ca2+] (nM) | ||||
|---|---|---|---|---|
| 0 | 250 | 375 | 425 | |
| Kd (μM) | 140 | 344 | 381 | 98620 |
| SEM | 29 | 14 | 18 | 16310 |
Table 4
Thermodynamic parameters of Ca2+ binding to full-length hNCS-1 in the presence of K+ or Na+.
| C (150 mM) | Kd1 (nM) | ΔH1 (kcal/mol) | Kd2 (nM) | ΔH2 (kcal/mol) | Kd3 (nM) | ΔH3 (kcal/mol) |
|---|---|---|---|---|---|---|
| Na+ | 265±6 | –7.7±0.1 | 758±16 | 3.0±0.1 | 379±17 | –9.1±0.3 |
| K+ | 165.6±0.3 | –7.66±0.01 | 362.3±0.6 | 1.00±0.01 | 253±1 | –9.44±0.01 |
-
Subscripts 1, 2, and 3 correspond to sites 1, 2, and 3, respectively.
Appendix 1—key resources table
| Reagent type (species) or resource | Designation | Source or reference | Identifiers | Additional information |
|---|---|---|---|---|
| Strain, strain background (Escherichia coli) | BL21* | Invitrogen | Cat # C601003 | |
| Strain, strain background (E. coli) | BL21(DE3) pLysS | Novagen | Cat # 70236 | |
| Strain, strain background (E. coli) | Rosetta2 pLysS | Novagen | Cat # 71403 | |
| Strain, strain background (E. coli) | WK6 cells | McClelland et al., 2020 | Cat # 47078 | |
| Strain, strain background (E. coli) | BL21 CodonPlus (DE3) RIPL | McClelland et al., 2020 | Cat # 230280 | |
| Cell line (human) | HEK293 | ATCC | Cat # CRL-1573 | |
| Antibody | Mouse monoclonal anti-V5 | Invitrogen | Cat # R960-25 | 1:5000 |
| Antibody | Rabbit polyclonal anti-NCS-1 | Cell Signaling | Cat # 8237S | 1:2000 in WB 1:500 in IP |
| Antibody | Anti-mouse antibody TrueBlot secondary | Rockland | Cat # 18-8817-30 | 1:5000 |
| Recombinant DNA reagent | Human NCS-1 (full-length) in pETDuet vector | Canal-Martín et al., 2019 | N/A | |
| Recombinant DNA reagent | Human NCS-1ΔH10 in pETDuet vector | This work | N/A | Stop codon after residue P177 for NCS-1ΔH10 construct |
| Recombinant DNA reagent | Human His(6)-NCS-1 in pET28a+vector | This work | N/A | His-tagged NCS-1 version in pET28a+ vector |
| Recombinant DNA reagent | Human His(6)-NCS-1 (full-length) in pETDuet vector | This work | N/A | His-tagged NCS-1 version in pETDuet vector |
| Recombinant DNA reagent | Rat His(6)-Ric-8A(1-452) in pET28a vector | Thomas et al., 2011 | N/A | |
| Recombinant DNA reagent | Rat His(6)-Ric-8A(1-423) in pET28a vector | This work | N/A | Ric-8A(1-423) truncated version of Rat His(6)-Ric-8A(1-452) in pET28a vector |
| Recombinant DNA reagent | Rat His(6)-Ric-8A(1-432) in pET28a vector | This work | N/A | Ric-8A(1-432) truncated version of Rat His(6)-Ric-8A(1-452) in pET28a vector |
| Recombinant DNA reagent | Rat His(6)-Ric-8A(1-491) in pET28a vector | Thomas et al., 2011 | N/A | |
| Recombinant DNA reagent | Rat GST-ΔN31Gα in a pDest15 vector | McClelland et al., 2020 | N/A | |
| Recombinant DNA reagent | Human Ric-8A deletion construct ending at G424 (hRic-8A-424) in nV5-pCDNA3.1 plasmid | This work | N/A | hRic-8A-G424 construct version of human Ric-8A in nV5-pCDNA3.1 plasmid |
| Recombinant DNA reagent | Human Ric-8A deletion construct ending at G433 (hRic-8A-433) in nV5-pCDNA3.1 plasmid | This work | N/A | hRic-8A-G433 construct version of human Ric-8A in nV5-pCDNA3.1 plasmid |
| Recombinant DNA reagent | Human Ric-8A full-length mutant (S436A, T441A) in nV5-pCDNA3.1 plasmid | This work | N/A | Phosphorylation mutant version |
| Recombinant DNA reagent | Human Ric-8A in nV5-pCDNA3.1 plasmid | Mansilla et al., 2017 | N/A | |
| Recombinant DNA reagent | Human Ric-8A mutant (T411A, Y413A, N415A) in nV5-pCDNA3.1 plasmid | This work | N/A | T411A, Y413A, N415A mutant version of human Ric-8A in nV5-pCDNA3.1 plasmid |
| Recombinant DNA reagent | Human Ric-8A mutant (L425A, M426A) in nV5-pCDNA3.1 plasmid | This work | N/A | L425A, M426A, mutant version of human Ric-8A in nV5-pCDNA3.1 plasmid |
| Recombinant DNA reagent | Human NCS-1 in pCDNA3.1 plasmid in pCDNA3.1 plasmid | Mansilla et al., 2017 | N/A | |
| Recombinant DNA reagent | Human NCS-1 mutant (D37A, Y52A) in pCDNA3.1 plasmid | This work | N/A | D37A, Y52A mutant version of human NCS-1 in pCDNA3.1 plasmid in pCDNA3.1 plasmid |
| Recombinant DNA reagent | Human NCS-1 mutant (R148A, R151A) in pCDNA3.1 plasmid | This work | N/A | R148A, R151A mutant version of human NCS-1 in pCDNA3.1 plasmid in pCDNA3.1 plasmid |
| Recombinant DNA reagent | Human NCS-1 mutant (D37A, R148A, R151A) in pCDNA3.1 plasmid | This work | N/A | D37A, R148A mutant version of human NCS-1 in pCDNA3.1 plasmid in pCDNA3.1 plasmid |
| Recombinant DNA reagent | Human NCS-1 mutant (D37A, Y52A, R148A, R151A) in pCDNA3.1 plasmid | This work | N/A | D37A, Y52A, R148A, R151A mutant version of human NCS-1 in pCDNA3.1 plasmid in pCDNA3.1 plasmid |
| Recombinant DNA reagent | Human NCS-1 mutant (W30A) in pCDNA3.1 plasmid | This work | N/A | W30 mutant version of human NCS-1 in pCDNA3.1 plasmid in pCDNA3.1 plasmid |
| Peptide, recombinant protein | Casein kinase II | New England Biolabs | Cat # P6010L | |
| Peptide, recombinant protein | Ric-8A P1 peptide (400-423) | GenicBio | N/A | |
| Peptide, recombinant protein | Ric-8A P2 peptide (400-429) | GenicBio | N/A | |
| Peptide, recombinant protein | Ric-8A P3 peptide (400-432) | GenicBio | N/A | |
| Chemical compound, drug | ATP | New England Biolabs | Cat # P0756S | |
| Chemical compound, drug | Water for UHPLC-MS LiChrosolv | Merck | Cat # 1037282002 | |
| Chemical compound, drug | Guanosine 5’-[g-thio]triphosphate | Sigma | Cat # G8634-10MG | |
| Software, algorithm | ImageJ | Schneider et al., 2012 | https://imagej.net/software/imagej/ | |
| Software, algorithm | GraphPad Prism | GraphPad Software, Inc, USA; GraphPad Prism, 2023 | https://www.graphpad.com/features | |
| Software, algorithm | AutoPROC | Vonrhein et al., 2011 | https://www.globalphasing.com/autoproc/manual/autoPROC1.html | v1.1.7 |
| Software, algorithm | Phaser | McCoy et al., 2007 | https://www.ccp4.ac.uk/html/phaser.html | v2.7.0 |
| Software, algorithm | Phenix | Adams et al., 2010 | https://www.phenix-online.org/ | v1.19.2_4158 |
| Software, algorithm | COOT | Emsley and Cowtan, 2004 | https://www2.mrc-lmb.cam.ac.uk/personal/pemsley/coot/ | 0.9.8 |
| Software, algorithm | Molprobity | Williams et al., 2018 | http://molprobity.biochem.duke.edu/ | v4.5.2 |
| Software, algorithm | CCP4 | Winn et al., 2011 | https://www.ccp4.ac.uk/ | v8.0 |
| Software, algorithm | PISA Server | Krissinel and Henrick, 2007 | https://www.ebi.ac.uk/pdbe/pisa/ | 1.48 |
| Software, algorithm | PyMol | Schrödinger, 2015 | https://pymol.org/2/ | v1.8.6.0 |
| Software, algorithm | Tycho NT.6 software | NanoTemper | https://nanotempertech.com | Tycho |
| Software, algorithm | Mascot Server | Matrix Science | https://www.matrixscience.com/ | |
| Software, algorithm | KaleidaGraph Data Analysis Program | Synergy Software | https://www.synergy.com/ | |
| Software, algorithm | AFFINImeter | AFFINImeter | https://www.affinimeter.com | |
| Other | Atomic Coordinates and Structure Factors NCS-1/Ric-8A-P2 complex | PDB | Structure 1 | 8ALH |
| Other | Atomic Coordinates and Structure Factors NCS-1/Ric-8A-P3 complex | PDB | Structure 2 | 8AHY |
| Other | Atomic Coordinates and Structure Factors NCS-1/Ric-8A-P3 complex | PDB | Structure 3 | 8ALM |
| Other | Hi Trap Phenyl FF hydrophobic column | Cytiva | 17519301 | Purification column |
| Other | Anion exchange HP Q column | Cytiva | 17115301 | Purification column |
| Other | Nickel-affinity column, HisTrap FF | Cytiva | 17525501 | Purification column |
| Other | Ni2+-chelated Sepharose HP beads | Cytiva | 17526801 | Purification column |
| Other | HiLoad 16/600 Superdex 200 pg | Cytiva | 28989335 | Purification column |
| Other | Source 15Q column | Cytiva | 17094701 | Purification column |
| Other | Superdex 200 HR 10/300 column | Cytiva | GE17-5175-01 | Purification column |
| Other | Tycho NT.6 instrument | NanoTemper | https://nanotempertech.com/tycho/ | Nano-DSF equipment |
| Other | Tycho capillaries | NanoTemper | Cat # TY-C001 | Nano-DSF capillaries |
| Other | VP-ITC microcalorimeter | GE Healthcare | https://www.malvernpanalytical.com/en/products/product-range/microcal-range | ITC equipment |
| Other | BLItz system | ForteBio | BLItz from ForteBio | BLI equipment |
| Other | Ni-NTA biosensors | Sartorius | CA89413-836 | BLI biosensors |
| Other | Protein-G-Sepharose | Sigma-Aldrich | CAT # P3296-1ML | Antibodies purification |
Additional files
Download links
A two-part list of links to download the article, or parts of the article, in various formats.
Downloads (link to download the article as PDF)
Open citations (links to open the citations from this article in various online reference manager services)
Cite this article (links to download the citations from this article in formats compatible with various reference manager tools)
The neuronal calcium sensor NCS-1 regulates the phosphorylation state and activity of the Gα chaperone and GEF Ric-8A
eLife 12:e86151.
https://doi.org/10.7554/eLife.86151


