Transcranial focused ultrasound to human rIFG improves response inhibition through modulation of the P300 onset latency
- School of Biological and Health Systems Engineering, Arizona State University, United States
Figures
Figure 1 with 1 supplement

Task and trial design.
(A) Stop-Signal task and trial types: rIFG group. Each trial type started with a fixation. After a randomly chosen delay (350–650ms), subjects were asked to respond to a “Go” signal as fast as possible by pressing the up key. On a subset of trials (Stop trials; rows 3–5), a red square appeared at one of 4 latencies (SSD) after the Go signal, cueing subjects to inhibit their response. Transcranial focused ultrasound (tFUS) was delivered to rIFG for 500ms, either at the onset of the Go (rows 2 and 4) or the Stop signal (row 5). SSD: stop signal delay. The same design was used for two control groups (S1 and sham rIFG), although tFUS was not delivered to a cortical site in the sham rIFG group (see text for details). For a subset of Go and Stop trials, no tFUS was delivered (rows 1 and 3). (B) The schematic further expands the display of the top plot, showing the timeline for each trial, with the timing of the events (Fixation, Go, and Stop signals). In addition, it shows how the core ERPs (P100, N200, and P300) are analyzed following the onset of the Stop signal. In trials that had tFUS, the tFUS was started simultaneously with the first monitor frame showing either the ‘Go’ or ‘Stop’ signal (aligned to t=0ms of the signal).
Figure 1—figure supplement 1
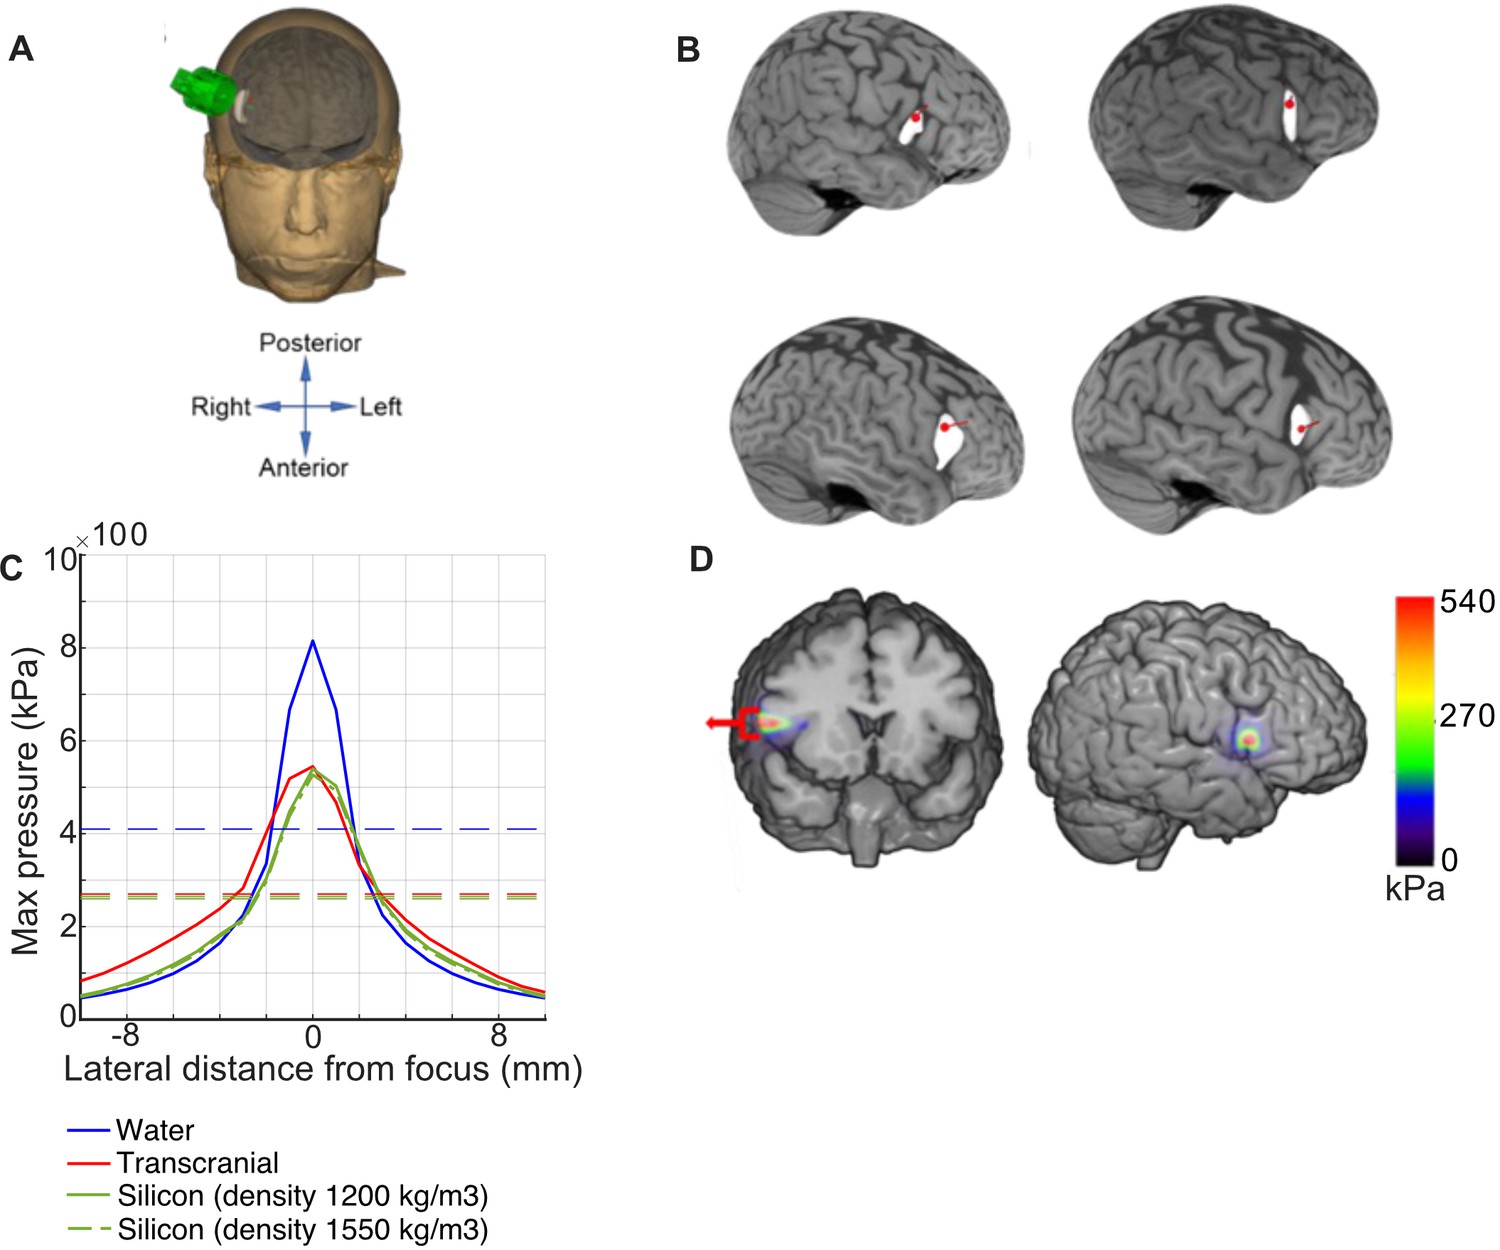
tFUS targeting and simulation.
(A) Average neuronavigation location of tFUS (red dot) applied to all MRIs used in the rIFG group. (B) Structural brain scans and renderings of the targeted tFUS point (red dot) in pars opercularis (4 subjects). (C) Lateral maximum pressure profile obtained at 30 mm depth focus in both water and tFUS simulations on a CT scan from one patient (solid and dotted lines, respectively). Horizontal red, green, and blue lines denote the full-width half maximum of the spatial profile of lateral pressure. (D) Simulated transcranial pressure profile onto T1 MRI plot shown as a color overlay.
Figure 2
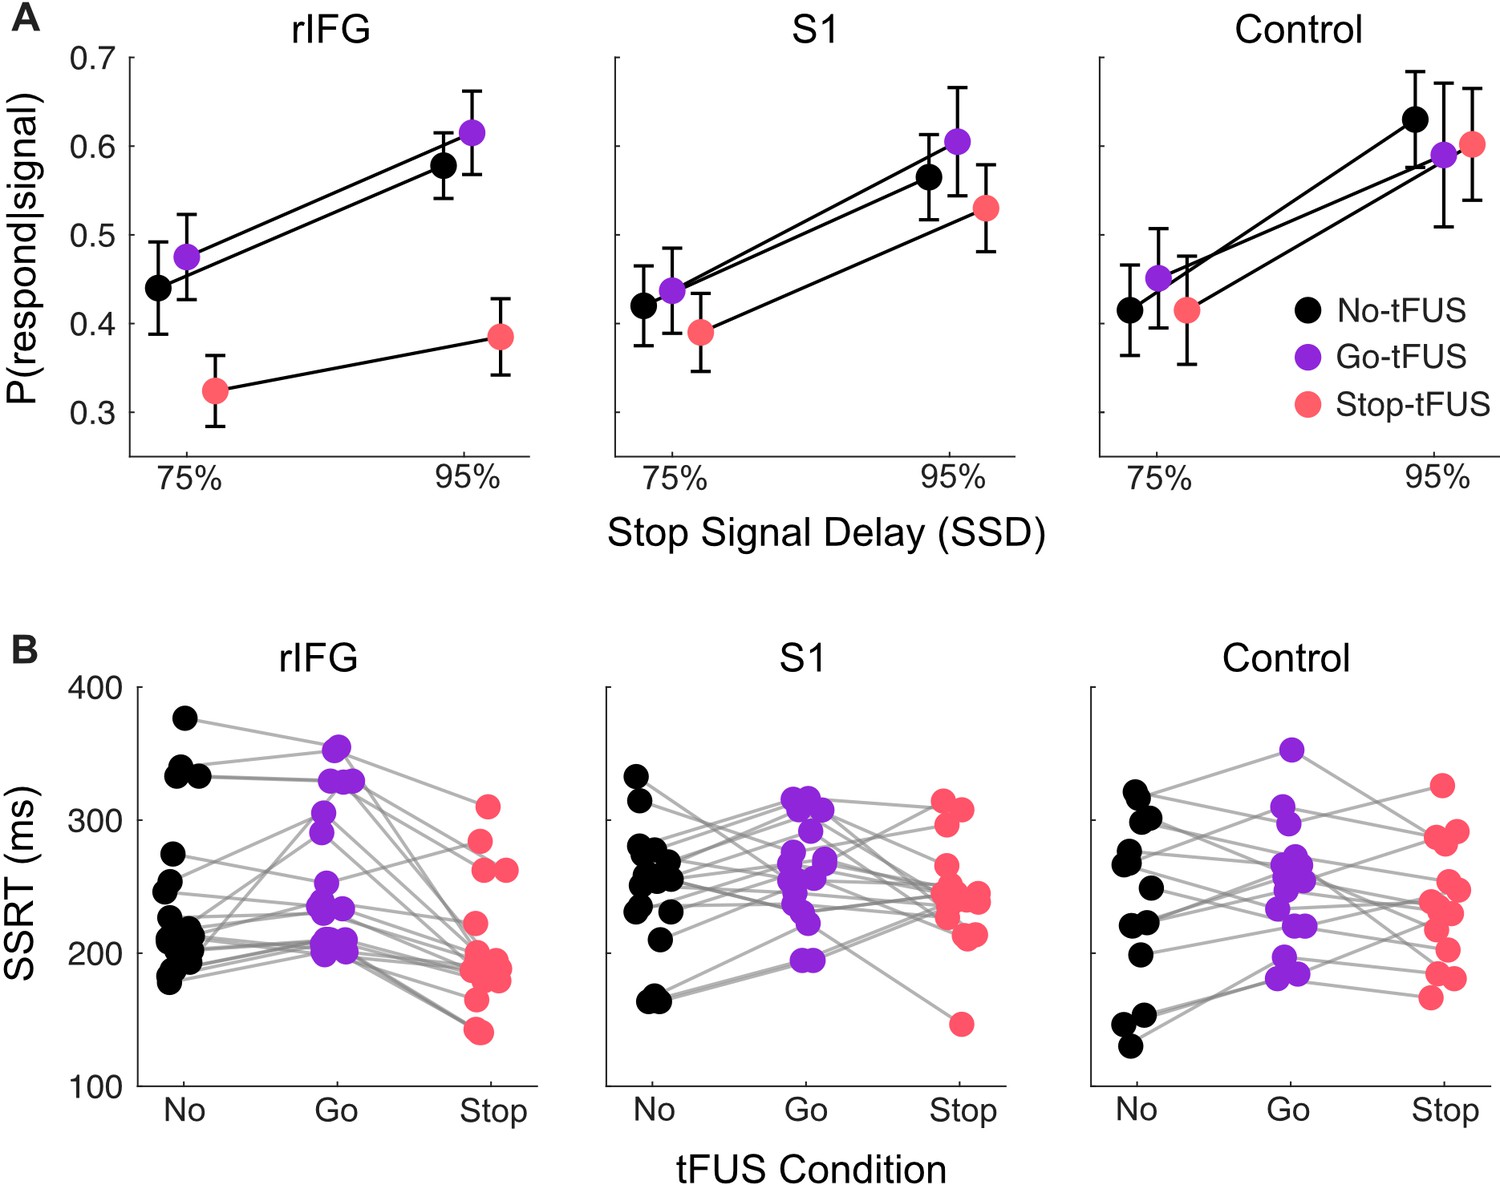
Response inhibition behavior.
(A) Inhibition accuracy quantified as the probability of failing to inhibit conditioned on whether a stop-signal was presented, P(respond|signal). Results are shown for the 75% and 95% SSD conditions, for each tFUS condition (different colors), and for each group (columns, from left to right: rIFG group, S1 group, and control group). (B) Stop signal reaction times (SSRT) derived from using the Bayesian hierarchical fits for each subject (separate dots); each subject has three points, covering the three tFUS conditions. All groups are shown across the columns (from left to right: rIFG group, S1 group, and control group).
Figure 3
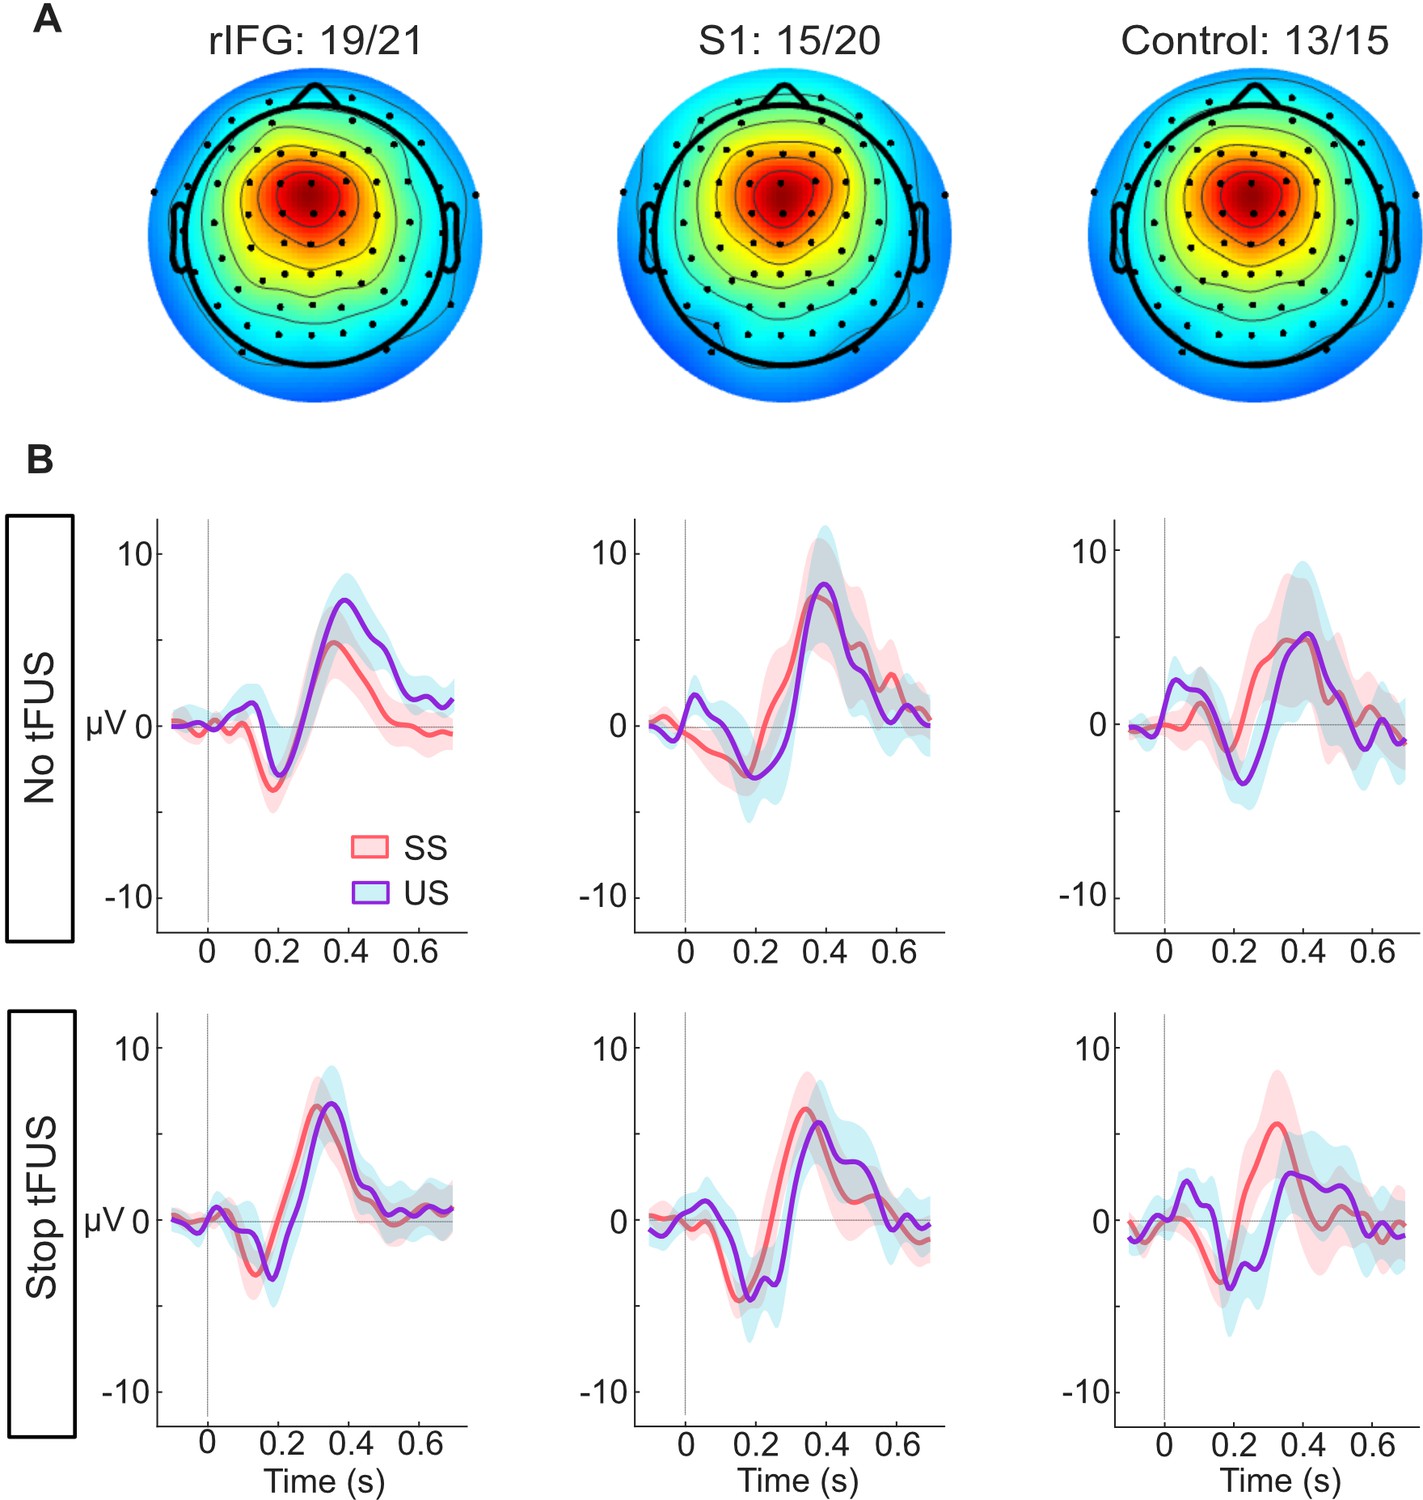
ERP responses modulated by tFUS.
(A) Average medial frontal ICA spatial map per group, found from clustering. The number of subjects in each group that had a correspondent IC are listed above the maps.(B) Each plot in both rows (top and bottom) shows the within-group (per column) mean ICA-based ERP. The ERPs are plotted from –100ms before- to 650ms post-stop-signal onset, with the colors (orange and purple, respectively) corresponding to the successful (SS) and unsuccessful (US) stopping trials. The top row presents the rERPs for the No-tFUS conditions, and the bottom row are the rERPs for the Stop-tFUS condition. The vertical line denotes the time at which the Stop Signal was delivered.
Figure 4
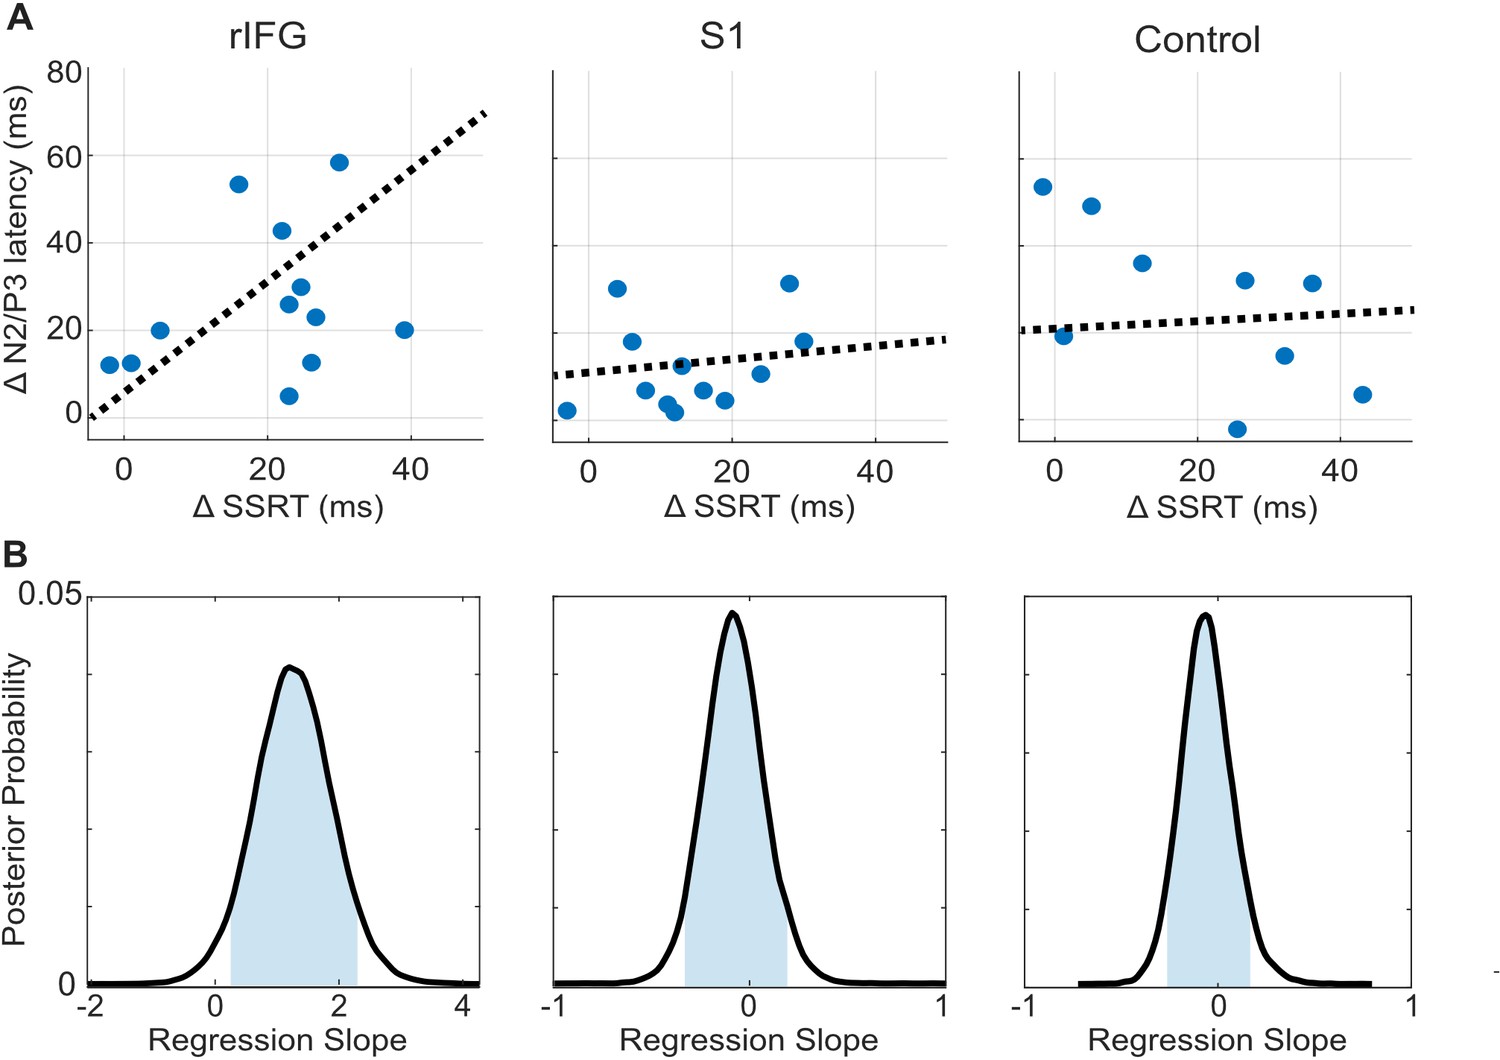
tFUS alterations to ERP timing modulate with SSRT.
(A) Scatterplots of change in N200/P300 onset latency as a function of the change in SSRT between the No-tFUS and Stop-tFUS conditions. Dashed lines are the mean slope parameters from the posterior MCMC samples of each group’s (separate columns) regression. (B). Each plot shows the kernel smoothed density (black line) of posterior MCMC samples for the regression coefficients and the 95% credible interval (blue shaded area).
Tables
Table 1
The mean and standard deviation (SD), 95% credible interval tails of the regression parameters of change in SSRT against change in N200/P300 onset latency, taken from the posterior sampling distribution for each group.
| Group | Mean | SD | 5% Credible interval | 95% Credible interval |
|---|---|---|---|---|
| rIFG | 1.27 | 0.43 | 0.23 | 2.32 |
| S1 | 0.13 | 0.24 | –0.12 | 0.31 |
| Control | 0.15 | 0.21 | –0.17 | 0.48 |
Table 2
tFUS simulation results showing intensity measures (Pmax, ISPPA, and ISPTA), lateral target focality (FWHM) and mechanical index (MI) measures.
Results are displayed for four different simulations, including only water, transcranial without silicone puck, and 2 simulations with silicone pucks of different densities.
| Simulation | Pmax (in MPa) | ISPPA (W/cm2) | ISPTA (W/cm2) | FWHM (mm) | MI |
|---|---|---|---|---|---|
| Only water | 0.82 | 22.43 | 5.38 | 3.56 | 1.15 |
| Transcranial without silicone puck | 0.54 | 10.01 | 2.40 | 6.13 | 0.77 |
| With silicone puck (density estimated at 1200 kg/m3) | 0.53 | 9.82 | 2.35 | 5.25 | 0.76 |
| With silicone puck (density estimated at 1550 kg/m3) | 0.52 | 9.37 | 2.25 | 5.27 | 0.74 |
Additional files
Download links
A two-part list of links to download the article, or parts of the article, in various formats.
Downloads (link to download the article as PDF)
Open citations (links to open the citations from this article in various online reference manager services)
Cite this article (links to download the citations from this article in formats compatible with various reference manager tools)
Transcranial focused ultrasound to human rIFG improves response inhibition through modulation of the P300 onset latency
eLife 12:e86190.
https://doi.org/10.7554/eLife.86190


