p38γ and p38δ modulate innate immune response by regulating MEF2D activation
- Department of Immunology and Oncology, Centro Nacional de Biotecnología/CSIC (CNB-CSIC), Campus-UAM, Spain
- The Francis Crick Institute, United Kingdom
- Institute for Research in Immunology and Cancer, Université de Montréal, Canada
- Goodman Cancer Research Center, McGill University, Canada
- Department of Biochemistry, McGill University, United Kingdom
- Patrick G. Johnston Centre for Cancer Research, Queen’s University Belfast, United Kingdom
- Department of Molecular and Cellular Biology, CNB-CSIC, Spain
- Institute of Immunity & Transplantation, University College London, United Kingdom
Figures
Figure 1 with 1 supplement

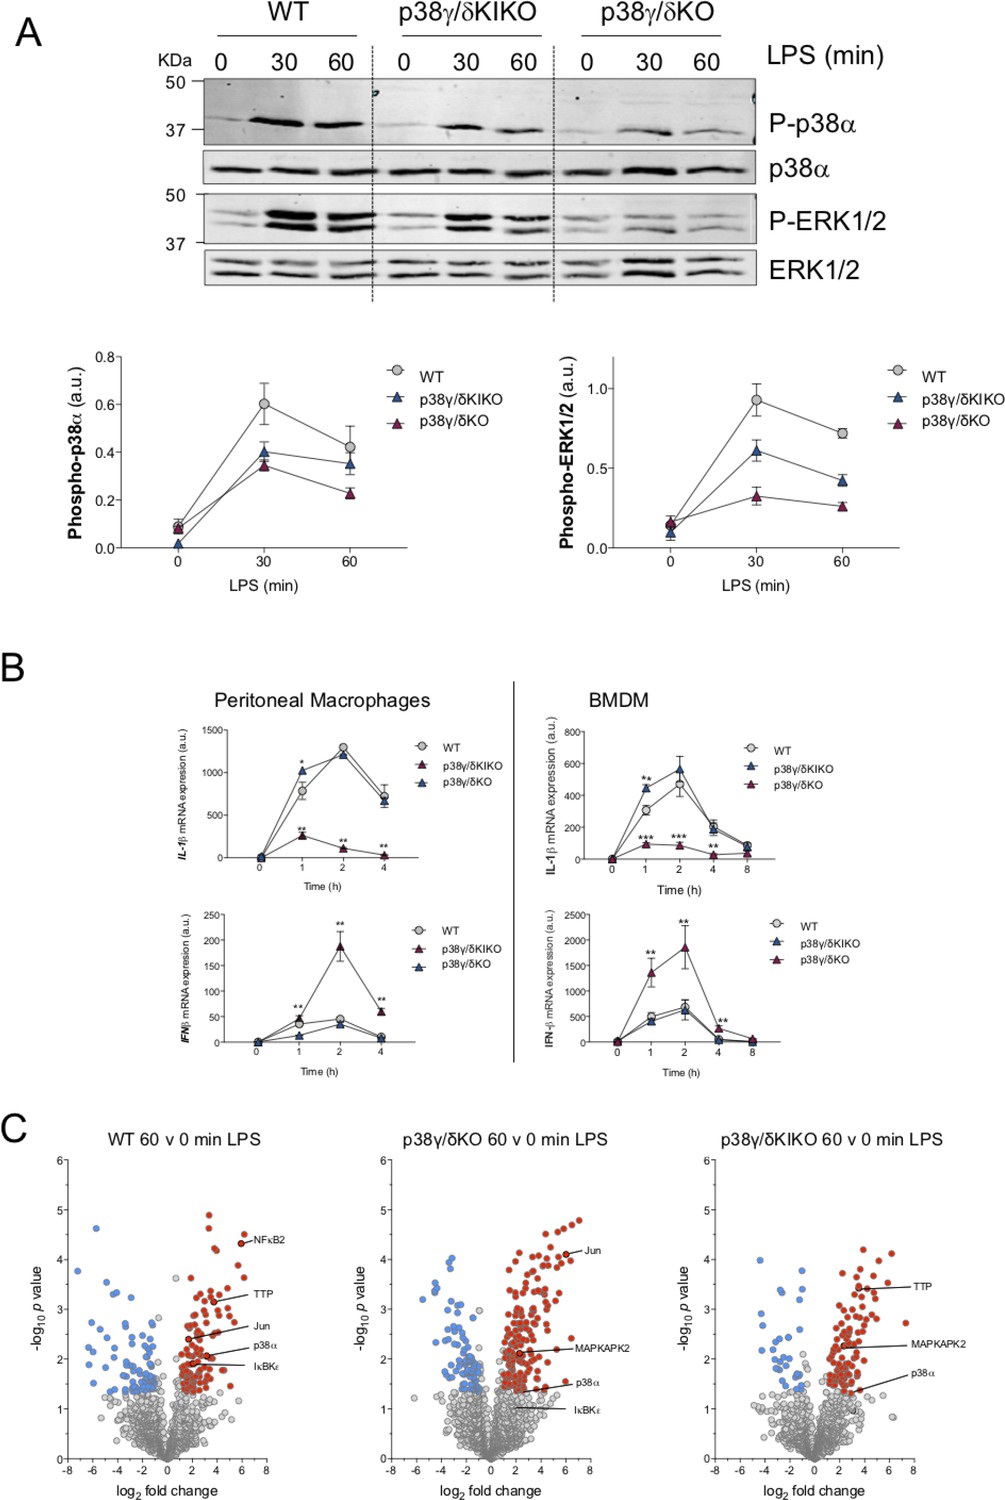
Lipopolysaccharide (LPS)-induced ERK1/2 activation in p38γ/δKIKO macrophages.
(A) Bone marrow-derived macrophage (BMDM) from wild-type (WT), p38γ/δKO, and p38γ/δKIKO mice was exposed to LPS (100 ng/ml) for the indicated times. Cell lysates (30 μg) were immunoblotted with the indicated antibodies to active phosphorylated p38α (P-p38α), JNK1/2 (P-JNK), and ERK1/2 (P-ERK1/2). Phosphorylated p105 (P-p105) and total protein levels of p38α, JNK1/2 (JNK), ERK1/2, TPL2, and p105 were also measured in the same lysates. Representative blots of two independent experiments with similar results are shown. (B) Intensity of the bands corresponding to Phos-ERK1/2 and TPL2 (panel A) was quantified. Data relative to WT Time 0 min are shown.
-
Figure 1—source data 1
Labelled (.pdf) and raw (.jpeg) western blot images showed in panel A.
- https://cdn.elifesciences.org/articles/86200/elife-86200-fig1-data1-v2.zip
Figure 1—figure supplement 1
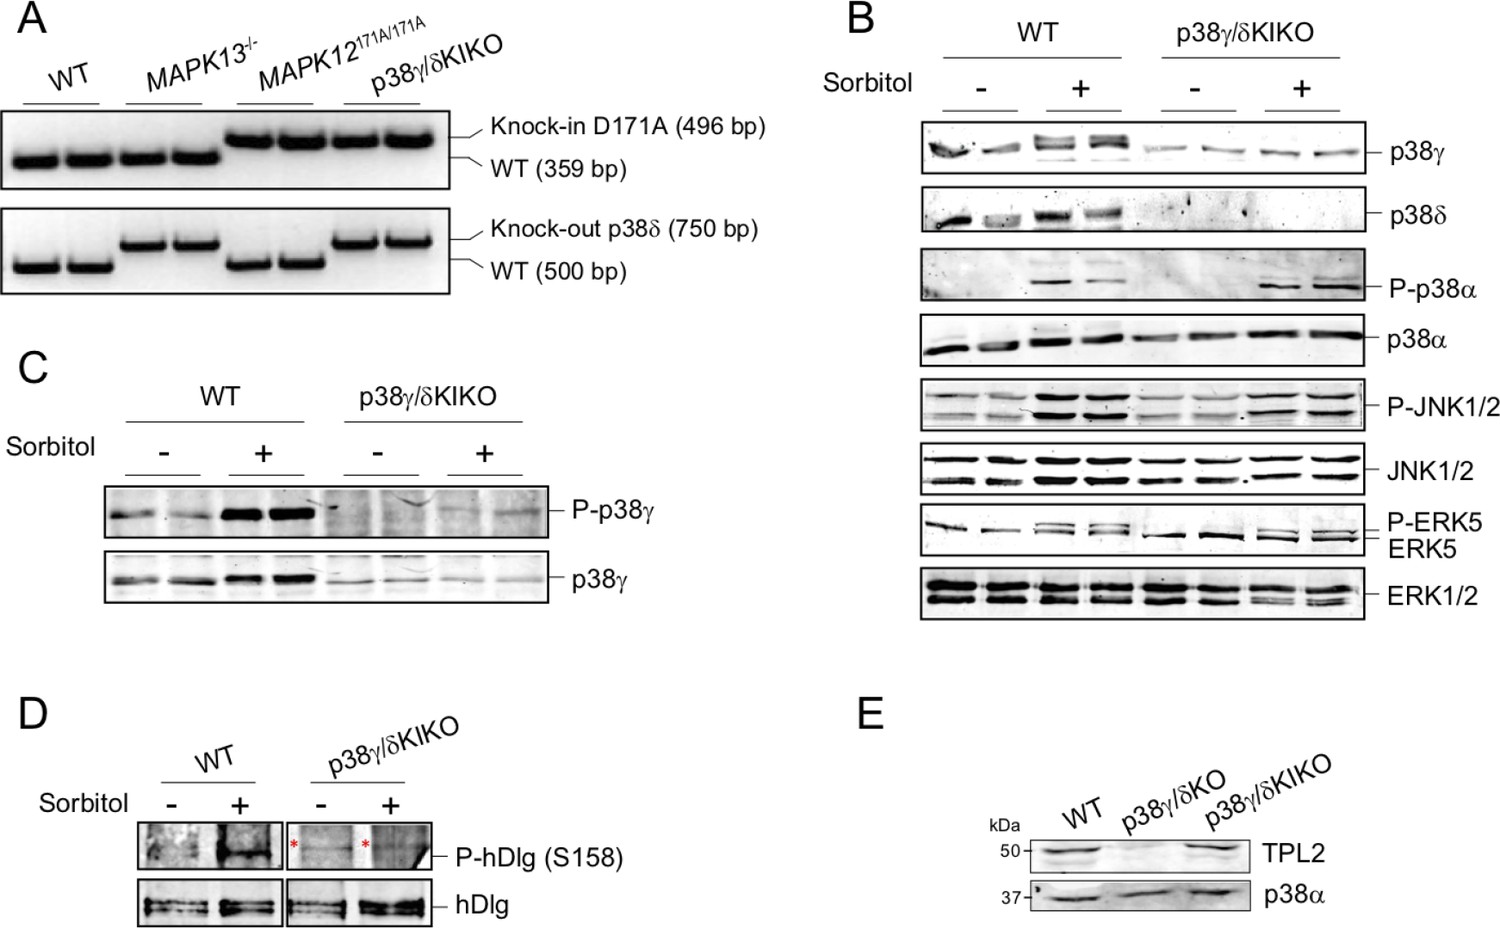
Characterization of the p38γ/δKIKO mouse.
(A) Samples of genomic DNA from wild-type (WT), Mapk13−/−, Mapk12171A/171A, and p38γ/δKIKO purified from tail biopsy were used as templates for PCR as described in methods. (B) WT and p38γ/δKIKO mouse embryonic fibroblasts (MEFs) were exposed to 0.5 M sorbitol (15 min), activation and expression of MAPK were examined in immunoblotted lysates (30 µg) using phospho-specific and specific antibodies for each indicated protein. (C) MEFs were treated as in (B); endogenous p38γ immunoprecipitated with anti-p38γ from 2 mg cell lysate and immunoblotted with the p38 phospho-specific antibody, which recognizes all phosphorylated p38 isoforms. (D) Endogenous hDlg was immunoprecipitated with anti-hDlg from 1 mg MEF lysate (treated as in (B)). Pellets were immunoblotted with the indicated antibodies. Red (*) mark unspecific protein bands. (E) Extracts from WT, p38γ/δKO, and p38γ/δKIKO peritoneal macrophages were immunoblotted using specific antibodies for TPL2 and p38α. Representative blots of two independent experiments are shown in all panels.
-
Figure 1—figure supplement 1—source data 1
Labelled (.pdf) and raw (.tif) western blot images showed in panel A.
- https://cdn.elifesciences.org/articles/86200/elife-86200-fig1-figsupp1-data1-v2.zip
-
Figure 1—figure supplement 1—source data 2
Labelled (.pdf) and raw (.tif,. jpeg) western blot images showed in panel B.
- https://cdn.elifesciences.org/articles/86200/elife-86200-fig1-figsupp1-data2-v2.zip
-
Figure 1—figure supplement 1—source data 3
Labelled (.pdf) and raw (.jpeg) western blot images showed in panel C.
- https://cdn.elifesciences.org/articles/86200/elife-86200-fig1-figsupp1-data3-v2.zip
-
Figure 1—figure supplement 1—source data 4
Labelled (.pdf) and raw (.jpeg) western blot images showed in panel D.
- https://cdn.elifesciences.org/articles/86200/elife-86200-fig1-figsupp1-data4-v2.zip
-
Figure 1—figure supplement 1—source data 5
Labelled (.pdf) and raw (.jpeg) western blot images showed in panel E.
- https://cdn.elifesciences.org/articles/86200/elife-86200-fig1-figsupp1-data5-v2.zip
Figure 2 with 1 supplement
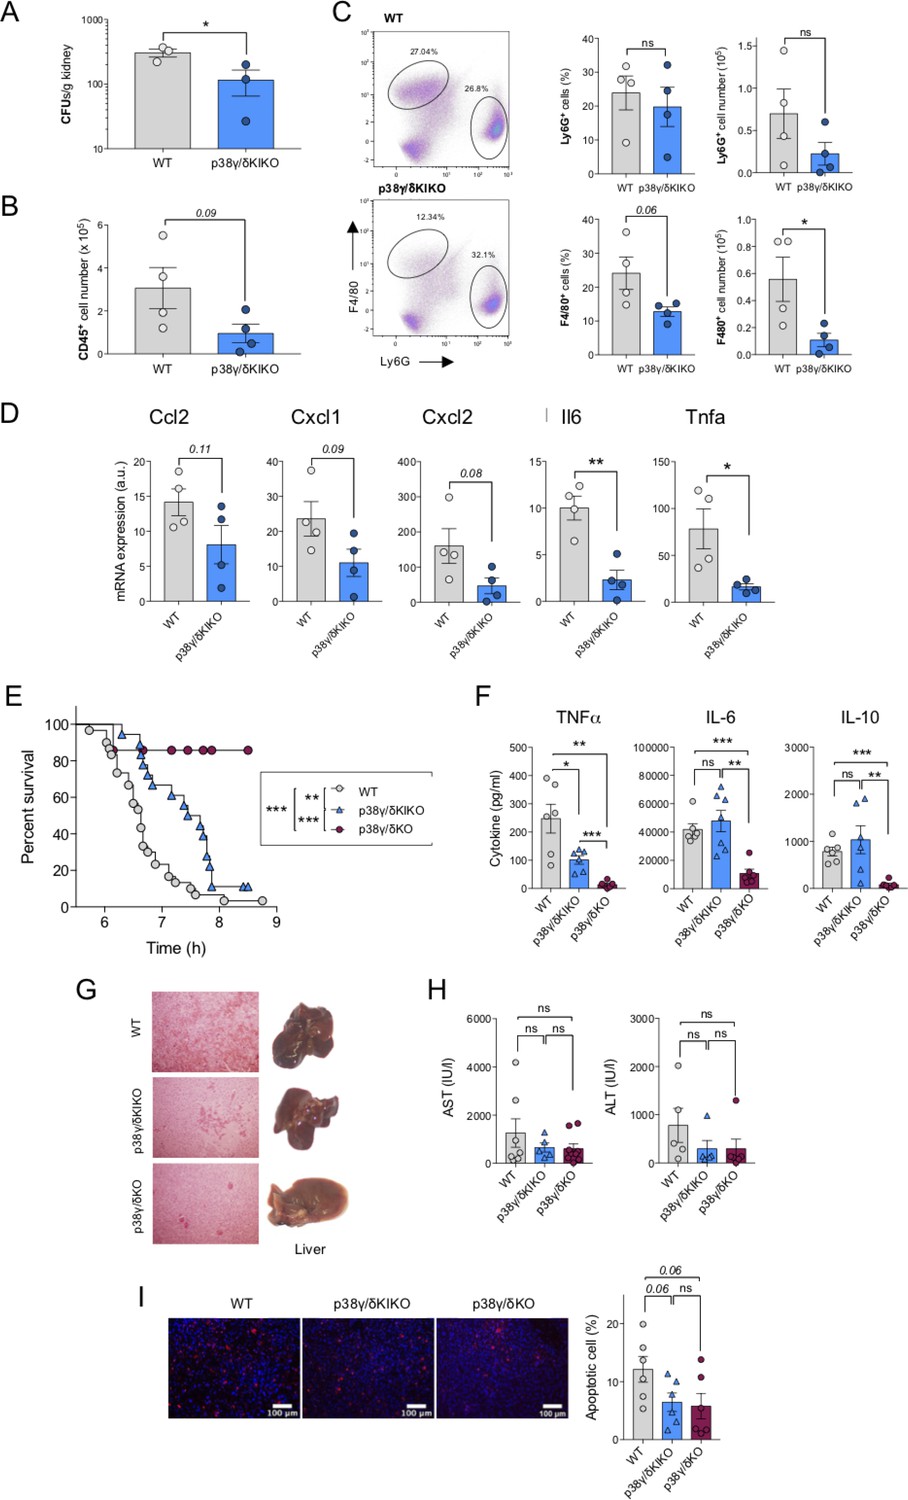
Reduced inflammation in p38γ/δ KIKO mice in response to septic shock.
(A) Wild-type (WT) and p38γ/δKIKO mice were intravenously injected with 1 × 10⁵ CFU of C. albicans. Kidney fungal load was determined 3 days after infection. Each symbol represents an individual mouse. Figure shows mean ± standard error of the mean (SEM), ns not significant; *p ≤ 0.05, relative to WT kidney cells. Kidney cells were stained with (B) anti-CD45, (C) anti -Ly6G and -F4/80 antibodies and positive cells analysed by flow cytometry. CD45+ cells were gated and -F4/80+ and -Ly6G+ cells analysed by flow cytometry. Representative profiles are shown. Each symbol represents an individual mouse. Histograms shows mean ± SEM, ns not significant; *p ≤ 0.05, relative to WT kidney cells. (D) Mice were treated as in (A) and the mRNA levels of indicated genes in the kidney were measured by quantitative PCR (qPCR) 3 days after infection. Each symbol represents an individual mouse. Figure shows mean ± SEM (n = 4 mice/condition). ns, not significant, *p ≤ 0.05, **p ≤ 0.01. (E) WT (n = 31), p38γ/δKO (n = 18), and p38γ/δKIKO (n = 19) mice were injected with lipopolysaccharide (LPS) (50 μg/kg) and D-Gal (1 g/kg), and survival was monitored for up to 9 hr. Graph shows % survival at the indicated times. **p ≤0.01, ***p ≤ 0.001. (F) Serum from mice (E) was collected 2 hr after LPS/D-Gal injection, and TNFα, IL-6, and IL10 were measured in a Luminex cytokine assay. Each symbol represents an individual mouse. Figure shows mean ± SEM (n = 6–7 mice). ns, not significant; *p ≤ 0.05, **p ≤ 0.01, ***p ≤ 0.001. (G) Livers were collected 6 hr after LPS/D-Gal injection. Panels show haematoxylin and eosin (H&E) stained liver sections (left) and whole livers (right). (H) Serum ALT (alanine transaminase) and AST (aspartate aminotransferase) activity at 6 hr after LPS/D-Gal injection. Each symbol represents an individual mouse. Figure shows mean ± SEM (n = 5–7 mice). ns, not significant. (I) Apoptotic TUNEL positive (red) and total nuclei (Hoechst stained-blue) cells were counted using ImageJ programme and the percentage of apoptotic cells calculated. 25 sections per mouse were scored. Representative TUNEL stained liver sections are shown, and figure shows mean ± SEM (n = 6 mice). ns, not significant. Each symbol represents an individual mouse.
Figure 2—figure supplement 1
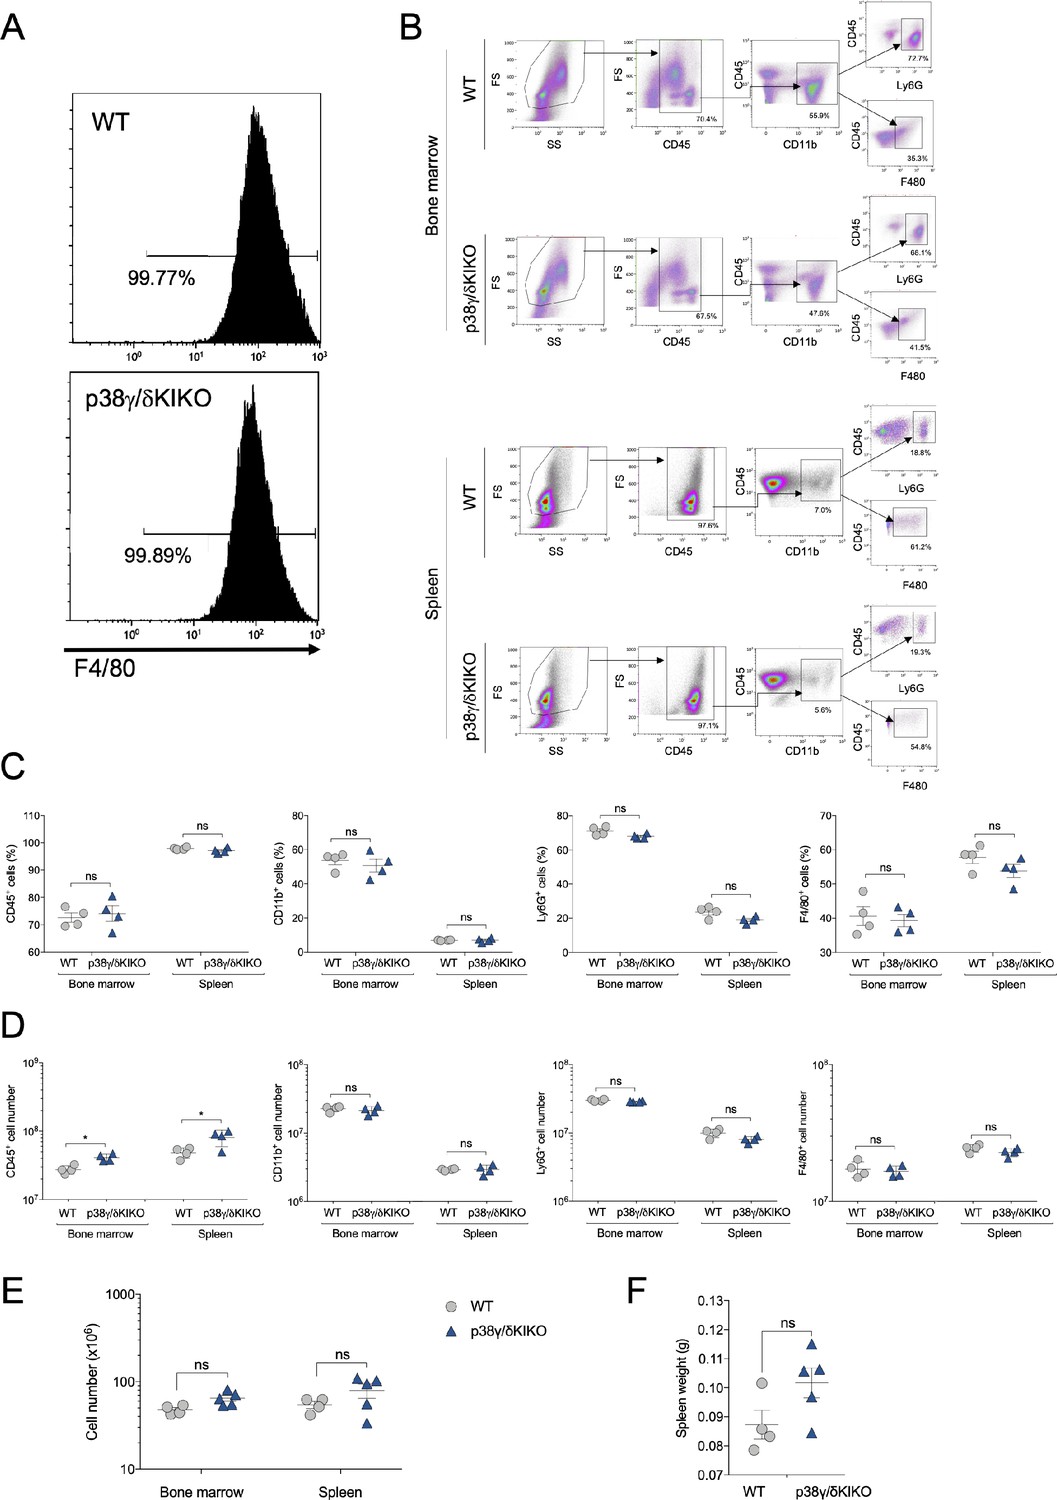
Characterization of immune cell populations of the p38γ/δKIKO mouse in basal conditions.
(A) In vitro bone marrow-derived macrophage (BMDM) development is not affected in p38γ/δKIKO mice. BMDM from wild-type (WT) and p38γ/δKIKO mice was stained with anti-F4/80 antibody, and analysed by flow cytometry. Results are representative plots (n = 3). (B) Bone marrow (BM) or spleen cell suspensions were stained with the indicated antibodies and analysed by flow cytometry. Representative flow cytometry profiles and analysis are shown. (C) Frequency and (D) total cell number of leucocytes (CD45+), myeloid cells (CD11b+), neutrophils (Ly6G+), and macrophages (F4/80+) in adult mouse BM or spleen. Percentage of myeloid cell population was determined relative to CD45+ cell and percentages of neutrophils and macrophages were determined relative to CD45+ CD11b+ cell. (E) Total cell number in BM or spleen of the indicated genotypes. (F) Weight of the spleen of the indicated genotypes. Each dot in C-F represents a single mouse (n = 4–5). ns, not significant; *p ≤ 0.05.
Figure 3 with 1 supplement
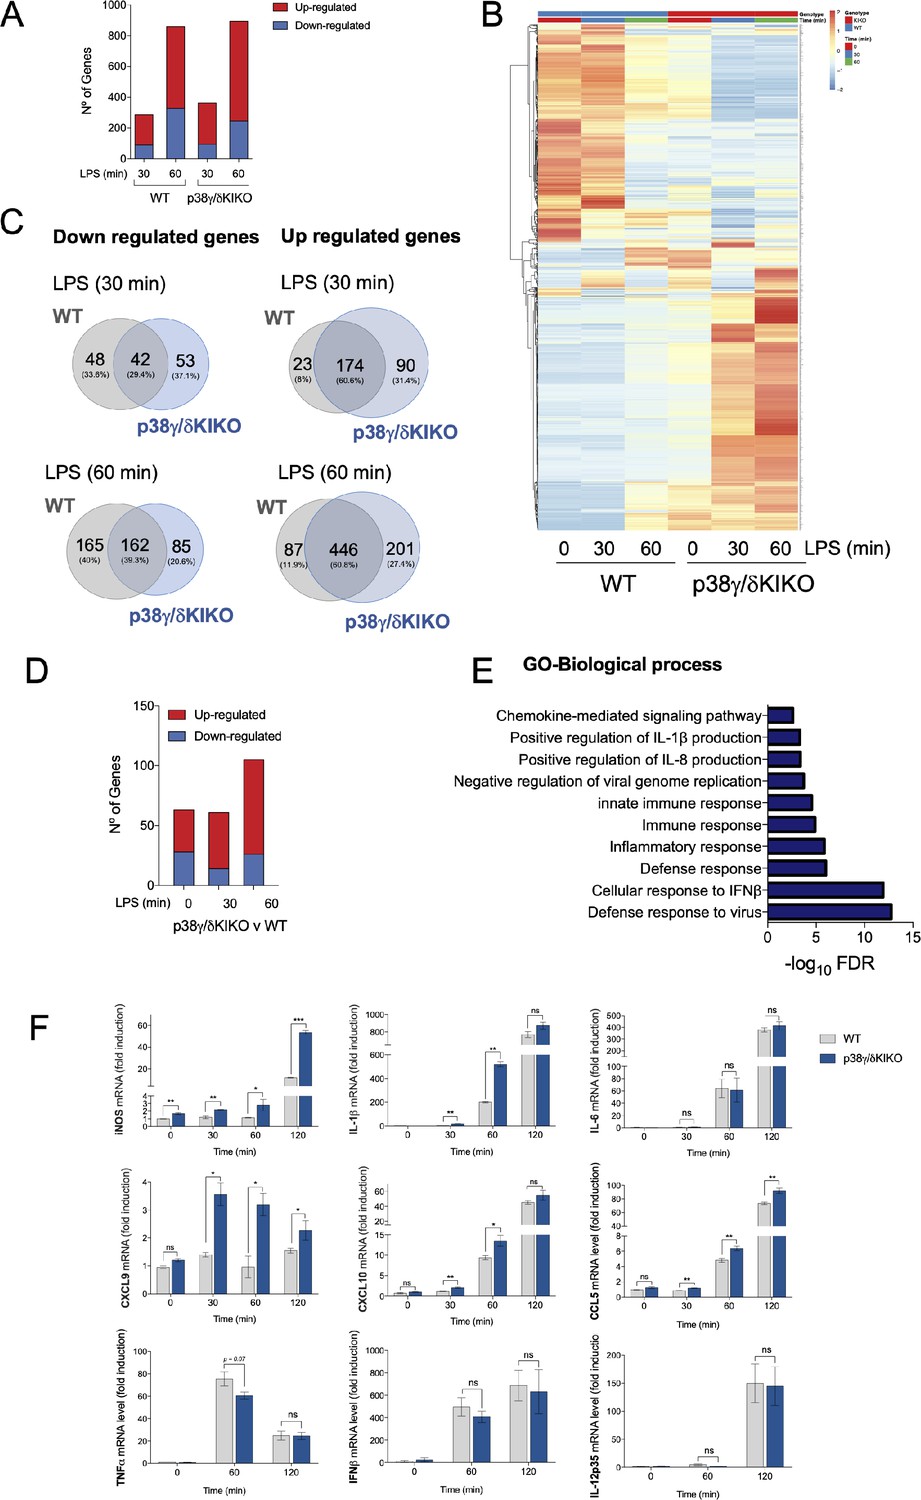
RNA-sequencing analysis in lipopolysaccharide (LPS)-stimulated wild-type (WT) and p38γ/δKIKO macrophages.
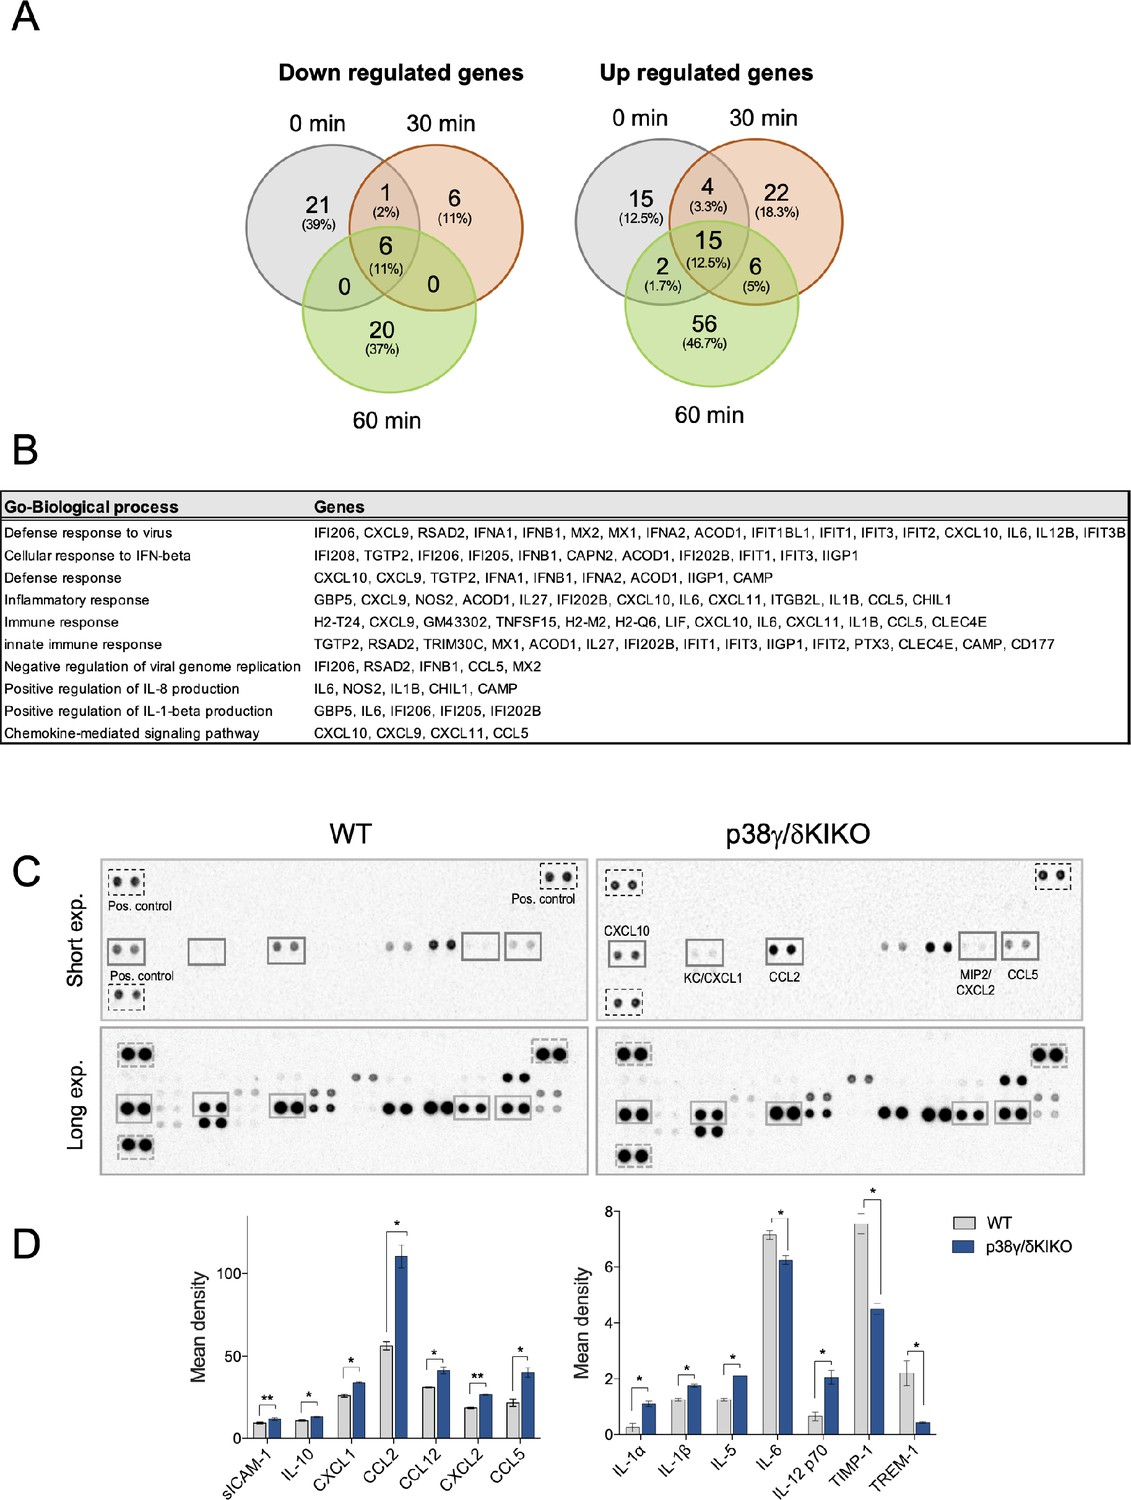
(A) Bone marrow-derived macrophage (BMDM) from WT and p38γ/δKIKO mice was exposed to LPS (100 ng/ml) for 0, 30, and 60 min and gene expression analysed by RNA-sequencing. Bar plot showing the number of differentially expressed genes up- or down-regulated after LPS stimulation (−2 > logFC > 2, p-value <0.05). Three samples per condition were used. (B) Hierarchical heatmap of the differentially expressed genes in panel (A). (C) Venn diagrams showing the overlaps of genes up- or down-regulated over the time course of LPS stimulation in p38γ/δKIKO and WT macrophages. (D) Bar plot showing the number of differentially expressed genes up- or down-regulated (−1.5 > logFC > 1.5, p-value <0.05) in p38γ/δKIKO macrophages compared with WT after LPS stimulation at the indicated times (minutes). Three samples per condition were used. (E) Enrichment analysis of Gene Ontology (GO) biological processes of the differentially expressed genes in LPS-activated p38γ/δKIKO macrophages after LPS stimulation, excluding genes that are common with LPS-treated WT macrophages. (F) BMDM from WT and p38γ/δKIKO mice was exposed to LPS (100 ng/ml) for the indicated times. mRNA expression of indicated genes at different times, relative to WT expression at 0 hr, was determined by quantitative PCR (qPCR) and normalized to Actb mRNA. Data show mean ± standard error of the mean (SEM) (n = 3–6). ns, not significant; *p ≤ 0.05; **p ≤ 0.01, ***p ≤ 0.001, relative to WT mice in the same conditions.
-
Figure 3—source data 1
Excel files of data (raw and processed) showed in panels A–E.
- https://cdn.elifesciences.org/articles/86200/elife-86200-fig3-data1-v2.zip
Figure 3—figure supplement 1
RNA-sequencing analysis and cytokine production in lipopolysaccharide (LPS)-stimulated wild-type (WT) and p38γ/δKIKO macrophages.
(A) Table showing Gene Ontology (GO) biological processes genes. Negatively regulated genes are highlighted in bold. (B) Bone marrow-derived macrophage (BMDM) from WT and p38γ/δKIKO mice was exposed to LPS (100 ng/ml) for 6 hr. Cell culture media (450 µl) from WT and p38γ/δKIKO macrophages were incubated with the Proteome profiler mouse cytokine array membrane according to the manufacturer’s instructions. Proteins were visualized using chemiluminescent detection reagent for 30 s and then performing short exposure (~0.5 min) and long exposure (~5min). (C) Representative membranes are shown. (D) Corresponding quantification by determining pixel densities on the film using ImageJ software. ns, not significant; *p ≤ 0.05; **p ≤ 0.01.
-
Figure 3—figure supplement 1—source data 1
Excel files of data showed in panel A.
- https://cdn.elifesciences.org/articles/86200/elife-86200-fig3-figsupp1-data1-v2.zip
-
Figure 3—figure supplement 1—source data 2
Labelled (.pdf) and raw (.tif) images from the arrays showed in panel B.
- https://cdn.elifesciences.org/articles/86200/elife-86200-fig3-figsupp1-data2-v2.zip
Figure 4 with 2 supplements

Identification of proteins phosphorylated by p38γ/p38δ.
(A) Peritoneal macrophages from wild-type (WT), p38γ/δKO, and p38γ/δKIKO mice were exposed to lipopolysaccharide (LPS) (100 ng/ml) for 0 or 60 min and phosphorylated peptides identified. Heatmap showing differentially phosphorylated phosphosites up- or down-regulated after LPS stimulation. Volcano plots showing the differential phosphoproteome and statistical significance between (B) p38γ/δKIKO and WT (n = 3), and (C) p38γ/δKO and WT (n = 3) macrophages treated with LPS for 60 min. Examples of significantly enriched up-regulated (red) and down-regulated (blue) phosphosites are shown (−1.0 > logFC > 1.0, p-value <0.05). (D) Venn diagrams showing the overlaps of differentially phosphorylated proteins (up- or down-regulated) at 60-min LPS stimulation in p38γ/δKIKO and p38γ/δKO macrophages compared to WT. (E) Recombinant GST-MEF2D was incubated with active recombinant p38α, p38β, p38γ, or p38δ for 60 min in a phosphorylation reaction mix containing Mg-[γ32P]ATP, as described in Materials and methods. The activity of recombinant p38α, p38β, p38γ, or p38δ was matched using myelin basic protein (MBP) as substrate and 0.5 U/ml were used in the assay. Reaction was stopped with sodium dodecyl sulfate (SDS)-sample buffer. Samples were resolved in SDS–polyacrylamide gel electrophoresis (PAGE), subjected to Coomassie blue staining and autoradiography. (F) Bands corresponding to 32P-MEF2D from panel (E) were quantified. Data show mean ± standard error of the mean (SEM) from two experiments in duplicate. ns, not significant *p ≤ 0.05; ***p ≤ 0.001, relative to MEF2D phosphorylation by p38α. (G) Recombinant MBP was incubated with active (0.5 U/ml) recombinant p38α, p38β, p38γ, or p38δ for 60 min in a phosphorylation reaction mix containing Mg-[γ32P]ATP, as described in Materials and methods. (H) Schematic representation of the sites in MEF2D phosphorylated by p38α and/or p38δ, all of them located in the transactivation domain.
-
Figure 4—source data 1
Excel file of data showed in panels A–D and in Figure 4—figure supplement 1 panel C.
- https://cdn.elifesciences.org/articles/86200/elife-86200-fig4-data1-v2.xlsx
Figure 4—figure supplement 1
Identification of proteins phosphorylated by p38γ/p38δ.
(A) Peritoneal macrophages from wild-type (WT), p38γ/δKO, and p38γ/δKIKO mice were exposed to lipopolysaccharide (LPS) (100 ng/ml) for the indicated times. Cell lysates (30 μg) were immunoblotted with the indicated antibodies to active phosphorylated p38α (P-p38α) and ERK1/2 (P-ERK1/2). Total protein levels of p38α and ERK1/2 were also measured in the same lysates. Representative blots of two independent experiments with similar results are shown. (Lower panel) Intensity of the bands corresponding to Phospho-p38α and Phospho-ERK1/2 (upper panel A) were quantified. Data are presented as arbitrary units (a.u.). (B) Peritoneal macrophages and bone marrow-derived macrophage (BMDM) from WT, p38γ/δKO, and p38γ/δKIKO mice were exposed to LPS (100 ng/ml) for the indicated times. Relative mRNA expression of indicated genes at different times was determined by quantitative PCR (qPCR) and normalized to Actb mRNA. Data show mean ± standard error of the mean (SEM) (n = 3–6). *p ≤ 0.05; **p ≤ 0.01, ***p ≤ 0.001, relative to WT mice in the same conditions. (C) Phosphorylated peptides from LPS-stimulated macrophages were identified. Volcano plots show the phosphoproteome statistical significance in LPS-treated macrophages between times 0 and 60. n = 3 per condition.
-
Figure 4—figure supplement 1—source data 1
Labelled (.pdf) and raw (.jpeg) western blot images showed in panel A.
- https://cdn.elifesciences.org/articles/86200/elife-86200-fig4-figsupp1-data1-v2.zip
Figure 4—figure supplement 2
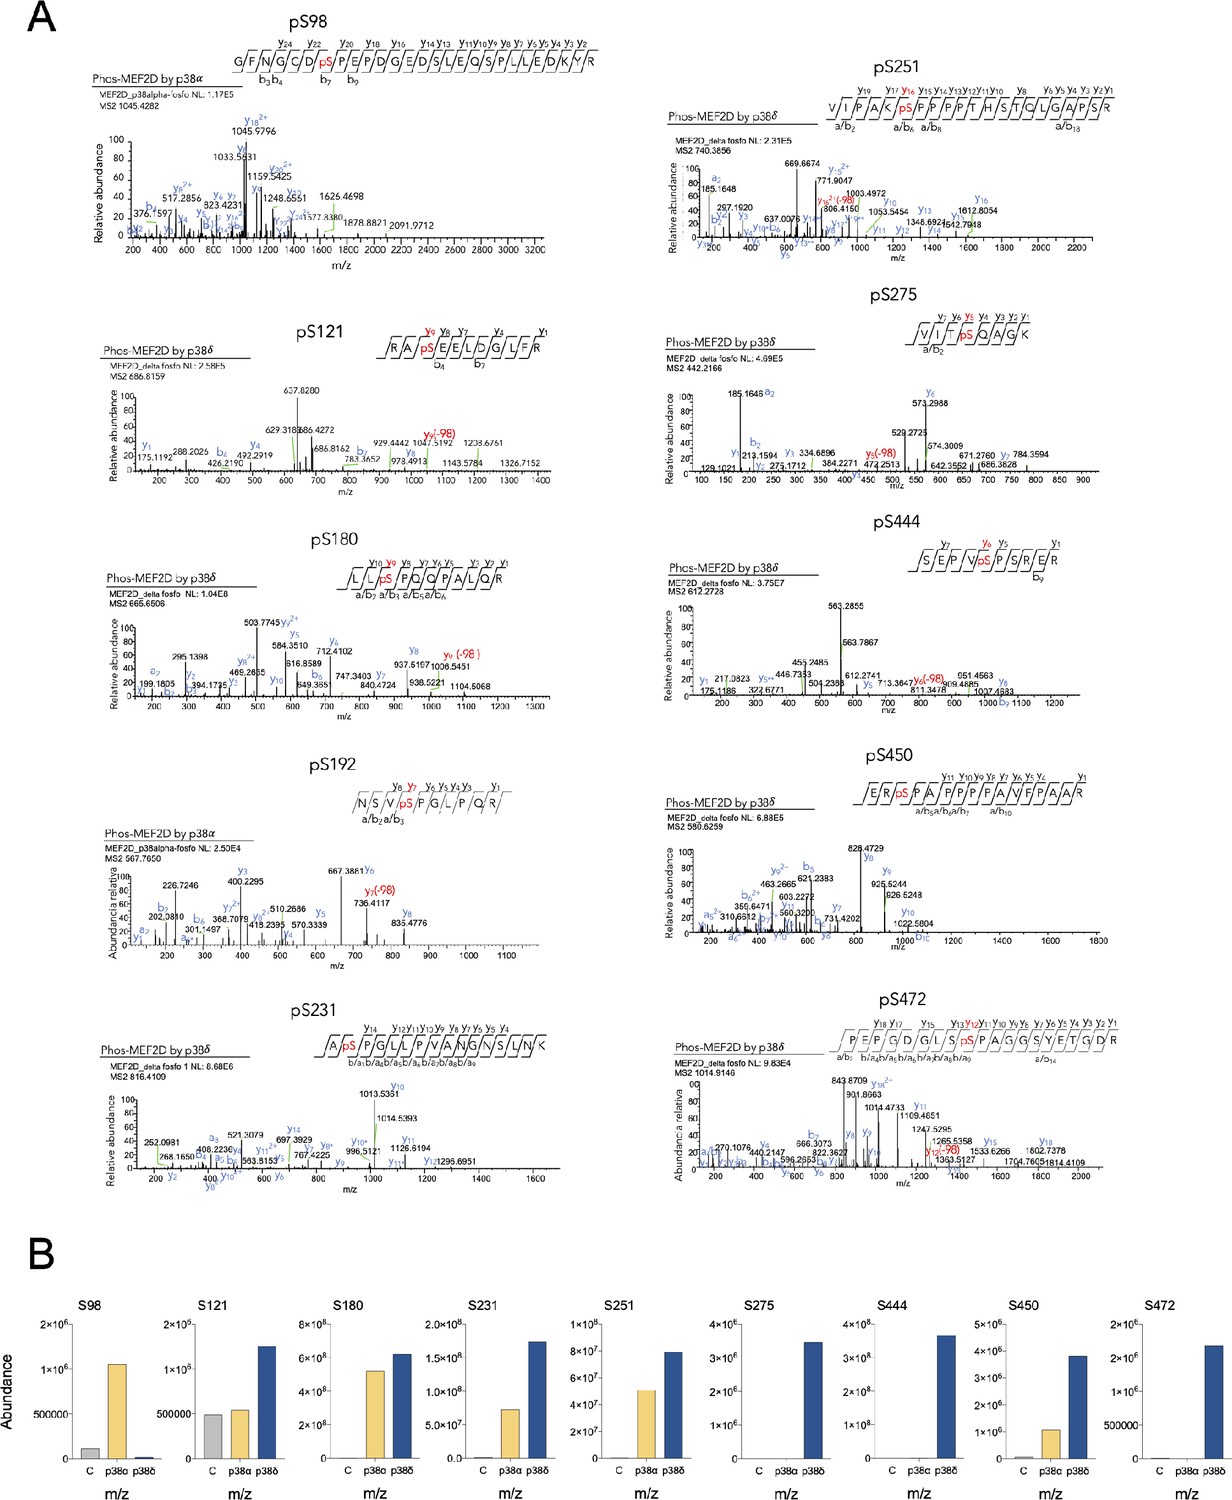
Identification of myocyte enhancer factor-2D (MEF2D) residues phosphorylated in vitro by p38α and p38δ.
(A) Liquid chromatography–mass spectrometry (LC–MS)/MS analysis of the m/z ion of the phosphorylated MEF2D peptide (amino acids and phosphopeptide sequences are indicated, where pS (red) indicates phosphorylated serine). (B) The intensity of the MEF2D-derived phosphopeptides was expressed as abundance of the corresponding m/z.
-
Figure 4—figure supplement 2—source data 1
Excel file of data showed in Figure 4—figure supplement 2.
- https://cdn.elifesciences.org/articles/86200/elife-86200-fig4-figsupp2-data1-v2.zip
Figure 5
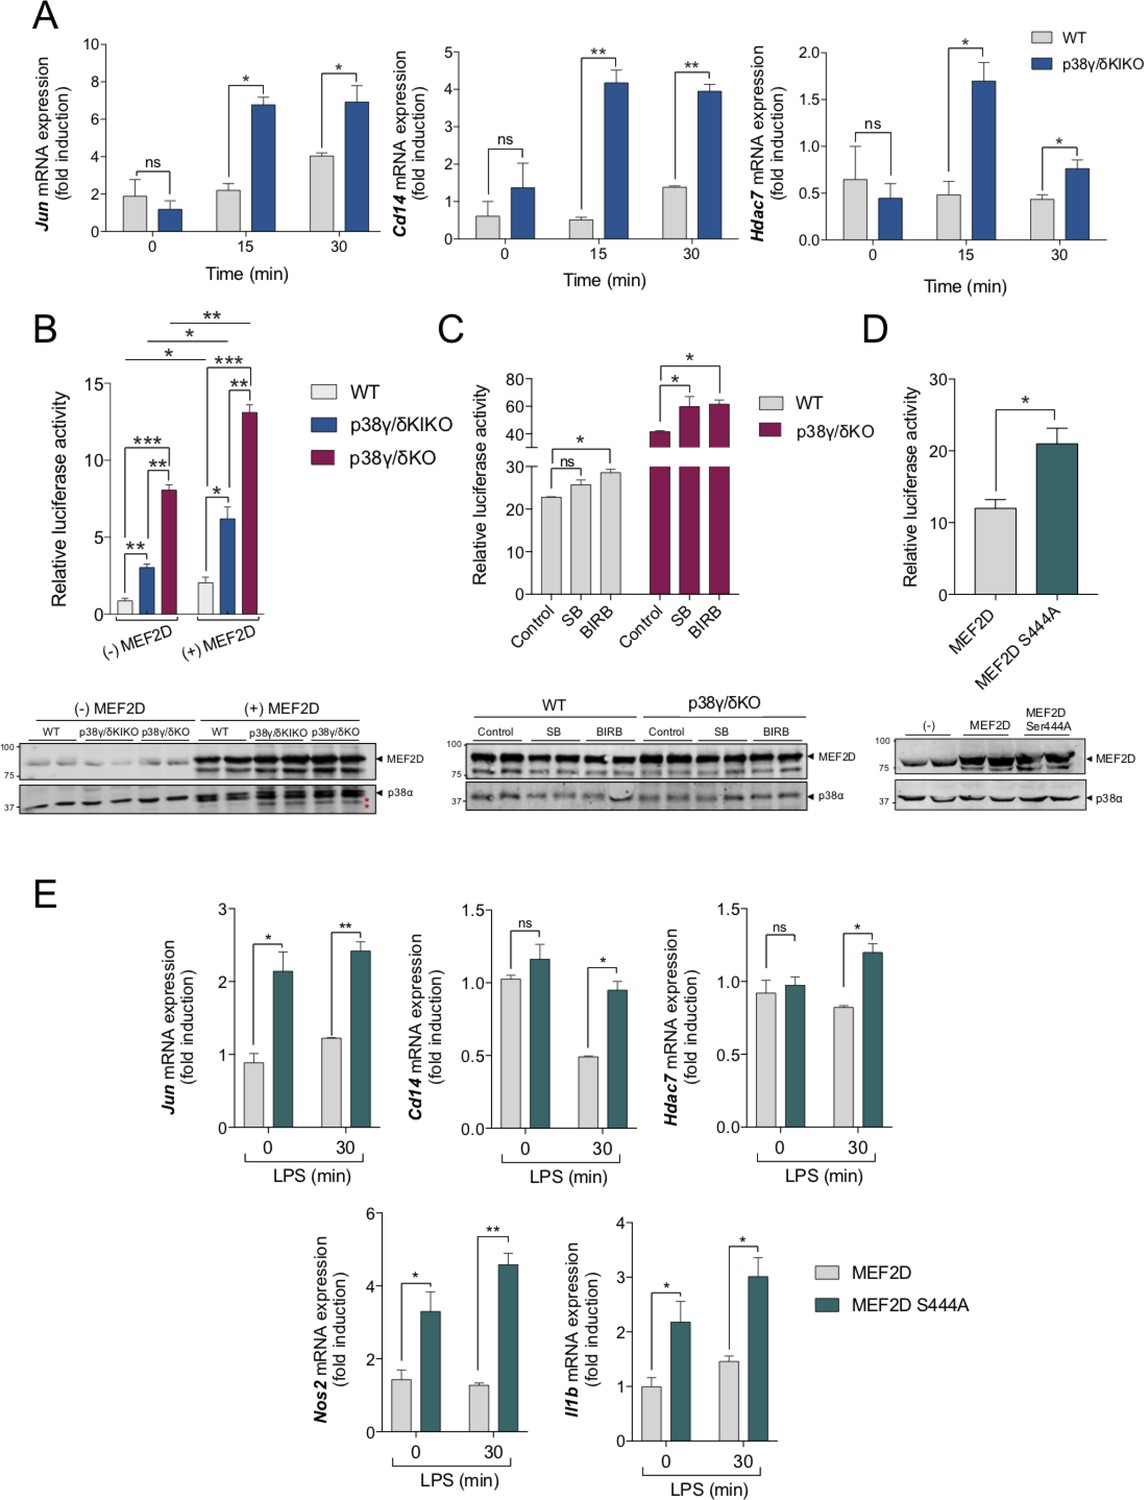
Regulation of myocyte enhancer factor-2D (MEF2D) transcriptional activity by p38γ and p38δ and S444 phosphorylation.
(A) Bone marrow-derived macrophage (BMDM) from wild-type (WT) and p38γ/δKIKO mice was exposed to lipopolysaccharide (LPS) (100 ng/ml) for the indicated times. Relative mRNA expression of Jun, Cd14, and Hdac7 genes at different times was determined by quantitative PCR (qPCR). Results were normalized to Actb RNA expression and fold induction was calculated relative to WT expression at 0 min. Figure shows mean ± standard error of the mean (SEM) from two experiments in triplicate. ns, not significant; *p ≤ 0.05 and **p ≤ 0.01, relative to WT mice in the same conditions. (B) WT, p38γ/δKIKO, and p38γ/δKO fibroblasts were co-transfected either with plasmids coding for Flag-MEF2D, Renilla, and luciferase firefly gene under the control of MEF2 response elements ((+) MEF2D), or with plasmids encoding for Renilla and luciferase firefly ((−) MEF2D). (Upper panel) Luciferase activity values were normalized against Renilla. Figure shows mean ± SEM from one representative experiment in triplicate. This experiment was repeated twice more with similar result. ns, not significant; *p ≤ 0.05; **p ≤ 0.01; ***p ≤ 0.001. (Lower panel) Cell lysates (10 μg) were immunoblotted with the indicated antibodies to total protein levels of MEF2D and p38α. Representative blots of two independent experiments with similar results are shown. Molecular weights are indicated. (*) unspecific band (C) WT and p38γ/δKO fibroblasts were transfected as in (B). Cells were incubated with the indicated p38MAPK inhibitor (or Dimethyl sulfoxide [DMSO] as control) for 6 hr before lysis. SB203580 (SB) at 10 µM and BIRB796 (BIRB) at 10 µM. (Upper panel) Luciferase activity was calculated as in (B). (Lower panel) Cell lysates (10 μg) were immunoblotted as in panel B. (D) WT fibroblasts were transfected with plasmid Flag-MEF2D or Flag-MEF2DS444A, plus plasmids coding Renilla and luciferase firefly gene under the control of MEF2 response elements. (Lower panel) Luciferase activity values were normalized against Renilla. Figure shows mean ± SEM from one representative experiment in triplicate. This experiment was repeated twice more with similar result. *p ≤ 0.05. (Lower panel) Cell lysates (50 μg) were immunoblotted as in panel B. (E) WT fibroblasts were transfected with Flag-MEF2D or Flag-MEF2DS444A, and stimulated with LPS for 30 min. Relative mRNA expression of the indicated genes was determined by qPCR. Results were normalized to Actb RNA expression and fold induction was calculated relative to that in cells expressing Flag-MEF2D WT at time 0 of LPS. Figure shows mean ± SEM from two experiments in triplicate. *p ≤ 0.05.
-
Figure 5—source data 1
Labelled (.ppt) western blot images showed in panel B.
- https://cdn.elifesciences.org/articles/86200/elife-86200-fig5-data1-v2.zip
-
Figure 5—source data 2
Labelled (.ppt) western blot images showed in panel C.
- https://cdn.elifesciences.org/articles/86200/elife-86200-fig5-data2-v2.zip
-
Figure 5—source data 3
Labelled (.ppt) western blot images showed in panel D.
- https://cdn.elifesciences.org/articles/86200/elife-86200-fig5-data3-v2.zip
Author response image 1

(Left panel) WT (n = 8) and LysMCre-p38γ/δ-/- (n= 7) mice were injected with LPS (20 μg/g), and survival was monitored for up to 5 days.
Graph shows % survival at the indicated times. (Right panel) 30 μg of protein lysates from WT and LysMCre-p38γ/δ-/- peritoneal macrophage were immunoblotted with the indicated antibodies to total p38γ, p38δ, and tubulin as loading control. (*) unspecific band.
Tables
Table 1
Sites on myocyte enhancer factor-2D (MEF2D) phosphorylated by p38α or p38δ in vitro.
Human GST-MEF2D was incubated in a phosphorylation reaction mix containing Mg-ATP in the absence (control) or the presence of p38α or p38δ, and subjected to sodium dodecyl sulfate–polyacrylamide gel electrophoresis (SDS–PAGE). Phosphorylated MEF2D was excised from the gel, digested with trypsin and peptides separated as indicated in Materials and methods. Phosphorylated residues were identified by liquid chromatography–mass spectrometry (LC–MS)/MS. Peptides containing the phosphorylated residues are shown. Phosphorylated residues are indicated as pS in red, deaminated residues are indicated as (deam) in blue. (-) no or poor phosphorylation detected; (+) phosphorylation detected; (++) strong phosphorylation detected.
| Protein phospho-site (Q14814) | Phosphopeptide | Control | p38α | p38δ |
|---|---|---|---|---|
| S98 | KGFNGCDPEPDGEDSLEQSPLLEDK | + | +++ | - |
| KGFNGCDPEPDGEDSLEQSPLLEDK | ||||
| GFNGCDPEPDGEDSLEQSPLLEDK | ||||
| GFNGCDPEPDGEDSLEQSPLLEDKYR | ||||
| S121 | RAEELDGLFR | + | + | +++ |
| S180 | LLPQQPALQR | - | +++ | +++ |
| S192 | NSVPGLPQR | - | + | - |
| S231 | APGLLPVANGNSLNK | - | + | +++ |
| APGLLPVANGNSLNK | ||||
| APGLLPVANGNSLNK | ||||
| S251 | VIPAKPPPPTHSTQLGAPSR | - | +++ | +++ |
| PPPPTHSTQLGAPSR | ||||
| S275 | VITQAGK | - | - | +++ |
| S444 | SEPVPSRER | - | - | +++ |
| S450 | ERPAPPPPAVFPAAR | - | + | +++ |
| S472 | PEPGDGLSPAGGSYETGDR | - | - | +++ |
Table 2
Information about the antibodies used in this study.
| Antibody | Name | Provider | Method | Dilution |
|---|---|---|---|---|
| P-ERK1/2 | Phospho-p44/42 MAPK (Erk1/2) (Thr202/Tyr204) Antibody | Cell Signaling | WB | 1/2000 |
| ERK1/2 | p44/42 MAPK (Erk1/2) Antibody | Cell Signaling | WB | 1/1000 |
| TPL2 | Cot (M-20) | Santa Cruz Biotechnology, Inc | WB | 1/1000 |
| ABIN2 | ABIN2 antibody | S.C. Ley laboratory | WB | 2 µg/ml |
| P-p38 | Phospho-p38 MAP Kinase (Thr180/Tyr182) Antibody | Cell Signaling | WB | 1/1000 |
| p38α | p38α (C-20) | Santa Cruz Biotechnology, Inc | WB | 1/1000 |
| p38γ | p38γ (GST-SAPK3) S524A 1st Bleed | DSTT* | WB | 1/1000 |
| p38δ | p38δ (GST-SAPK4) S526A 3rd Bleed | DSTT* | WB | 1/1000 |
| P-JNK1/2 | Rabbit (polyclonal) Anti-JNK1&2 [pTpY183/185] Phosphospecific Antibody, Unconjugated | Biosource | WB | 1/1000 |
| JNK1/2 | SAPK/JNK | Cell Signaling | WB | 1/1000 |
| P-p105 | Phospho-NF-κB p105 (Ser933) (18E6) Rabbit mAb | Cell Signaling | WB | 1/1000 |
| p105 | NF-κB1 p105 Antibody | Cell Signaling | WB | 1/1000 |
| hDlg | hDlg (SAP97) antibody | DSTT* | WB | 1/1000 |
| P-hDlg (S158) | Phospho-hDlg (SAP97) Ser158 | DSTT* | WB | 1/1000 |
| hDlg | hDlg (SAP97) antibody | DSTT* | IP | 1 μg/IP |
| p38γ | p38γ (SAPK3 C-Terminal) [KPPRNLGARVPKETA] | DSTT* | IP | 2 μg/IP |
| CD45 | CD45 Monoclonal Antibody (30-F11), APC #17-0451-82 | eBioscience | FAC | 1/100 |
| F4/80 | F4/80 Monoclonal Antibody (BM8) FITC #11-4801-85 | eBioscience | FAC | 1/100 |
| Ly6G | PE Rat Anti-Mouse Ly-6G Clone 1A8 (RUO) #551461 | BD Bioscience | FAC | 1/50 |
-
*
DSTT (Dundee): Division of Signal Transduction Therapy; University of Dundee (Dundee, UK).
Table 3
Primer sequences used for gene expression.
| Gene | Forward (5′–3′) | Reverse (5′–3′) |
|---|---|---|
| Tnfa | TTGAGATCCATGCCGTTG | CTGTAGCCCACGTCGTAGC |
| Il1b | TGGTGTGTGACGTTCCCATT | CAGCACGAGGCTTTTTTGTTG |
| Il6 | GAGGATACCACTCCCAACAGACC | AAGTGCATCATCGTTGTTCATACA |
| Ifnb1 | TCAGAATGAGTGGTGGTTGC | GACCTTTCAAATGCAGTAGATTCA |
| Nos2 | CAGCTGGGCTGTACAAACCTT | CATTGGAAGTGAAGCGTTTCG |
| Il12a | CCACCCTTGCCCTCCTAAA | GGCAGCTCCCTCTTGTTGTG |
| Ccl5 | ATATGGCTCGGACACCACTC | TTCTTCGAGTGACAAACACG |
| Cxcl9 | TGCACGATGCTCCTGCA | AGGTCTTTGAGGGATTTGTAGTGG |
| Cxcl10 | GGATCCCTCTCGCAAGGA | ATCGTGGCAATGATCTCAACA |
| Cxcl1 | CCTTGACCCTGAAGCTCCCT | CGGTGCCATCAGAGCAGTCT |
| Ccl2 | TCTGGGCCTGCTGTTCACA | TTGGGATCATCTTGCTGGTG |
| Cxcl2 | CCTGGTTCAGAAAATCATCCA | CTTCCGTTGAGGGACAGC |
| Jun | GCACATCACCACTACACCGA | GGGAAGCGTGTTCTGGCTTAT |
| Cd14 | CATTTGCATCCTCCTGGTTTCTGA | GAGTGGTTTTCCCCTTCCGTGTG |
| Hdac7 | CGCAGCCAGTGTGAGTGTCT | AGTGGGTTCGTGCCGTAGAG |
| Actb | AAGGAGATTACTTGCTCTGGCTCCTA | ACTCATCGTACTCCTGCTTGCTGAT |
Additional files
Download links
A two-part list of links to download the article, or parts of the article, in various formats.
Downloads (link to download the article as PDF)
Open citations (links to open the citations from this article in various online reference manager services)
Cite this article (links to download the citations from this article in formats compatible with various reference manager tools)
p38γ and p38δ modulate innate immune response by regulating MEF2D activation
eLife 12:e86200.
https://doi.org/10.7554/eLife.86200


