Regulation of nuclear transcription by mitochondrial RNA in endothelial cells
- Department of Diabetes Complications and Metabolism, City of Hope, United States
- Irell and Manella Graduate School of Biological Sciences, City of Hope, United States
- Department of Bioengineering, University of California San Diego, United States
- Department of Genetics, Yale University School of Medicine, United States
- Translura, Inc, United States
- Department of Stem Cell Biology and Regenerative Medicine, City of Hope, United States
- Department of Bioengineering, University of California Riverside, United States
- Department of Hematology & Hematopoietic Cell Transplantation, Department of Immuno-oncology, City of Hope, United States
- Department of Diabetes, Endocrinology, and Metabolism, City of Hope, United States
Figures
Figure 1
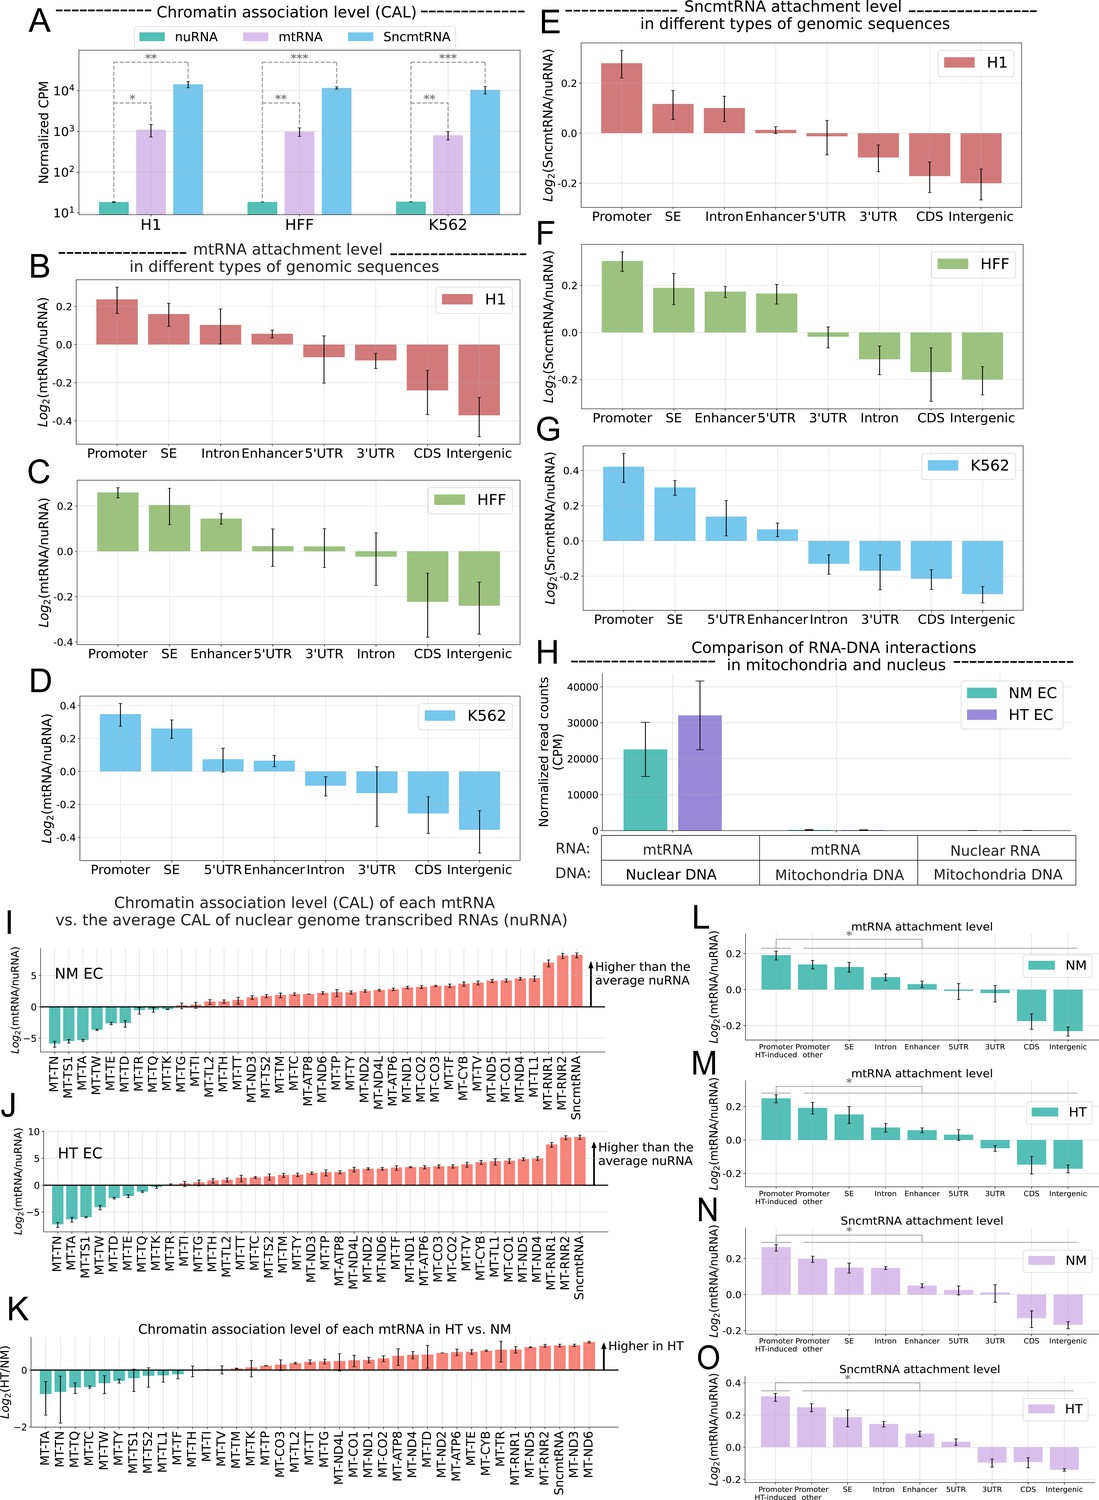
Effect of SncmtRNA KDAssociation of mtRNA with chromatin.
(A) Chromatin association levels (CAL) of nuclear genome-transcribed RNA (nuRNA) (blue), mtRNA (green), and the SncmtRNA (purple) in H1 embryonic stem cells (H1), foreskin fibroblasts (HFF), and K562 lymphoblasts (K562) (columns). CAL is estimated by the normalized counts per million (CPM) of iMARGI RNA-end read counts. *p-value<0.05, **p-value <0.01, ***p-value <0.001. Normalized CAL of mtRNA (y-axis) on eight types of genomic sequences (columns) in H1 (B), HFF (C), and K562 (D) Log2(mtRNA/nuRNA): the log ratio of mtRNA and nuRNA read counts in the iMARGI RNA-end reads. SE: super enhancer; UTR: untranslated region; CDS: coding sequence. Normalized CAL of the SncmtRNA (y-axis) on eight types of genomic sequences (columns) in H1 (E), HFF (F), and K562 (G) Log2(SncmtRNA/nuRNA): the log ratio of SncmtRNA and nuRNA read counts in the iMARGI RNA-end reads. (H) Normalized numbers of iMARGI read pairs (y-axis) mapped to mtRNA and nuclear DNA (first two columns), mtRNA and mitochondrial DNA (middle two columns), and nuRNA and mitochondrial DNA (last two columns) in normal mannitol control (NM)- (green) and high glucose and TNFa (HT)-treated (purple) endothelial cells (ECs). Comparison of the CAL of each mtRNA (column) and the average CAL of all nuRNA in NM (I) and HT EC (J). y-Axis: the log ratio of mtRNA and nuRNA read counts in the iMARGI RNA-end reads. y > 0 indicates that this mtRNA (column) exhibits a higher level of chromatin association than the average CAL of the nuRNA. (K) Comparison of the CAL of each mtRNA (column) between NM- and HT-treated EC. Log2(HT/NM): log ratio of CAL between HT and NM per each mtRNA. y > 0 indicates higher CAL in HT vs NM. Normalized CAL of mtRNAs (L, M) and SncmtRNA (N, O) on different types of genomic sequences in ECs under NM or HT. Promoter HT-induced: the promoters of 312 HT-induced upregulated genes. Log2(mtRNA/nuRNA): the log ratio of mtRNA and nuRNA read counts in the iMARGI RNA-end reads. Data plotted from n = 2 biological replicates.
Figure 2 with 5 supplements
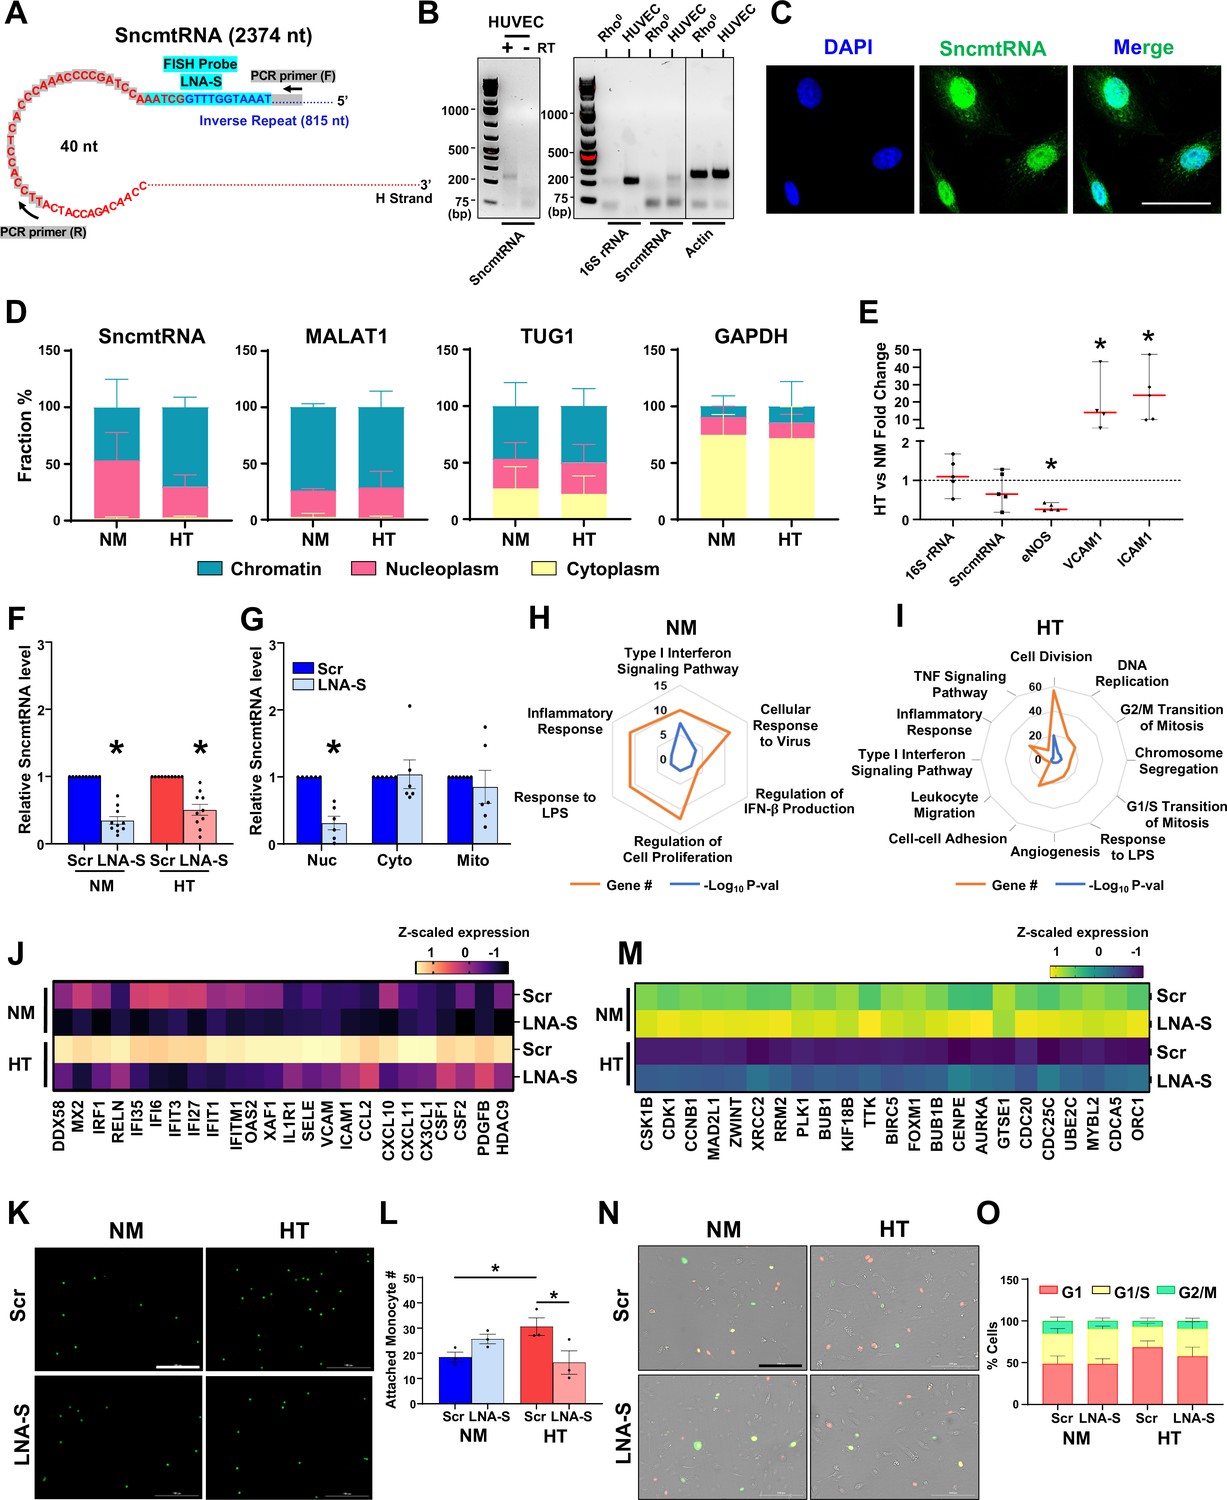
SncmtRNA knockdown affects endothelial cell (EC) expression and function.
(A) Putative SncmtRNA structure and the location of LNA-GapmeR target region (LNA-S) and PCR primers. (B) PCR of SncmtRNA. Left: ECs with (+) or without (−) reverse transcription (RT). Right: ECs in comparison with Rho0 cells, with 16S rRNA and β-actin detected as controls. (C) Fluorescence in situ hybridization (FISH) images of SncmtRNA in ECs, with 4',6-diamidino-2-phenylindole (DAPI) staining nuclei. Scale bar = 50 µm. (D, E) ECs were maintained in normal glucose + 25 mM mannitol (NM) or high glucose + TNFα (HT) for 72 hr. (D) RT-qPCR of respective RNAs in subcellular fractions. Data plotted as mean ± standard error of the mean (SEM) from three independent experiments. (E) RT-qPCR of various RNAs in whole cells, with levels in NM set at 1. Data represent mean ± SEM from five independent experiments. RT-qPCR of SncmtRNA in (F) total ECs transfected with scramble (Scr) or SncmtRNA-targeting (LNA-S) LNA GapmeRs under NM and HT and in (G) subcellular fractions (nucleus, cytoplasm, and mitochondria) from ECs transfected with Scr or LNA-S and kept under NM. Data plotted as mean ± SEM from six independent experiments. (H–O) ECs treated as in (F) were profiled by bulk RNA-seq (n = 2 biological replicates). (H, I) Radar plots showing Gene Ontology (GO) terms enriched in differentially expressed genes (DEGs) due to Snc-KD under NM or HT. Each vertex indicates the enriched GO term. Orange vertex indicates the number of DEGs enriched in the given GO terms and blue vertex indicates −log10 p value. Heatmap showing z-scaled expression in transcripts per million (TPM) of innate immune and inflammatory genes induced by HT and suppressed by Snc-KD in (J) and cell cycle genes suppressed by HT and rescued upon Snc-KD in (M). (K, L, N, O) Representative images and quantification of fluorescently labeled monocytes adhesion to human umbilical vein endothelial cells (HUVECs) (in K, L) and fluorescence ubiquitination cell cycle indicator (FUCCI) assay showing ECs in various phases of cell cycle (in N, O). Scale bar = 200 µm. Data plotted as mean ± SEM from three and five independent experiments. *p < 0.05 as compared to NM (in E) or Scr (in F, G) or as indicated (in L).
-
Figure 2—source data 1
Uncropped gel image for Figure 2B (left panel): SncmtRNA PCR product in the presence (+) or absence (−) of reverse transcriptase (RT).
The expected PCR product formed in presence of RT (+) is indicated in solid red box and the gel image used for Figure 2B is indicated in dashed red box.
- https://cdn.elifesciences.org/articles/86204/elife-86204-fig2-data1-v1.pptx
-
Figure 2—source data 2
Uncropped gel image for Figure 2B (right panel): reverse transcription (RT)-PCR products of 16S rRNA, SncmtRNA, and β-actin generated using total RNA isolated from Rho0 cells or human umbilical vein endothelial cells (HUVECs).
The PCR products formed for 16S rRNA, SncmtRNA, and β-actin are indicated in solid red box and gel image sections used for Figure 2B are indicated in dashed red box.
- https://cdn.elifesciences.org/articles/86204/elife-86204-fig2-data2-v1.pptx
-
Figure 2—source data 3
Raw gel images for Figure 2B.
- https://cdn.elifesciences.org/articles/86204/elife-86204-fig2-data3-v1.zip
Figure 2—figure supplement 1

MT-RNR2-derived SncmtRNA and HT-regulated mitochondrial morphology and transcription.
(A) Schematic showing MT-RNR2-derived transcripts including 16S rRNA, SncmtRNA, ASncmtRNA-1, and ASncmtRNA-2. (B) Sanger sequencing of reverse transcription (RT)-PCR product from endothelial cells (ECs) using the indicated primers of SncmtRNA confirmed the putative chimeric junction. (C) Representative fluorescence in situ hybridization (FISH) images performed with a FAM-labeled Scramble probe in human umbilical vein endothelial cells (HUVECs). Scale bar = 50 µm. (D, F) Expression of nuclear-encoded genes regulating mitochondrial biogenesis (NRF1, TFAM, POLRMT, and PPARG) and those transcribed from mitochondrial genome, identified by bulk RNA-seq of ECs subjected to NM or HT for 72 hr in four biological replicates. *p < 0.05. (E) Mitotracker deep red staining (yellow pseudocolor) of ECs treated with NM or HT, with DAPI staining the nucleus. Representative images from three independent experiments are shown. Scale bar = 20 µm.
Figure 2—figure supplement 2

Effect of SncmtRNA KD.
(A) Illustration of regions in SncmtRNA targeted by LNA-S1 (i.e. LNA-S), S2, and S3. (B) RT-qPCR of MT-RNR2-derived transcripts in endothelial cells (ECs) transfected with respective locked nucleic acid (LNA) GapmeRs. Volcano plots showing the differentially expressed genes (DEGs) (p < 0.05 and Log2 fold-change > |0.5|) upon Snc-KD in ECs under NM (C) and HT (D, E). Venn diagram showing the number of common DEGs upon Snc-KD under NM and HT. GO terms enriched from upregulated (F) and downregulated DEGs (G) upon Snc-KD in NM. GO terms enriched in upregulated (H) and downregulated DEGs (I) upon Snc-KD in HT. (J) Representative images of Mitotracker deep red staining (yellow pseudocolor) in LNA GapmeR-transfected ECs from two independent experiments. Scale bar = 20 µm. (F–I) GO terms in similar pathways are grouped by colors: green, cell proliferation-related pathways; yellow, apoptosis-related pathways; purple, innate immune response pathways; blue, inflammatory pathways; orange, cell division-related pathways; gray, cellular organization and transport pathways.
Figure 2—figure supplement 3

Effect of SncmtRNA KD on mitochondrial function.
(A) Representative images of Mitotracker Deep Red staining (marked by yellow pseudocolor) in locked nucleic acid (LNA)-transfected endothelial cells (ECs) from two independent experiments. Scale bar = 20 μm. (B–F) Violin plots showing the quantification of mitotracker staining in transfected ECs. (G) Oxygen consumption rate (OCR) quantified by Seahorse assay. Data are mean ± standard error of the mean (SEM), representative of three independent experiments. (H–K) Levels of mtRNAs and mRNA transcripts of NRF1, TFAM, POLRMT, and PPARG were quantified by RNA-seq of two biological replicates.
Figure 2—figure supplement 4

HT-enriched SncmtRNA chromatin attachment likely contributes to transcriptional induction of HT-induced genes.
(A) Normalized promoter association levels of SncmtRNA with HT-induced genes in NM vs HT-treated endothelial cells (ECs). (B) Log ratio of gene expression of HT-induced and SncmtRNA-attached genes between Snc-KD and Scr control under HT. y < 0 indicates reduced expression upon Snc-KD. * denotes adjusted p < 0.05.
Figure 2—figure supplement 5

Effect of SncmtRNA-KD in lipopolysaccharide (LPS)-induced genes.
Human umbilical vein endothelial cells (HUVECs) were transfected with Scr or LNA-S targeting SncmtRNA and treated with LPS at 100 ng/ml for 24 hr. mRNA levels of indicated transcripts were quantified, data represent mean ± standard error of the mean (SEM) from three independent experiments. *p < 0.05 compared to LPS-Scr.
Figure 3 with 2 supplements
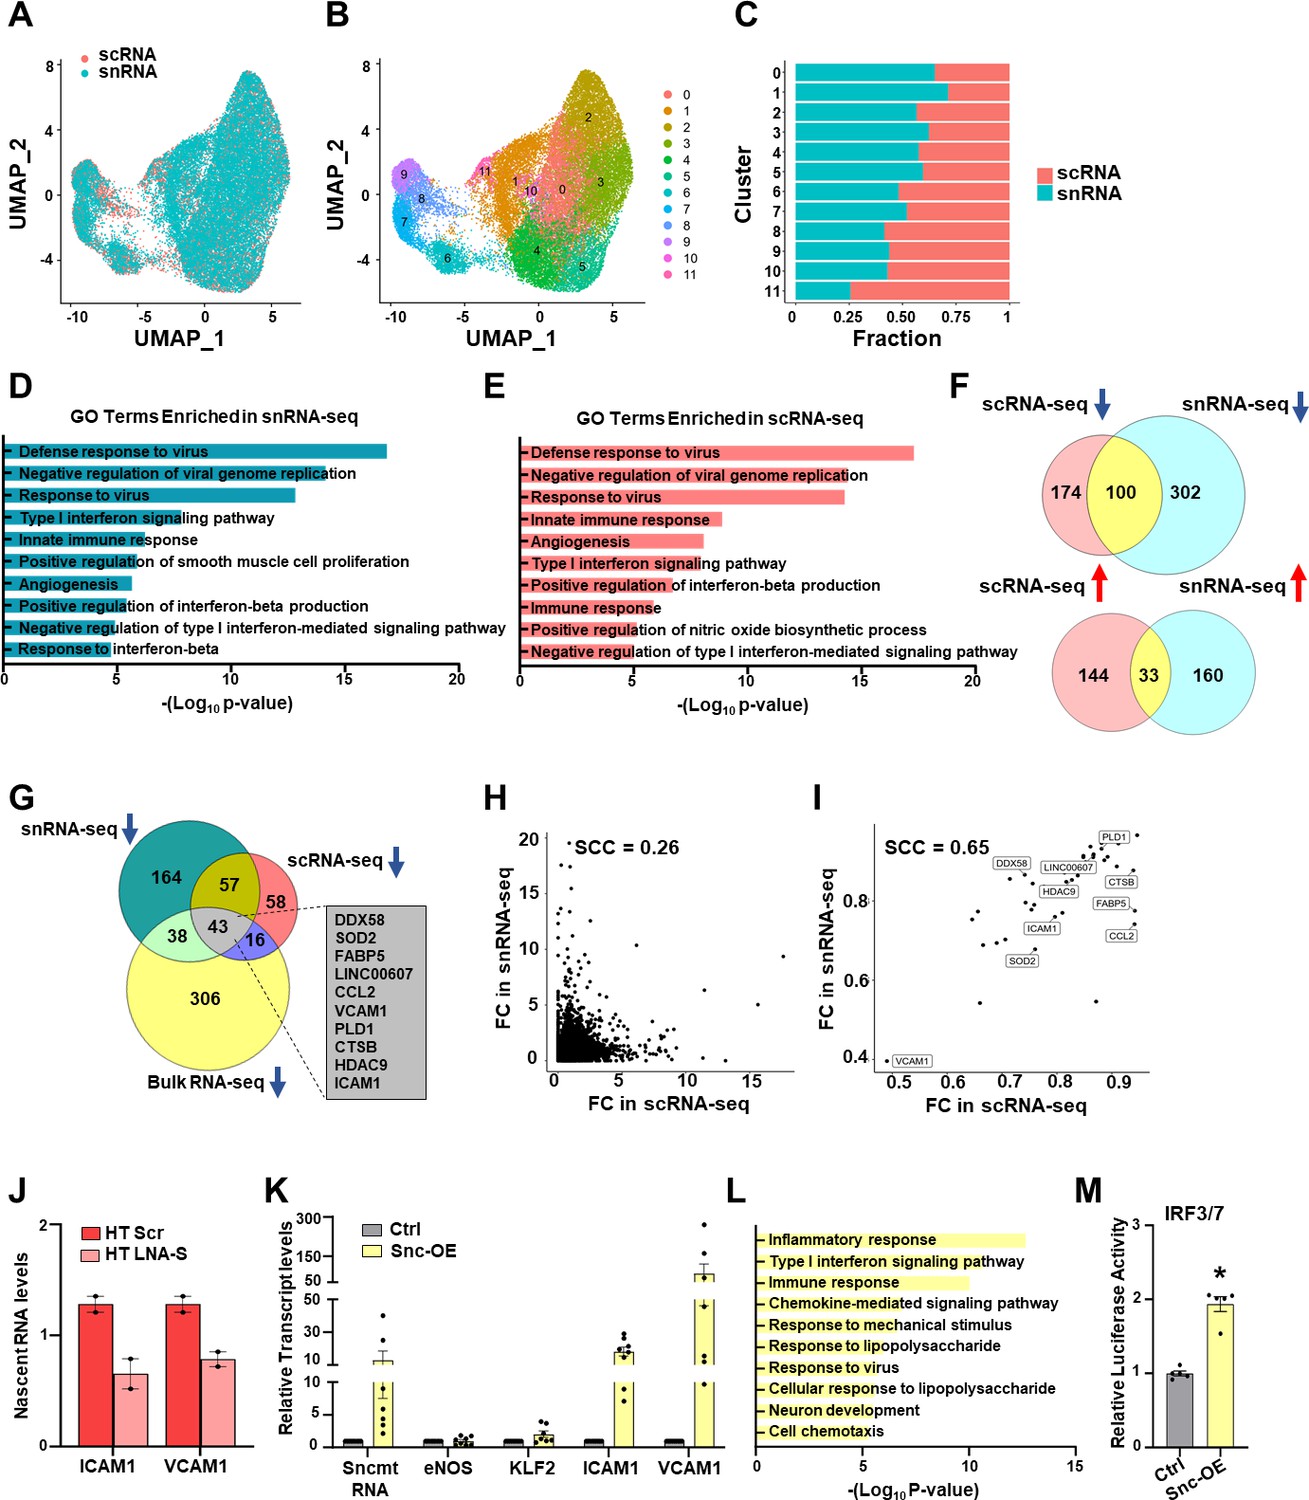
SncmtRNA regulates the transcription of nuclear genes.
(A–J) Endothelial cells (ECs) were transfected with Scr or LNA-S and exposed to HT for 72 hr in two biological replicates and then subjected to scRNA and snRNA-seq (n = 2). UMAP embedding colored by cells (scRNA) or nuclei (snRNA) in (A) or by unsupervised clustering (B). (C) Fraction of cells (scRNA) or nuclei (snRNA) in each cluster from (B). GO terms enriched by Snc-KD in snRNA-seq (D) or scRNA-seq (E). (F) Venn diagrams showing the number of common down- or upregulated differentially expressed genes (DEGs) between sc- and snRNA-seq. (G) Venn diagram showing the number of DEGs commonly downregulated by Snc-KD in three RNA-seq datasets. Top ranked DEGs involved in innate immune and inflammatory response among the 43 intersecting genes are shown. Correlation plot between Snc-KD-caused fold change (FC) in sn- and scRNA-seq of the commonly detected genes excluding the 43 intersecting genes (H) or the 43 intersecting genes (I). SCC are indicated. (J) Nascent RNA levels of ICAM1 and VCAM1 were quantified by RT-qPCR in the same batches of ECs used for sc- and snRNA-seq. ECs were infected with control AAV (Ctrl) or AAV-driven SncmtRNA overexpression (Snc-OE) for 48 hr. (K) RT-qPCR of respective transcripts (n = 8 biological replicates). (L) Enriched pathways (GO terms) by Snc-OE identified from bulk RNA-seq (n = 3 biological replicates). (M) Quantification of the activity of luciferase reporter driven by promoter containing IRF3/7 binding sites upon 293T cells infected by AAV (Ctrl) or Snc-OE. *p < 0.05 compared to Ctrl.
Figure 3—figure supplement 1

Read mapping, correlation, and number of differentially expressed genes (DEGs) of snRNA- and scRNA-seq.
Percentage of reads confidently mapped to intronic regions in snRNA-seq (A) and scRNA-seq (B). Correlation plot between expression (exp) of all genes commonly captured by sn- and sc-RNA-seq in HT-treated human umbilical vein endothelial cells (HUVECs) without or without SncmtRNA-KD, that is, HT-Scr (C) and HT-LNA(-S) (D). SCC = Spearman correlation coefficient. Volcano plots showing DEGs from snRNA-seq (E) and scRNA-seq (F). Red denotes upregulated and blue denotes downregulated DEGs. Average reads per cell, total genes detected, and the median UMI per cell from snRNA-seq (G) and scRNA-seq (H).
Figure 3—figure supplement 2
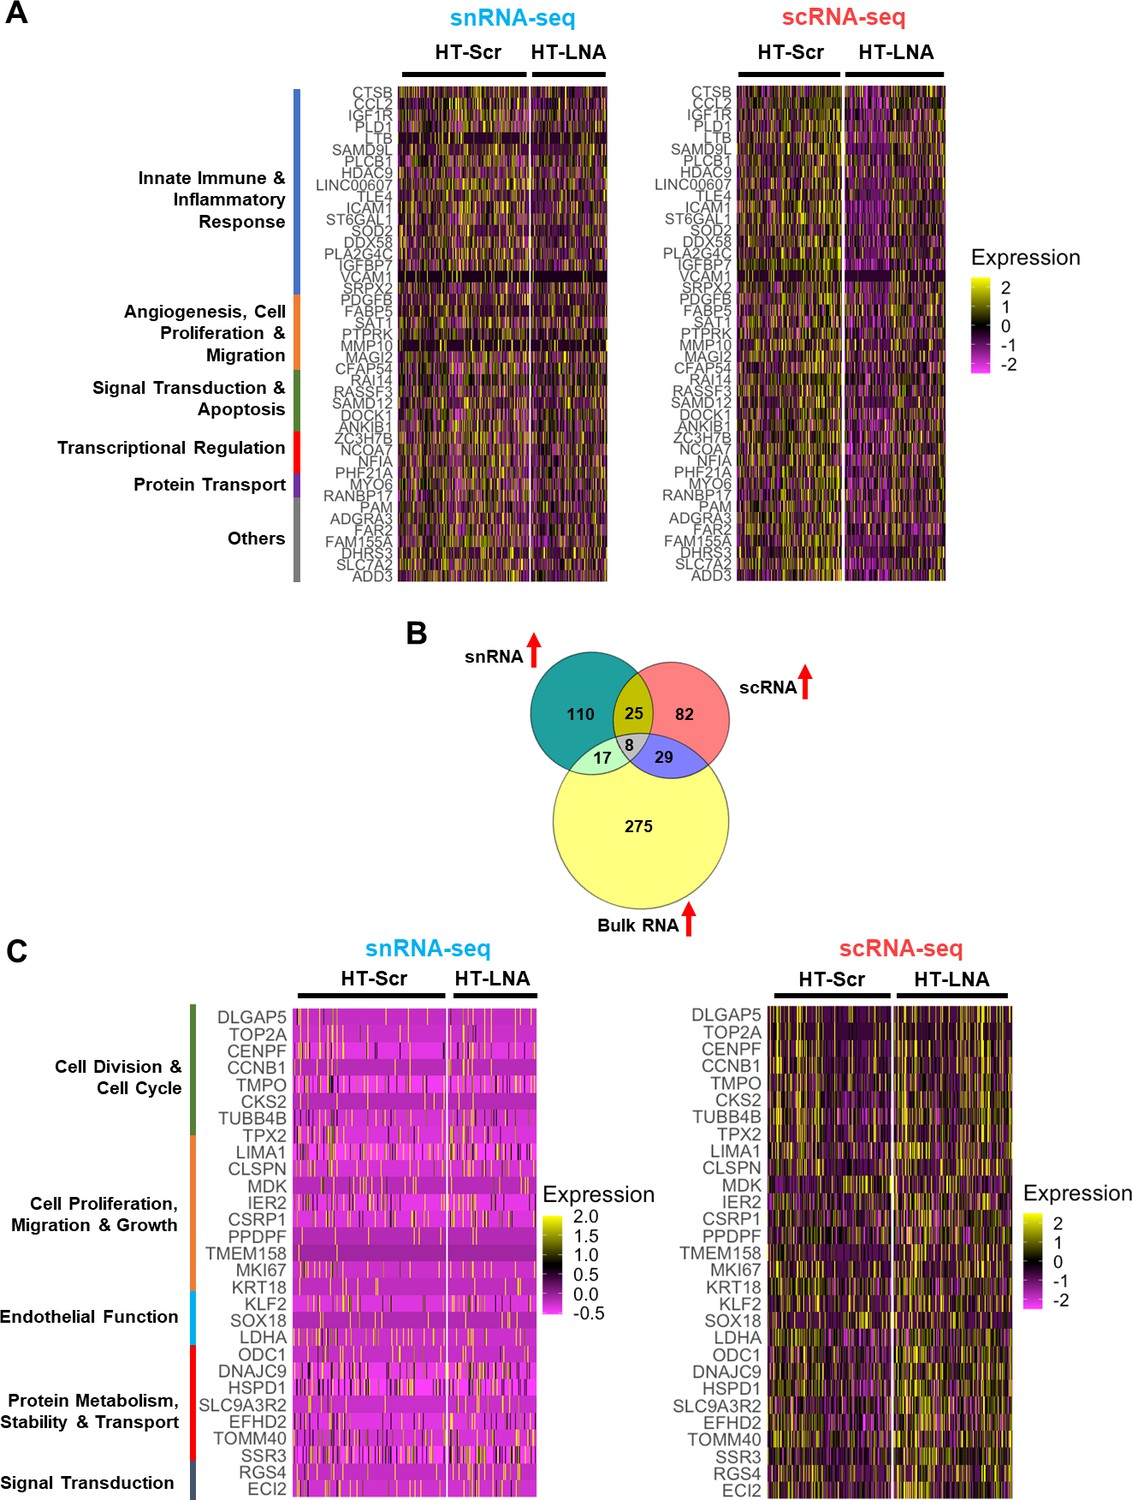
Differentially expressed gene (DEG) analysis of snRNA- and scRNA-seq data.
(A) Heatmaps showing the expression of 43 DEGs commonly downregulated by Snc-KD in scRNA and snRNA-seq in endothelial cells (ECs) under HT. (B) Venn diagram showing the intersection of DEGs upregulated in bulk RNA-, scRNA-, and snRNA-seq by Snc-KD in ECs under HT. (C) Heatmaps showing the expression of 29 genes commonly upregulated in bulk RNA- and scRNA-seq but not in snRNA-seq by Snc-KD in ECs under HT.
Figure 4 with 1 supplement
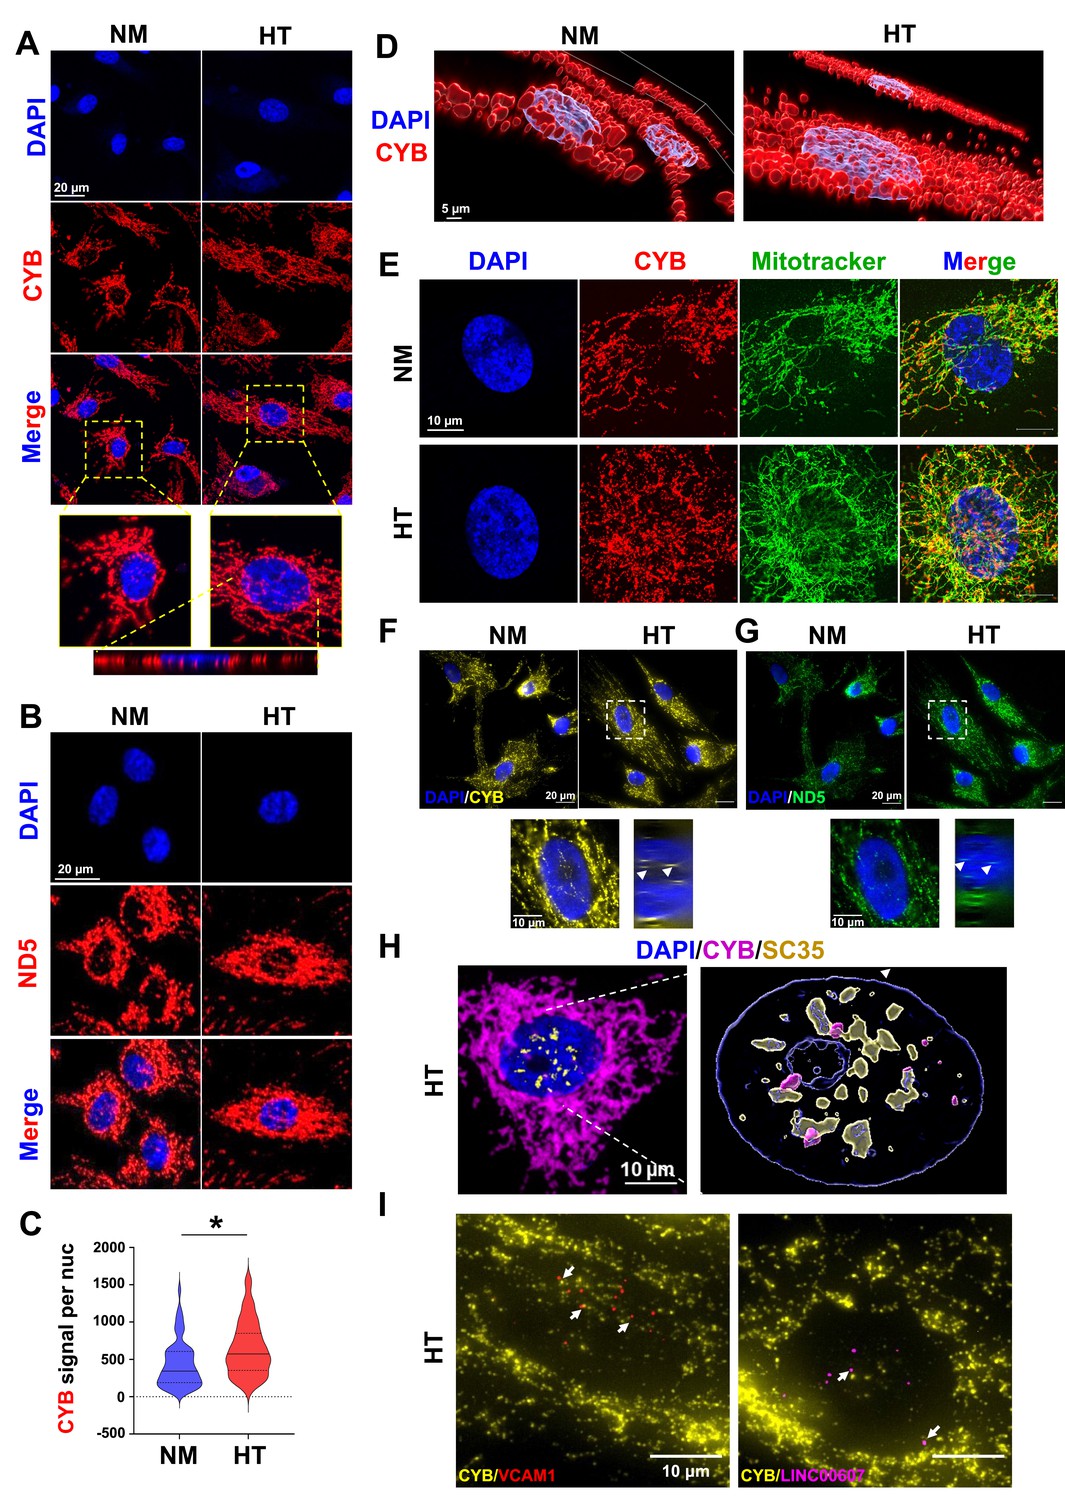
Nuclear localization of MT-CYB and MT-ND5.
Human umbilical vein endothelial cells (HUVECs) were treated with NM and HT for 72 hr. Confocal images of MT-CYB (A) and MT-ND5 (B) smFISH in endothelial cells (ECs). Bottom of (A): orthogonal view across the vertical axis of HT-EC. (C) Violin plot showing the quantification of average MT-CYB signal per nucleus in NM and HT. Over 200 cells from each condition were quantified. *p < 0.05 by Mann–Whitney U-test. (D) 3D reconstruction of confocal images from (A). For (A–D) representative images from three independent experiments are shown. (E) Super resolution microscopic images of MT-CYB smFISH and Mitotracker deep red from a single optical plane of 0.16 µm thickness. (F, G) Single-molecule sequential fluorescence in situ hybridization (FISH) with probes for CYB and ND5, with DAPI staining nuclei. (H) Super resolution microscopic image of merged signals of smFISH for MT-CYB RNA (in magenta), immunofluorescence for SC35 protein (in yellow), and DAPI (in blue) from a single optical plane of 0.16 µm thickness (left) and the 3D reconstruction (right). (I) Co-sm-seqFISH for indicated pre-mRNA transcripts with MT-CYB transcript. (H) and (I) show images taken from HT-treated ECs.
Figure 4—figure supplement 1

Control experiments of smFISH for MT-CYB and MT-ND5.
Confocal images of POLR2A mRNA (in red) as positive control (A) and bacterial dapB mRNA (in red) as negative control (B). Confocal images of Mitotracker Deep Red (in green pseudocolor) and smFISH for MTCYB (in red) (C) and MTND5 (in red) (D) transcripts. (E) smFISH performed on Rho0 cells for indicated transcripts, with DAPI staining the nuclei.
Figure 5
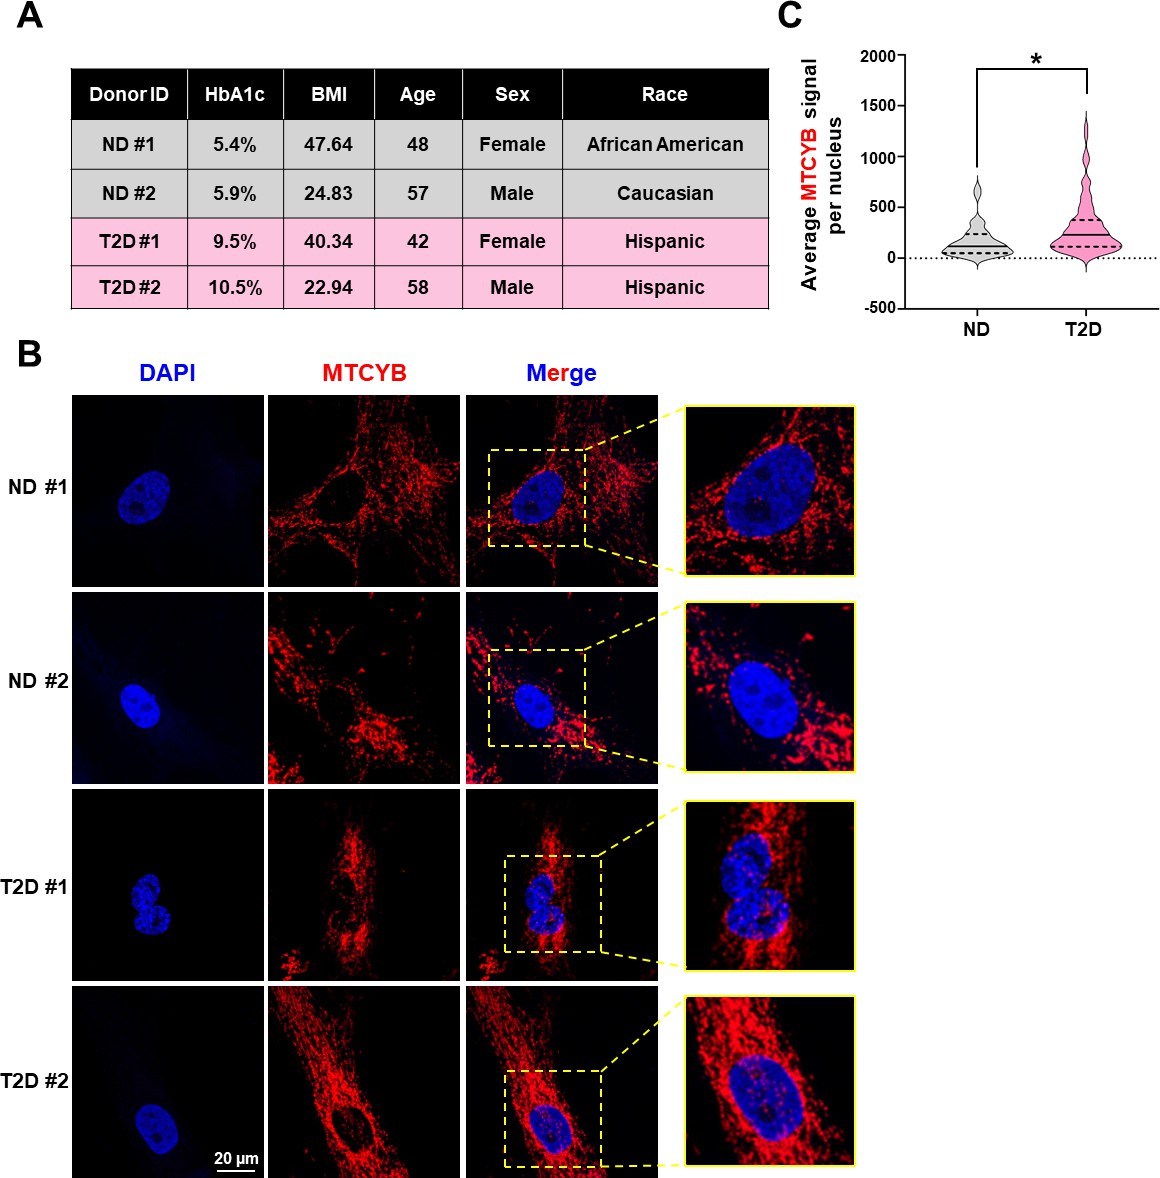
Nuclear localization of MT-CYB in donor-derived intimal cells.
(A–C) Intimal cells were freshly isolated from mesenteric arteries of two non-diabetic (ND) and two Type 2 diabetic (T2D) donors and grown on glass coverslips. (A) Table showing donor information. (B) smFISH (RNAscope) was performed for MT-CYB transcripts (in red), with nuclear counter stain with DAPI. Representative images from >15 cells per donor are shown. (C) Violin plot showing the distribution of average MTCYB signal per nucleus from n = 34 for ND and n = 81 for T2D. *p < 0.05 based on Mann–Whitney U-test.
Additional files
-
Supplementary file 1
RT-qPCR and locked nucleic acid (LNA) GapmeR sequences.
- https://cdn.elifesciences.org/articles/86204/elife-86204-supp1-v1.xlsx
-
Supplementary file 2
Differentially expressed genes from bulk and single-cell RNA-seq upon SncmtRNA knockdown and overexpression.
- https://cdn.elifesciences.org/articles/86204/elife-86204-supp2-v1.xlsx
-
MDAR checklist
- https://cdn.elifesciences.org/articles/86204/elife-86204-mdarchecklist1-v1.docx
Download links
A two-part list of links to download the article, or parts of the article, in various formats.
Downloads (link to download the article as PDF)
Open citations (links to open the citations from this article in various online reference manager services)
Cite this article (links to download the citations from this article in formats compatible with various reference manager tools)
Regulation of nuclear transcription by mitochondrial RNA in endothelial cells
eLife 13:e86204.
https://doi.org/10.7554/eLife.86204


