Tissue-derived exosome proteomics identifies promising diagnostic biomarkers for esophageal cancer
- Department of Cardiothoracic Surgery, First Affiliated Hospital of Gannan Medical University, China
- The First Clinical School of Medicine of Southern Medical University, China
- Department of Anesthesiology, Longhua District Central Hospital, China
- Department of Traumatology, First Affiliated Hospital of Gannan Medical University, China
- The First School of Clinical Medicine, Gannan Medical University, China
Figures
Figure 1
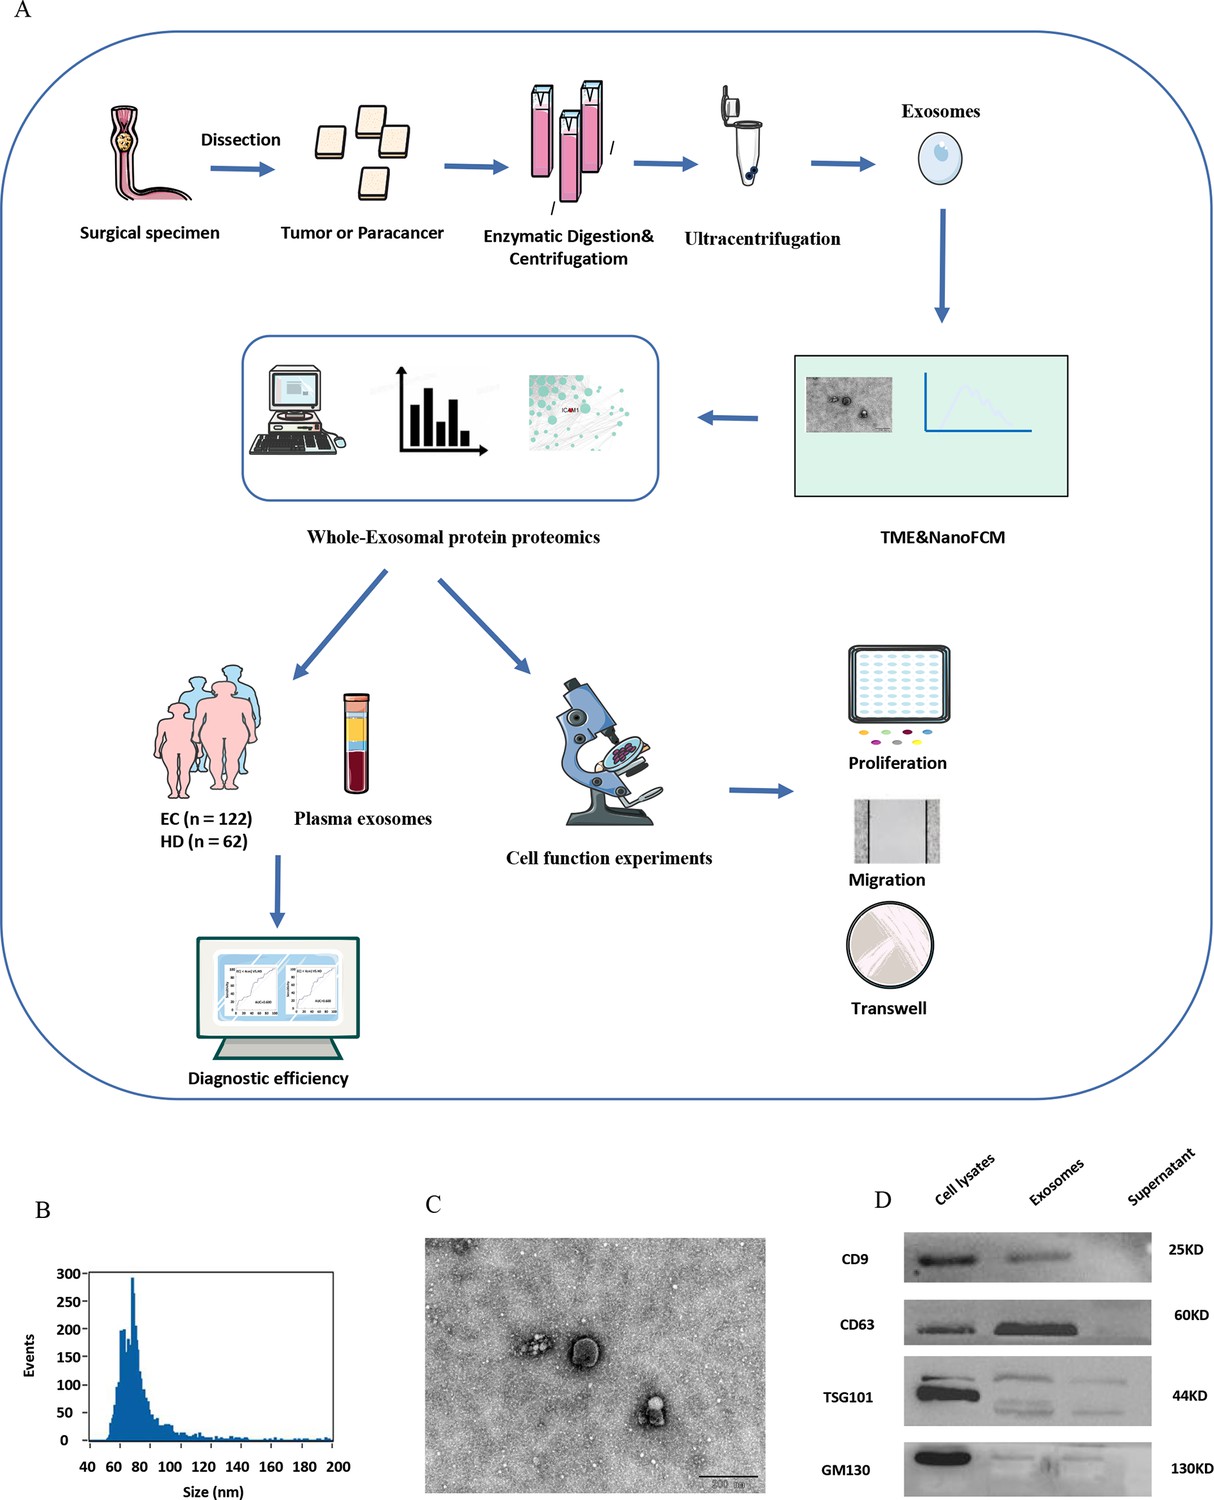
Exosome identification.
(A) Overview of the entire experimental design of this study. (B) Nano-flow cytometry (NanoFCM) results show isolated exosome diameters ranging from 50 to 200 nm. (C) Transmission electron microscope of exosomes showing round‐shaped structures with diameters of approximately 120 nm; scale bar: 100 μm. (D) Western blot analysis of CD9, CD63, TSG101, and GM130 exosomal biomarkers.
-
Figure 1—source data 1
Original files for the gels in Figure 1D.
- https://cdn.elifesciences.org/articles/86209/elife-86209-fig1-data1-v2.zip
Figure 2
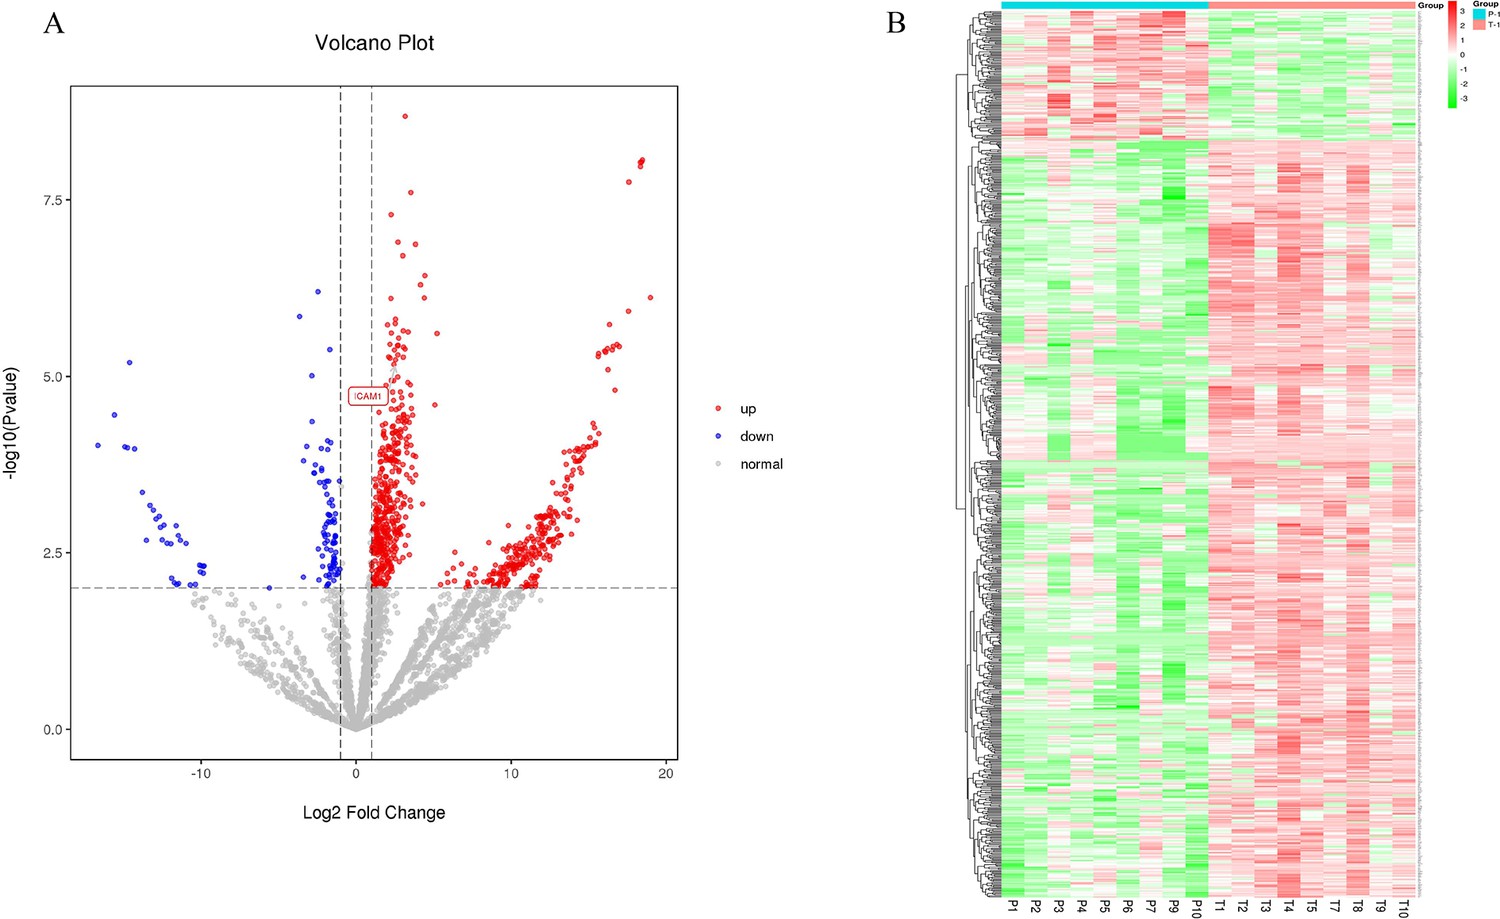
Label-free quantitative proteomics profiling of discovery of differentially expressed proteins.
(A) The volcano plot was drawn using two factors, the fold change (log2) between the two groups of samples and the p-value (−log10) obtained from the t-test, to show the significance of differences in the data between the two groups of samples. The red and blue dots in the figure denote significantly up-regulated and down-regulated proteins, respectively; the gray dots denote proteins with insignificant differences. (B) Differentially expressed protein clustering diagram; columns represent different samples, rows represent different proteins, clustered by log10 (protein expression value+1) value, data in each row is normalized, red indicates high expression protein, green indicates low expression protein.
Figure 3
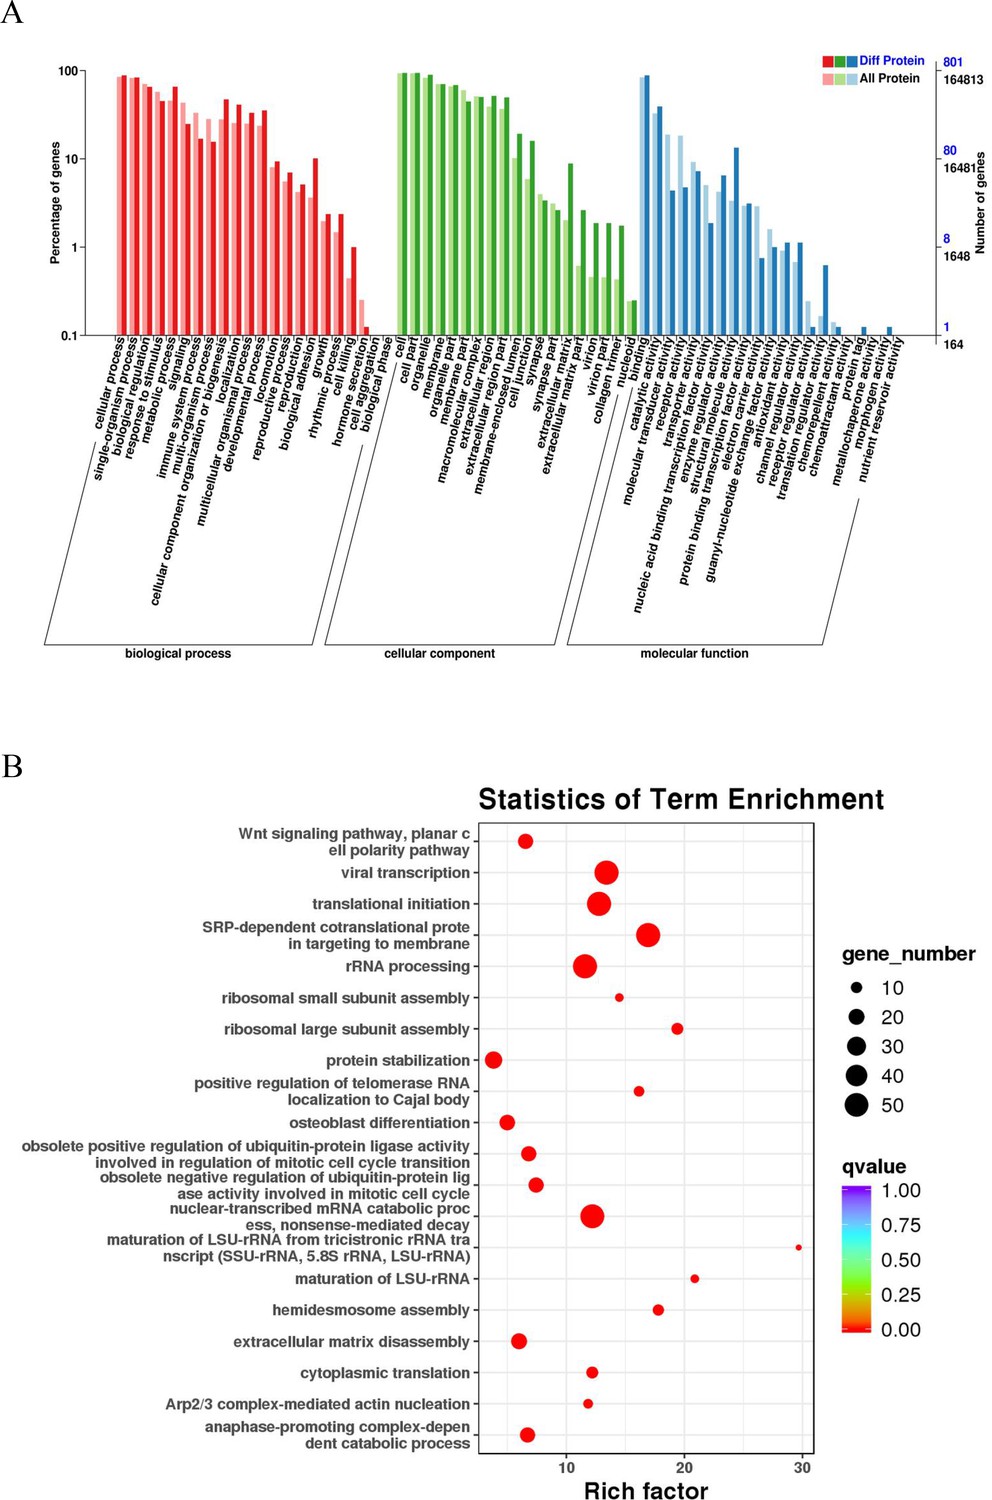
GO and KEGG pathway analyses of esophageal cancer (EC)-related proteins.
(A) Classification of 801 differentially expressed proteins based on biological processes, cellular components, and molecular functions. The horizontal axis is the GO classification, the left side of the vertical axis is the percentage of the number of proteins, and the right side is the number of proteins. (B) The abscissa is the enrichment factor; the ordinate is the name of the GO term; the size of the dot indicates the number of proteins annotated to this term; and the color indicates the Q value of the significant p-value corrected by multiple hypothesis testing.
Figure 4
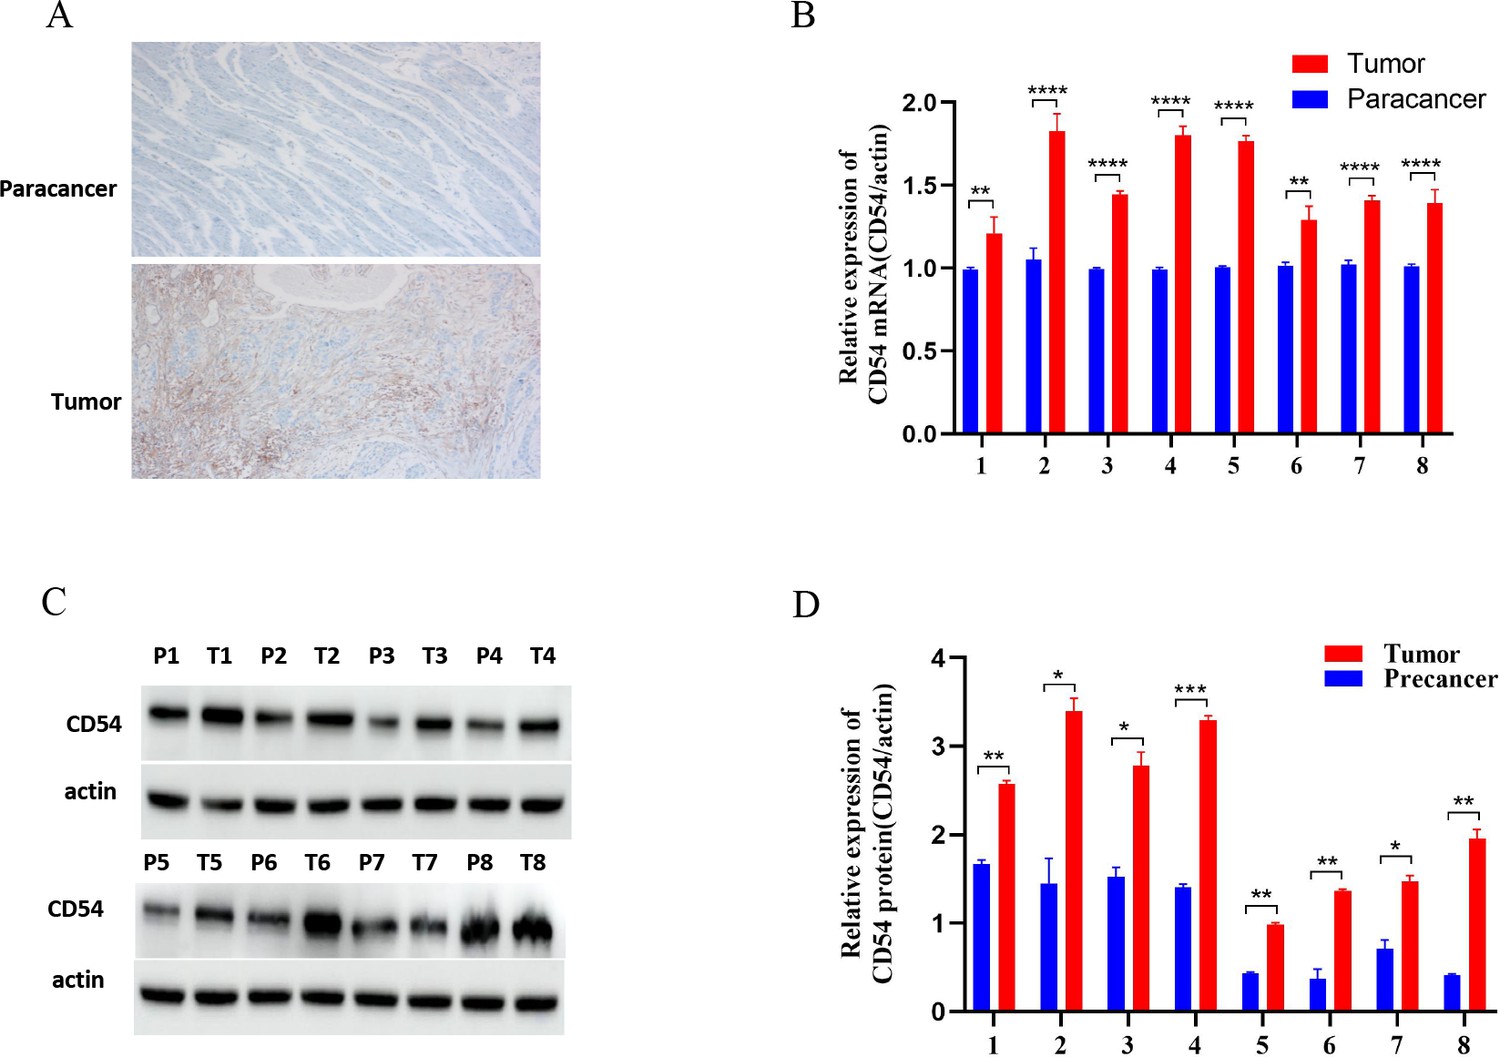
Up-regulated CD54 expression in esophageal cancer (EC) tissues.
(A) Immunohistochemical detection of CD54 expression in EC and paracancer tissues; magnification ×100. (B) Real-time quantitative PCR detection of CD54 mRNA expression in eight EC and adjacent tissue pairs. (C) Western blot detection of CD54 expression in eight EC and adjacent tissue pairs. (D) Quantification analysis of representative western blot images using ImageJ software. *p<0.05; **p<0.01; ***p<0.001; ****p<0.0001.
-
Figure 4—source data 1
Original files for the gels in Figure 4C.
- https://cdn.elifesciences.org/articles/86209/elife-86209-fig4-data1-v2.zip
Figure 5
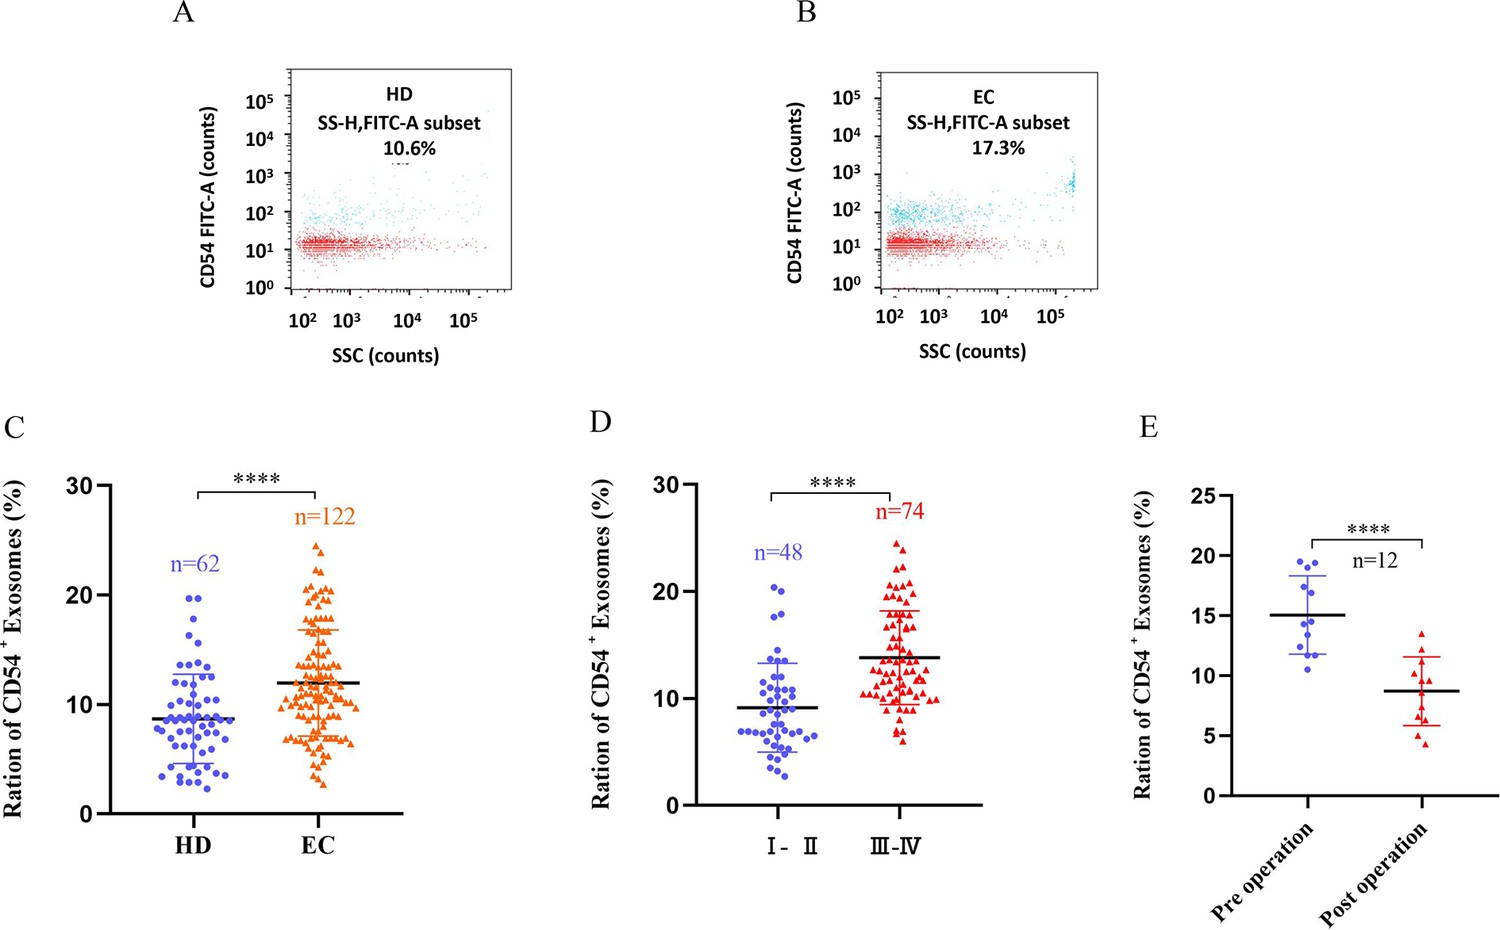
CD54 expression in plasma-derived exosomes.
(A–B) The bivariate dot plots of CD54 FITC fluorescence (y-axis) vs. SSC (x-axis) for exosomes isolated from plasmas of healthy donors (HDs) (A) and esophageal cancer (EC) (HCC) (B) patients. (C) The ratios of CD54+ exosomes vs. total exosomes (CD54+/total) significantly differed between HD and EC groups. (D) Exosomal CD54 levels were significantly higher in stage III–IV patients than in stages I–II. (E) Changes in plasma exosomal CD54 levels in EC patients (n=19) before (preoperation) and after (7–10 days postoperation) surgical removal of the tumor. ****p<0.0001.
Figure 6
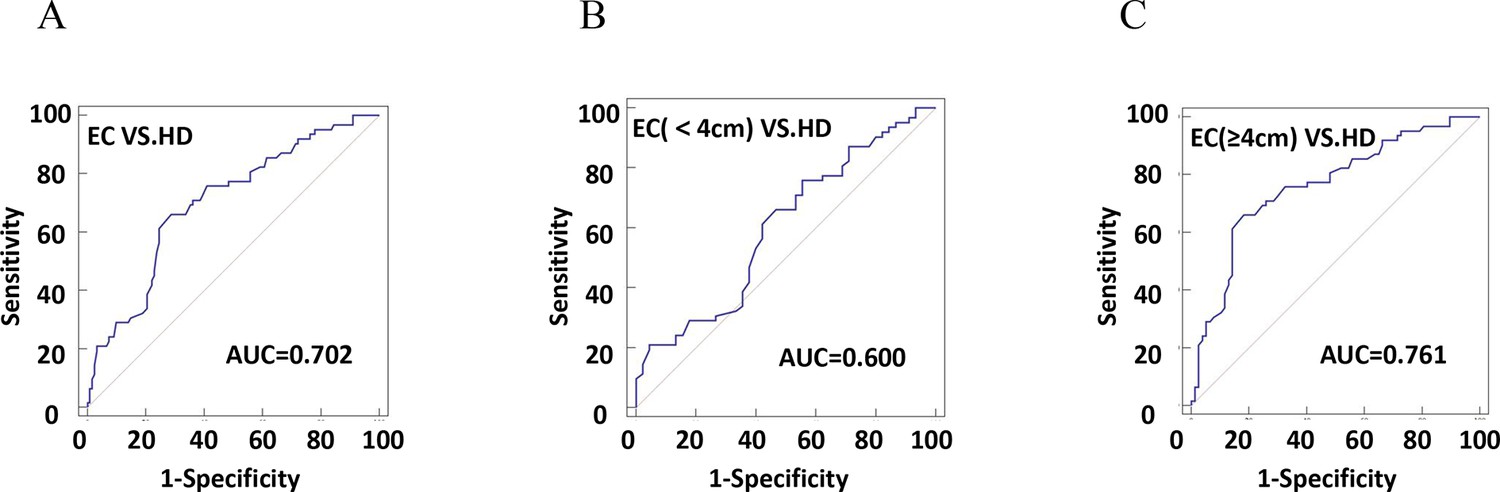
The efficiency of plasma exosomal CD54 in esophageal cancer (EC) diagnosis.
(A) The diagnostic efficiency to distinguish EC patients from healthy donors (HDs). (B) The diagnostic efficiency to distinguish EC patients with tumor size <4 cm from HD. (C) The diagnostic efficiency to distinguish EC patients with tumor size ≥4 cm from HD.
Figure 7
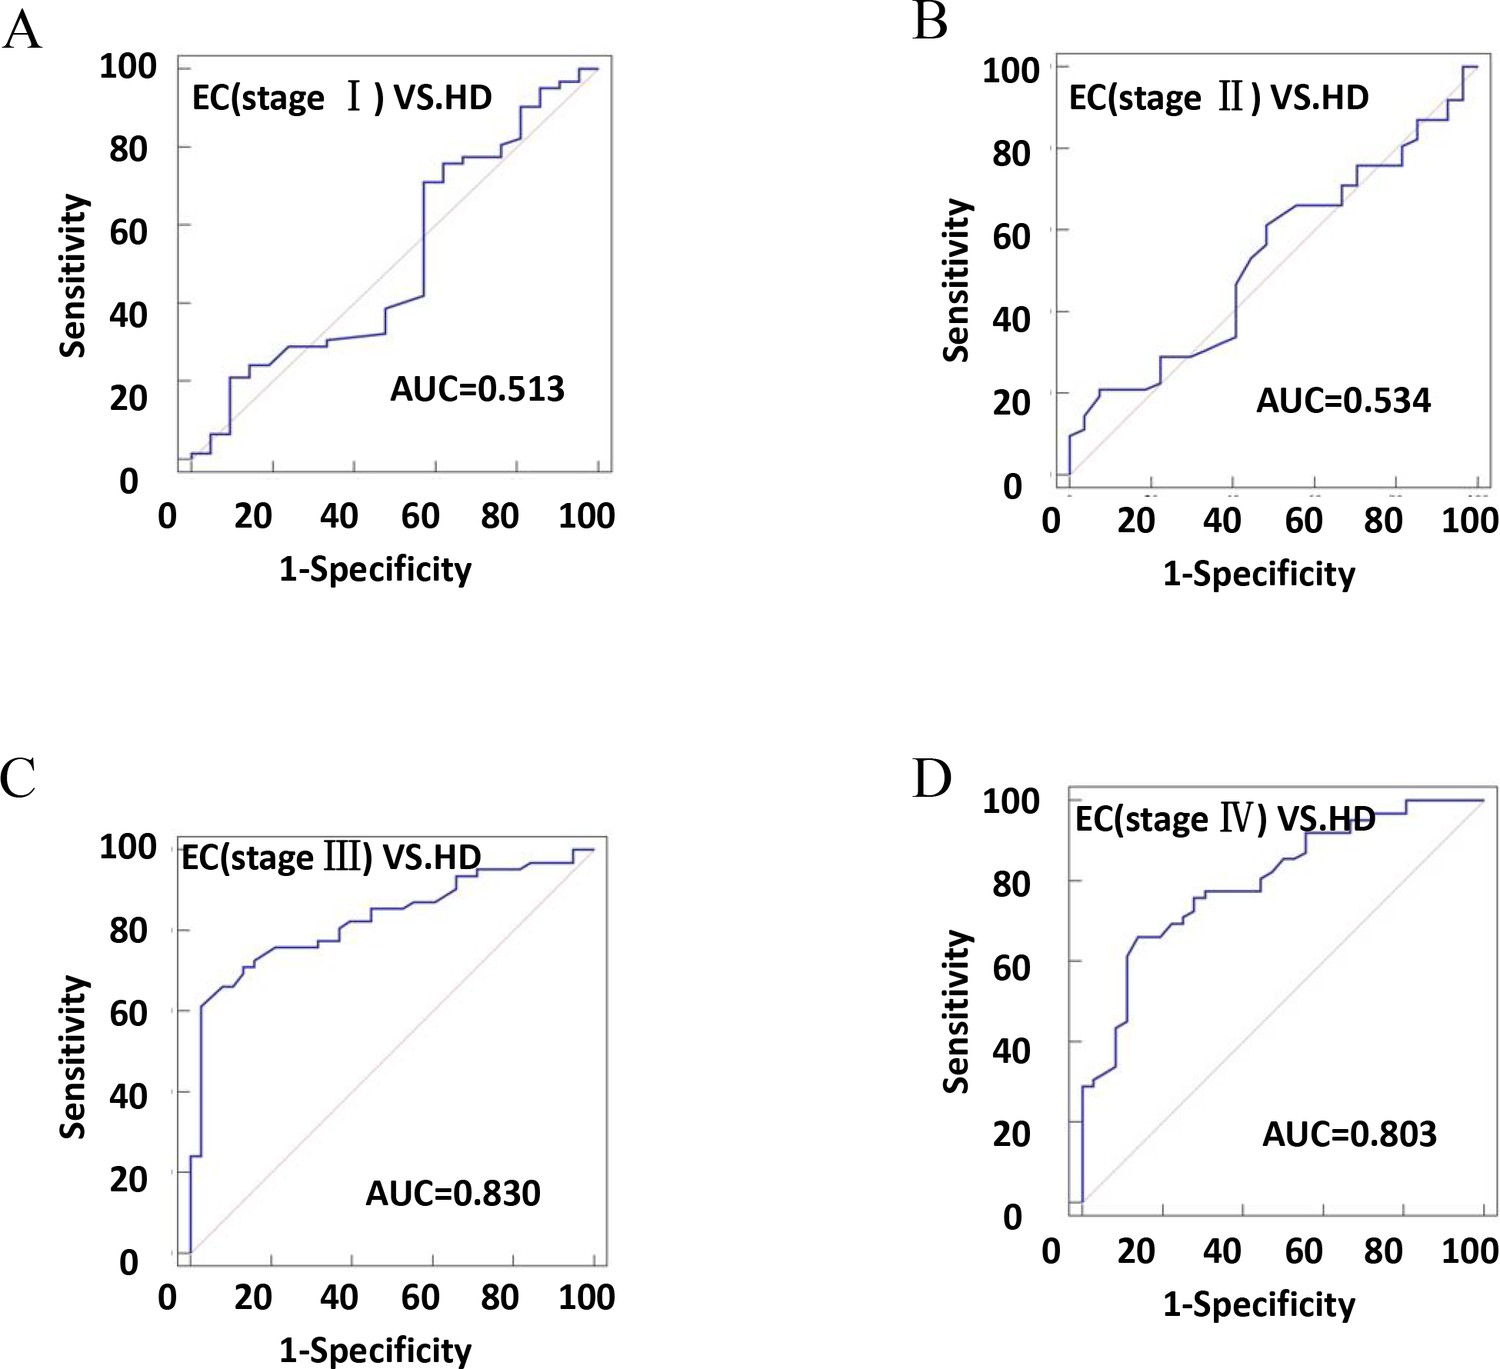
The efficiency of plasma exosomal CD54 in esophageal cancer (EC) diagnosis.
(A) The diagnostic efficiency to distinguish EC patients with stage I from healthy donors (HDs). (B) The diagnostic efficiency to distinguish EC patients with stage II from HDs. (C) The diagnostic efficiency to distinguish EC patients with stage III from HDs. (D) The diagnostic efficiency to distinguish EC patients with stage IV from HDs.
Figure 8
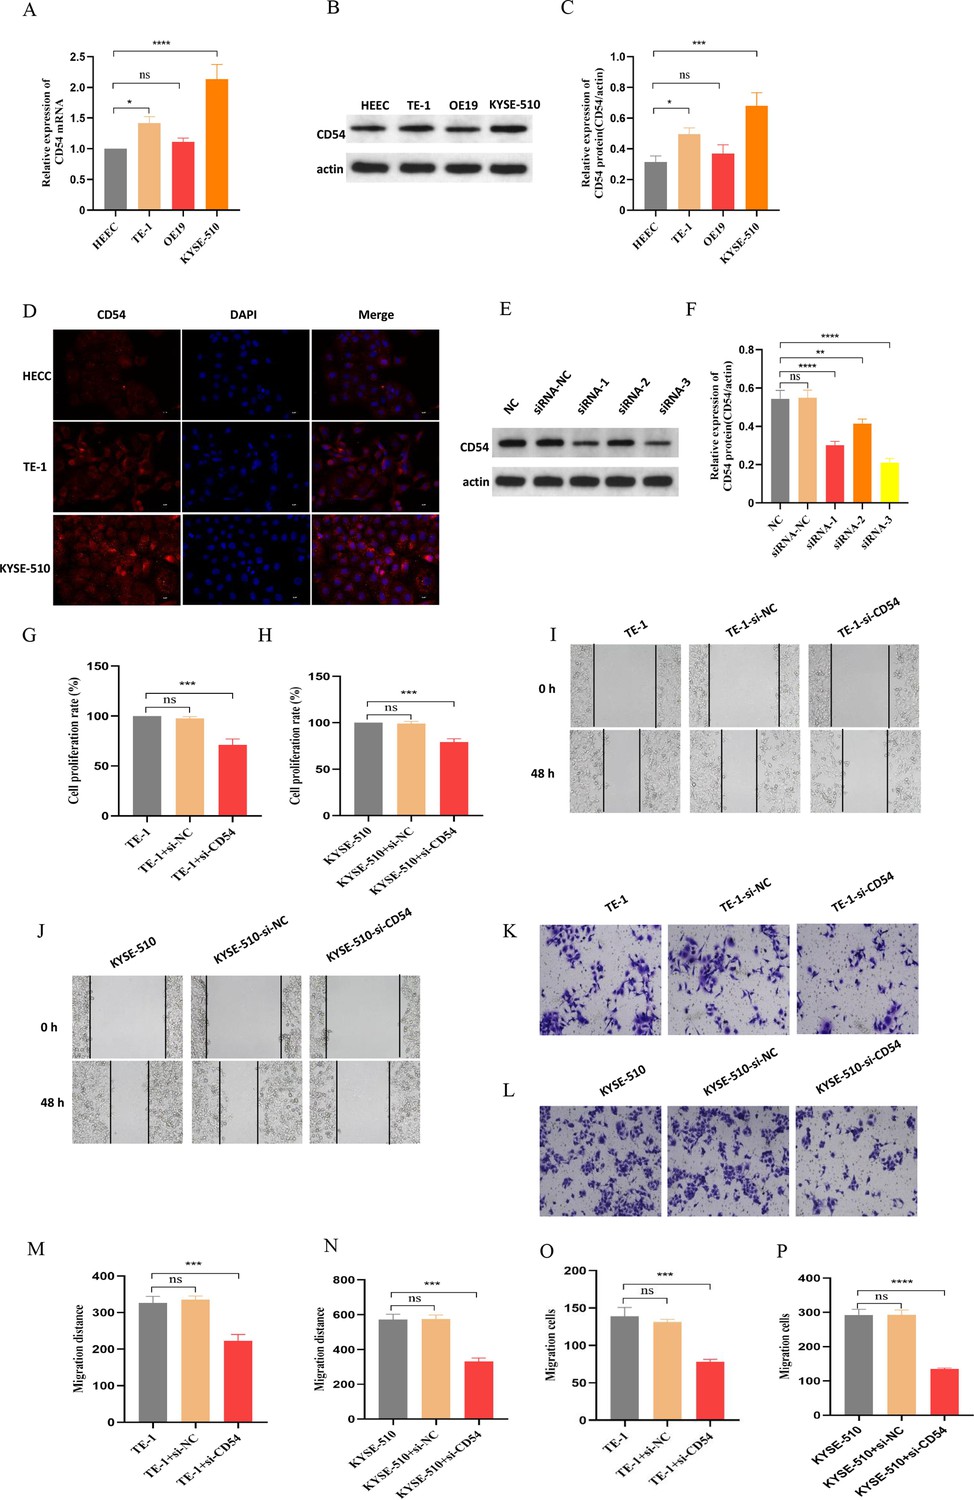
Reduced CD54 reduces esophageal cancer (EC) proliferation and migration.
(A) The relative mRNA expression of CD54 was significantly increased in TE-1 and KYSE-510 cells. (B) The protein expression of CD54 was significantly increased in TE-1 and KYSE-510 cells. (C) Quantification analysis of representative western blot images using ImageJ software. (D) Representative images of CD54 immunofluorescence staining in human normal esophageal epithelial cell (HEEC), TE-1, and KYSE-510. Nuclei were stained with DAPI; scale bar: 100 µm. (E) The relative protein expression of CD54 was significantly decreased in TE-1 cells using specific siRNA against CD54. (F) Quantification analysis of representative western blot images using ImageJ software. (G–H) The cell viability was significantly decreased in (G) TE-1 and (H) KYSE-510 cells using specific siRNA against CD54. (I–L) Cell migratory abilities were significantly decreased in (I, K) TE-1 and (J, L) KYSE-510 cells using specific siRNA against CD54; magnification, ×100. (M–P) Histograms showing that CD54 siRNA significantly decreased the migration abilities of (M–N, K) TE-1 and (O–P) KYSE-510 cells, as demonstrated by the wound healing and cell migration assays, respectively. ns: no significant; **p<0.01; ***p<0.001; ****p<0.0001.
-
Figure 8—source data 1
Original files for the gels in Figure 8B.
- https://cdn.elifesciences.org/articles/86209/elife-86209-fig8-data1-v2.zip
-
Figure 8—source data 2
Original files for the gels in Figure 8E.
- https://cdn.elifesciences.org/articles/86209/elife-86209-fig8-data2-v2.zip
Tables
Table 1
The relationship between plasma exosomes CD54 levels and clinical characteristics of esophageal cancer (EC) patients.
| Clinicopathological characteristics | N (122) | CD54+ exosomes (%) | p | |
|---|---|---|---|---|
| Age (years) | <50 ≥50 | 49 73 | 11.56±4.99 12.24±4.77 | = 0.4490 |
| Gender | Male Female | 82 37 | 12.59±4.86 11.69±4.83 | = 0.3490 |
| Tumor size | <4 cm ≥4 cm | 48 74 | 10.33±4.54 12.93±4.81 | = 0.0307 |
| Distant metastasis | Absent Present | 50 72 | 9.86±4.57 13.38±4.54 | <0.0001 |
| Smoking history | Absent Present | 49 73 | 10.11±4.58 13.21±4.68 | = 0.0004 |
| Drinking history | Absent Present | 46 76 | 9.91±4.34 13.21±4.71 | = 0.0002 |
| Clinical stage | I–II III–IV | 48 74 | 9.13±4.15 13.80±4.38 | <0.0001 |
Table 2
Main parameters of receiver operating characteristic (ROC) curve analysis results.
| Variable | AUC | 95% CI | Sensitivity (%) | Specificity (%) | Youden index | p |
|---|---|---|---|---|---|---|
| HD-EC | 0.702 | 0.630–0.767 | 66.13 | 71.31 | 0.3744 | <0.0001 |
| HD-EC (<4 cm) | 0.600 | 0.501–0.694 | 75.81 | 44.44 | 0.2025 | = 0.0733 |
| HD-EC (≥4 cm) | 0.761 | 0.682–0.830 | 66.13 | 81.82 | 0.4795 | <0.0001 |
| HD-EC (stage I) | 0.513 | 0.401–0.625 | 32.26 | 52.38 | 0.1536 | = 0.8631 |
| HD-EC (stage II) | 0.534 | 0.425–0.640 | 20.97 | 92.59 | 0.1356 | = 0.6080 |
| HD-EC (stage III) | 0.830 | 0.74–0.898 | 61.29 | 97.37 | 0.5866 | <0.0001 |
| HD-EC (stage IV) | 0.803 | 0.711–0.877 | 66.13 | 86.11 | 0.5224 | <0.0001 |
Additional files
Download links
A two-part list of links to download the article, or parts of the article, in various formats.
Downloads (link to download the article as PDF)
Open citations (links to open the citations from this article in various online reference manager services)
Cite this article (links to download the citations from this article in formats compatible with various reference manager tools)
Tissue-derived exosome proteomics identifies promising diagnostic biomarkers for esophageal cancer
eLife 12:e86209.
https://doi.org/10.7554/eLife.86209


