Apoptosis recognition receptors regulate skin tissue repair in mice
- Dept. of Molecular Cellular and Developmental Biology, Yale University, United States
- Dept. of Biomedical Engineering, Yale University, United States
- Washington State University, SMB, United States
- Sunnycrest Bioinformatics, United States
- Dept. of Surgery (Plastic), Yale School of Medicine, United States
- Dept of Podiatric Surgery, Yale New Haven Hospital, United States
- Dept. of Dermatology, Yale School of Medicine, United States
Figures
Figure 1 with 1 supplement
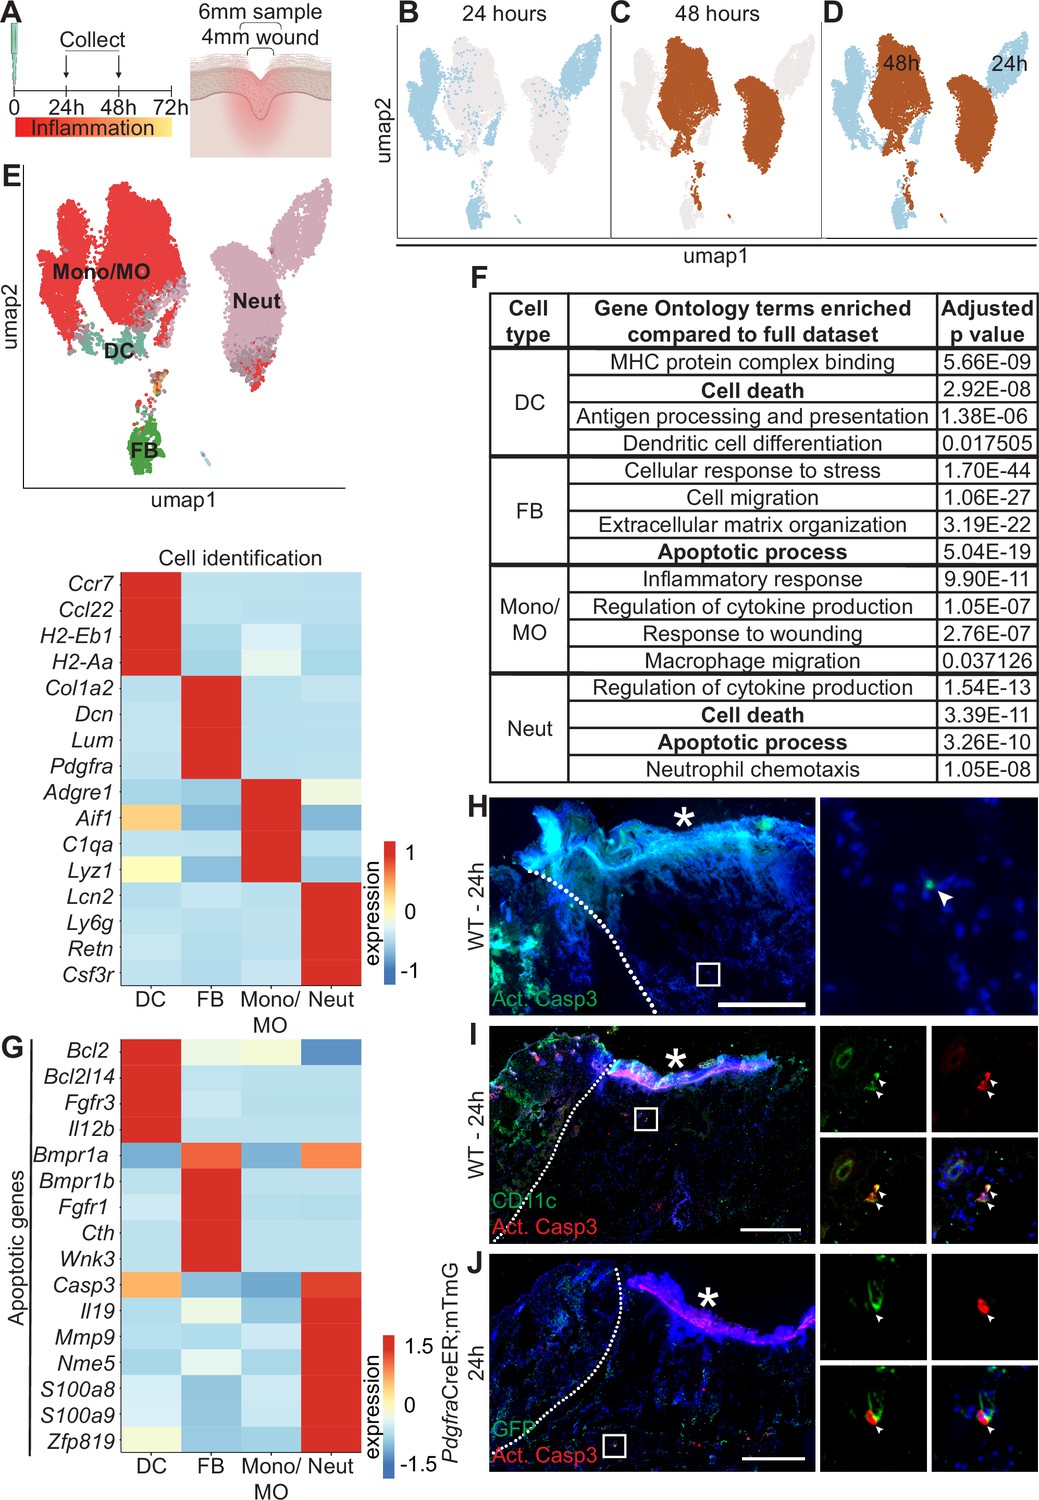
Dynamic transcriptional heterogeneity and apoptosis are observed in murine wound beds 24 hr and 48 hr after injury.
(A) Schematic of experimental design. (B) UMAP plot of single-cell RNA sequencing (scRNA-seq) data for cells from 24 hr wound beds in murine back skin. (C) UMAP plot of scRNA-seq data for cells from 48 hr wound beds in murine back skin. (D) UMAP plot of scRNA-seq data for cells from both 24 hr and 48 hr wound beds in murine back skin annotated by timepoint. (E) Top: UMAP plot of scRNA-seq data for cells from 24 hr and 48 hr wound beds annotated by cell identity. Bottom: Heatmap of differentially expressed marker genes in 24 hr and 48 hr wound beds. (F) Gene ontology terms enriched in each cell type compared to the full dataset. (G) Heatmap of differentially expressed apoptosis-related genes from 24 hr and 48 hr wound beds. (H) Immunostaining for cleaved caspase 3 (Act. Casp3) (green) in wound bed 24 hr after injury. Arrow indicates cleaved caspase 3+ cells. (I) Immunostaining for CD11c (green) and cleaved caspase 3 (red) in wound bed 24 hr after injury. Arrows indicate double-positive CD11c+ cleaved caspase 3+ cells. (J) Immunostaining for GFP (green) and cleaved caspase 3 (red) in PdgfraCreER;mTmG wound bed 24 hr after injury. Arrow indicates double-positive GFP+ cleaved caspase 3+ cells. * indicates scab. Scale bars = 500 µm. In E and G, expression indicates scaled log-normalized mRNA counts.
Figure 1—figure supplement 1
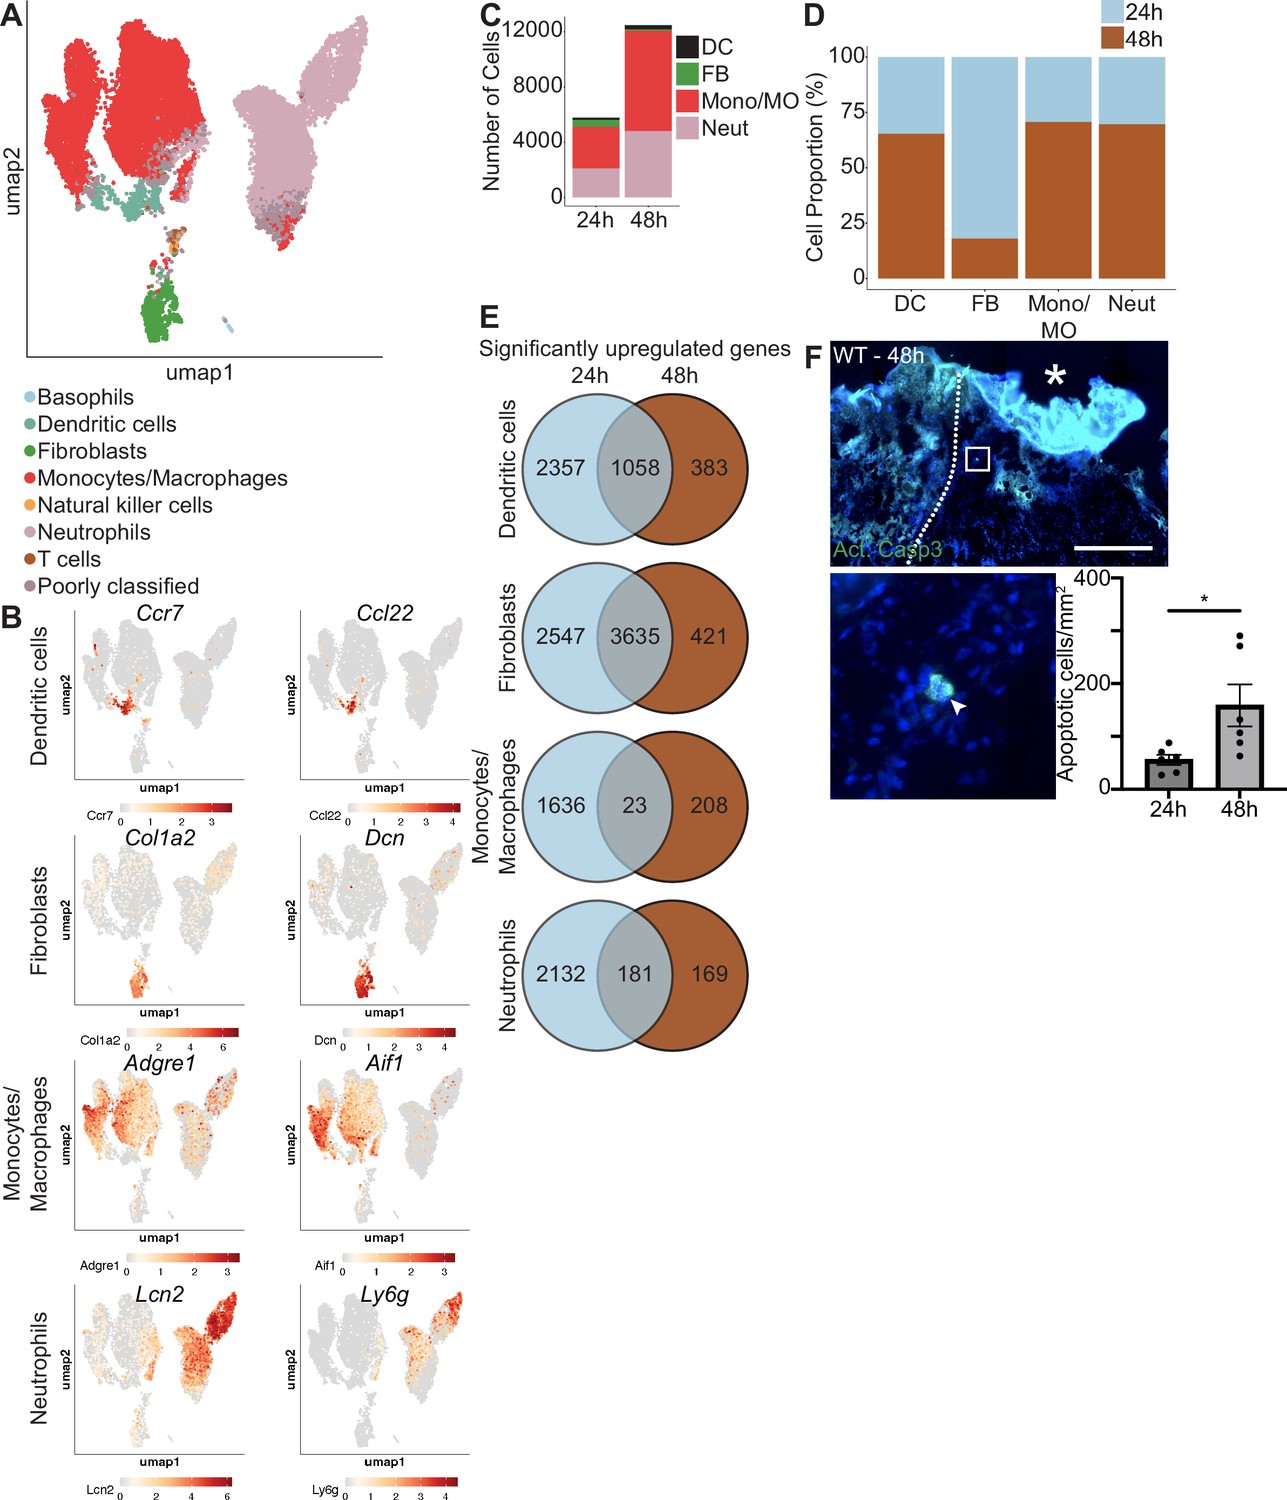
Dynamic cellular heterogeneity and evidence of apoptosis is observed in 24 hr and 48 hr wound beds by single-cell RNA sequencing (scRNA-seq).
(A) UMAP plot of scRNA-seq data for cells from 24 hr and 48 hr wound beds in murine back skin annotated by cell identity. (B) Feature plots showing expression of two marker genes for each major cell type. (C) Number of cells identified by cell type at 24 hr and 48 hr. (D) Proportion of total cells represented by 24 hr or 48 hr for each major cell type. (E) Venn diagrams representing significantly upregulated genes shared by both timepoints or specific to 24 hr or 48 hr for each major cell type. (F) Top, Bottom left: Immunostaining for cleaved caspase 3 (green) in 48 hr wound bed. Arrow indicates cleaved caspase 3+ cell. * indicates scab. Scale bar = 500 µm. Bottom right: Quantification of cleaved caspase 3+ cells per mm2 in the wound bed. *p<0.05.
Figure 2 with 1 supplement
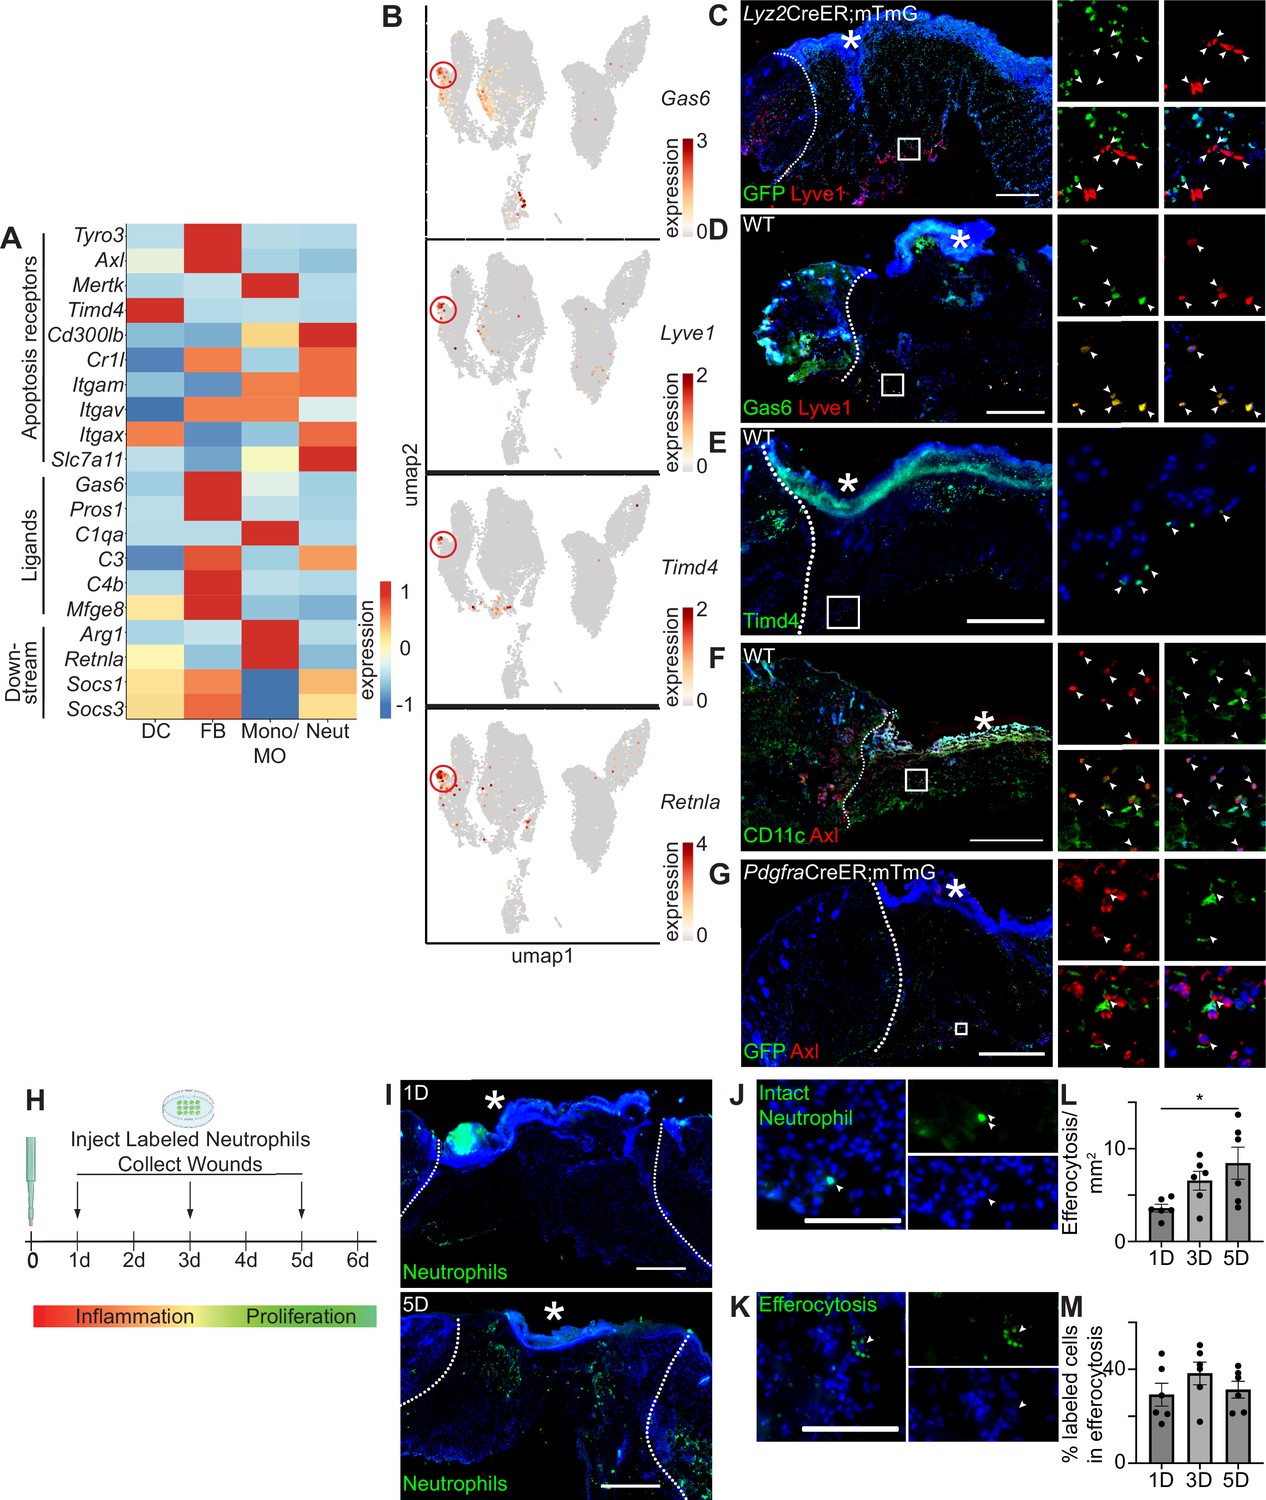
Apoptosis detection genes are highly expressed in the wound bed.
(A) Heatmap of differentially expressed efferocytosis pathway genes in 24 hr and 48 hr wound beds. Expression indicates scaled log-normalized mRNA counts. (B) Feature plots showing expression of Gas6, Lyve1, Timd4, and Retnla with Lyve1+ region highlighted. (C) Immunostaining for GFP (green) and Lyve1 (red) in Lyz2CreER;mTmG wound bed 24 hr after injury. Arrows indicate Lyve1+ cells. (D) Immunostaining for Gas6 (green) and Lyve1 (red) in wild-type (WT) wound bed 24 hr after injury. Arrows indicate double-positive Gas6+ Lyve1+ cells. (E) Immunostaining for Timd4 (green) in WT wound bed 24 hr after injury. Arrows indicate Timd4+ cells. (F) Immunostaining for CD11c (green) and Axl (red) in wound bed 24 hr after injury. Arrows indicate double-positive CD11c+ Axl+ cells. (G) Immunostaining for GFP (green) and Axl (red) in PdgfraCreER;mTmG wound bed 24 hr after injury. Arrows indicate double-positive GFP+ Axl+ cells. (H) Schematic of experimental design. (I) Immunostaining for CFSE-stained apoptotic neutrophils in wound beds 1 and 5 days after injury. (J) Example of CFSE-stained whole neutrophil in the wound bed. Scale bar = 100 µm. (K) Example of active efferocytosis of CFSE-stained whole neutrophil in the wound bed. Scale bar = 100 µm. (L) Quantification of instances of efferocytosis observed per mm2 in the wound bed. (M) Quantification of percentage of all stained cells that are undergoing efferocytosis in the wound bed. In L and M, n=6, error bars indicate mean ± SEM, unpaired t-test, *p<0.05, **p<0.01. * indicates scab. In C–I, scale bars = 500 µm.
Figure 2—figure supplement 1
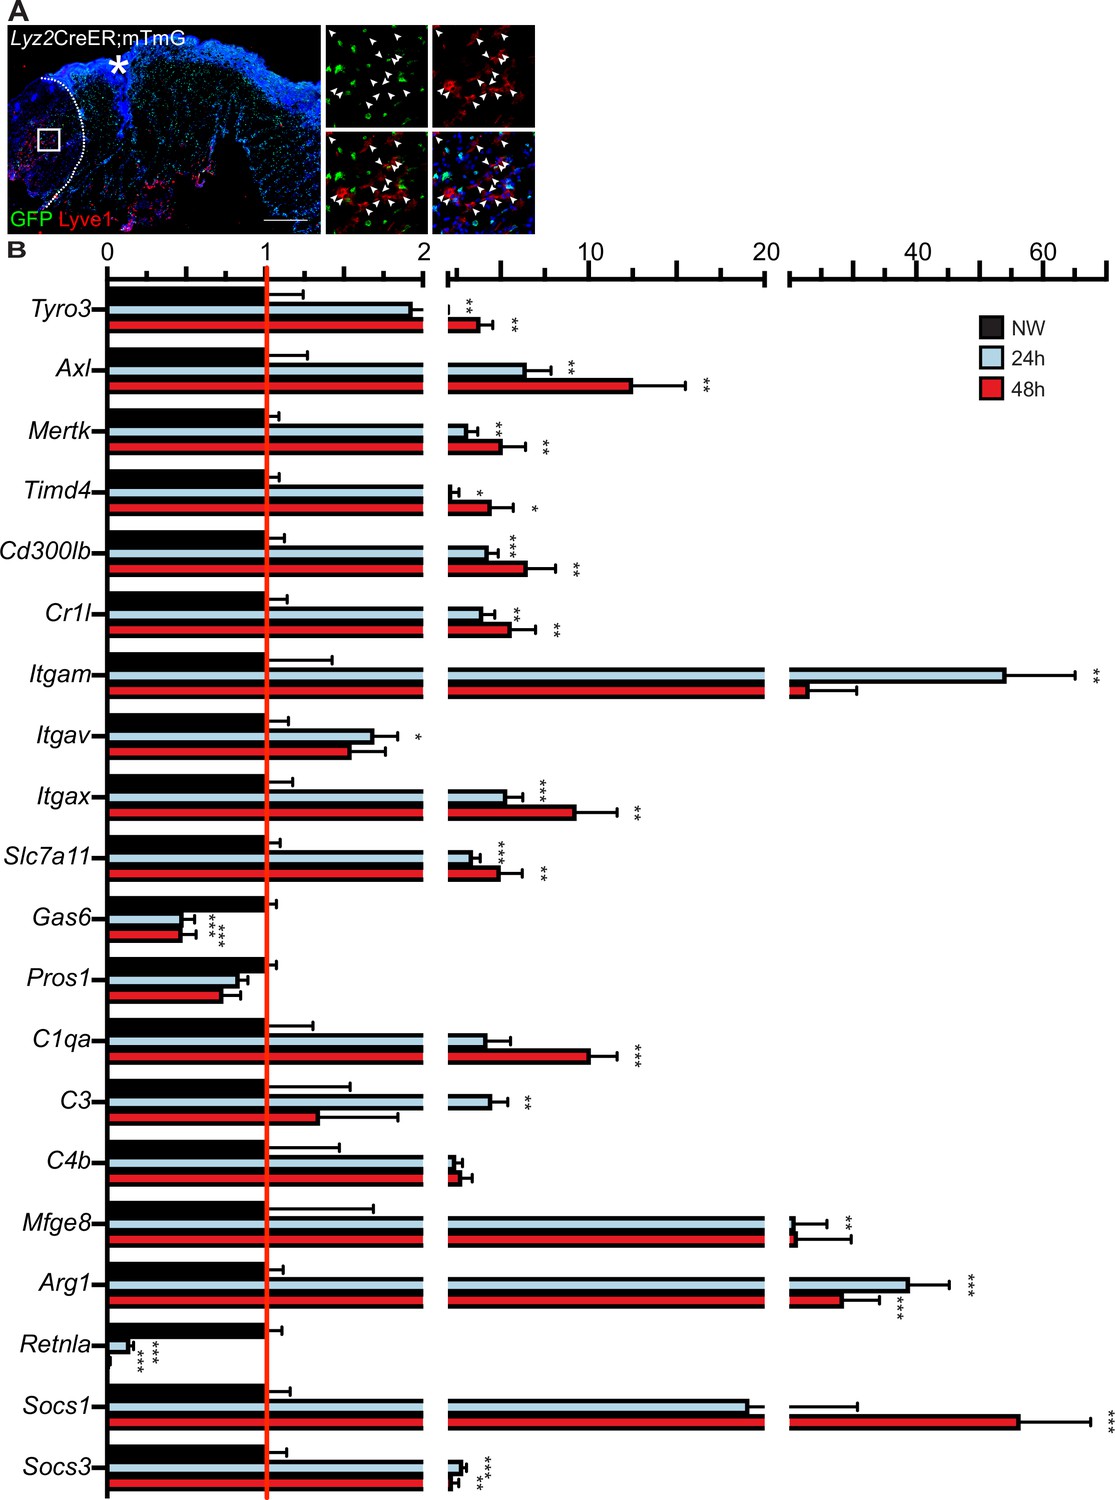
Lyve1 and apoptosis receptors, ligands, and downstream factors are expressed in 24 hr and 48 hr wound beds.
(A) Immunostaining for GFP (green) and Lyve1 (red) in Lyz2CreERmTmG wound bed-adjacent skin 24 hr after injury. Arrows indicate Lyve1+ cells, * indicates scab. Scale bar = 500 µm. (B) mRNA expression of genes relative to NW control at 24 hr and 48 hr after injury. Red line indicates normalized control mRNA levels. Error bars indicate mean ± SEM, n=3 independent experiments. Statistics using unpaired t-test are indicated; *p<0.05, **p<0.01, ***p<0.001.
Figure 3 with 1 supplement
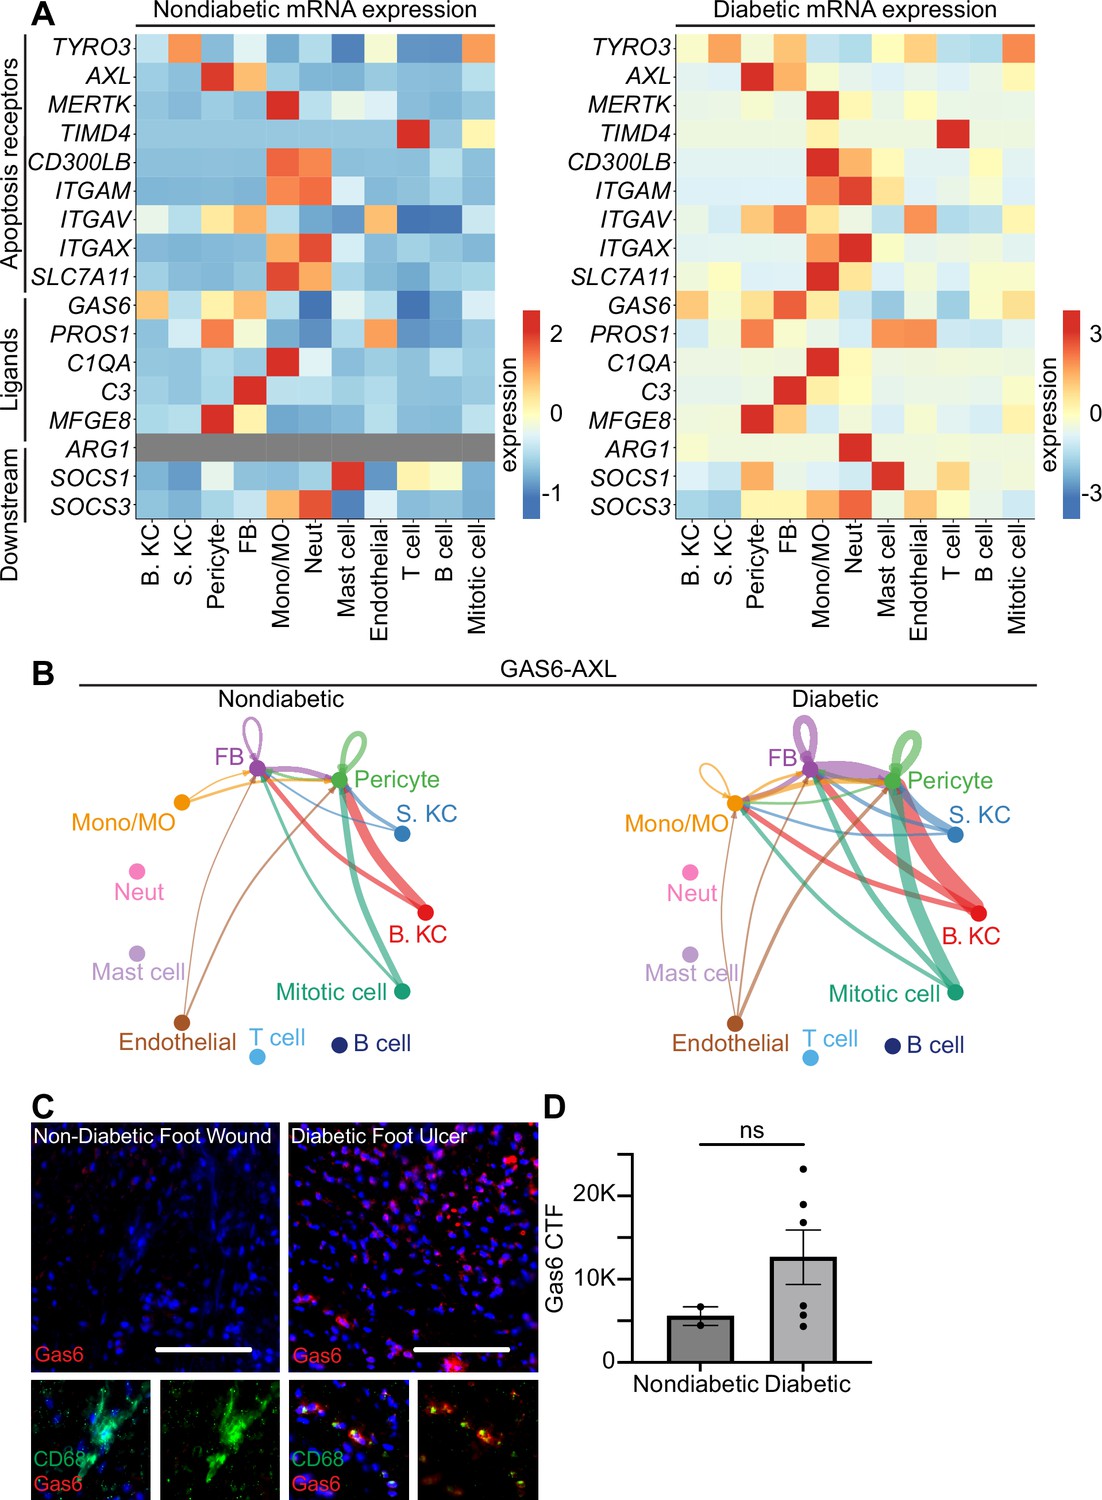
Human diabetic wounds have increased efferocytosis signaling expression compared to non-diabetic wounds.
(A) Heatmaps of differentially expressed genes related to efferocytosis in non-diabetic and diabetic wound beds. Expression indicates scaled log-normalized mRNA counts. (B) CellChat circle plot diagrams showing GAS6-AXL communication in non-diabetic and diabetic wound beds. (C) Left: Immunostaining for CD68 (green) and Gas6 (red) in non-diabetic foot wound. Right: Immunostaining for CD68 (green) and Gas6 (red) in diabetic foot ulcer. Scale bars = 50 µm. (D) Quantification of Gas6 corrected total fluorescence. Error bars indicate mean ± SEM. n=2 for Non-diabetic, and 6 for diabetic foot wound; ns, nonsignificant.
Figure 3—figure supplement 1
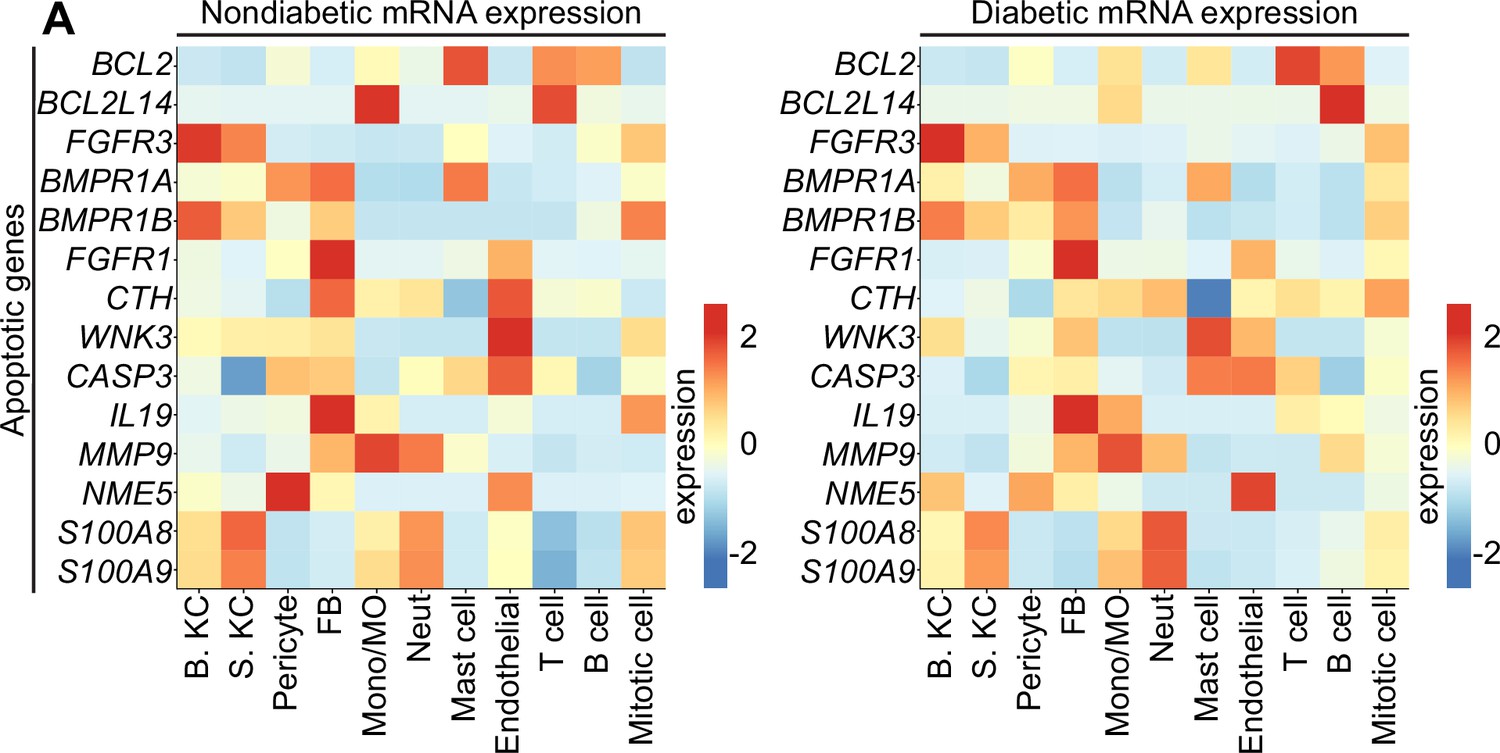
Human diabetic wounds have altered apoptosis gene expression compared to non-diabetic wounds.
(A) Heatmaps of differentially expressed genes related to efferocytosis in non-diabetic and diabetic wound beds. Expression indicates scaled log-normalized mRNA counts.
Figure 4 with 1 supplement
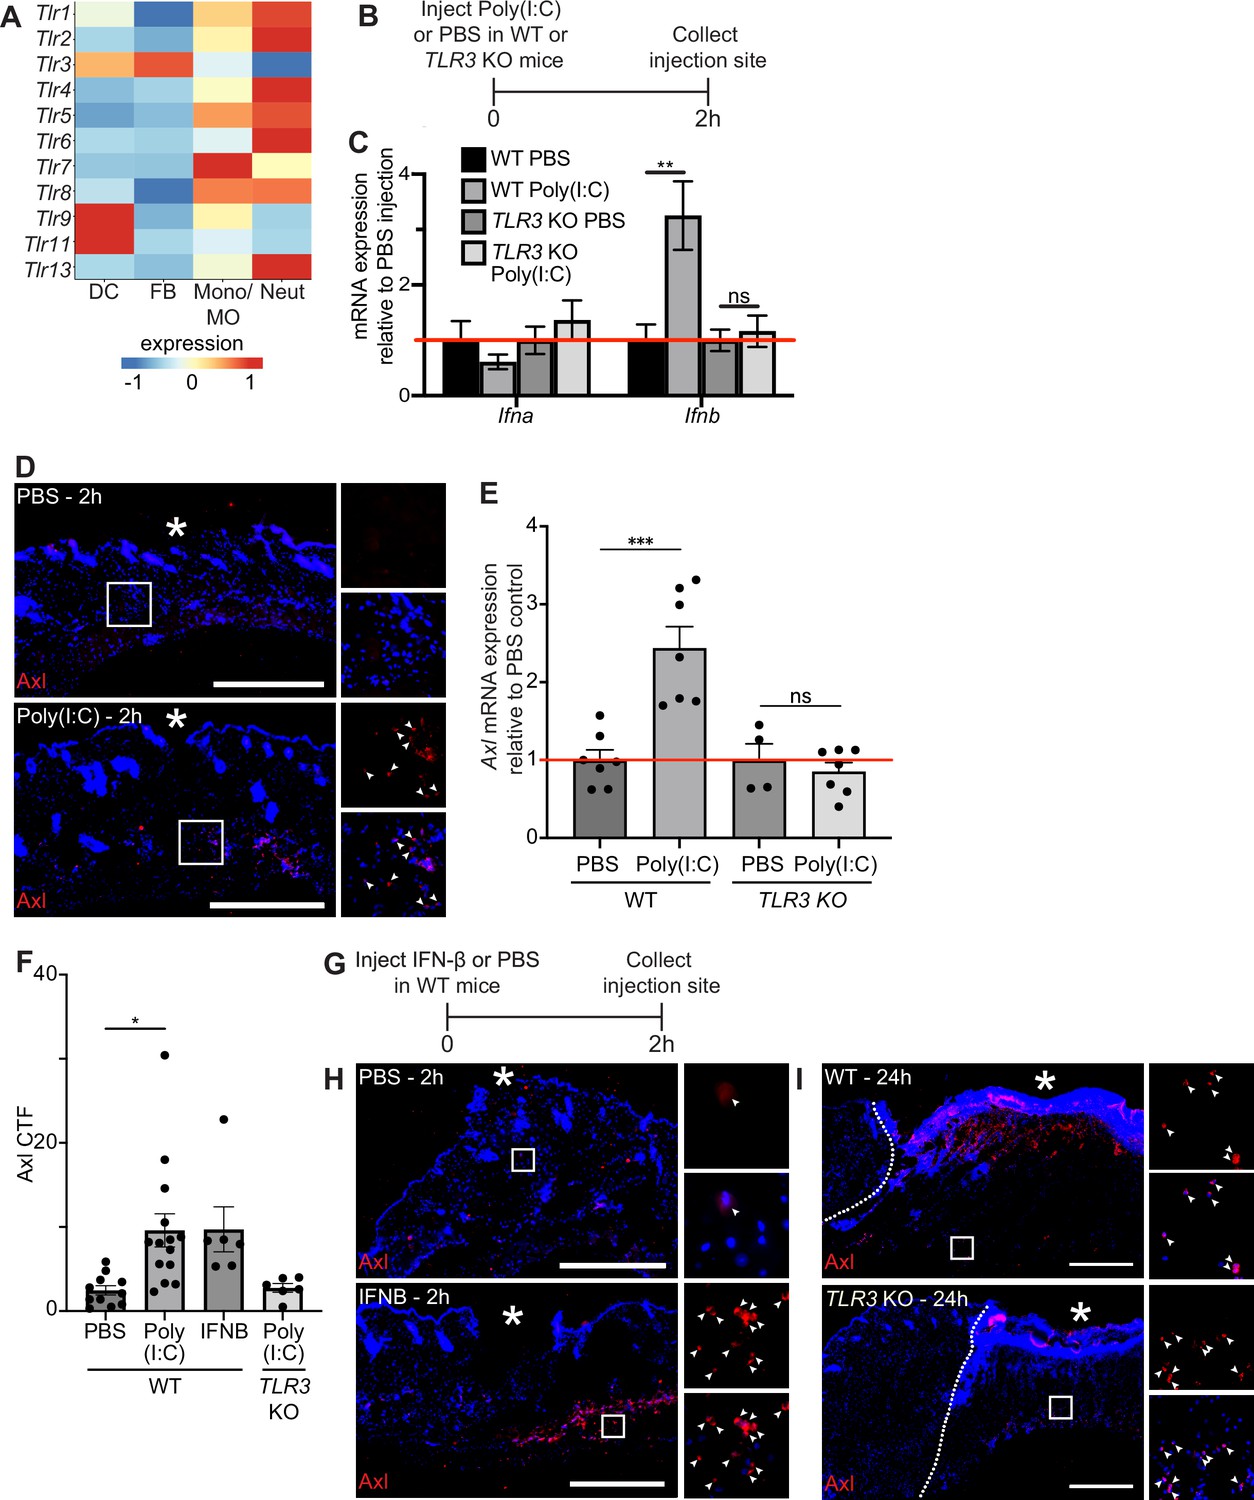
TLR3 signaling is sufficient to upregulate Axl in naive skin, but TLR3 is not required for Axl expression in the wound bed.
(A) Heatmap of differentially expressed TLR genes in 24 hr and 48 hr wound beds. Expression indicates scaled log-normalized mRNA counts. (B) Schematic of injection and collection protocol. (C) mRNA expression of interferon genes relative to respective PBS injection. Red line indicates normalized control mRNA levels. Error bars indicate mean ± SEM, unpaired t-test, n=4-6 mice; **p<0.01. ns, nonsignificant. (D) Immunostaining for Axl (red) in naive back skin injected with PBS or Poly(I:C). Arrows indicate Axl+ cells. * indicates injection site. (E) mRNA expression of Axl relative to respective PBS injection control 2 hr after injection. Red line indicates normalized control mRNA levels. Error bars indicate mean ± SEM, unpaired t-test, n=4-8 mice; ***p<0.001. ns, nonsignificant. (F) Quantification of corrected total fluorescence for Axl immunostaining in a 1 mm square containing the injection site. n=6-10 mice; Error bars indicate mean ± SEM, one-way ANOVA with multiple comparisons, *p<0.05. (G) Schematic of injection and collection protocol. (H) Immunostaining for Axl (red) in naive back skin injected with PBS or IFNB. Arrows indicate Axl+ cells. * indicates injection site. (I) Immunostaining for Axl (red) in wound beds 24 hr after injury in wild-type (WT) or TLR3 knockout (KO) mice. Arrows indicate Axl+ cells. * indicates scab. Scale bars = 500 µm.
Figure 4—figure supplement 1
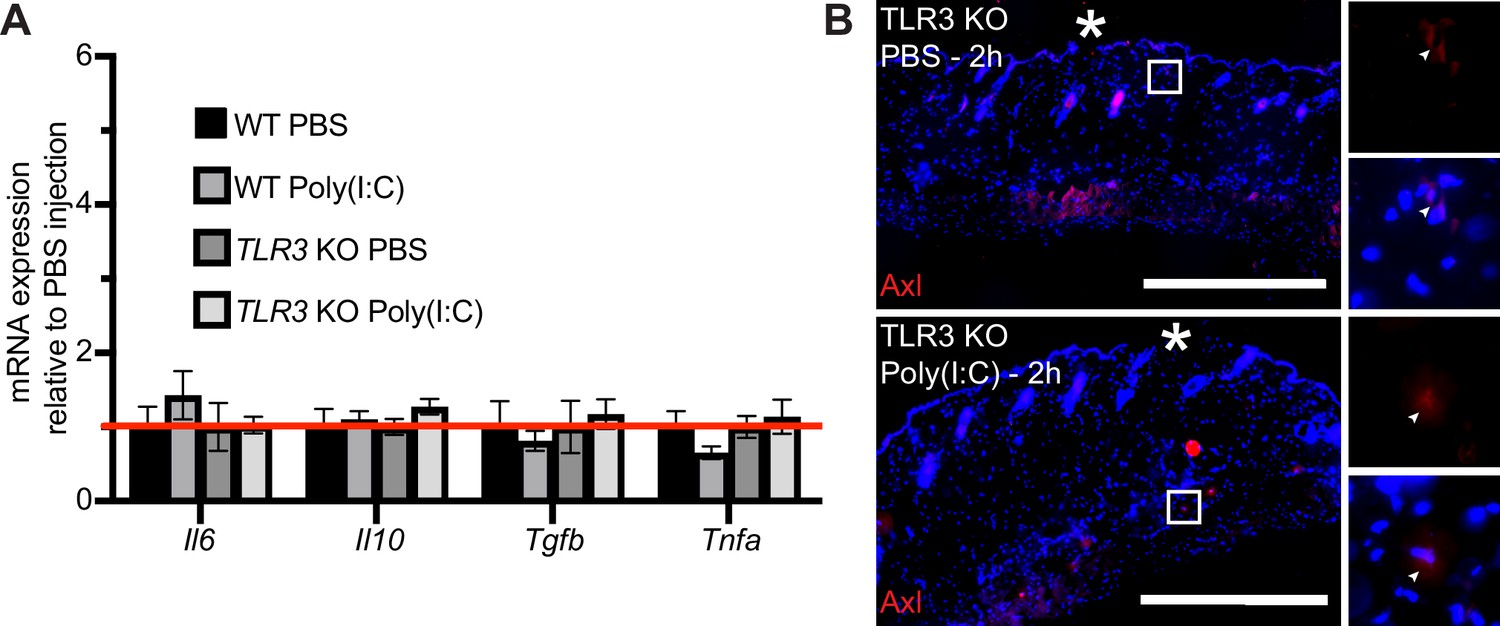
Poly(I:C) injection does not elicit Axl expression in TLR3 knockout (KO) model.
(A) mRNA expression of cytokine genes relative to respective PBS injection. Red line indicates normalized control mRNA levels. Error bars indicate mean ± SEM, n=4-6 mice. (B) Immunostaining for Axl (red) in naive back skin of TLR3 KO mice injected with PBS or Poly(I:C). Arrows indicate Axl+ cells. * indicates injection site. Scale bar = 500 µm.
Figure 5 with 1 supplement
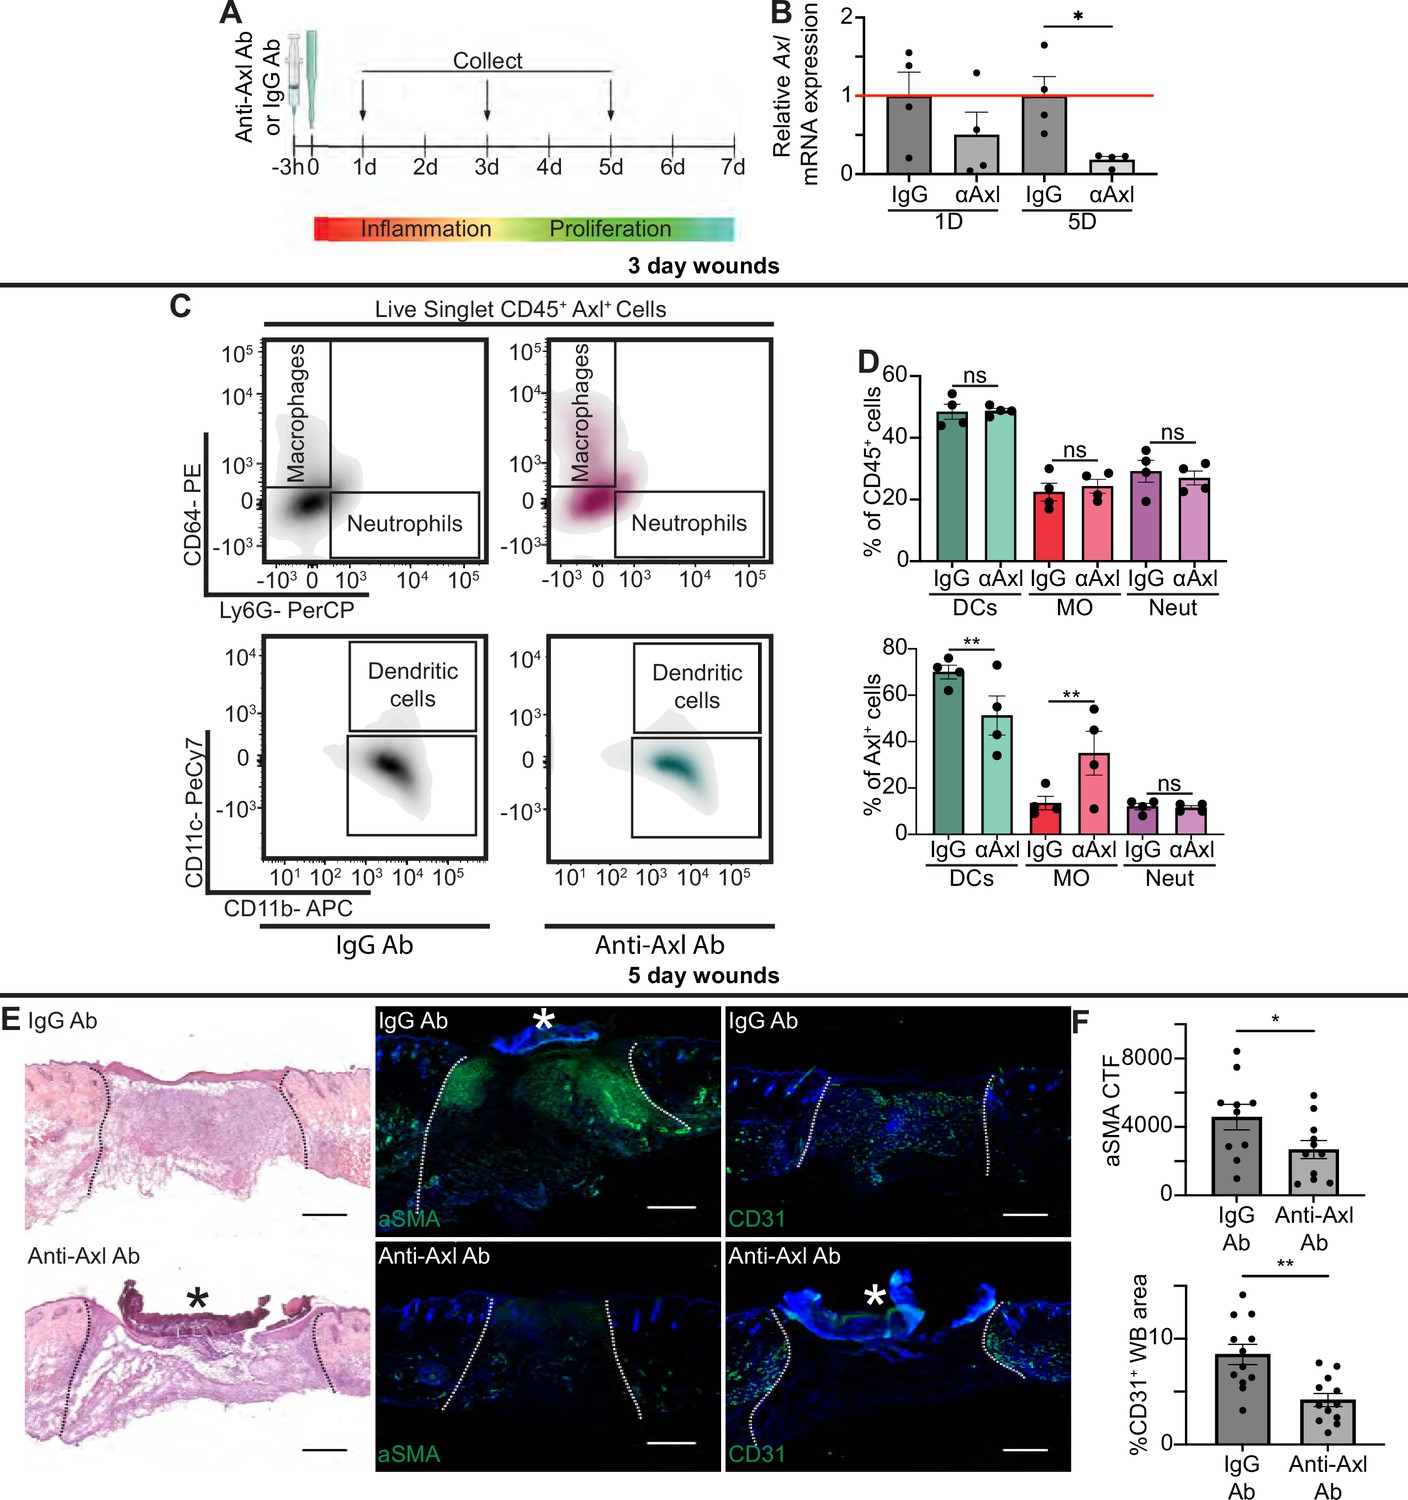
Axl antibody (Ab) inhibition results in defects to wound repair and changes to inflammation.
(A) Schematic of experimental design. (B) Axl mRNA expression normalized to respective IgG Ab control. Error bars indicate mean ± SEM, one-way ANOVA with multiple comparisons, n=4 mice, *p<0.05. (C) Representative flow cytometry gates used to analyze cells isolated from wounds 3 days after injection and injury. Live singlet CD45+ cells were identified as macrophages, neutrophils, or dendritic cells via fluorescent antibody staining. (D) Top: Quantification of CD45+ cells by cell type in anti-Axl Ab or IgG Ab-treated wound beds 3 days after injury. Error bars indicate mean ± SEM, one-way ANOVA with multiple comparisons, n=4 mice, ns, nonsignificant. Bottom: Quantification of Axl+ cells by cell type in anti-Axl Ab or IgG Ab-treated wound beds 3 days after injury. Error bars indicate mean ± SEM, two-way ANOVA with multiple comparisons, n=4 mice, **p<0.01. ns, nonsignificant. (E) Left: Hematoxylin and eosin (H&E) staining of wound beds 5 days after antibody injection and injury. Center: Immunostaining for aSMA (green) in wound beds 5 days after antibody injection and injury. Right: Immunostaining for CD31 (green) in wound beds 5 days after antibody injection and injury. * indicates scab. (F) Top: Quantification of aSMA corrected total fluorescence. Error bars indicate mean ± SEM, unpaired t-test, n=10 mice, *p<0.05. Bottom: Quantification of CD31+ pixels in wound bed. Error bars indicate mean ± SEM, unpaired t-test, **p<0.01. Scale bars = 500 µm.
Figure 5—figure supplement 1
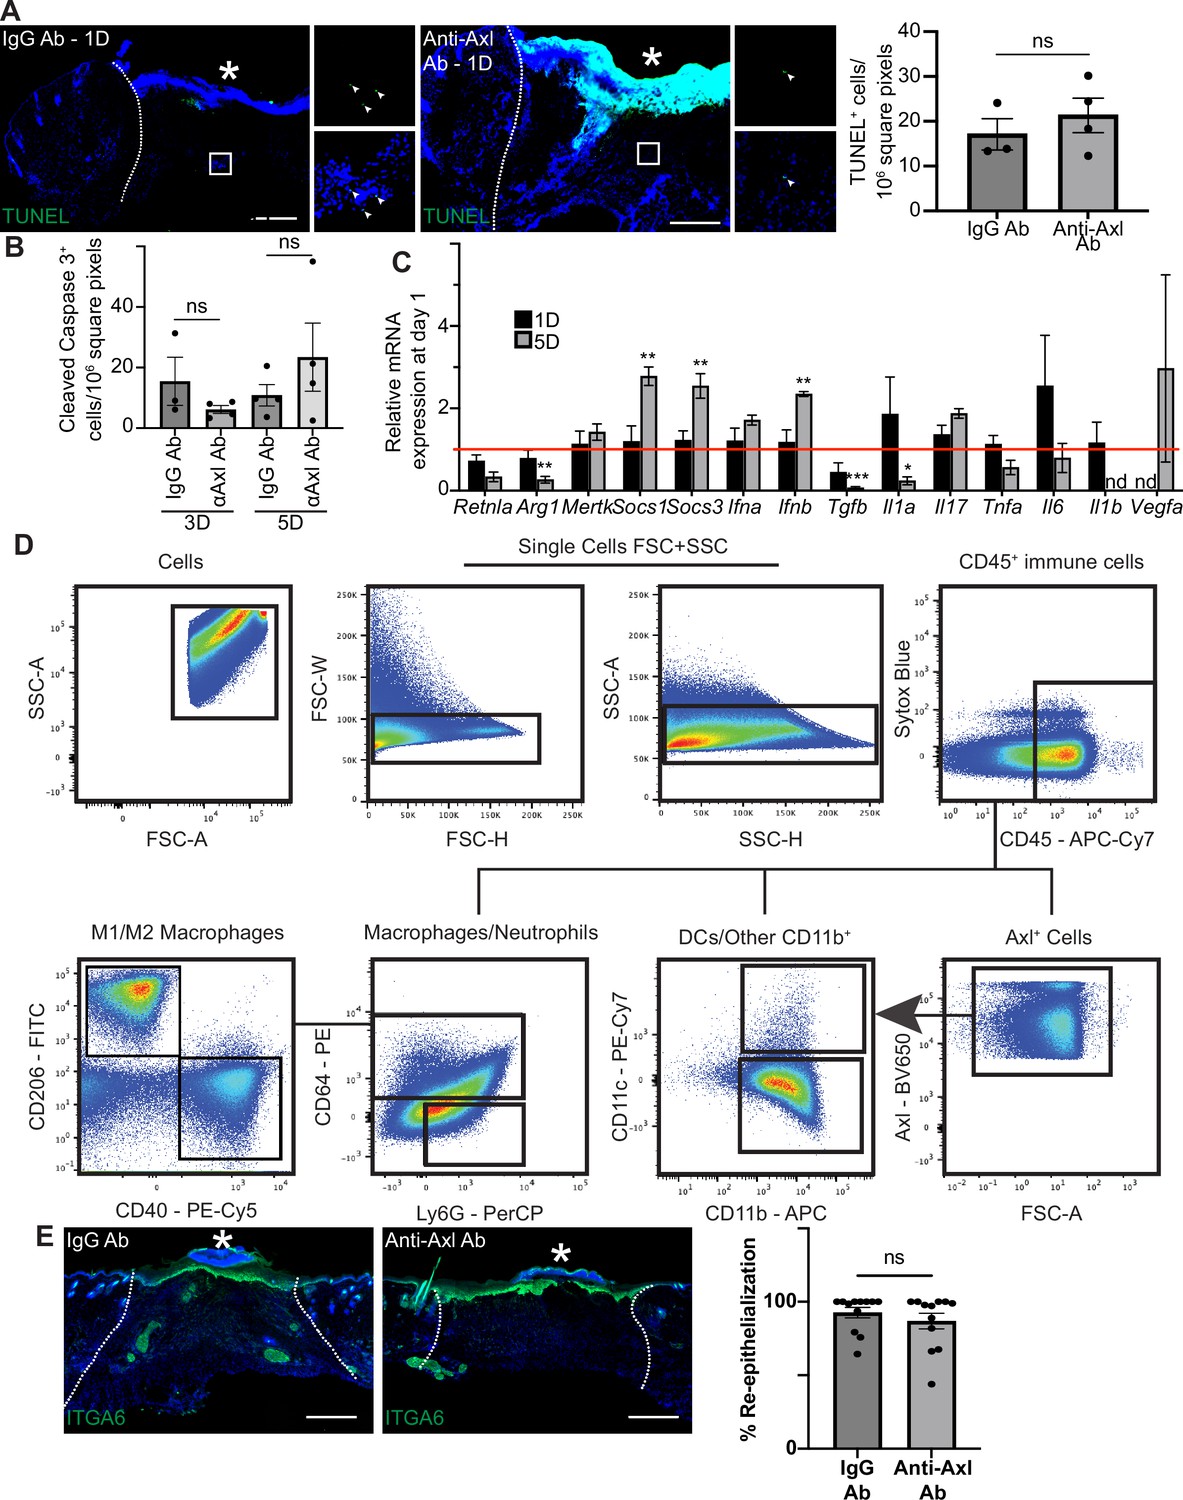
Analysis of anti-Axl antibody (Ab) and IgG control-treated wound beds.
(A) Left: Immunostaining for TUNEL (green) in wound beds injected with anti-Axl Ab or IgG Ab control 1 day after injury. Arrows indicate TUNEL+ cells. * indicates scab. Scale bars = 500 µm. Right: Quantification of TUNEL+ cells per 106 square pixels in 1-day wounds. Error bars indicate mean ± SEM. ns, nonsignificant. (B) Quantification of cleaved caspase 3+ cells per 106 square pixels in 3- and 5-day wounds. Error bars indicate mean ± SEM. ns, nonsignificant. (C) mRNA expression of genes involved in TAM receptor signaling and cytokines relative to IgG Ab control 1 and 5 days after injury. Red line indicates normalized control mRNA levels for respective IgG control. Error bars indicate mean ± SEM, one-way ANOVA with multiple comparisons, *p<0.05, **p<0.01, ***p<0.001. (D) Representative fluorescence-activated single-cell sorting (FACS) dot plots of gating strategy to identify single cells, CD45+ immune cells, Axl+ cells, and immune cell populations. (E) Left: Immunostaining for ITGA6 (green) in wound beds 5 days after antibody injection and injury. Right: Quantification of % re-epithelialization for 5-day wound beds. Error bars indicate mean ± SEM, ns, nonsignificant.
Figure 6 with 1 supplement
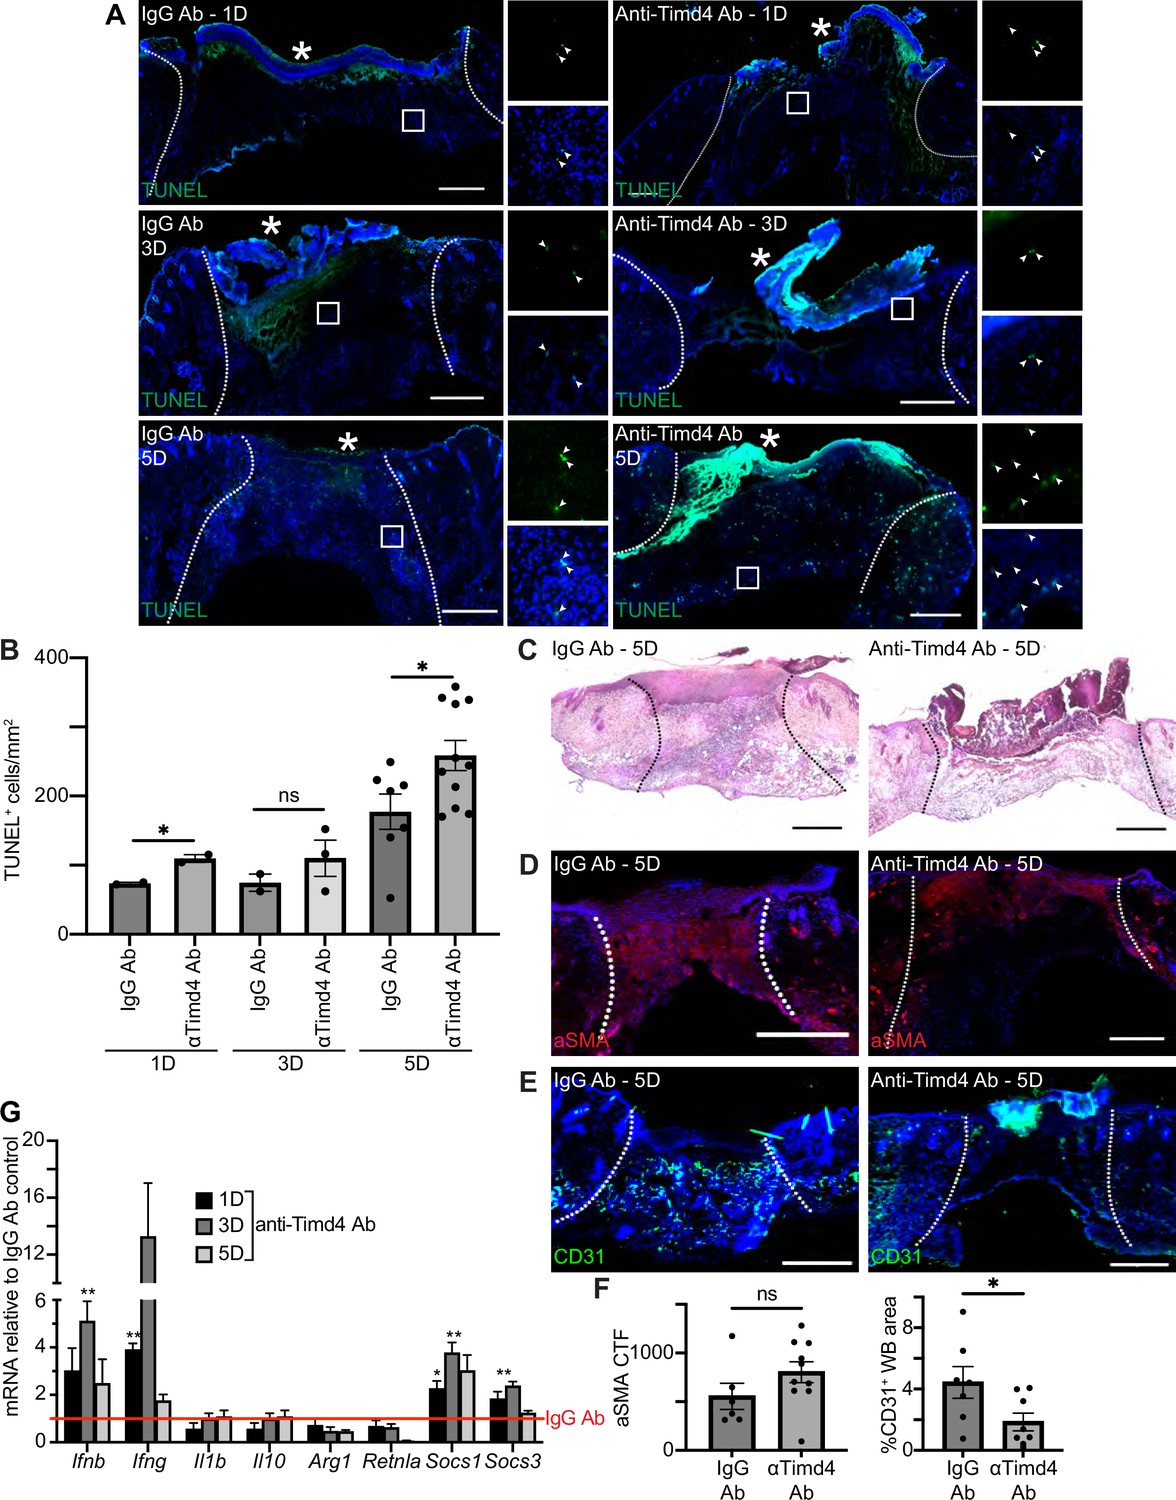
Timd4 function is required for efferocytosis during skin repair.
(A) Immunostaining for TUNEL (green) in wound beds injected with anti-Timd4 antibody (Ab) or IgG Ab control 1, 3, or 5 days after injury. Arrows indicate TUNEL+ cells. * indicates scab. (B) Quantification of TUNEL+ cells per mm2 in the wound bed. Error bars indicate mean ± SEM, one-way ANOVA, n=3-7 mice; *p<0.05, ns, nonsignificant. (C) Hematoxylin and eosin (H&E) staining of wound beds 5 days after antibody injection and injury. (D) Immunostaining for aSMA (red) in wound beds 5 days after antibody injection and injury. (E) Immunostaining for CD31 (green) in wound beds 5 days after antibody injection and injury. (F) Left: Quantification of aSMA corrected total fluorescence. Error bars indicate mean ± SEM. ns, nonsignificant. Right: Quantification of CD31+ pixels in wound bed. Error bars indicate mean ± SEM, unpaired t-test, n=6-9 mice; *p<0.05. (G) mRNA expression of genes relative to respective IgG Ab control. Red line indicates normalized control mRNA levels. Error bars indicate mean ± SEM, n=4-6 mice; unpaired t-test *p<0.01, **p<0.01. Scale bars = 500 µm.
Figure 6—figure supplement 1
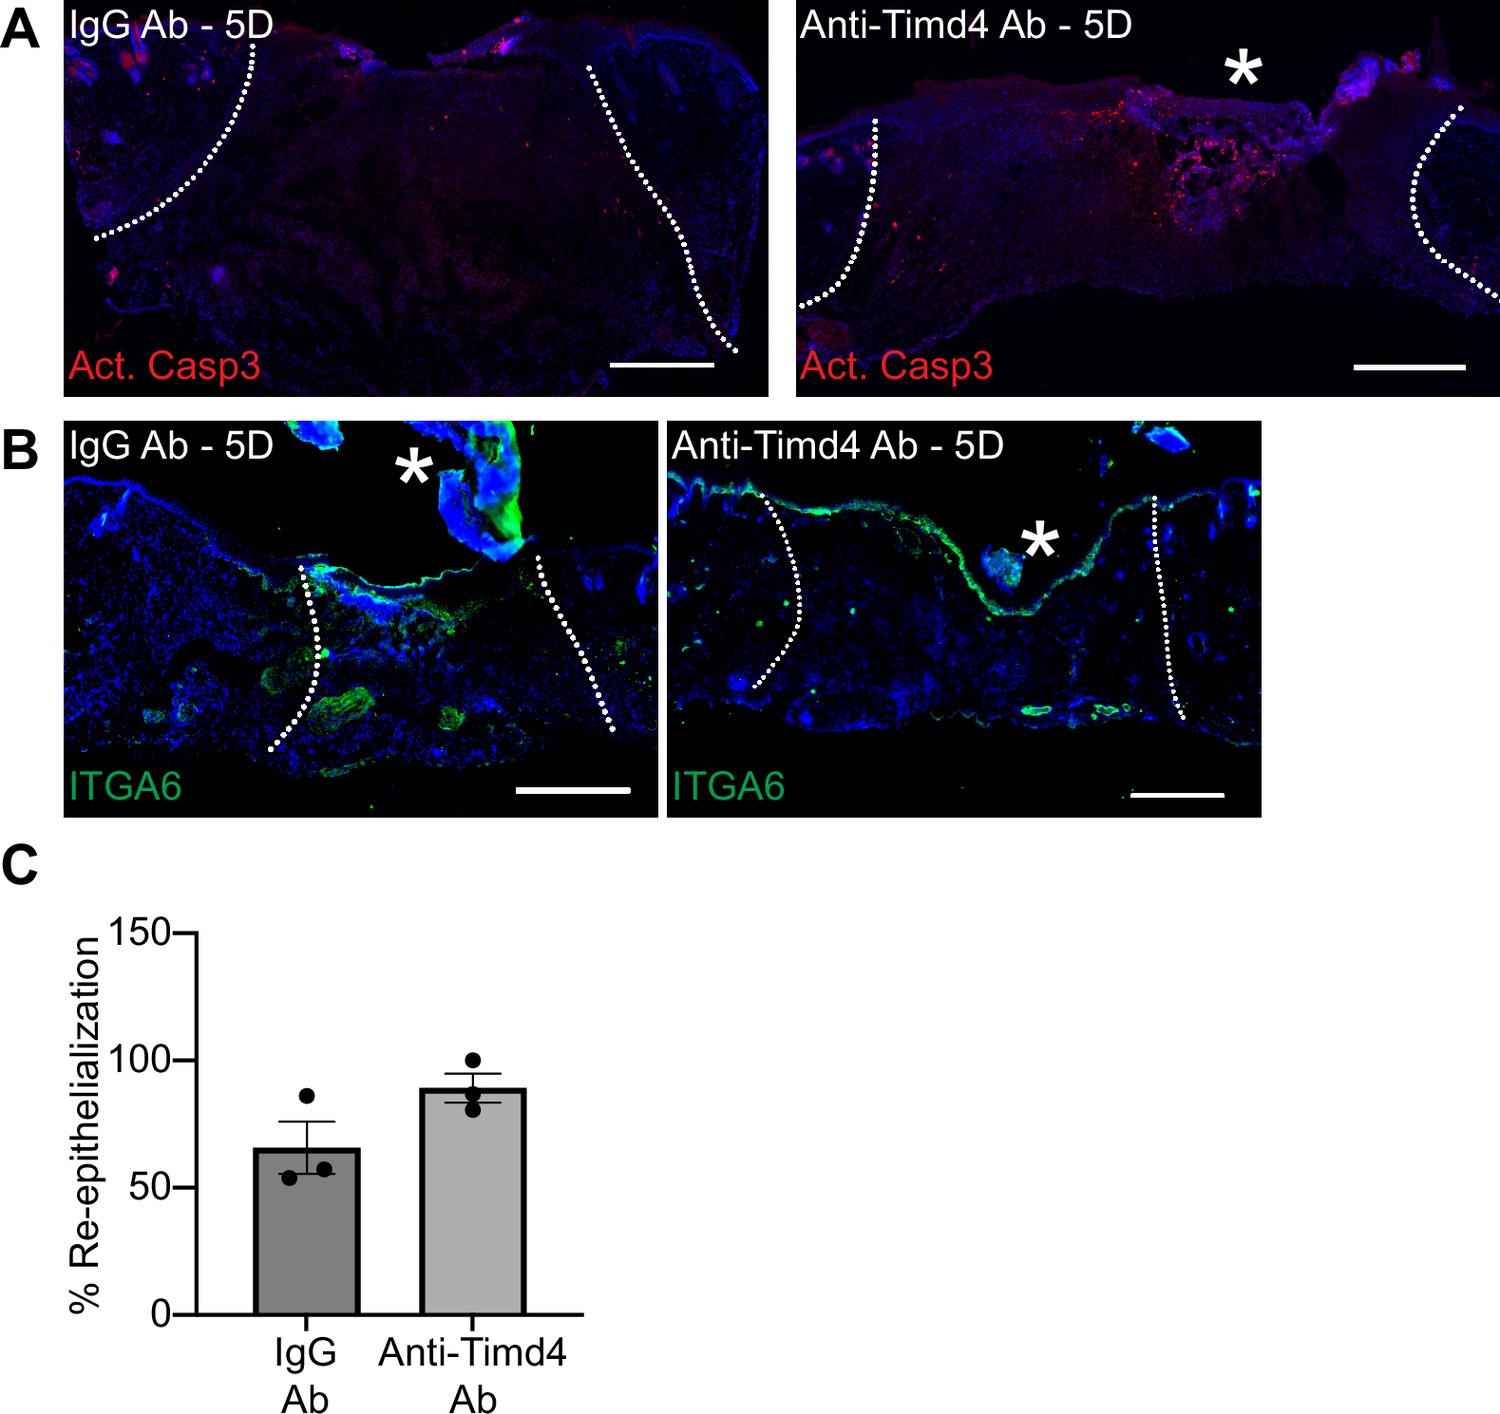
Re-epithelialization is not significantly altered in anti-Axl antibody and IgG control-treated wound beds.
(A) Immunostaining for cleaved caspase 3 (red) in wound beds 5 days after antibody injection and injury. (B) Immunostaining for ITGA6 (green) in wound beds 5 days after antibody injection and injury. (C) Quantification of % re-epithelialization for 5-day wound beds. Error bars indicate mean ± SEM. n=3 mice; * indicates scab. Scale bars = 500 µm.
Additional files
-
Supplementary file 1
Demographics as reported in subjects’ medical records.
- https://cdn.elifesciences.org/articles/86269/elife-86269-supp1-v1.docx
-
MDAR checklist
- https://cdn.elifesciences.org/articles/86269/elife-86269-mdarchecklist1-v1.pdf
Download links
A two-part list of links to download the article, or parts of the article, in various formats.
Downloads (link to download the article as PDF)
Open citations (links to open the citations from this article in various online reference manager services)
Cite this article (links to download the citations from this article in formats compatible with various reference manager tools)
Apoptosis recognition receptors regulate skin tissue repair in mice
eLife 12:e86269.
https://doi.org/10.7554/eLife.86269


