Profiling the bloodstream form and procyclic form Trypanosoma brucei cell cycle using single-cell transcriptomics
- Institute for Immunology and Infection Research, School of Biological Sciences, University of Edinburgh, United Kingdom
- Wellcome Centre for Integrative Parasitology, School of Infection & Immunity, University of Glasgow, United Kingdom
Figures
Figure 1 with 2 supplements
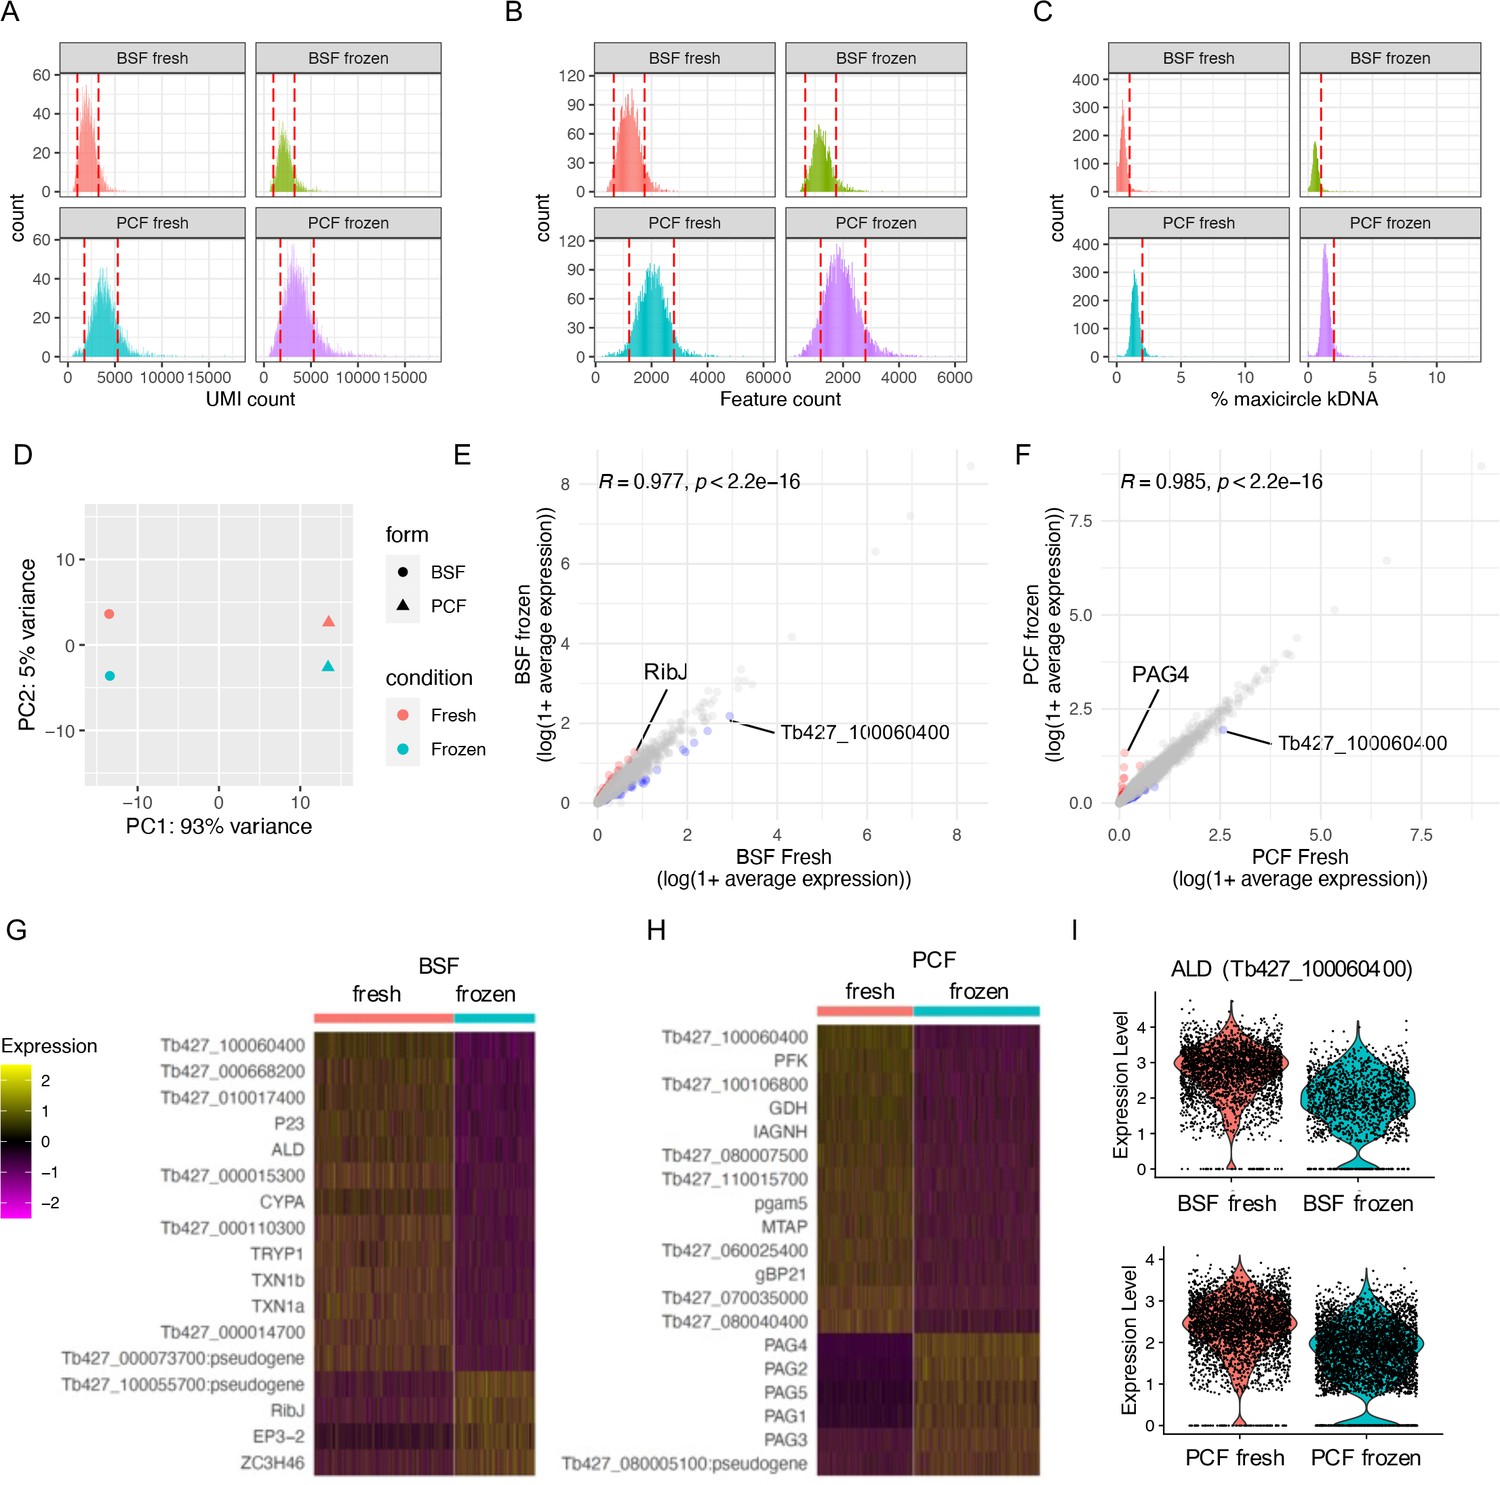
scRNA-seq of cryopreserved and fresh T. brucei bloodstream form (BSF) and procyclic form (PCF).
(A) The unique molecular identifiers (UMI, x-axis) captured per cell (count, y-axis) by Chromium scRNA-seq with BSF and PCF taken fresh from in vitro culture (fresh) or after cryopreservation in liquid nitrogen (LN2) (frozen). Red dashed lines indicate threshold used for QC filtering of each sample. (B) Number of genes (features, x-axis) for which transcripts were capture per cell. (C) Percentage of transcripts captured per cell that are encoded by genes on the mitochondrial maxicircle kDNA genome (% maxicircle kDNA, y-axis). (D) Top 2 components (PC1 and PC2) identified with PC analysis after pseudobulking all counts for each sample. Fresh (red) and frozen (blue) samples are shown for BSFs (circle) and PCFs (triangles). (E) Average expression of each gene across all cells for BSF fresh (x-axis) and BSF frozen (y-axis) plotted as log(1 + mean average count). Correlation coefficient and p-value of one-tailed Wilcox test is indicated above. Gene with increased fold change (FC) >2 in frozen sample are coloured red and those decreased in blue. (F) Average gene expression of PCF samples, as in E. (G) Scaled expression of genes DE between fresh and frozen BSF scRNA-seq (adjusted p-value <0.05, FC >1.5). Gene names are given when available, otherwise gene IDs are shown. (H) as in G for PCF samples. (I) Raw transcript counts (expression level) for fructose-bisphosphate aldolase (ALD; Tb427_100060400) in BSF (upper) and PCF (lower).
Figure 1—figure supplement 1

Effect of cryopreservation on T. brucei viability.
(A) The percentage of motile bloodstream form (BSF) and procyclic form (PCF) parasites after preservation in liquid nitrogen (LN2) for 3, 7, or 28 days. Growth curves of BSFs (B) and PCFs (C) after being recovered from cryopreservation by the slow thawing protocol and returned to culture after 28 days of storage. Error bars show the standard deviation from the mean of two biological replicates.
Figure 1—figure supplement 2
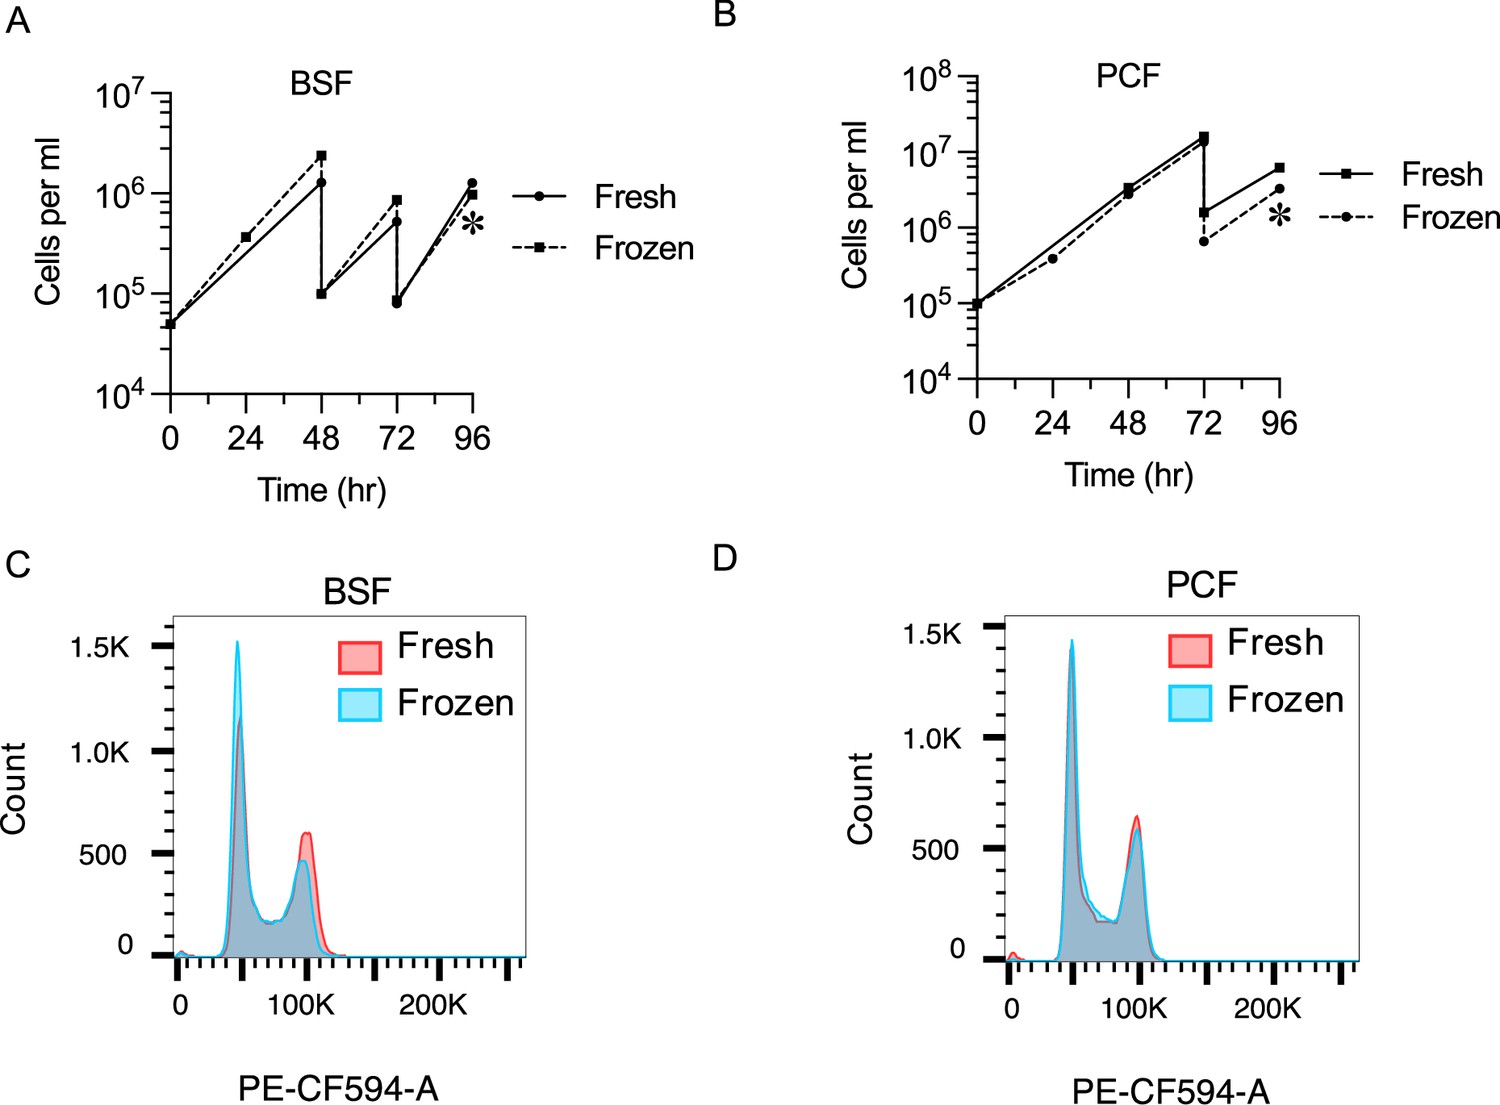
Preparation of replicating bloodstream form (BSF) and procyclic form (PCF) T. brucei prior to scRNA-seq or cryopreservation.
Growth of BSF (A) and PCF (B) T. brucei passaged over 4 days prior to immediate scRNA-seq preparation of fresh (solid line) samples, or cryopreservation of frozen (dashed line) at the point indicated by an asterisk. Frozen samples were cryopreserved at this point, and later thawed and immediately processed for scRNA-seq. Flow cytometry analysis of PI samples stained at the point indicated by asterisk for BSFs (C) and PCFs (D).
Figure 2 with 4 supplements
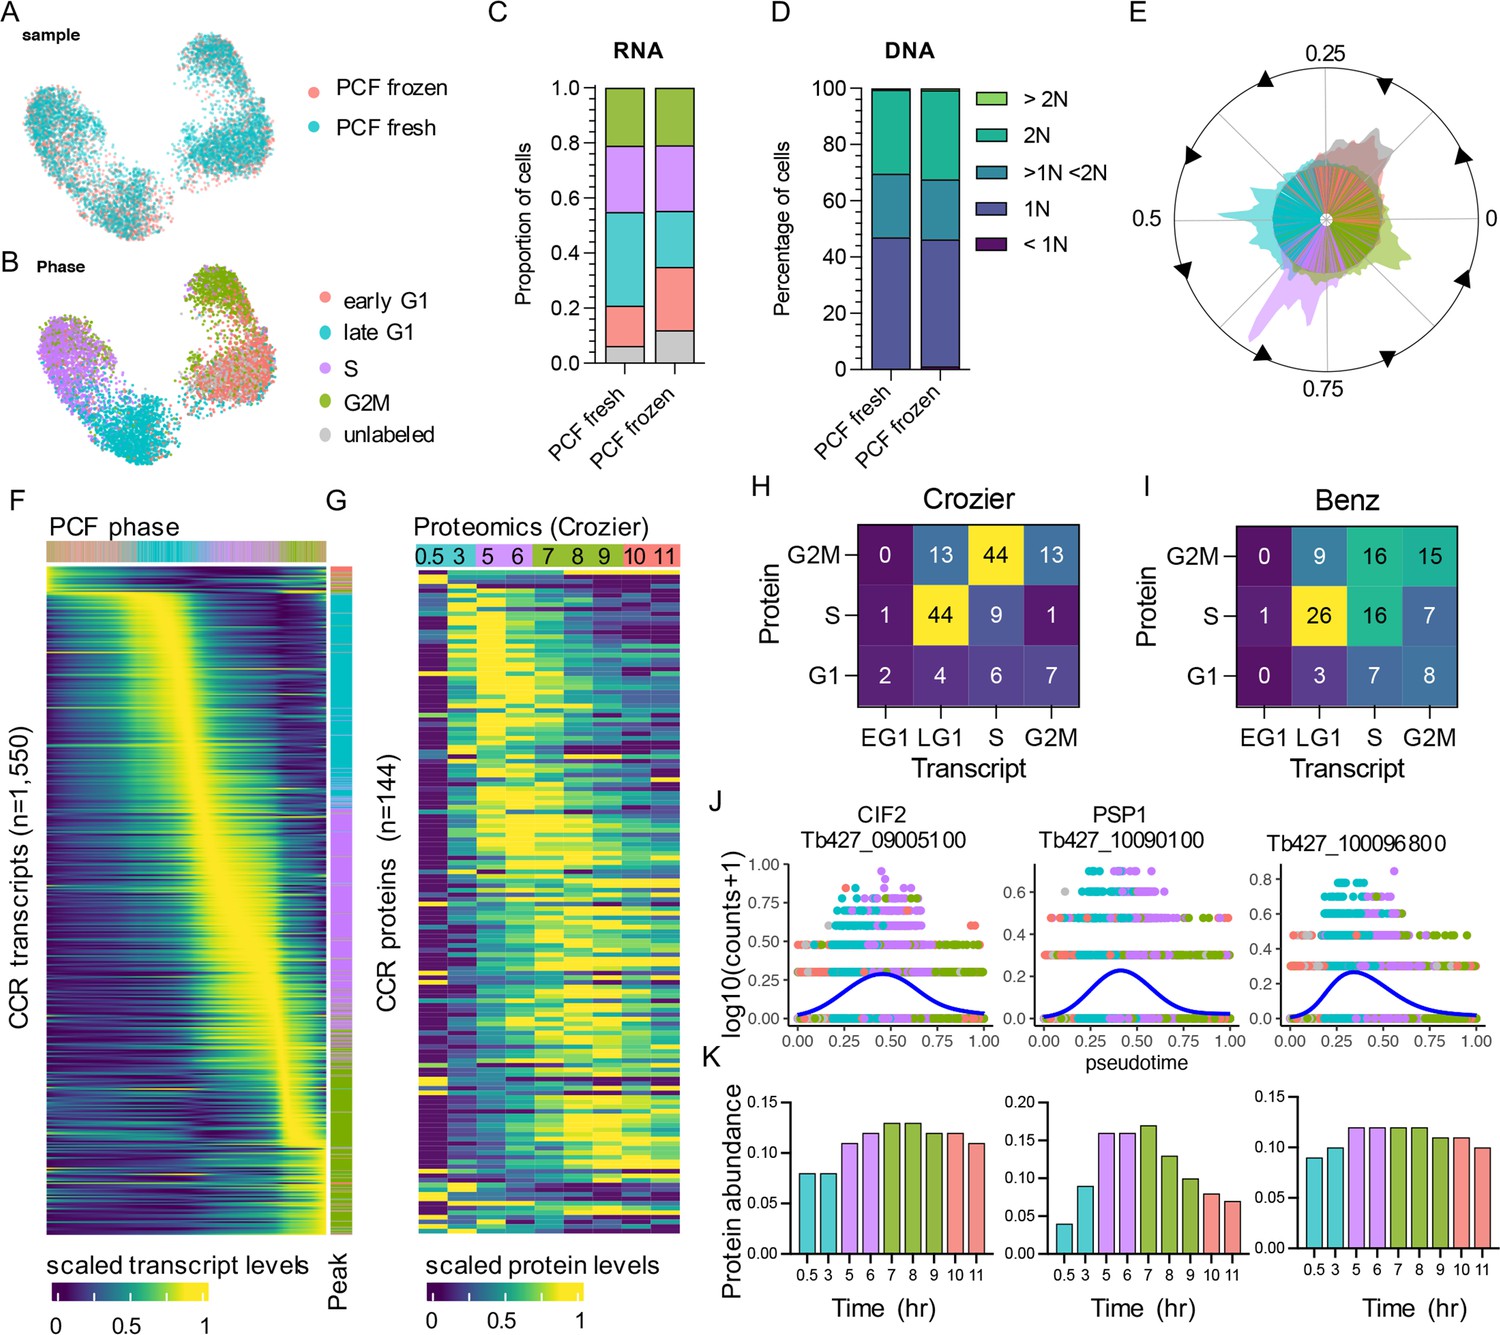
The cell cycle transcriptome of procyclic form (PCF) T. brucei.
(A) Unifold manifold approximation and projection (UMAP) plot of integrated PCF transcriptomes from fresh (blue) and frozen (red) samples. (B) UMAP of PCF transcriptomes coloured by inferred cell cycle phase. (C) Proportion of cells assigned to each phase by transcriptomics as in B. Legend as in B. (D) Proportion of cells with DNA content assessed by flow cytometry. (E) Histogram of transcriptomes arranged in pseudotime (anti-clockwise) representing cell cycle progression. Each line in inner circle indicates one transcriptome coloured by phase as in B. Outer circle histogram of showing number of cells at each point in pseudotime (0–1). (F) Scaled transcript levels of cell cycle regulated (CCR) genes (rows), ordered by peak time, plotted across transcriptomes (columns) ordered in pseudotime. Top annotation indicates cell phase, right annotation indicates phase with highest expression of each gene. (G) Scaled protein abundance for 129 genes identified as CCR by Crozier et al., plotted in the same order as F. Time points are indicated in top annotation, coloured by the most enriched cell cycle phase for each sample. Numbers of genes with highest transcript expression in each phase analysed by scRNA-seq (x-axis) and highest protein level identified by Crozer et al. (H) and Benz et al. (I) proteomics studies. (J) Transcript counts of three genes (y-axis) plotted across pseudotime (x-axis). Each dot shows one transcriptome coloured by phase as in B. Blue line shows smoothed expression across pseudotime. (K) Protein abundance for the same genes as in J, previously identify as CCR by Crozier et al. Time point and colour of most enriched phase for each sample (x-axis) as in G.
Figure 2—figure supplement 1
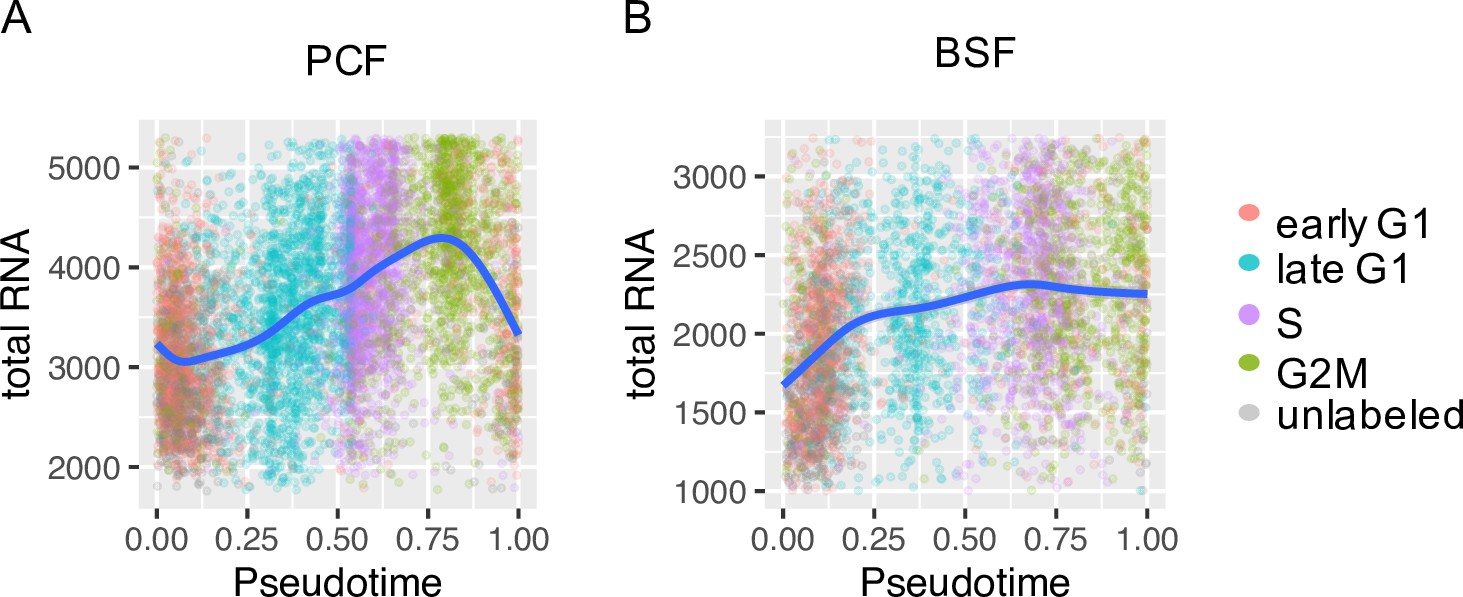
Total RNA captured per cell across bloodstream form (BSF) and procyclic form (PCF) cell cycle progression.
Total unique transcripts per cell is plotted on the y-axis (total RNA) over the inferred pseudotime (x-axis) for PCF (A) and BSF (B). Each cell is coloured by assigned cell cycle phase. Blue solid line indicates smoothed average RNA over pseudotime.
Figure 2—figure supplement 2
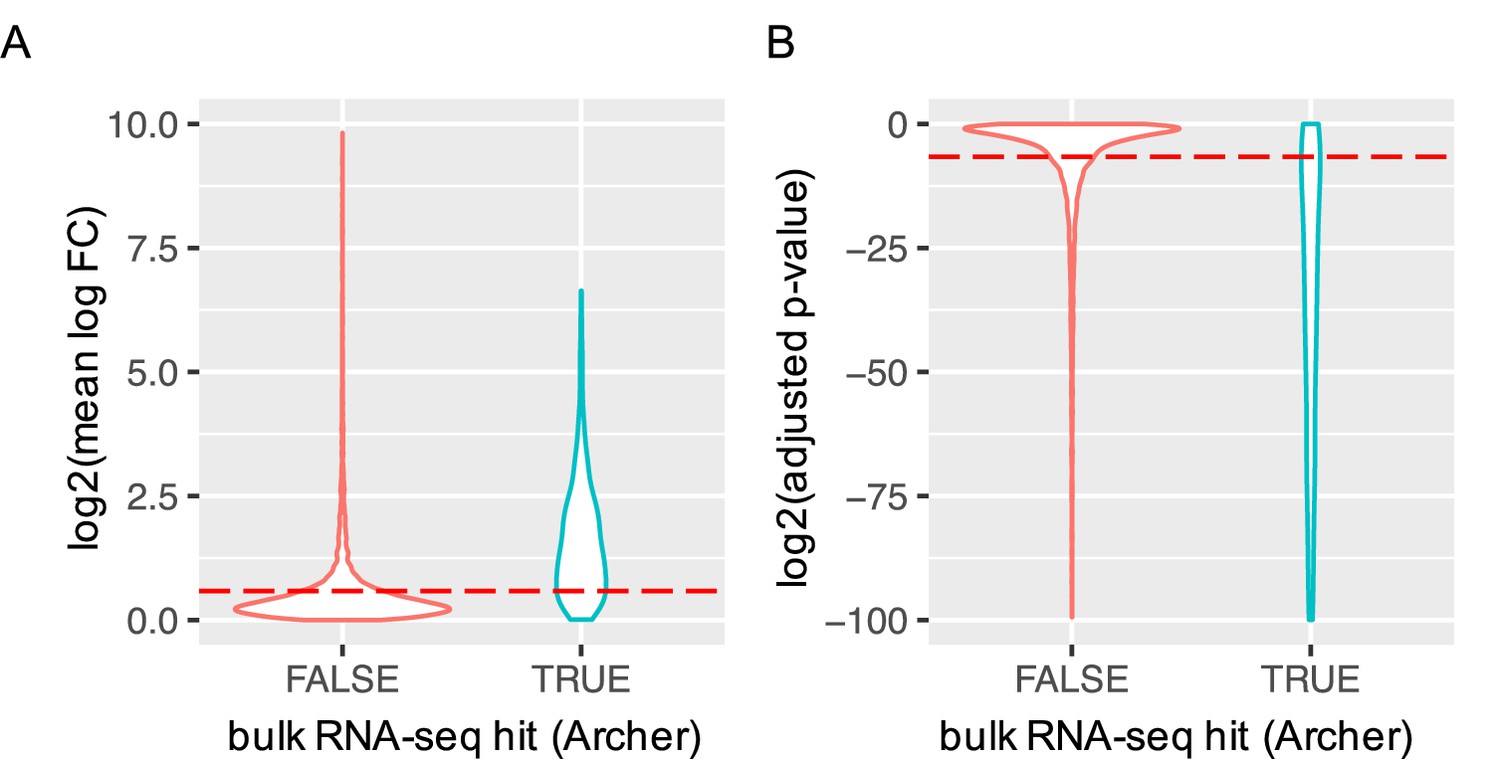
Cell cycle regulated (CCR) gene selection thresholds.
Violin plots indicate genes mean logFC over procyclic form (PCF) pseudotime (A) and Benjamini-Hochberg adjusted p-values (B) for genes (x-axis) grouped by whether they were previously identified at CCR using bulk RNA-seq (Archer et al., 2011). Red dashed lines indicate threshold used to define CCR genes in scRNA-seq analysis: FC >1.5 and adjusted p-value <0.01.
Figure 2—figure supplement 3
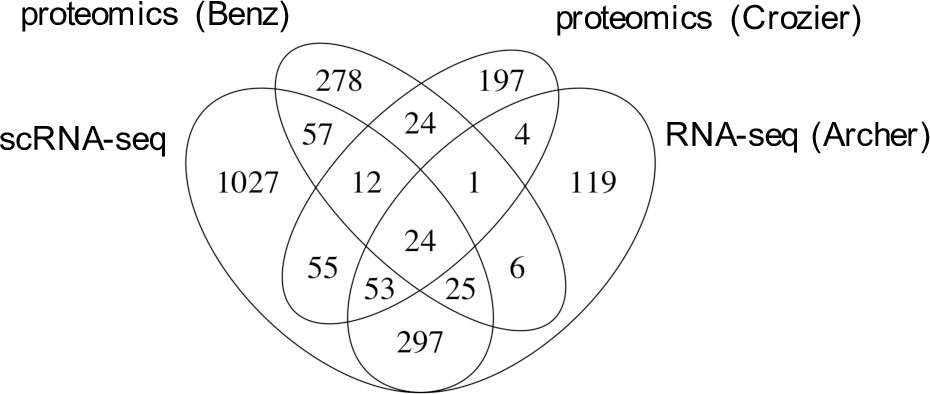
Comparison of cell cycle regulated (CCR) genes selected in transcriptomic and proteomic studies.
Venn diagram indicates the number of common genes identified in the procyclic form (PCF) scRNA-seq cell cycle analysis presented here, proteomic analysis from Crozier et al., 2018, proteomics analysis from Benz and Urbaniak, 2019, and bulk-RNA-seq from Archer et al., 2011. Genes were selected based on the same thresholds used in the original analysis of each study.
Figure 2—figure supplement 4
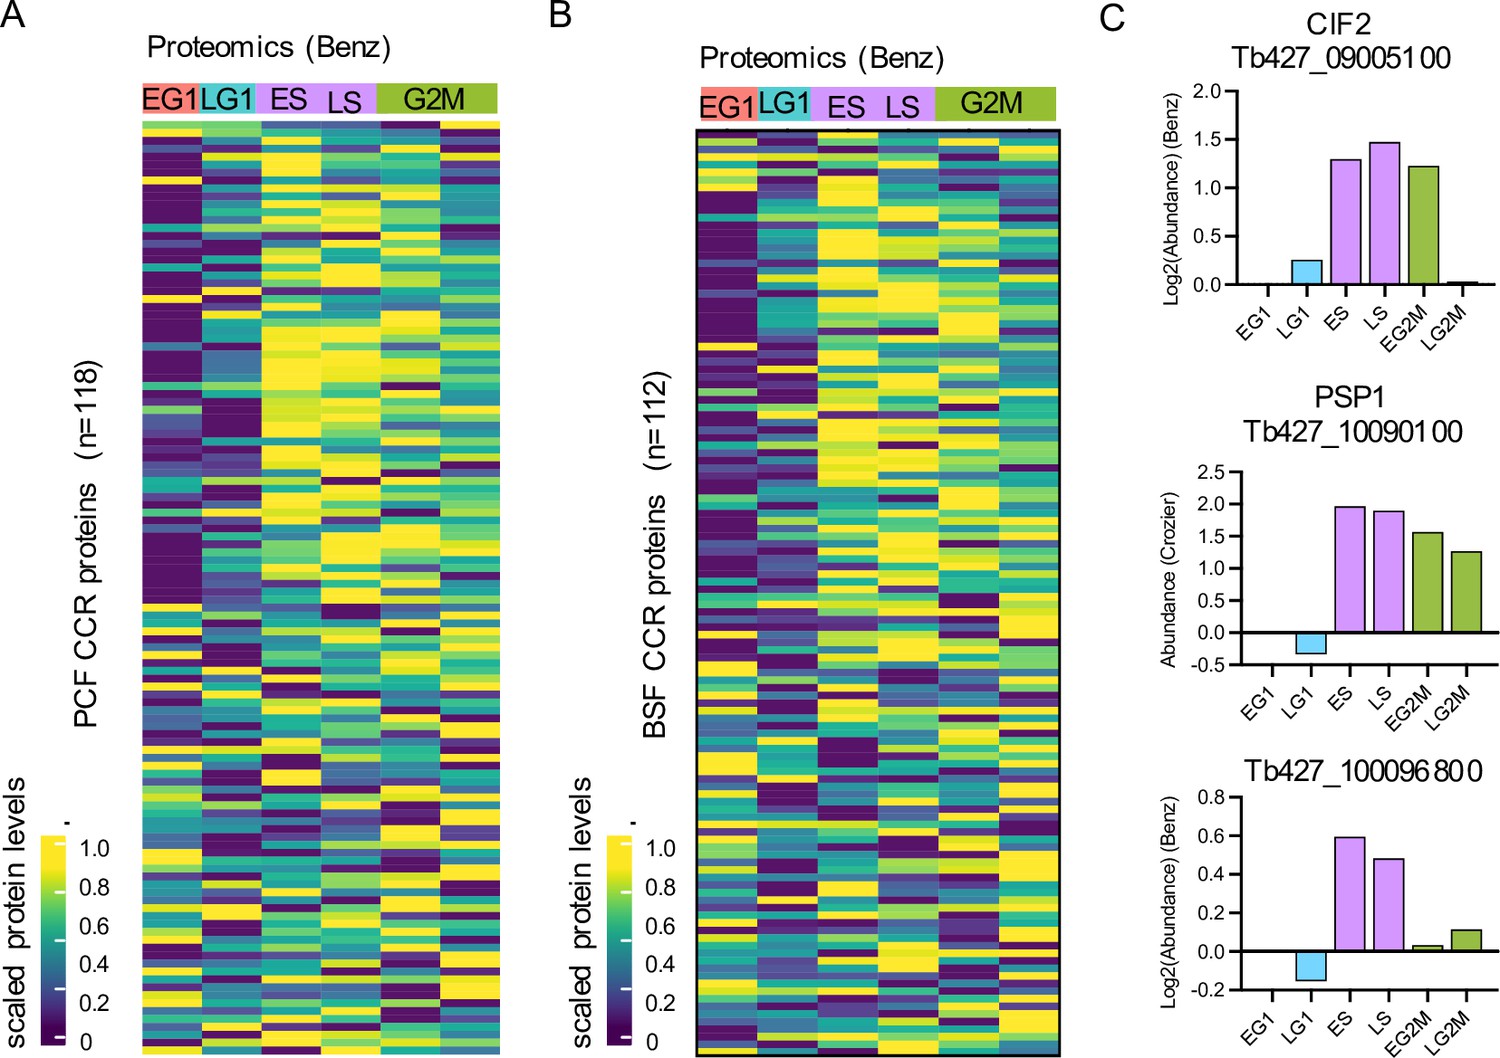
Protein abundance levels across the procyclic form (PCF) cell cycle as defined by Benz et al.
(A) Scaled protein abundance for 118 genes identified as cell cycle regulated (CCR) by Benz et al. and scRNA-seq analysis of the PCF cell cycle, plotted in the same order as Figure 2F. Time points are indicated in the top annotation, coloured by the most enriched cell cycle phase for each sample. (B) Scaled protein abundance for CCR 112 genes identified as CCR by Benz et al. and scRNA-seq analysis of the bloodstream form (BSF) cell cycle, plotted in the same order as Figure 3F. (C) Protein abundance from Benz et al. study for the same genes as in Figure 2J, previously identifed as CCR in all studies compared. Time points are coloured and labelled by most enriched phase for each sample (x-axis). Protein abundance is scaled compared to early G1 (EG1), which is set to 0 for all genes.
Figure 3 with 1 supplement
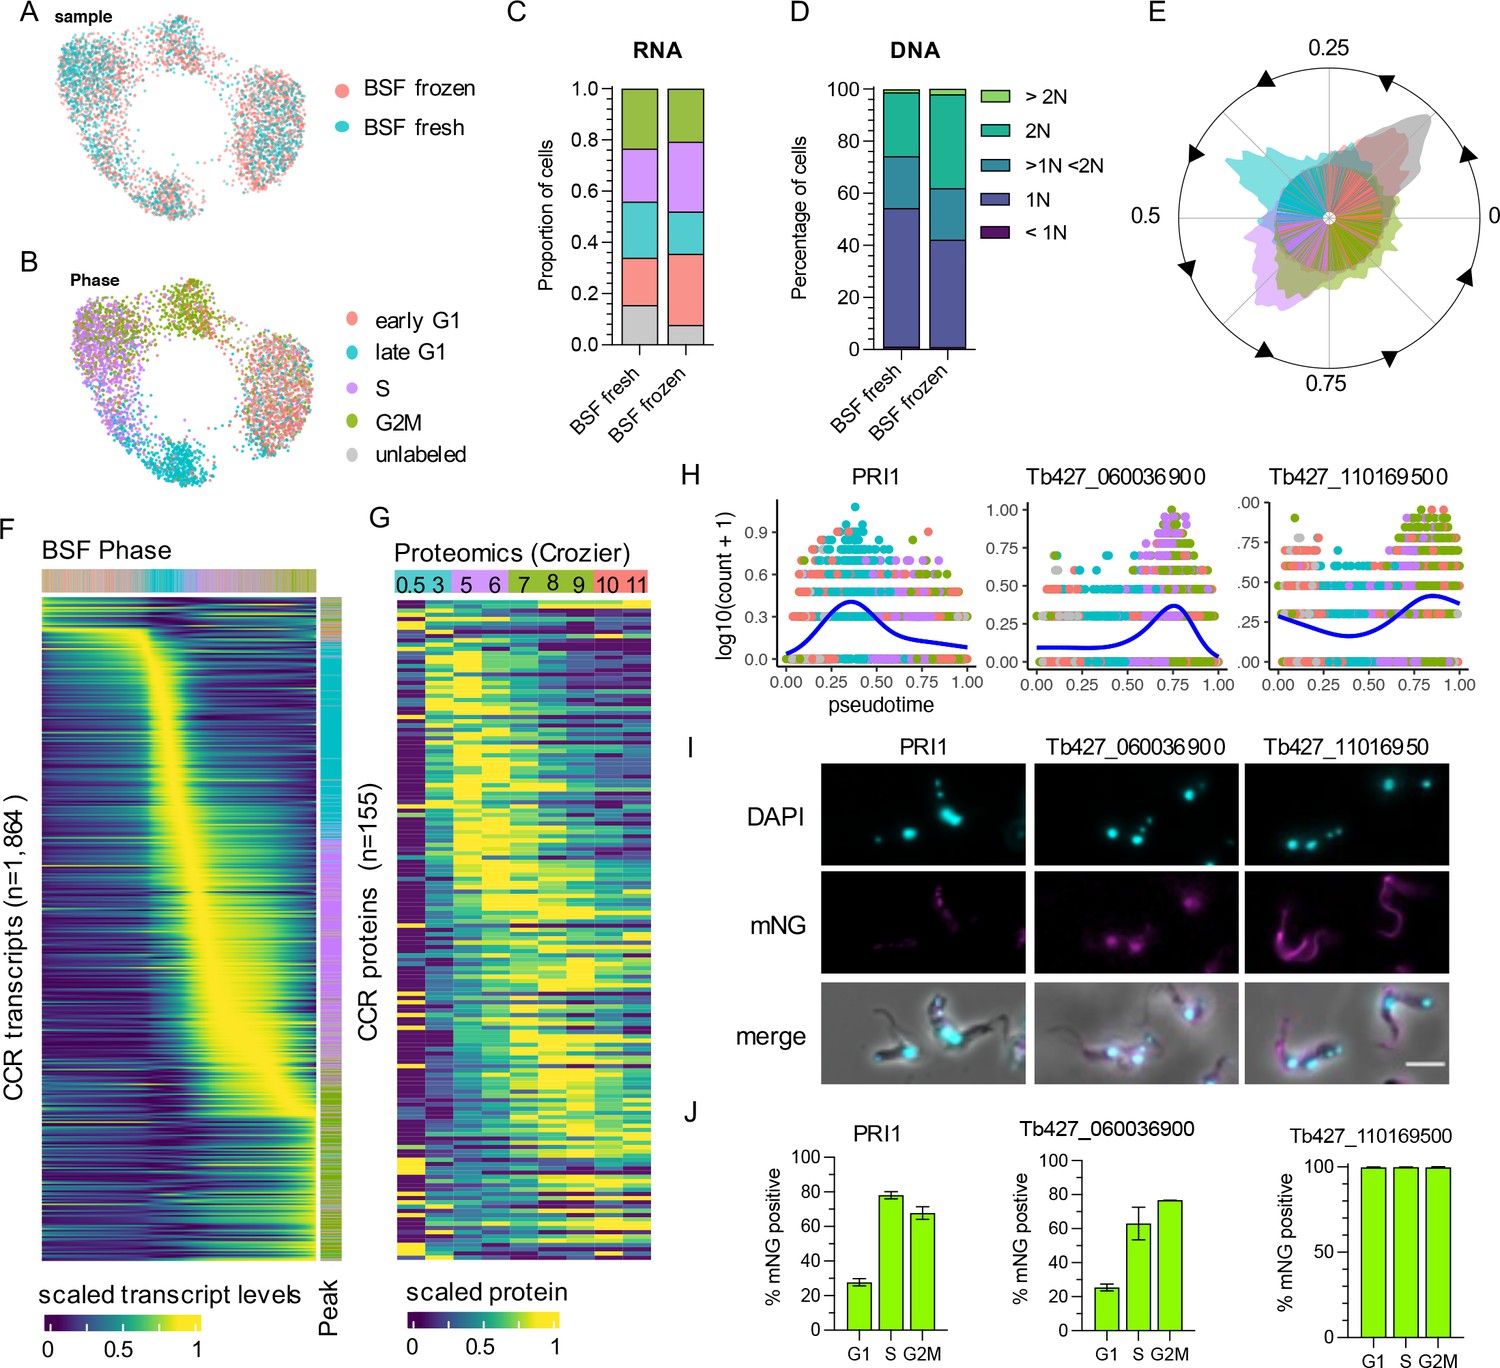
The cell cycle transcriptome of bloodstream form (BSF) T. brucei.
(A) Unifold manifold approximation and projection (UMAP) plot of integrated BSF transcriptomes from fresh (blue) and frozen (red) samples. (B) UMAP of BSF transcriptomes coloured by inferred cell cycle phase. (C) Proportion of cells assigned to each phase by transcriptomics as in B. Legend as in B. (D) Proportion of cells with DNA content assessed by flow cytometry. (E) Histogram of transcriptomes arranged in pseudotime (anti-clockwise) representing cell cycle progression. Each line in inner circle indicated one transcriptome coloured by phase as in B. Outer circle histogram of showing number of cells at each point in pseudotime (0–1). (F) Scaled transcript levels of cell cycle regulated (CCR) genes (rows), ordered by peak time, plotted across transcriptomes (columns) ordered in pseudotime. Top annotation indicates cell phase, right annotation indicates phase with highest expression of each gene. (G) Scaled protein abundance for 137 genes identified as CCR by Crozier et al., plotted in the same order as F. Time points are indicated in top annotation, coloured by the most enriched cell cycle phase for each sample. (H) Transcript counts of three of the top CCR genes (y-axis) plotted across pseudotime (x-axis). Each dot shows one transcriptome coloured by phase as in B. Blue line shows smoothed expression level across pseudotime. (I) Fluorescent microscopy imaging of mNeonGreen (mNG) tagged top CCR proteins. DAPI (4′,6-diamidino-2-phenylindole) staining of DNA (cyan) and mNG fluorescence (magenta) are shown for the three genes as well as merged with DIC (merge). Scale bar = 10 µm. (J) The percentage of cells positive for mNG as detected by flow cytometry analysis. For each gene, counts are separated by cell cycle phase, inferred by DNA content detection (G1 = 2C, S = >2C < 4C, G2M = 4C). Error bars indicate the standard deviation from the mean of three (Tb427_080028700 and Tb427_110169500) or two (Tb427_060036900) biological replicates.
Figure 3—figure supplement 1

Analysis of mNG tagged protein expression in bloodstream forms (BSFs).
(A) Polymerase Chain Reaction (PCR) detection of integrated mNeonGreen (mNG) tag fragments for Tb427_060036900 (3406 bp), PRI1/Tb427_080028700 (3036 bp), and Tb427_110169500 (3015 bp). Lower band indicates the wild-type gene without an inserted tag for Tb427_060036900 (484 bp), PRI1/Tb427_080028700 (498 bp) and Tb427_110169500 (477 bp). * indicates fluorescence could not be detected for this heterozygous Tb427_060036900::mNG clone. (B) Fluorescent microscopy imaging of mNG tagged top cell cycle regulated proteins. DAPI staining of DNA (cyan) and mNG fluorescence (magenta) are shown for the three genes as well as merged with DIC (merge). Scale bar = 10 µm. (C) Scatter plots of parental Cas9 expressing WT427 BSFs (grey) and independently derived mNG tagged clones (pink, blue, and purple) for three genes: Tb427_060036900, PRI1/Tb427_080028700, and Tb427_110169500. DAPI staining (x-axes) and mNG fluorescence (y-axes) were detected for 10,000 events per sample. Clone 2 is excluded from Tb427_060036900 as no fluorescence was detected. Original gel images are available in Figure 3—figure supplement 1—source data 1.
-
Figure 3—figure supplement 1—source data 1
Original gel images.
PCR confirmation of epitope tagged lines. PCR detection of integrated mNG tag fragments for Tb427_060036900, PRI1/Tb427_080028700, and Tb427_110169500. Folder contains uncropped image of gel as PDF as well as original image files.
- https://cdn.elifesciences.org/articles/86325/elife-86325-fig3-figsupp1-data1-v2.zip
Figure 4 with 2 supplements
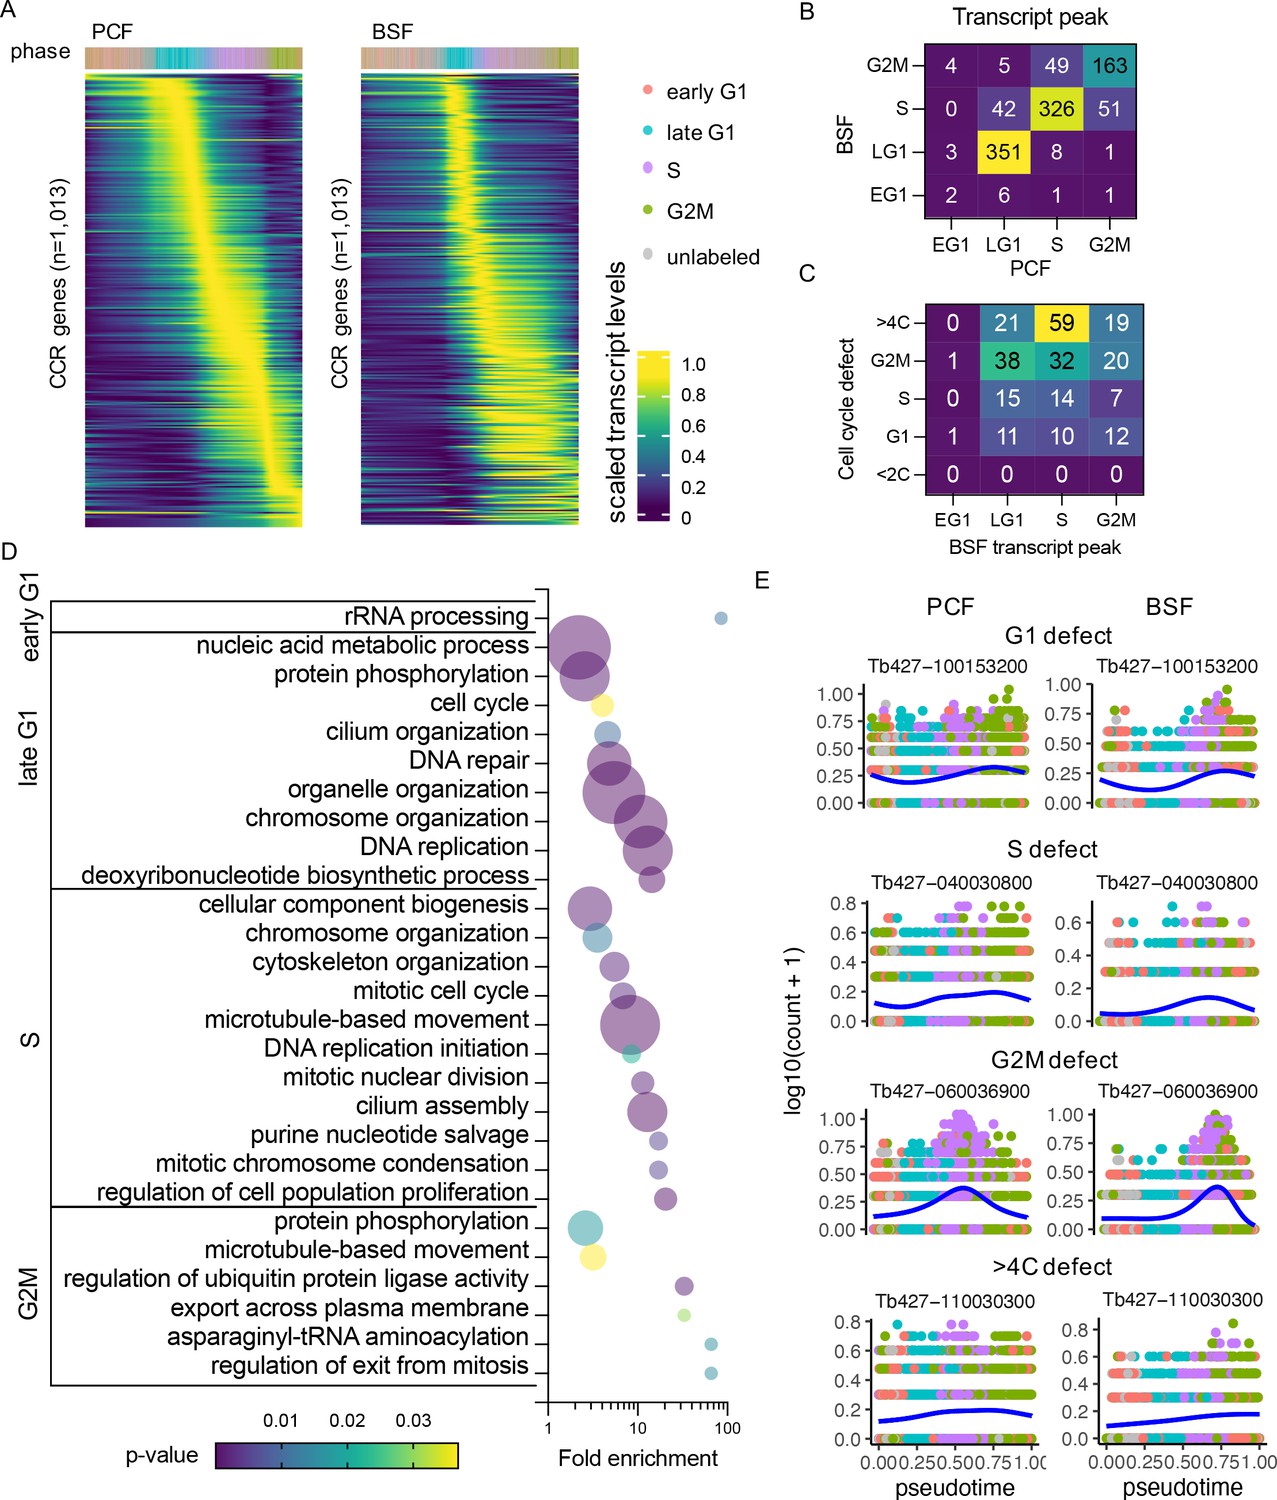
Common cell cycle regulated (CCR) transcripts of bloodstream form (BSF) and procyclic form (PCF) T. brucei.
(A) Scaled transcript levels of common CCR genes (rows), ordered by peak time and plotted across transcriptomes (columns) ordered in pseudotime of PCF (left) and BSF (right). Genes are ordered by peak time in the PCF cell cycle in both cases for direct comparison. Top annotation indicates cell cycle phase. (B) Number of genes peaking in each cell cycle phase for PCF (x-axis) and BSF (y-axis) transcriptomes. (C) Number of genes peaking in each BSF phase (x-axis) linked to a cell cycle defect (y-axis) in RIT-seq screen of BSFs by Marques et al., 2022. (D) Gene Ontology (GO) terms associated with common CCR grouped by peak phase in the BSF cell cycle. Fold change of detected genes is plotted on x-axis, points are sized by the number of genes and coloured by p-value. (E) Transcript levels of the most significantly differential expression (DE) gene associated with each cell cycle defect category (G1, S, G2M, and >4C). Counts per cell (y-axis) are plotted across PCF (left) and BSF (right) pseudotime (x-axis), coloured by phase as in A. Blue line shows smoothed expression level across pseudotime.
Figure 4—figure supplement 1

Cell cycle regulated (CCR) genes in procyclic form (PCF) and bloodstream form (BSF) classified by adjusted p-value and FC.
(A) Scatter plot of genes classified as CCR in both life cycle forms (both, black), BSF only (red), or PCF only (blue). Genes are plotted by adjusted p-value for BSF (x-axis) and PCF (y-axis). (Axis was limited to show data distribution removing 88 points.) Red arrows indicate genes plotted in Figure 4E. (B) CCR genes plotted by mean logFC in smoothed expression over pseudotime for BSFs (x-axis) and PCFs (y-axis). (18 points were removed due to limiting axes.) (C) Venn diagram demonstrating the overlap in PCF (blue) and BSF (red) CCR genes, defined by cut-offs in A and B. (D) Number of kinetoplastida species reference proteomes containing at least one ortholog of the common CCR proteins, all proteins from the WT427 reference, and a random subset of 1000 proteins. (E) Comparison of the total number of orthologs present across all 44 proteomes for CCR genes, all genes and a random subset. p-values indicate the results of Mann–Whitney tests.
Figure 4—figure supplement 2
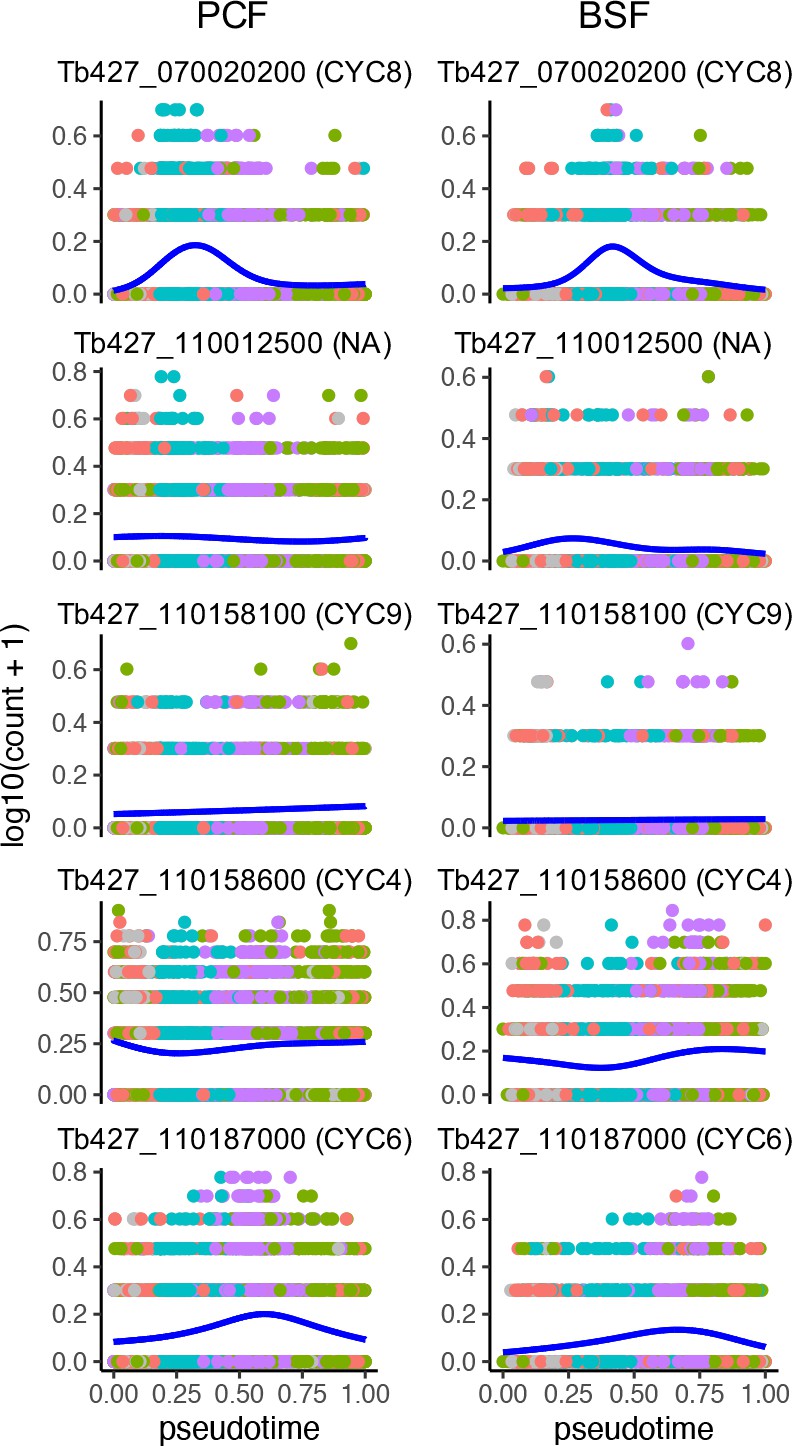
Smoothed gene expression pattern of cell cycle regulated (CCR) cyclins.
Transcript levels of genes encoding known cyclins (CYC4, CYC6, CYC8, and CYC9) and one un-investigated cyclin domain-containing gene (Tb427_110012500) found to be CCR in one or both forms. Counts per cell (y-axis) are plotted across procyclic form (PCF; left) and bloodstream form (BSF; right) pseudotime (x-axis), coloured by phase. Blue line plots smoothed expression level across pseudotime.
Figure 5 with 2 supplements

Unique cell cycle regulated (CCR) transcripts of bloodstream form (BSF) and procyclic form (PCF) T. brucei.
(A) Scaled transcript levels of unique CCR genes (rows), ordered by peak time, plotted across transcriptomes (columns) ordered in pseudotime across PCF cell cycle. Top annotation indicates cell phase. (B) Gene Ontology (GO) terms associated with CCR genes unique to PCFs. Fold change of detected genes is plotted on x-axis. Points are sizes by number of genes and coloured by p-value. (C) Scaled transcript levels for CCR unique to BSF cells cycle, as in A. (D) GO terms associated with unique BSF CCR genes, as in B. (E) Transcript levels of six genes with strong association bias to one life cycle form cell cycle. Counts per cell (y-axis) are plotted across PCF (left) and BSF (right) pseudotime (x-axis), coloured by phase as in A. Blue line shows smoothed expression level across pseudotime.
Figure 5—figure supplement 1
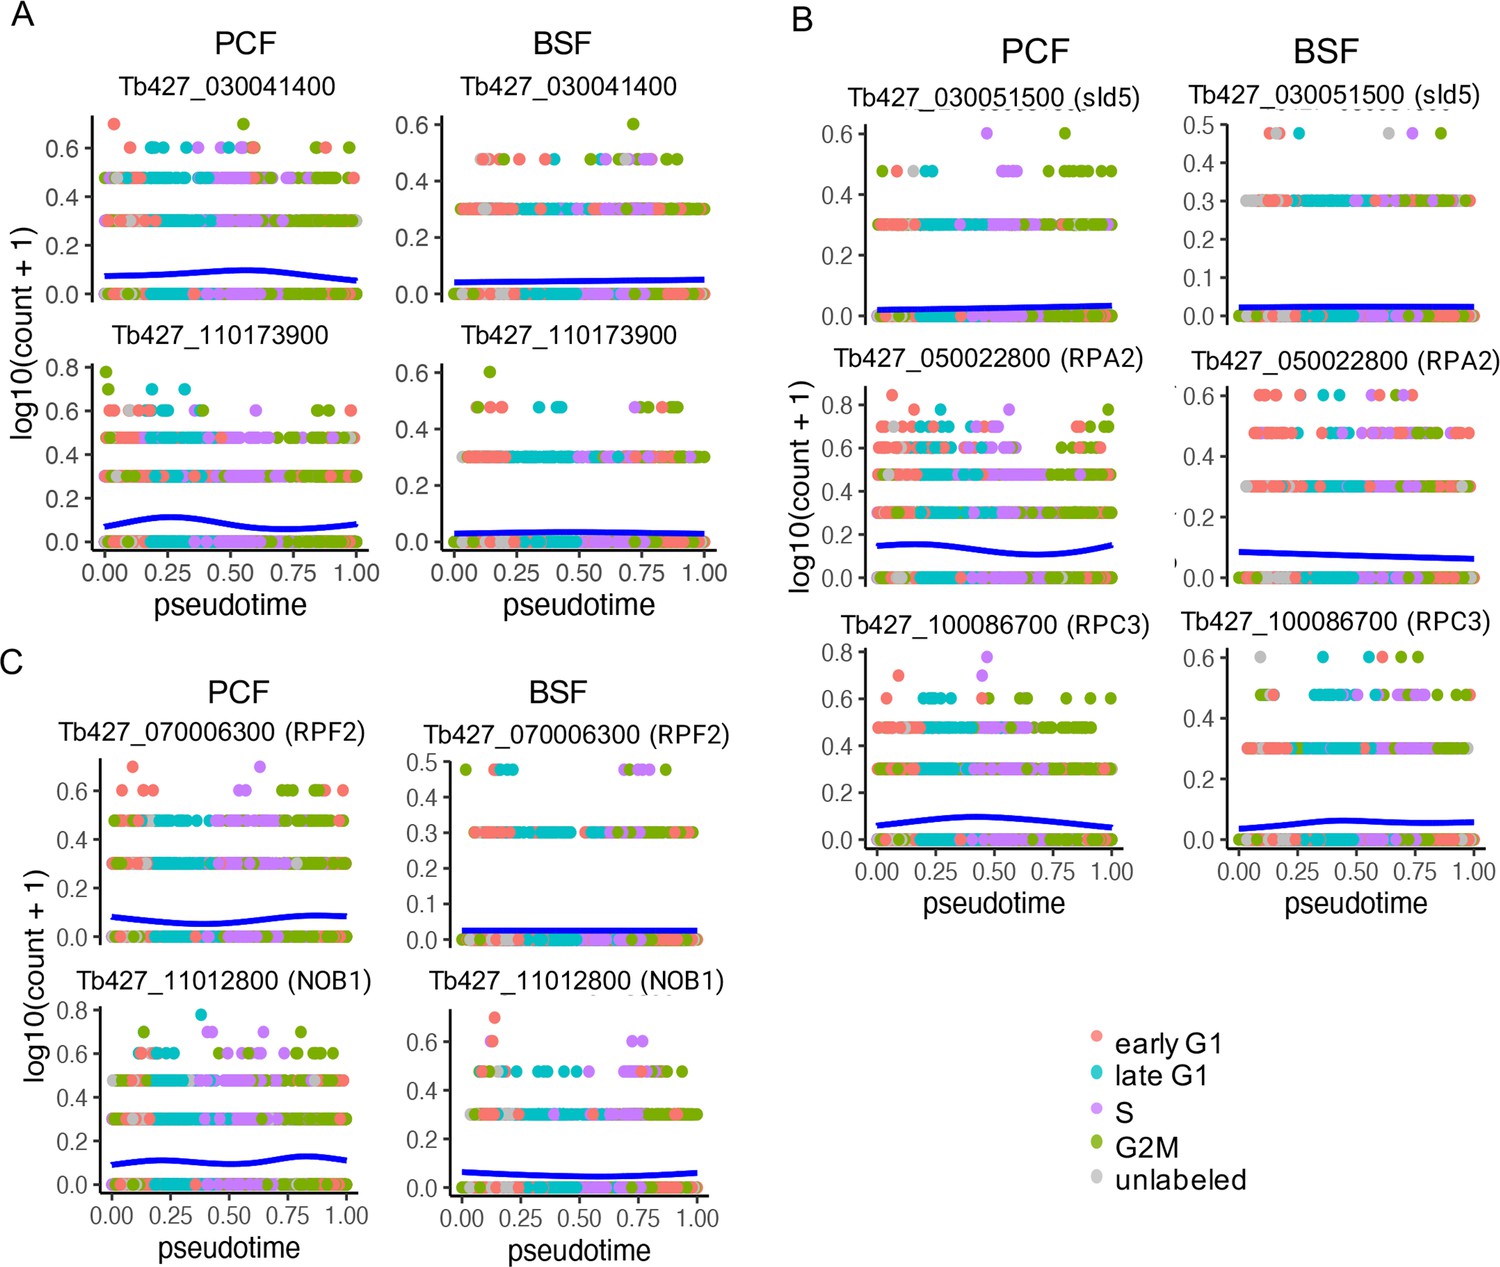
Smoothed gene expression pattern of genes associated only with the procyclic form (PCF) cell cycle.
Transcript levels of discussed example genes associated with Gene Ontology (GO) terms ‘lipid metabolic process’ (A), ‘DNA replication’ (B), and ‘ribonucleoprotein complex biogenesis’ (C). Counts per cell (y-axis) are plotted across PCF (left) and bloodstream form (BSF; right) pseudotime (x-axis), coloured by phase. Blue line shows smoothed expression level across pseudotime.
Figure 5—figure supplement 2
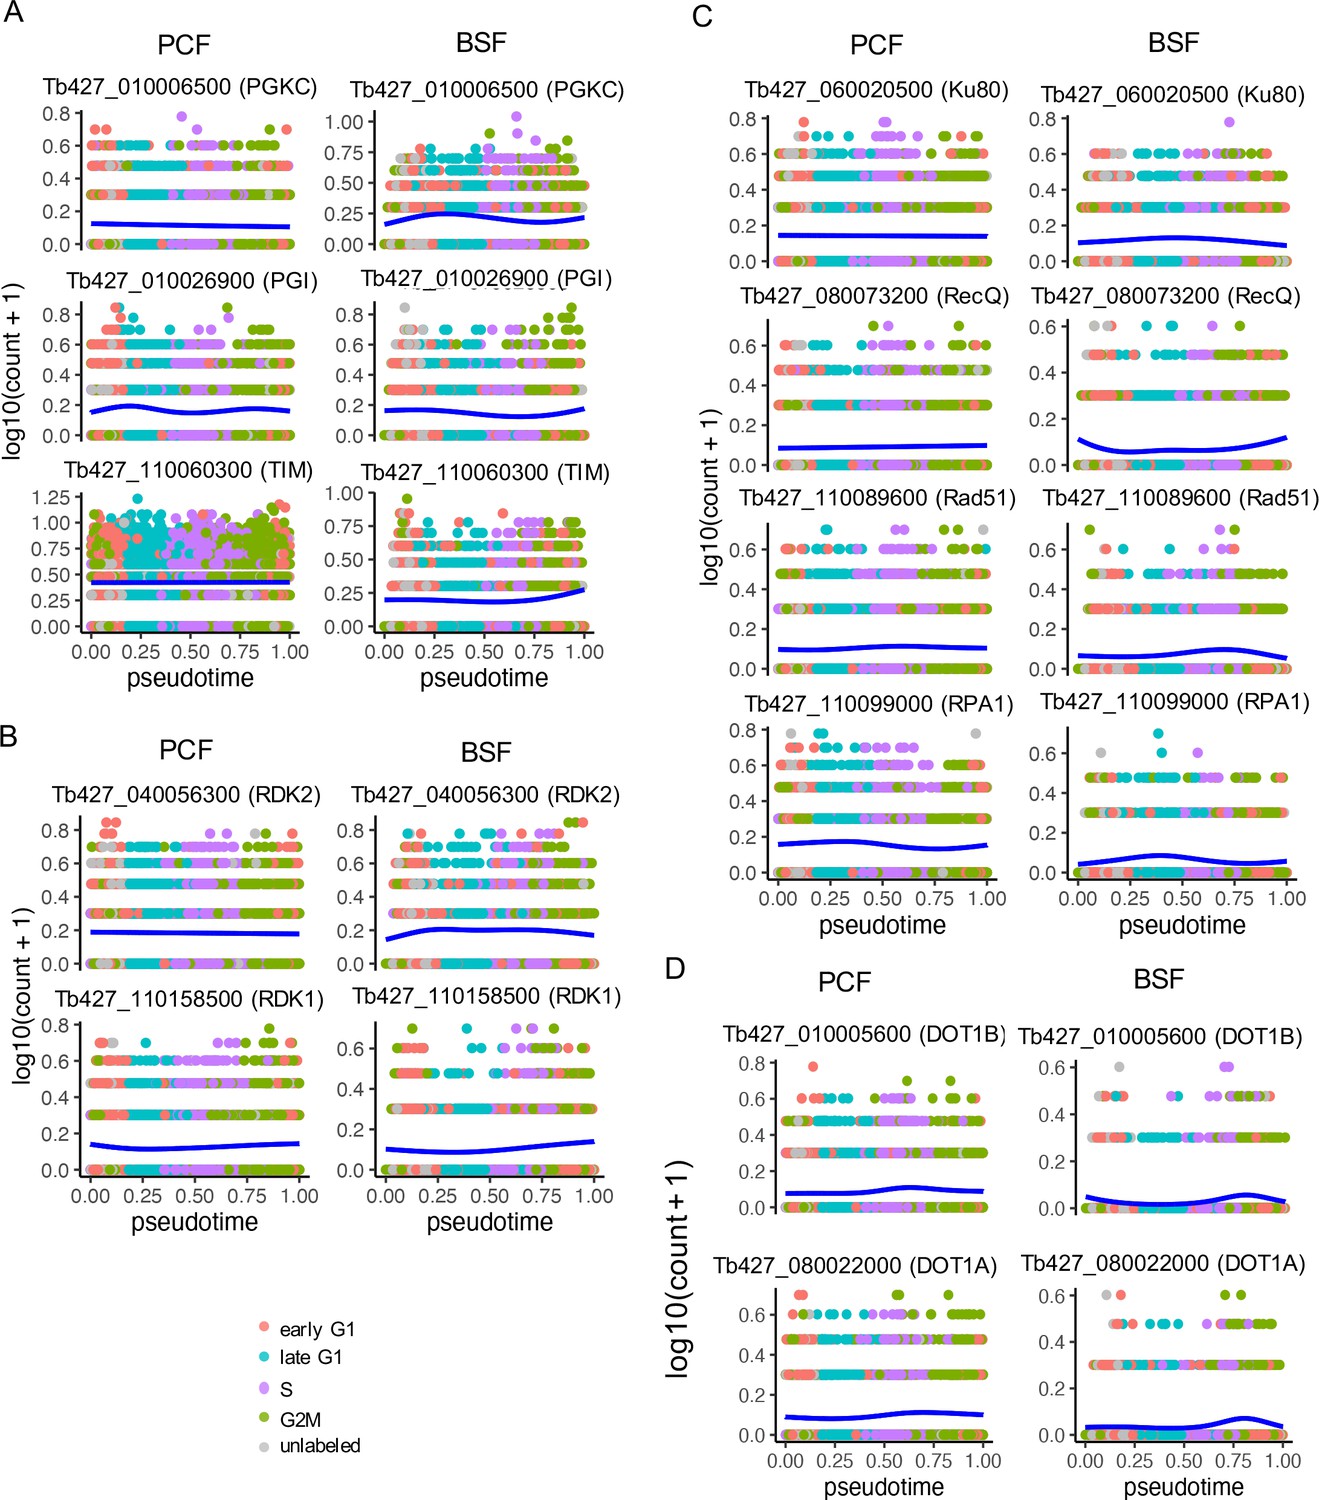
Smoothed gene expression pattern of genes associated only with the bloodstream form (BSF) cell cycle.
Transcript levels of discussed example genes for the glucose/gluconeogenesis pathway (A), and Gene Ontology (GO) terms ‘phosphorylation’ (B), ‘DNA recombination’ (C), and ‘histone lysine methylation’ (D). Counts per cell (y-axis) are plotted across procyclic form (PCF; left) and BSF (right) pseudotime (x-axis), coloured by phase. Blue line shows smoothed expression level across pseudotime.
Author response image 1
Tables
Key resources table
| Reagent type (species) or resource | Designation | Source or reference | Identifiers | Additional information |
|---|---|---|---|---|
| Cell line (Trypanosoma brucei brucei) | Lister427 bloodstream forms (BSF) | R.McCulloch stocks (University of Glasgow) | NA | https://tryps.rockefeller.edu/trypsru2_cell_lines.html |
| Cell line (Trypanosoma brucei brucei) | Lister427 procyclic form (PCF) | R.McCulloch stocks (University of Glasgow) | NA | https://tryps.rockefeller.edu/trypsru2_cell_lines.html |
| Transfected construct (Trypanosoma brucei brucei) | J1339 | Rojas et al., 2019 Cell 176, 306–317.e16 | NA | NA |
| Sequence-based reagent | Tb927.8.2550 Ntag_F | The study | PCR primers | ATCTGAAGAAAATAATATACAAGAGACAAGgtataatgcagacctgctgc |
| Sequence-based reagent | Tb927.8.2550 Ntag_R | The study | PCR primers | TTGCTGTGATGGTAAGGTGATGCGGAGCATactacccgatcctgatccag |
| Sequence-based reagent | Tb927.8.2550 Ntag_sgRNA | The study | PCR primers | gaaattaatacgactcactatagg GCGGGACACGCAACACTACA gttttagagctagaaatagc |
| Sequence-based reagent | Tb927.8.2550_tag_check_F | The study | PCR primers | ATCTGAAGAAAATAATATACAAGAGACAAG |
| Sequence-based reagent | Tb927.8.2550_tag_check_R | The study | PCR primers | TTGCTGTGATGGTAAGGTGATGCGGAGCAT |
| Sequence-based reagent | Tb927.6.3180_Ctag_F | The study | PCR primers | TTACGAGCGGGACTGCGACGTTCGTGCCTGggttctggtagtggttccgg |
| Sequence-based reagent | Tb927.6.3180_Ctag_R | The study | PCR primers | AAGCCTCTGCCGACACGCACATTTCTTCCGccaatttgagagacctgtgc |
| Sequence-based reagent | Tb927.6.3180_Ctag_sgRNA | The study | PCR primers | gaaattaatacgactcactataggCAATGTG CAGAAGCATAAATgttttagagctagaaatagc |
| Sequence-based reagent | Tb927.6.3180_Ctag_check_F | The study | PCR primers | TTACGAGCGGGACTGCGACGTTCGTGCCTG |
| Sequence-based reagent | Tb927.6.3180_Ctag_check_R | The study | PCR primers | AAGCCTCTGCCGACACGCACATTTCTTCCG |
| Sequence-based reagent | Tb927.11.15100_Ntag_F | The study | PCR primers | CTACTTACCCACTGCAGTTTTTTTATTATTgtataatgcagacctgctgc |
| Sequence-based reagent | Tb927.11.15100_Ntag_R | The study | PCR primers | CTACTTACCCACTGCAGTTTTTTTATTATTgtataatgcagacctgctgc |
| Sequence-based reagent | Tb927.11.15100_Ntag_sgRNA | The study | PCR primers | gaaattaatacgactcactataggCGGTAT TACATCAAGTAAAGgttttagagctagaaatagc |
| Sequence-based reagent | Tb927.11.15100_Ntag_check_F | The study | PCR primers | CTACTTACCCACTGCAGTTTTTTTATTATT |
| Sequence-based reagent | Tb927.11.15100_Ntag_check_R | The study | PCR primers | ATCGGCAAAGTTCTTGTGGACAACGGCCAT |
| Commercial assay or kit | Chromium Single Cell 3′ v3.1 | 10× Genomics | SCR_019326 | NA |
| Software, algorithm | R | https://www.r-project.org/ | RRID: SCR_001905 | NA |
| Software, algorithm | GraphPad Prism | https://www.graphpad.com | RRID: SCR_002798 | NA |
| Software, algorithm | Rstudio | https://rstudio.com/ | RRID: SCR_000432 | NA |
| Software, algorithm | Cellranger version 7 | 10× Genomics | N/A | NA |
| Software, algorithm | Seurat version 4.1.0 | Hao et al., 2021 | RRID: SCR_007322 | NA |
| Software, algorithm | Complete scRNA-seq analysis code | This paper, Zenodo | DOI: 10.5281/zenodo.7508131 | NA |
| Other | TritrypDB database | http://tritrypdb.org/tritrypdb/ | N/A | TritrypDB database for searching genome |
| Other | 10× Genomics Chromium Plus Genetic Analyzer | 10× Genomics | SCR_019326 | 10× controller for cell sorting into droplets |
| Other | SDM-79 Medium | Life Technologies | Cat# RR110008P1 | Medium for PCF culture |
| Other | HMI-9 Medium | Life Technologies | Cat# 074-90915 | Medium for BSF culture |
Additional files
-
Supplementary file 1
Sample processing.
(Tab 1) Genes used for BSF and PCF gating. (Tab 2) Results of BSF and PCF gating. (Tab 3) scRNA-seq sample summary. (Tab 4) Variable genes per sample. (Tab 5) Cell cycle phase markers used for labelling.
- https://cdn.elifesciences.org/articles/86325/elife-86325-supp1-v2.xlsx
-
Supplementary file 2
Fresh vs frozen DE analysis.
(Tab 1) BSF average expression comparison. (Tab 2) PCF average expression comparison. (Tab 3) BSF MAST DE test. (Tab 4) PCF MAST DE test.
- https://cdn.elifesciences.org/articles/86325/elife-86325-supp2-v2.xlsx
-
Supplementary file 3
Early G1 vs unlabelled cells comparison.
(Tab 1) PCF DE. (Tab 2) BSF DE.
- https://cdn.elifesciences.org/articles/86325/elife-86325-supp3-v2.xlsx
-
Supplementary file 4
PCF cell cycle DE analysis.
(Tab 1) PseudotimeDE analysis. (Tab 2) PseudotimeDE results for CCR genes only. (Tab 3) Average expression of each CCR per phase. (Tab 4) Dataset comparison of CCR genes. (Tab 5) Comparison with Crozier proteomics study. (Tab 6) Comparison with Benz proteomics study.
- https://cdn.elifesciences.org/articles/86325/elife-86325-supp4-v2.xlsx
-
Supplementary file 5
BSF cell cycle DE analysis.
(Tab 1) PseudotimeDE analysis. (Tab 2) PseudotimeDE results for CCR genes only. (Tab 3) Average expression of each CCR per phase. (Tab 4) Comparison with Crozier proteomics study. (Tab 5) Comparison with Benz proteomics study.
- https://cdn.elifesciences.org/articles/86325/elife-86325-supp5-v2.xlsx
-
Supplementary file 6
Common CCR gene analysis.
(Tab 1) CCR comparison between BSF and PCF. (Tab 2) Comparison of peak expression between BSF and PCF. (Tab 3) Ortholog groups and conservation of common CCR genes. (Tab 4) Comparison of CCR genes and cell cycle defects. (Tab 5) Early G1 phase associated GO terms. (Tab 6) Late G1 phase associated GO terms. (Tab 7) S phase associated GO terms. (Tab 8) G2M phase associated GO terms. (Tab 9) Plotted GO terms (Tab 10) CCR RNA-binding proteins.
- https://cdn.elifesciences.org/articles/86325/elife-86325-supp6-v2.xlsx
-
Supplementary file 7
Unique CCR gene analysis.
(Tab 1) GO terms associated with CCR unique to PCF. (Tab 2) GO terms associated with CCR unique to BSF.
- https://cdn.elifesciences.org/articles/86325/elife-86325-supp7-v2.xlsx
-
Supplementary file 8
Primer sequences.
- https://cdn.elifesciences.org/articles/86325/elife-86325-supp8-v2.xlsx
-
MDAR checklist
- https://cdn.elifesciences.org/articles/86325/elife-86325-mdarchecklist1-v2.docx
Download links
A two-part list of links to download the article, or parts of the article, in various formats.
Downloads (link to download the article as PDF)
Open citations (links to open the citations from this article in various online reference manager services)
Cite this article (links to download the citations from this article in formats compatible with various reference manager tools)
Profiling the bloodstream form and procyclic form Trypanosoma brucei cell cycle using single-cell transcriptomics
eLife 12:e86325.
https://doi.org/10.7554/eLife.86325


