Gaze patterns and brain activations in humans and marmosets in the Frith-Happé theory-of-mind animation task
- Centre for Functional and Metabolic Mapping, Robarts Research Institute, University of Western Ontario, Canada
- Department of Physiology and Pharmacology, University of Western Ontario, Canada
Figures
Figure 1

Task Design.
Two different conditions of video clips resulting in eight animations were used during the scanning (ToM and Random animations), and an additional condition with four animations was used for the eye-tracking (ToM, GD and Random animations). In the ToM animations, one triangle reacted to the other triangle’s mental state, whereas in the Random animations the same two triangles did not interact with each other. In the GD animations, the two triangles interact with simple intentions. Each animation video lasted 19.5 s and was separated by baseline blocks of 15 s where a central dot was displayed in the center of the screen. In the fMRI task, several runs were used with a Randomized order of the two conditions whereas in the eye-tracking task one run containing all the twelve animations once was used.
Figure 2
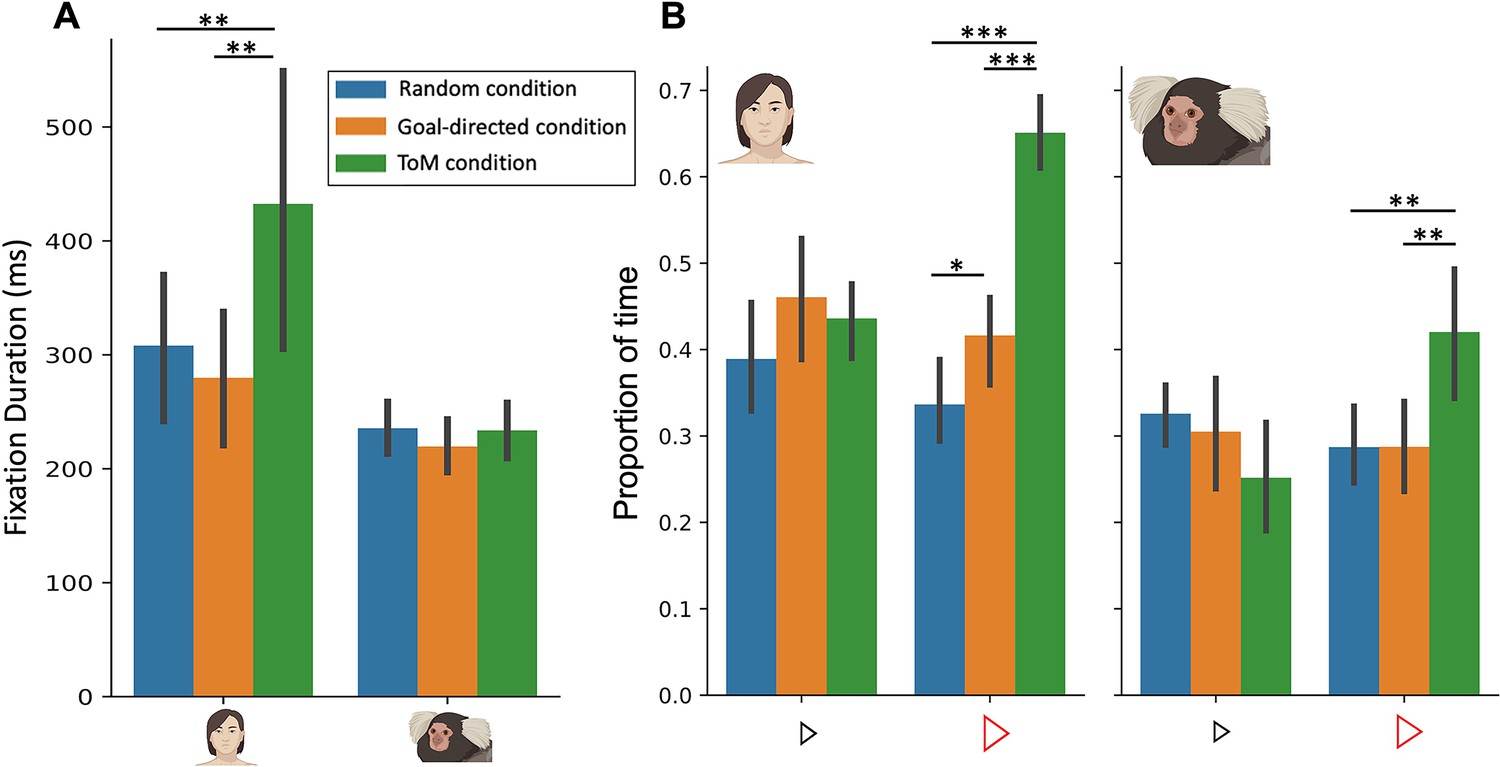
Fixation duration (A) and proportion of time looking triangles (B) in Frith-Happé’s ToM, GD and Random animations in humans (left) and marmosets (right).
(A). Bar plot depicting the fixation duration in the screen as a function of each condition. (B). Bar plot representing the proportion of time the radial distance between the current gaze position and each triangle was within 4 visual degrees, as a function of each condition. Green represents results obtained for ToM animation videos, orange represents results for GD animation videos and blue represents results for Random animation videos. In each graph, the left panel shows the results for 11 humans and the right panel for 11 marmosets. Each colored bar represents the group mean and the vertical bars represent the standard error from the mean. The differences between conditions were tested using ANOVA: p<0.05*, p<0.01** and p<0.001***.
Figure 3 with 2 supplements
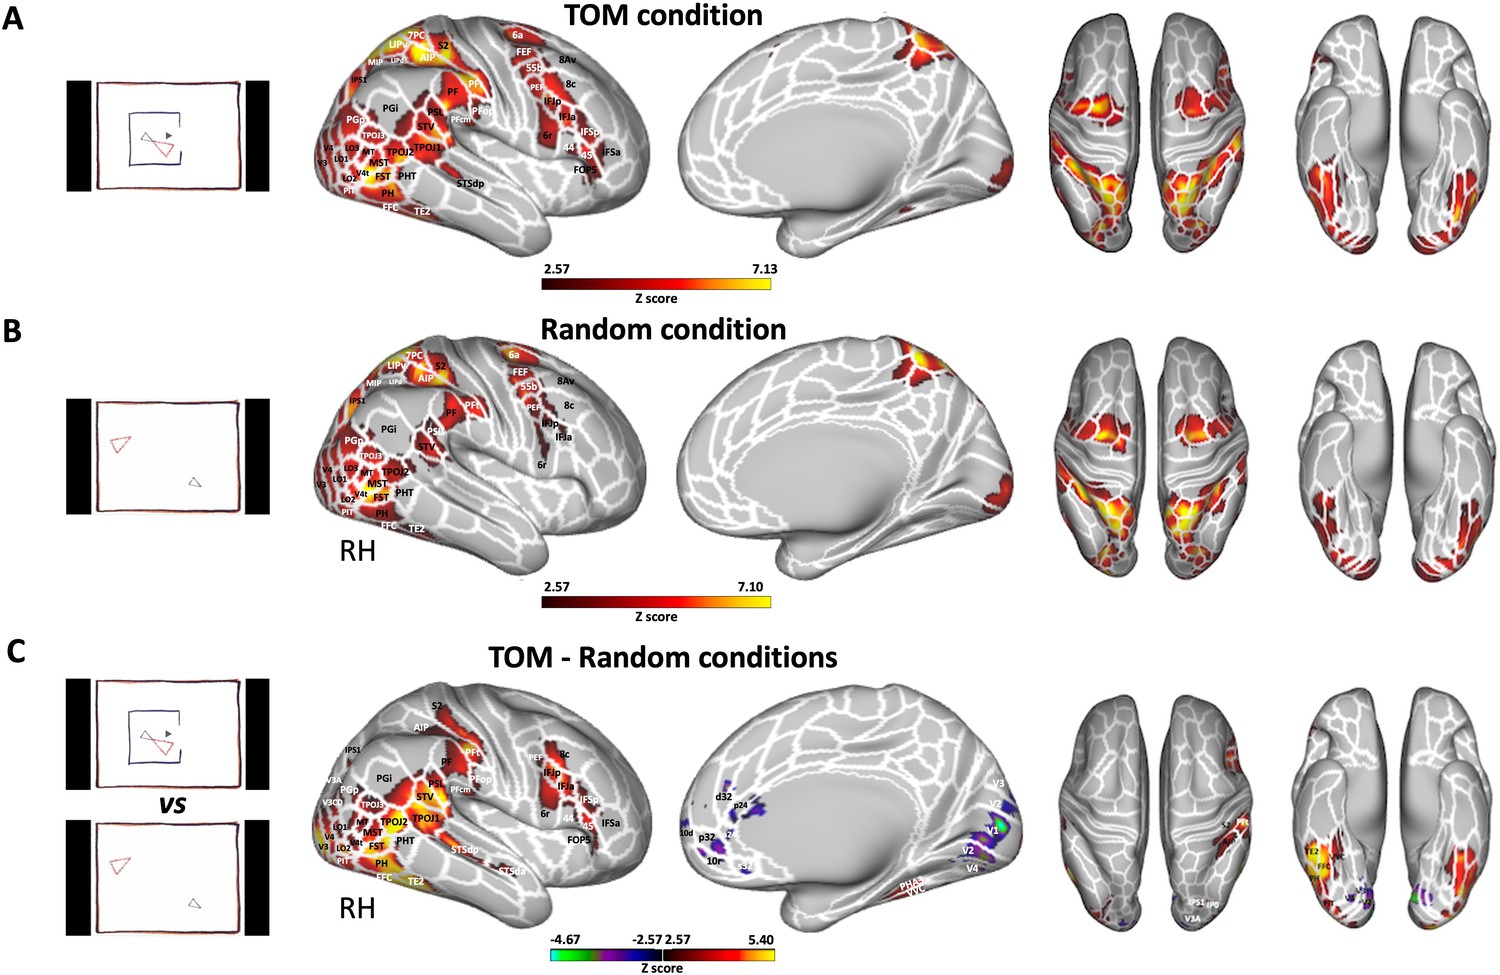
Brain networks involved in processing of Frith-Happé’s ToM and Random animations in humans.
Group functional maps displayed on right fiducial (lateral and medial views) and left and right fiducial (dorsal and ventral views) of human cortical surfaces showing significant greater activations for ToM condition (A), Random condition (B) and the comparison between ToM and Random conditions (C). The white line delineates the regions based on the recent multi-modal cortical parcellation atlas (Glasser et al., 2016). The maps depicted are obtained from 10 human subjects with an activation threshold corresponding to z-scores >2.57 for regions with yellow/red scale or z-scores <–2.57 for regions with purple/green scale (AFNI’s 3dttest++, cluster-forming threshold of p<0.01 uncorrected and then FWE-corrected α=0.05 at cluster-level from 10000 Monte-Carlo simulations).
Figure 3—figure supplement 1
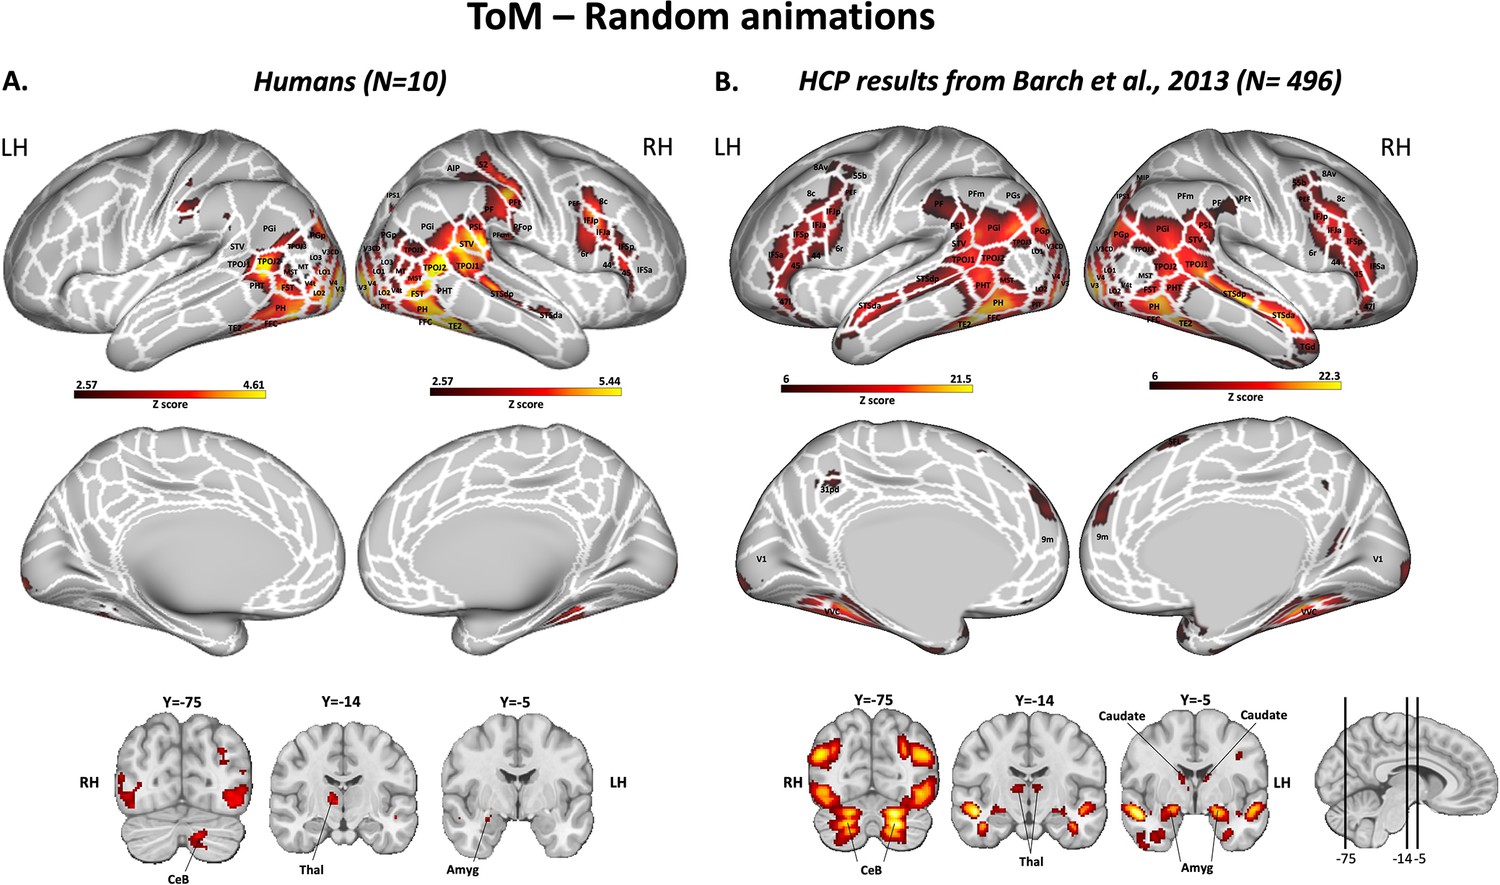
Brain networks involved in ToM animations processing in humans.
Group functional maps showing significant greater activations for the comparison between ToM animations and Random animations displayed on the left and right fiducial human cortical surfaces (lateral and medial views) as well as on coronal slices, to illustrate the activations in subcortical areas. The white line delineates the regions based on the recent multi-modal cortical parcellation atlas (Glasser et al., 2016). (A) The map depicted is obtained from 10 human subjects with an activation threshold corresponding to z-scores>2.57 (AFNI’s 3dttest++, cluster-forming threshold of p<0.01 uncorrected and then FWE-corrected α=0.05 at cluster-level from 10000 Monte-Carlo simulations). The subcortical maps correspond to an activation threshold of z-scores>3.29 (AFNI’s 3dttest++, threshold of p<0.001 uncorrected). (B) The map depicted has been downloaded from https://identifiers.org/neurovault.image:3179 and is described in the study of Barch et al., 2013. The brain areas reported have activation threshold corresponding to z-scores>6, uncorrected.
Figure 3—figure supplement 2
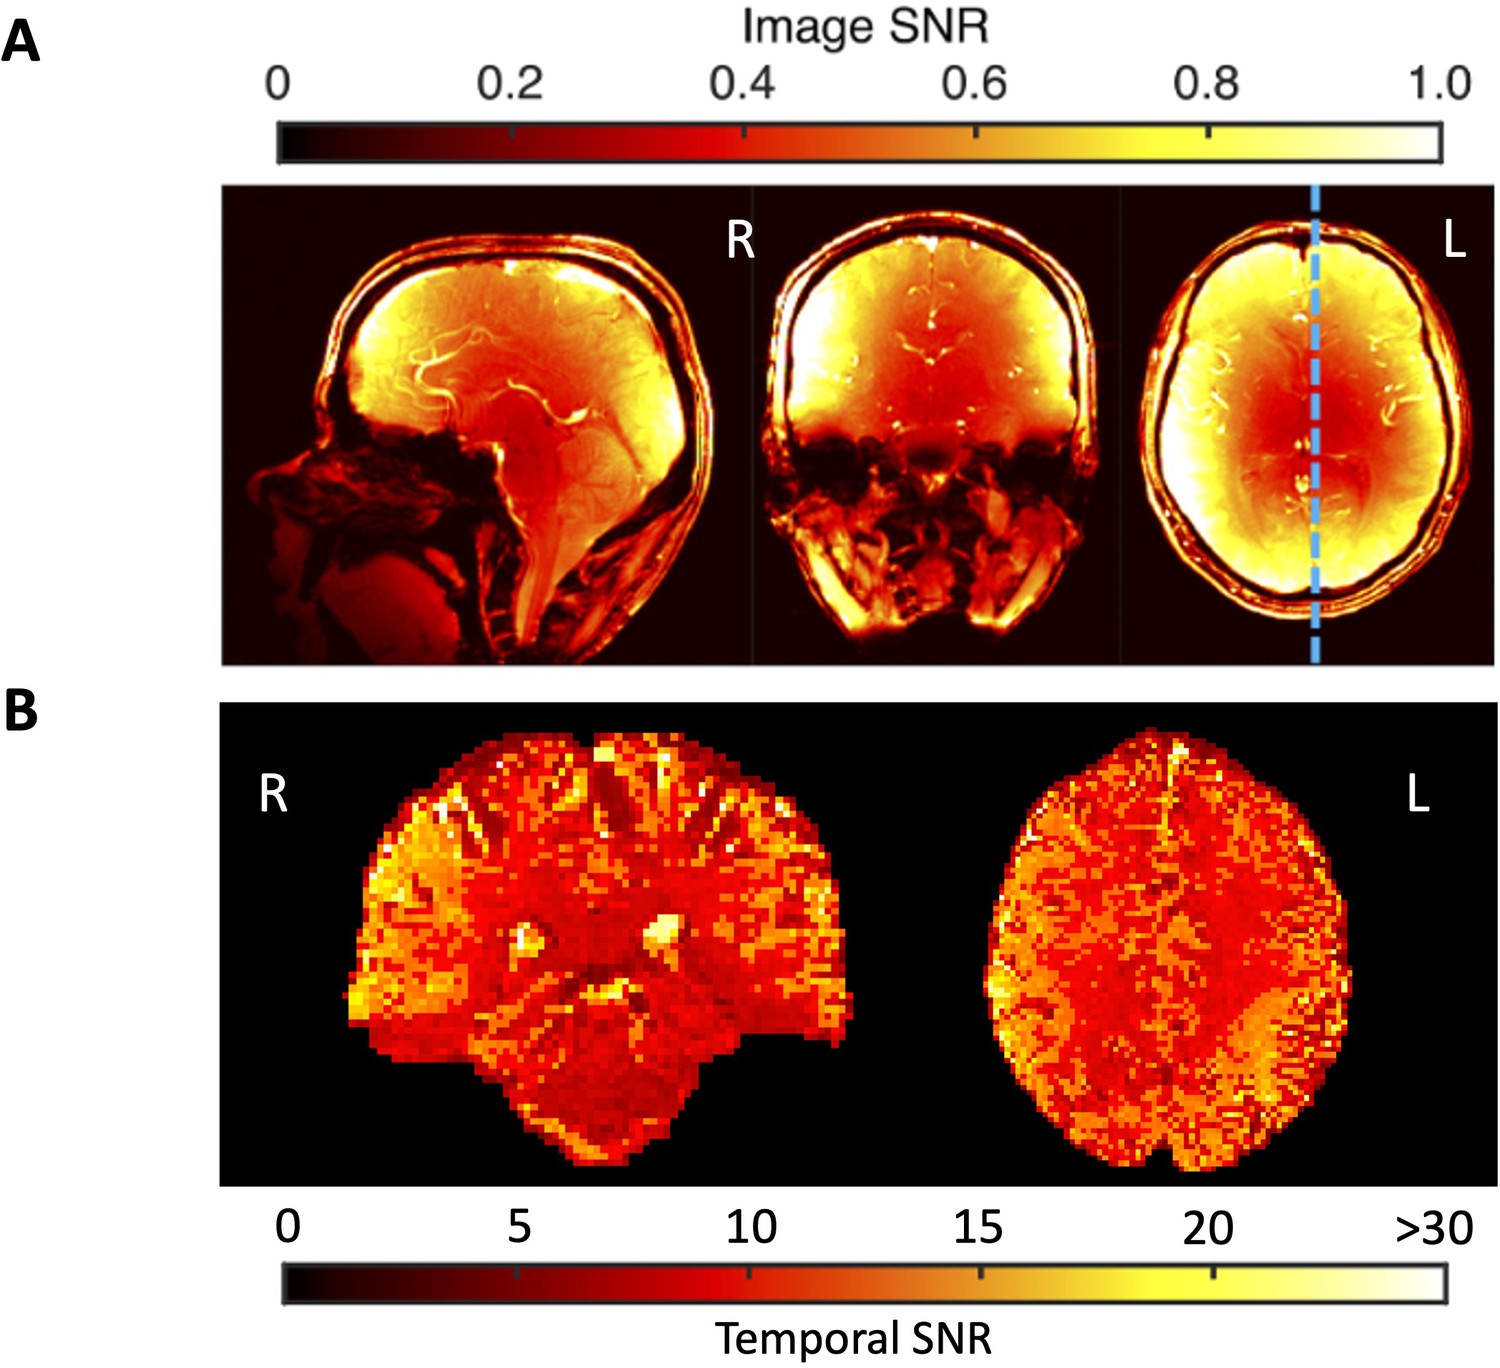
Image and temporal signal-to-noise-ration (SNR) calculated on fMRI data acquired at 7T with an AC-84 Mark II gradient coil, an in-house 8-channel transmit, and a 32-channel receive coil (see methods, main text).
(A). Image SNR maps from gradient-echo-images obtained from Gilbert et al., 2021. (B) Temporal SNR (i.e. ratio of the mean signal to the standard deviation through the time course) for EPI BOLD images obtained from one run of one participant. The mean tSNR calculated within peripheral brain regions nearest the coil elements is 10% higher for right hemisphere than tSNR produced by left hemisphere.
Figure 4

Brain networks involved in processing of Frith-Happé’s ToM and Random animations in marmosets.
Group functional maps showing significant greater activations for ToM condition (A), Random condition (B) and the comparison between ToM and Random conditions (C). Group map obtained from six marmosets displayed on lateral and medial views of the right fiducial marmoset cortical surfaces as well as dorsal and ventral views of left and right fiducial marmoset cortical surfaces. The white line delineates the regions based on the Paxinos parcellation of the NIH marmoset brain atlas (Liu et al., 2018). The brain areas reported have activation threshold corresponding to z-scores >2.57 (yellow/red scale) or z-scores <–2.57 (purple/green scale) (AFNI’s 3dttest++, cluster-forming threshold of p<0.01 uncorrected and then FWE-corrected α=0.05 at cluster-level from 10,000 Monte-Carlo simulations).
Figure 5 with 1 supplement
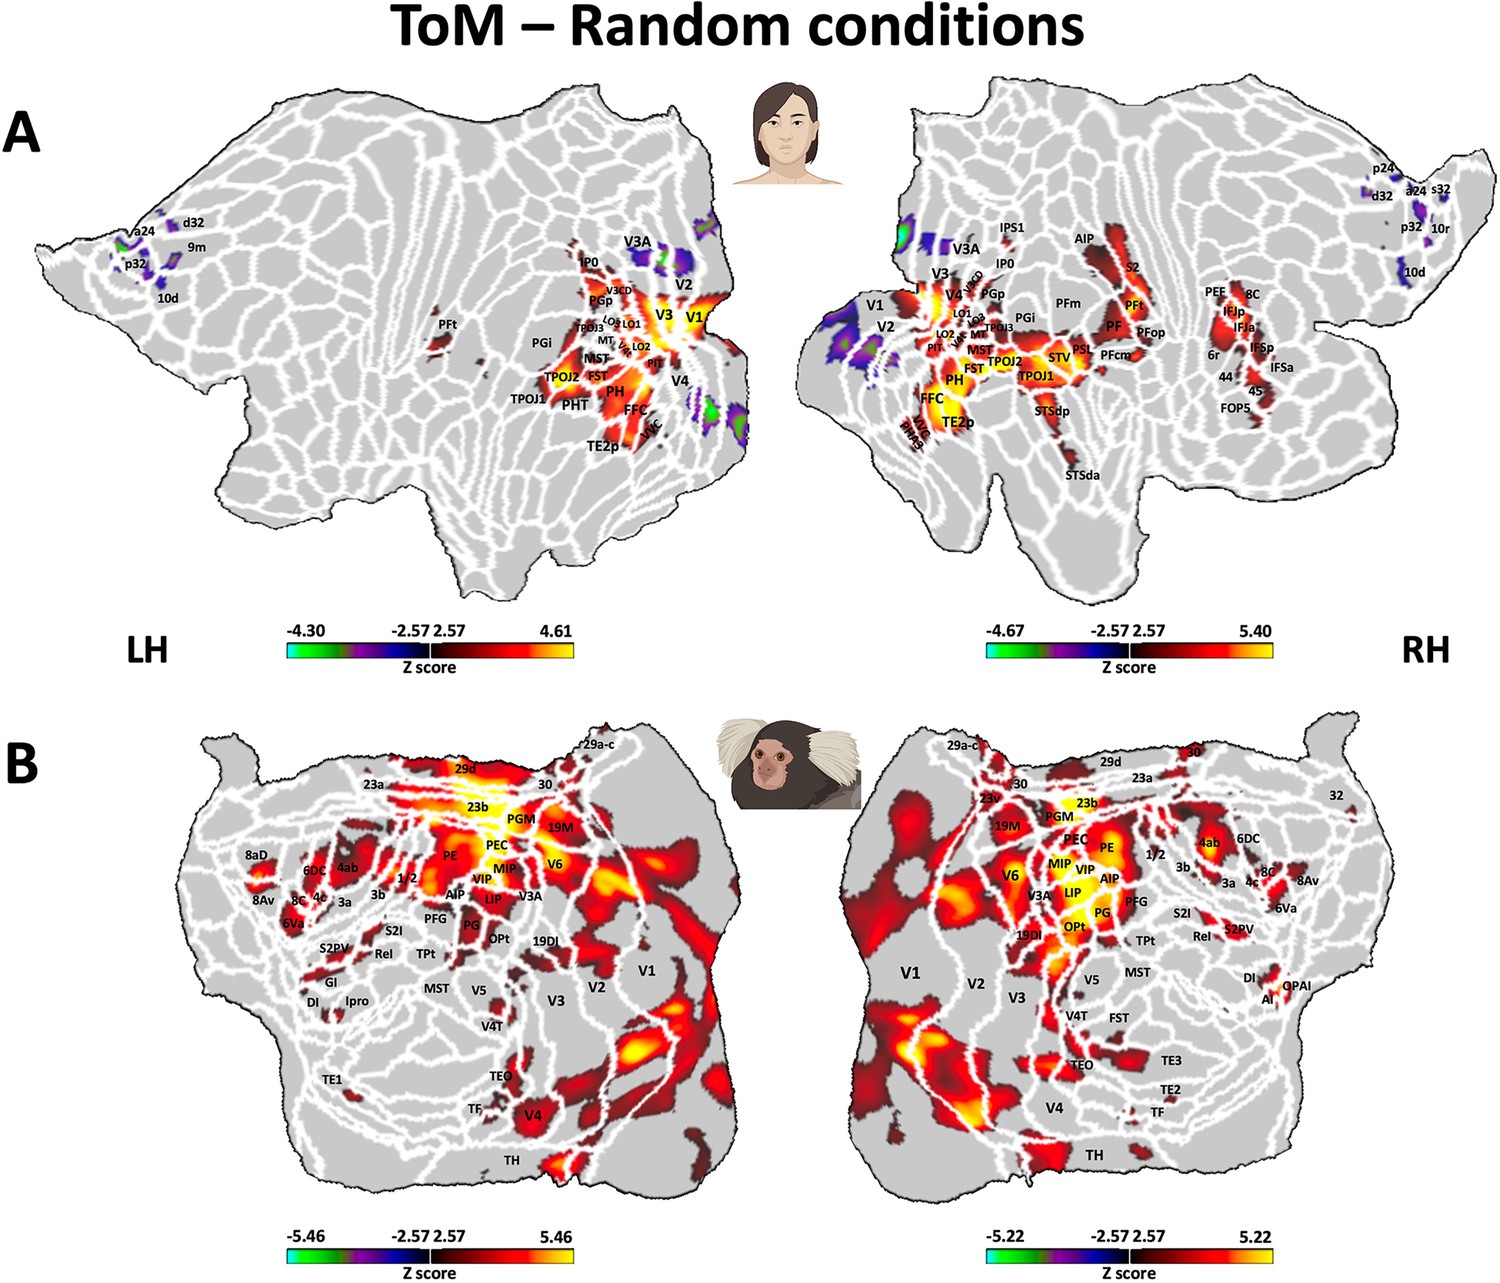
Brain network involved during processing of ToM compared to Random Frith-Happé’s animations in both humans (A) and marmosets (B).
Group functional maps showing significant greater activations for ToM animations compared to Random animations. (A) Group map obtained from 10 human subjects displayed on the left and right human cortical flat maps. The white line delineates the regions based on the recent multi-modal cortical parcellation atlas (Glasser et al., 2016). (B) Group map obtained from 6 marmosets displayed on the left and right marmoset cortical flat maps. The white line delineates the regions based on the Paxinos parcellation of the NIH marmoset brain atlas (Liu et al., 2018). The brain areas reported in A and B have activation threshold corresponding to z-scores >2.57 (yellow/red scale) or z-scores <–2.57 (purple/green scale) (AFNI’s 3dttest++, cluster-forming threshold of p<0.01 uncorrected and then FWE-corrected α=0.05 at cluster-level from 10,000 Monte-Carlo simulations).
Figure 5—figure supplement 1
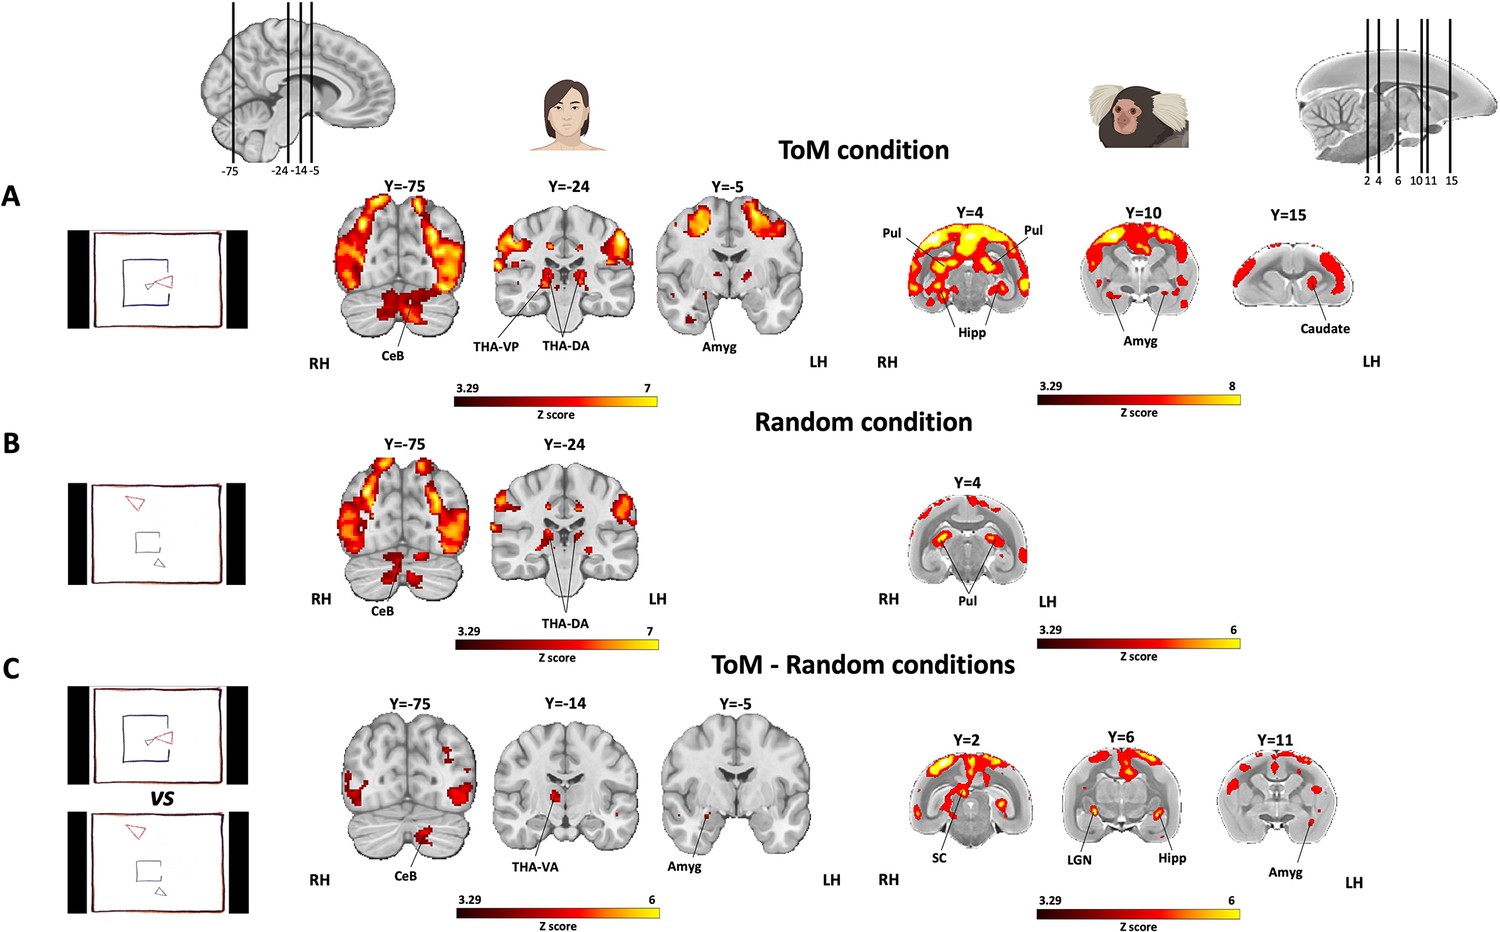
Subcortical activations during processing of Frith-Happé’s ToM and Random animations in humans (left) and marmosets (right).
Group subcortical functional maps showing significant greater activations for ToM condition (A), Random condition (B) and the comparison between ToM and Random conditions (C). Group maps displayed on coronal slices obtained from ten humans (left side) and 6 marmosets (right side). The brain areas reported have activation threshold corresponding to z-scores>3.29 (AFNI’s 3dttest++, threshold of p<0.001 uncorrected). CeB, cerebellum; THA-VP, ventroposterior thalamus; THA-DA, dorsoanterior thalamus; THA-VA, ventroanterior thalamus; Amyg, amygdala; Hipp, hippocampus; Pul, pulvinar; SC, superior colliculus; LGN, lateral geniculate nucleus.
Videos
Video 1
Theory of Mind (ToM)' Category, Frith-Happe Animations – Seducing Simulation.
Video 2
Theory of Mind (ToM)' Category, Frith-Happe Animations – Mocking Simulation.
Video 3
Theory of Mind (ToM)' Category, Frith-Happe Animations – Surprise Simulation.
Video 4
Theory of Mind (ToM)' Category, Frith-Happe Animations – Coaxing Simulation.
Video 5
Goal-Directed (GD)' Category, Frith-Happe Animations – Dancing Simulation.
Video 6
Goal-Directed (GD)' Category, Frith-Happe Animations – Fighting Simulation.
Video 7
Goal-Directed (GD)' Category, Frith-Happe Animations – Chase Simulation.
Video 8
Goal-Directed (GD)' Category, Frith-Happe Animations – Leading Simulation.
Video 9
Random' Category, Frith-Happé Animations – Billiard Simulation.
Video 10
Random' Category, Frith-Happé Animations – Drifting Simulation.
Video 11
Random' Category, Frith-Happé Animations – Star Simulation.
Video 12
Random' Category, Frith-Happé Animations – Tennis Simulation.
Additional files
Download links
A two-part list of links to download the article, or parts of the article, in various formats.
Downloads (link to download the article as PDF)
Open citations (links to open the citations from this article in various online reference manager services)
Cite this article (links to download the citations from this article in formats compatible with various reference manager tools)
Gaze patterns and brain activations in humans and marmosets in the Frith-Happé theory-of-mind animation task
eLife 12:e86327.
https://doi.org/10.7554/eLife.86327


