Scorpionfish BPI is highly active against multiple drug-resistant Pseudomonas aeruginosa isolates from people with cystic fibrosis
- Institute of Clinical Microbiology and Hygiene Regensburg, University Hospital Regensburg, Germany
- Institute of Pathology, University of Regensburg, Germany
- Institute of Medical Microbiology and Hygiene Regensburg, University of Regensburg, Germany
- Department of Pneumology, Donaustauf Hospital, Germany
- Division of Bioanalytical Chemistry, Priority Area Infections, Research Center Borstel, Leibniz Lung Center, Germany
- Institute of Pathology, University Medical Center Mannheim, Medical Faculty Mannheim, University of Heidelberg, Germany
Figures
Figure 1 with 2 supplements
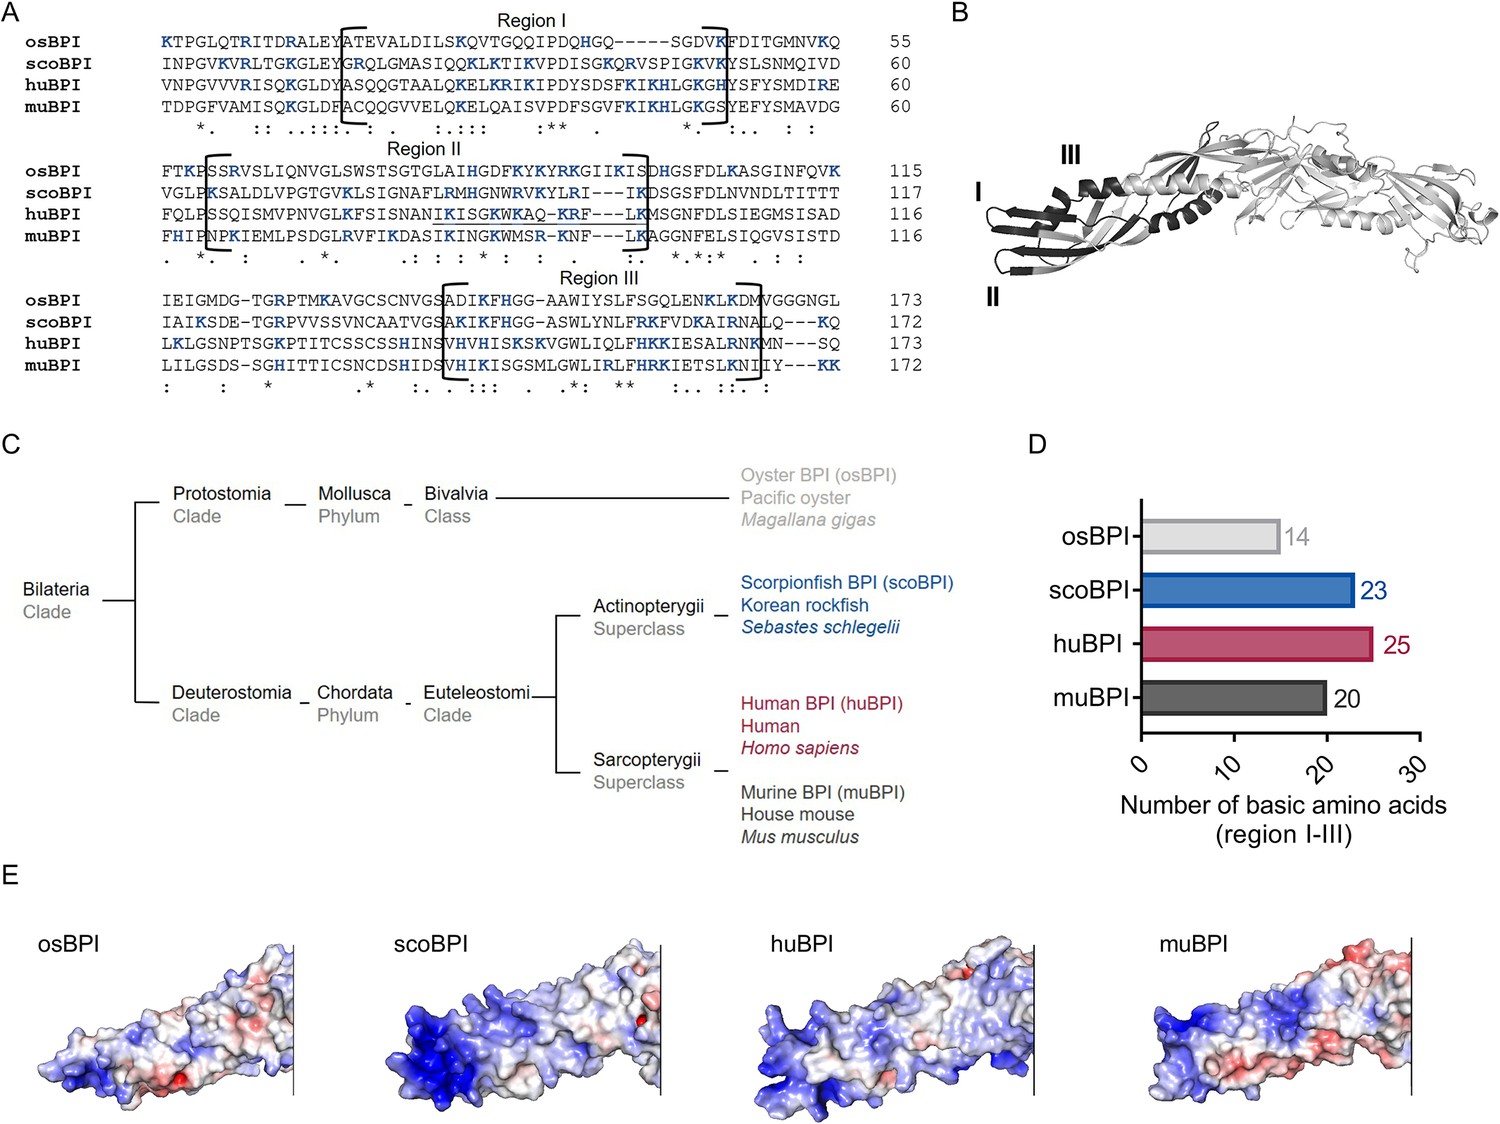
Sequence alignment and analysis of orthologous proteins to human bactericidal/permeability-increasing protein (huBPI).
(A) Sequence alignment of amino acid sequences of orthologous proteins. Functional regions I–III are framed, and positively charged amino acids are shown in blue. The amino acid sequence mediating the bactericidal activity of human BPI (huBPI) is underlined. (B) Functional regions I–III (dark grey) as shown for huBPI. (C) Phylogenetic tree analysis mapping BPI orthologous proteins to their respective taxonomic ranks. (D) Number of basic amino acids in regions I–III as shown for oyster BPI (osBPI), scorpionfish BPI (scoBPI), huBPI and murine BPI (muBPI). (E) Electrostatic surface potentials calculated for the N-terminal barrel of osBPI, scoBPI, huBPI, and muBPI. Negatively charged areas are colored in red, and positively charged domains are shown in blue.
Figure 1—figure supplement 1
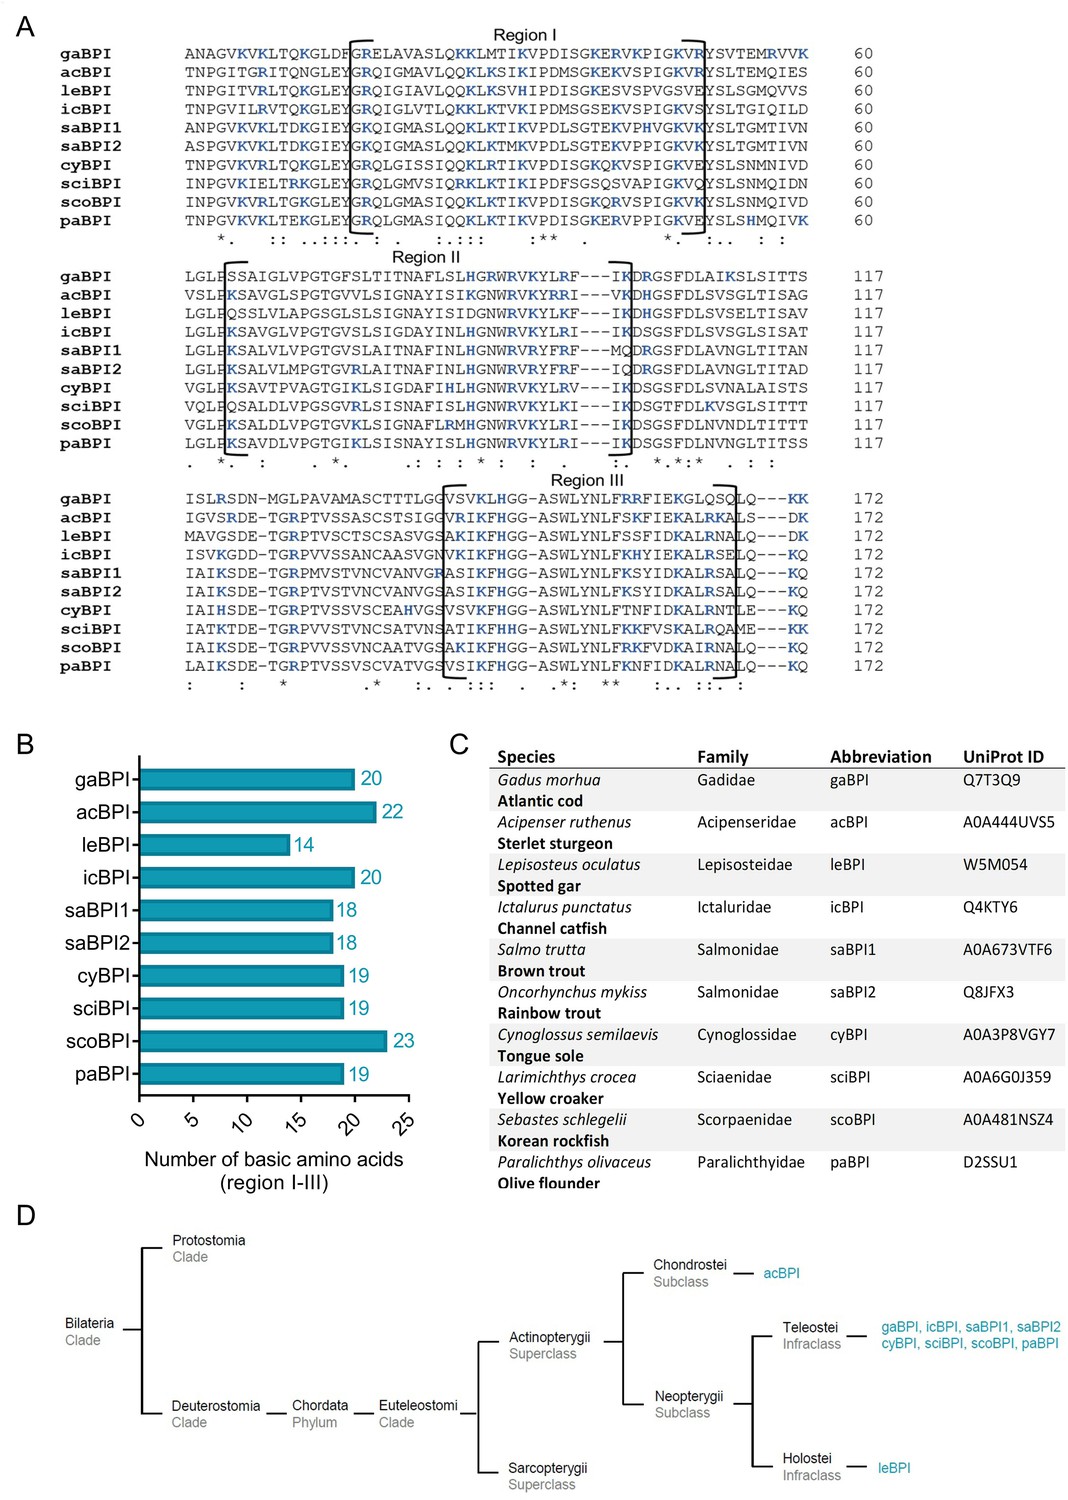
Sequence alignment and analysis of orthologous Actinopterygii bactericidal/permeability-increasing protein (BPI).
(A) Sequence alignment of amino acid sequences of orthologous proteins.Functional regions I–III are framed, and positively charged amino acids are shown in blue. Conserved areas are indicated by asterisk, colon and period representing highly, moderately, and less conserved areas, respectively. (B) Number of basic amino acids in regions I–III of Actinopterygii BPI. (C) Actinopterygii species are listed including taxonomic family, abbreviation of the corresponding BPI and UniProt ID. (D) Phylogenetic tree analysis mapping Actinopterygii BPI orthologous to their respective taxonomic ranks.
Figure 1—figure supplement 2
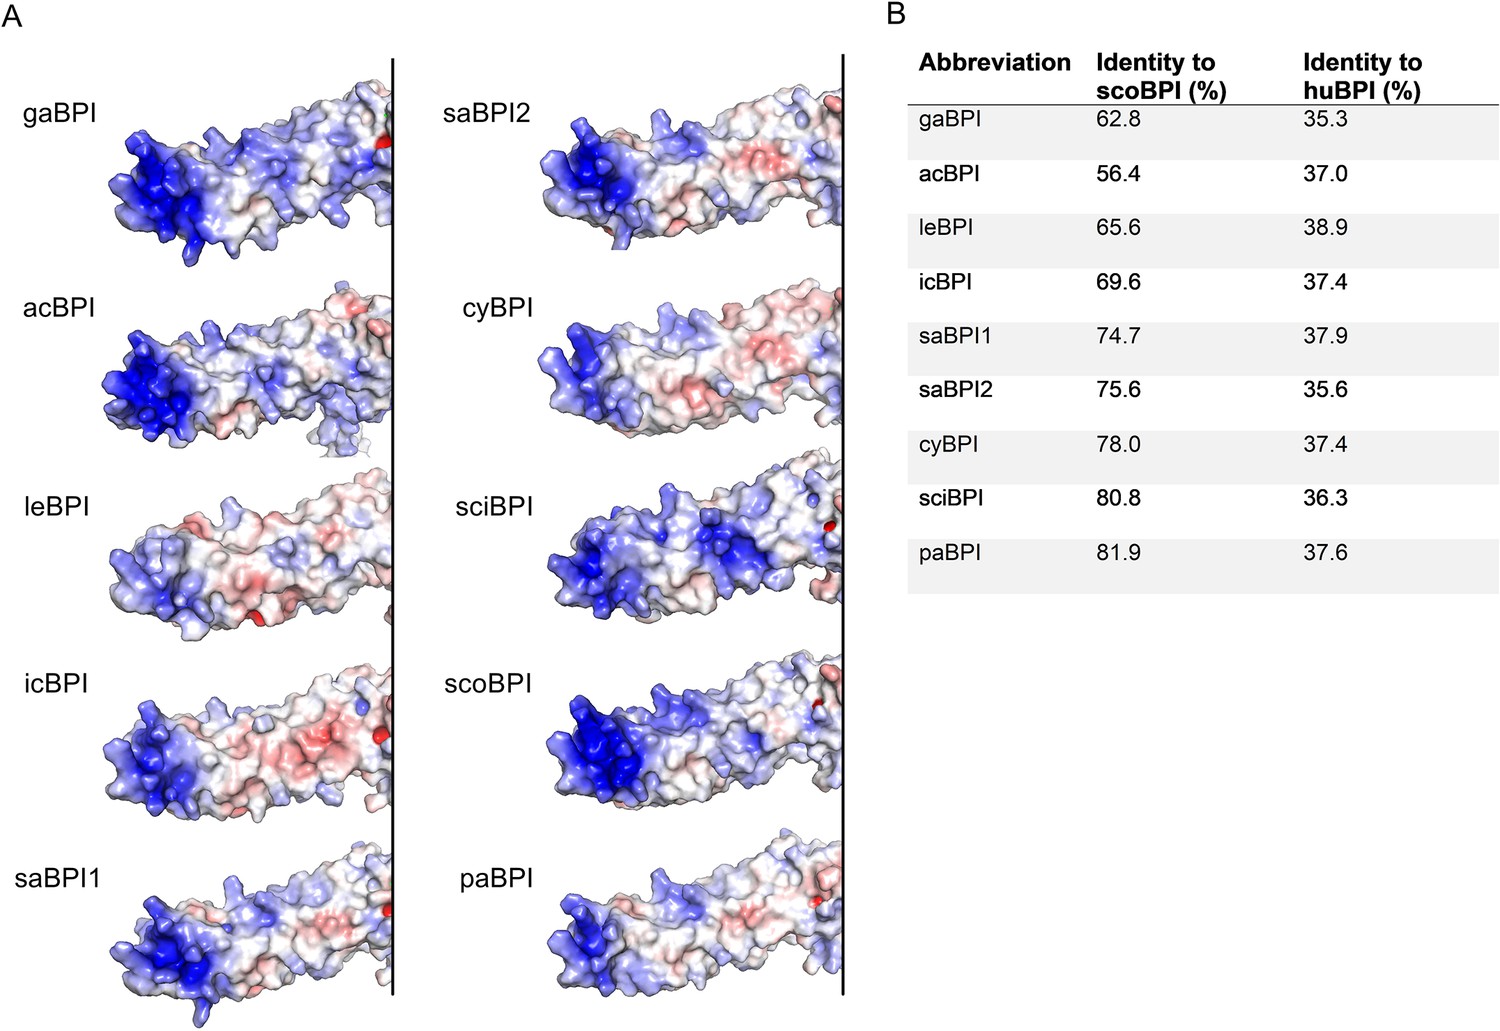
Predicted N-terminal surface electrostatics and sequence identities of Actinopterygii bactericidal/permeability-increasing protein (BPI).
(A) Surface electrostatics for the N-terminal barrels of three-dimensional structure predictions for BPI of investigated Actinopterygii. Areas colored in blue represent positively charged areas, and negatively charged domains are shown in red. (B) Sequence identities of investigated orthologous proteins without signal peptide in comparison to scorpionfish BPI (scoBPI) and human BPI (huBPI).
-
Figure 1—figure supplement 2—source data 1
Uncropped and labeled images for Figure 2—figure supplement 1C.
Raw data for Figure 2—figure supplement 1D.
- https://cdn.elifesciences.org/articles/86369/elife-86369-fig1-figsupp2-data1-v1.xlsx
Figure 2 with 1 supplement
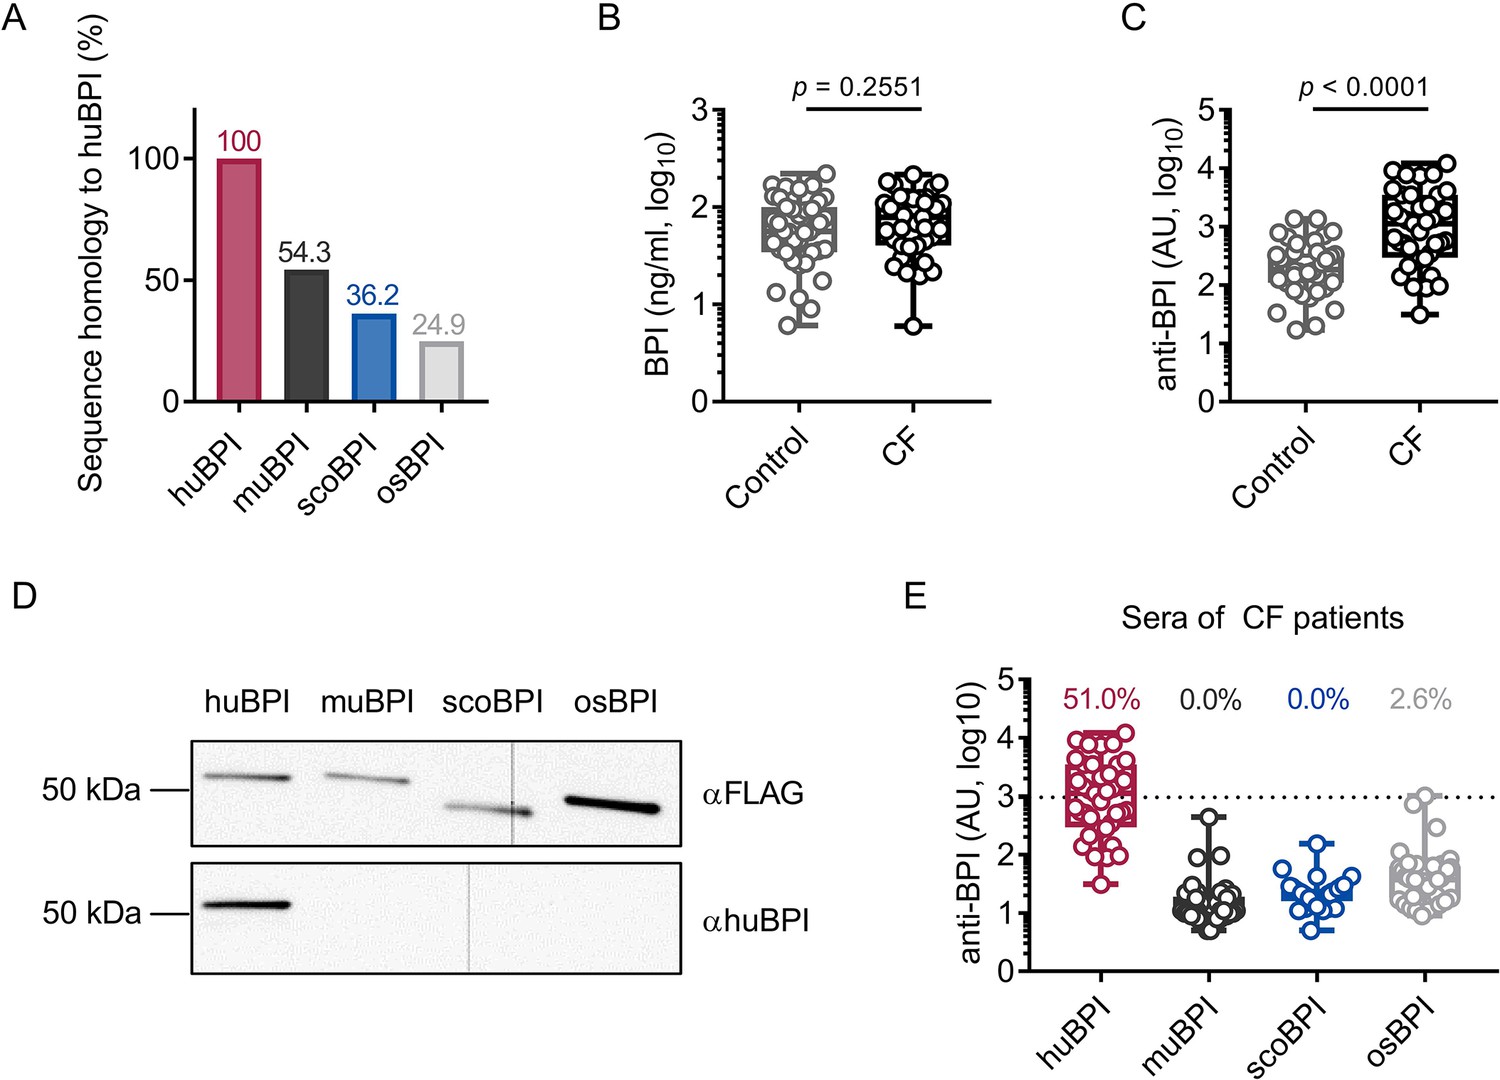
Bactericidal/permeability-increasing protein-anti-neutrophil cytoplasmic antibodies (BPI-ANCA) from people with cystic fibrosis (PwCF) do not recognize orthologous proteins of human BPI (huBPI).
(A) Sequence homology of amino acid sequences to huBPI without signal peptide. (B, C) Levels of BPI (B) and anti-BPI antibodies indicated in arbitrary units (AU; C) in the sera of PwCF and age- and sex-matched healthy controls (n = 39). (D) Western blot analysis of recombinantly expressed proteins. Bands were visualized with anti-FLAG (αFLAG) or anti-human BPI (αhuBPI) antibodies. One representative experiment of two biological replicates using different protein lots in separate assays is shown. (E) Recognition of recombinantly expressed proteins by anti-BPI antibodies present in the sera of the individual PwCF shown in (C, n = 39). The signal cutoff is indicated by a dotted line and was defined as 2 standard deviations above the mean signal determined in the sera of healthy controls shown in (C). Data are shown as box plots showing median, upper, and lower quartiles and whiskers indicating minimal and maximal values (B, C, E) or bar plots using calculated values (A). Sera measurements were performed with samples from 39 individual PwCF and 39 age- and sex-matched controls. For depiction in the logarithmic scale, values of zero were set to the lower limit of detection of the assay (B). Statistical testing was performed using the Mann–Whitney U test. Statistical significance is indicated by p-values.
-
Figure 2—source data 1
Raw data for Figure 2B, C and E.
Uncropped and labeled blots for Figure 2D.
- https://cdn.elifesciences.org/articles/86369/elife-86369-fig2-data1-v1.zip
Figure 2—figure supplement 1
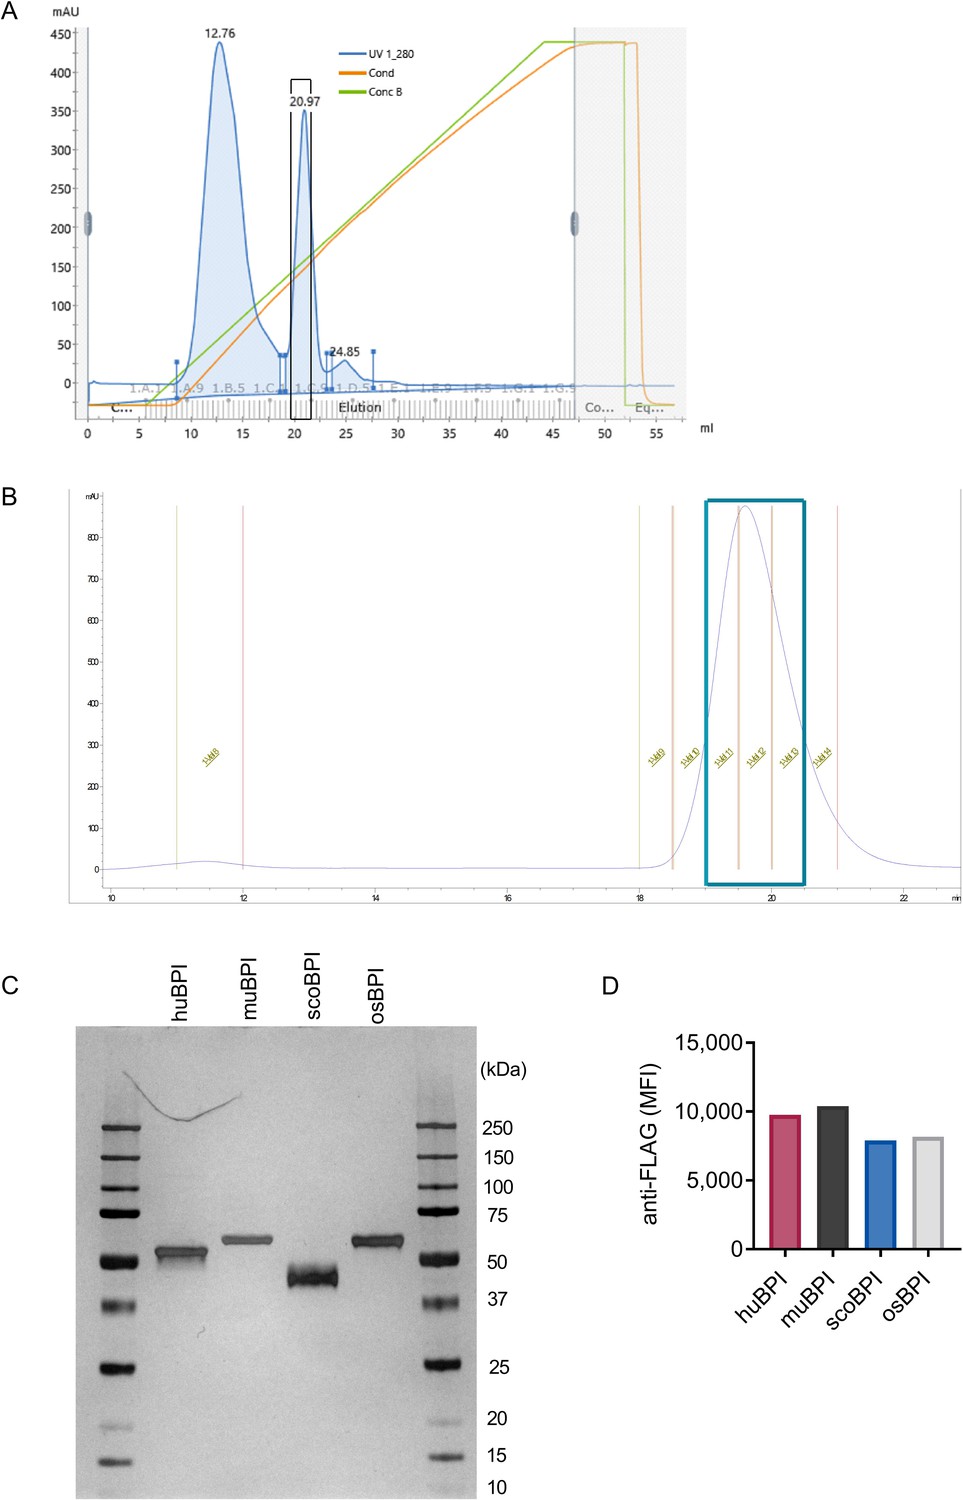
Purification of bactericidal/permeability-increasing protein (BPI) orthologues and quality controls.
(A) Ion-exchange chromatography histogram for purification as exemplified for scorpionfish BPI (scoBPI). Framed peak was eluted at a NaCl concentration of 0.8 M. Following elution, selected fractions (boxed in black) were unified. (B) Histogram of size-exclusion chromatography as exemplified for scoBPI. Unified fractions after size exclusion are boxed (cyan). (C) Silver protein stain of concentrated human BPI (huBPI), murine BPI (muBPI), scoBPI, and oyster BPI (osBPI) preparations in a 12% SDS gel. (D) Coupling control using an anti-FLAG M2 antibody for BPI orthologues on beads used for Luminex measurements.
-
Figure 2—figure supplement 1—source data 1
Uncropped and labeled images for Figure 2—figure supplement 1C.
Raw data for Figure 2—figure supplement 1D.
- https://cdn.elifesciences.org/articles/86369/elife-86369-fig2-figsupp1-data1-v1.zip
Figure 3
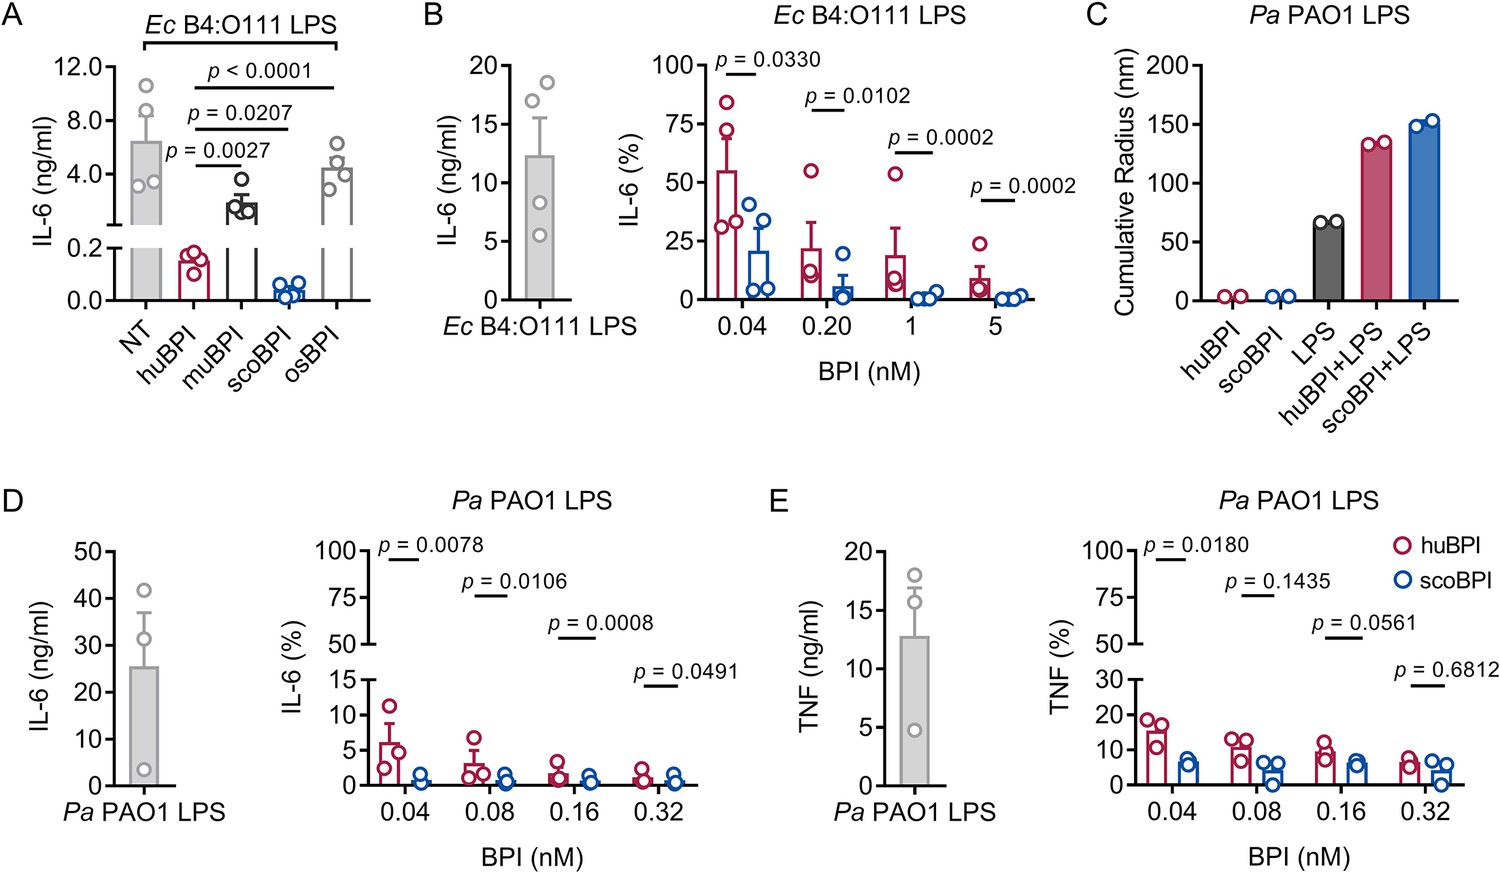
Potent anti-inflammatory action of scorpionfish bactericidal/permeability-increasing protein (scoBPI) in human immune cells.
(A) Levels of IL-6 in supernatants of peripheral blood mononuclear cells (PBMCs) stimulated for 24 hr with Ec B4:O111 lipopolysaccharide (LPS; 10 ng/ml) ± human BPI (huBPI), murine BPI (muBPI), scoBPI, or oyster BPI (osBPI; 25 nM; n = 4). (B) Levels of IL-6 in supernatants of PBMCs stimulated for 24 hr with Ec B4:O111 LPS (10 ng/ml) ± huBPI (red) or scoBPI (blue) in concentration as indicated. (C) Aggregate size of Pa PAO1 LPS ± huBPI or scoBPI as determined by NanoDLS (n = 2). (D, E) Quantification of IL-6 (D) and TNF (E) levels in supernatants of PBMCs stimulated for 24 hr with Pa PAO1 LPS (100 ng/ml)±huBPI (red) or scoBPI (blue) in concentrations as indicated (n = 3). Experiments were performed using PBMCs of four (A, B) or three (D, E) individual blood donors. NanoDLS experiments were performed as technical replicates in two separate assays (C). Data are shown as means ± SEM. Statistical testing was performed using the Student’s ratio paired t-test (A, B, D, E). Statistical significance is indicated by p-values.
-
Figure 3—source data 1
Raw data for Figure 3A–E.
- https://cdn.elifesciences.org/articles/86369/elife-86369-fig3-data1-v1.zip
Figure 4 with 1 supplement
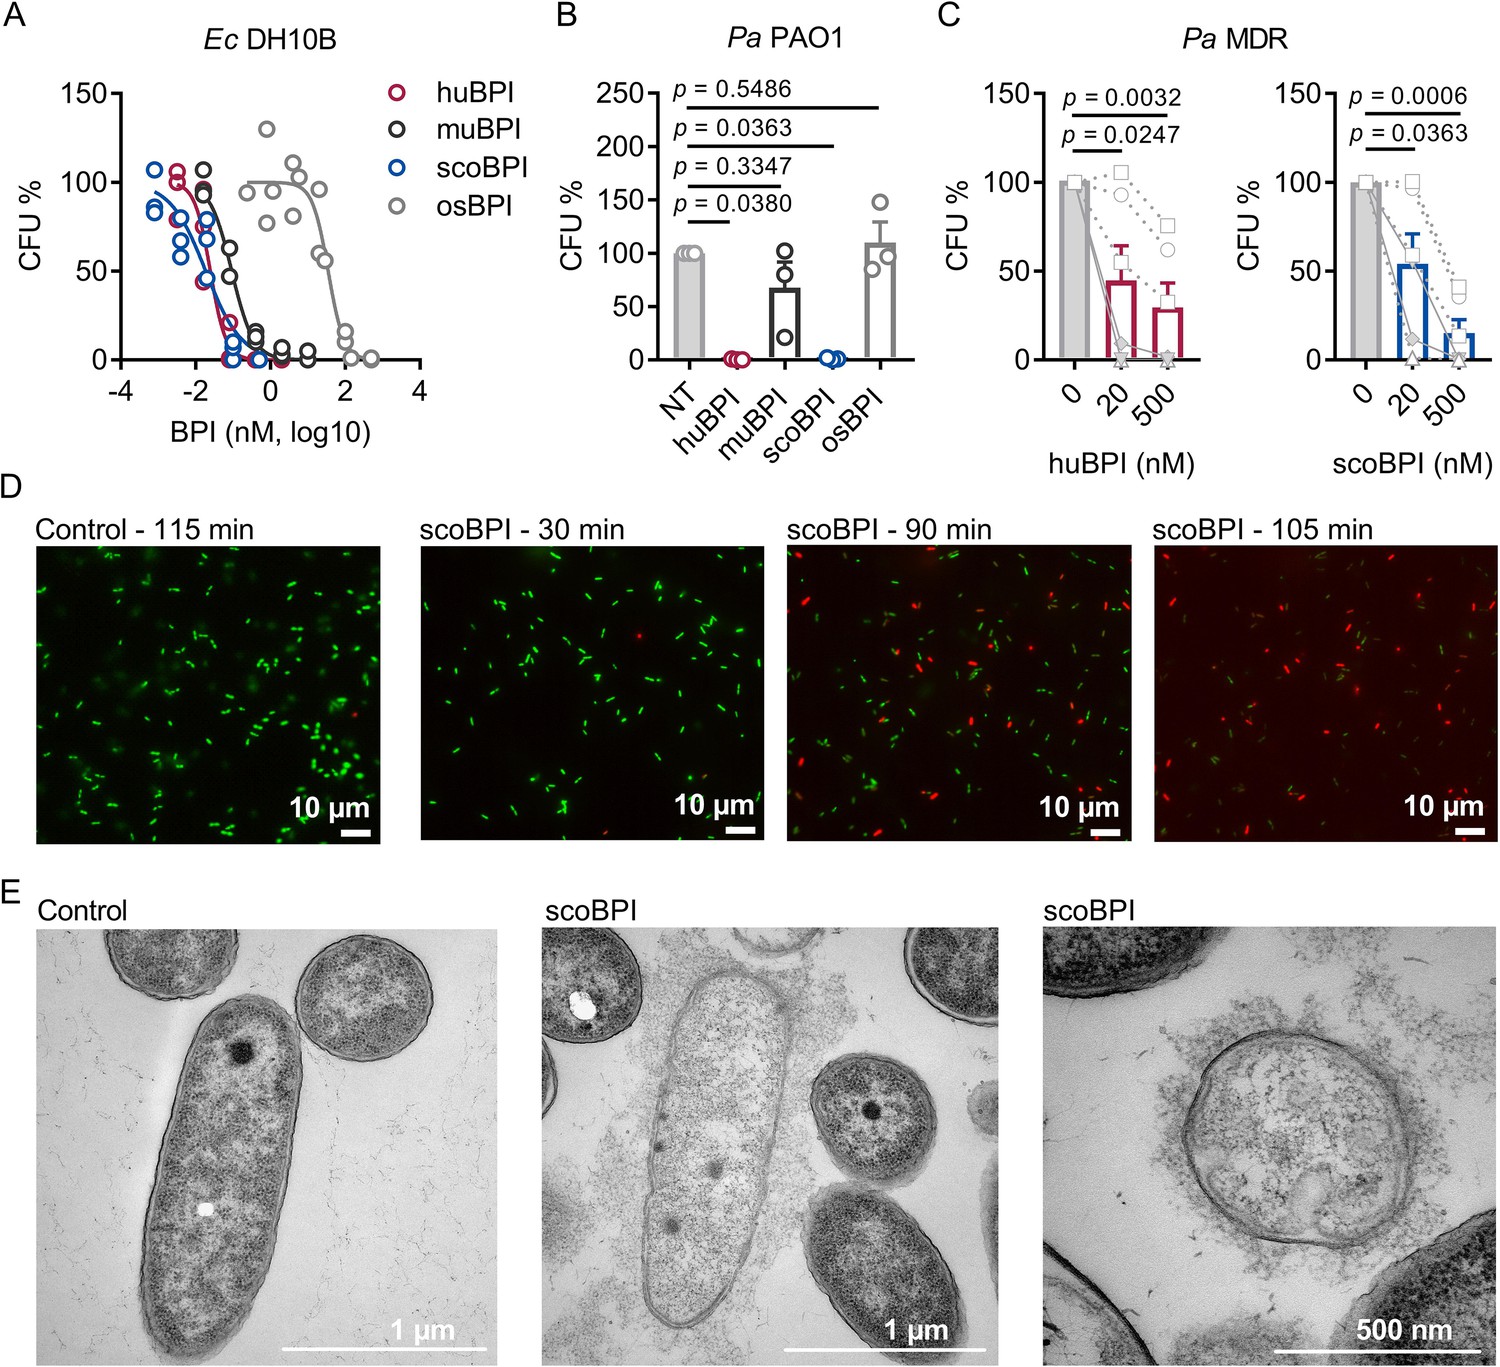
Bactericidal activity of human bactericidal/permeability-increasing protein (huBPI) and scorpionfish BPI (scoBPI) against Ec and multiple drug resistance (MDR) isolates of Pa.
(A) Dose–response curves for Ec DH10B incubated with increasing concentrations of huBPI, murine BPI (muBPI), scoBPI, or oyster BPI (osBPI; n = 3). (B) Bactericidal activity of huBPI, muBPI, scoBPI, and osBPI 500 nM against Pa PAO1 (n = 3). (C) Antibacterial activity of huBPI and scoBPI at concentrations of 20 and 500 nM against six MDR isolates of Pa obtained from five individual people with cystic fibrosis (PwCF). Isolates (isolates 2 and 5 in Table 1) that originate from the same donor are shown as a square. Mucoid isolates are displayed as filled symbols connected by continuous lines. (D) Images of a bacterial viability assay performed with one representative Pa MDR strain. Viable bacteria are seen in green and dead bacteria in red, respectively. Scale bars for 10 µm. (E) Transmission electron microscopy of the representative Pa MDR isolate shown in (D) after treatment with PBS (control) or scoBPI for 2 hr. Scale bars for 1 µm (left, middle) or 500 nm (right). Data are shown as individual values (A) or means ± SEM (B, C) of technical replicates using the same lots of BPI and bacteria in three separate assays (A, B). Relative colony-forming units (CFUs) are depicted (A–C). Statistical testing was performed using the Student’s paired t-test on the absolute CFUs (A–C). Statistical significance is indicated by p-values.
-
Figure 4—source data 1
Raw data for Figure 4A–C.
- https://cdn.elifesciences.org/articles/86369/elife-86369-fig4-data1-v1.zip
Figure 4—figure supplement 1
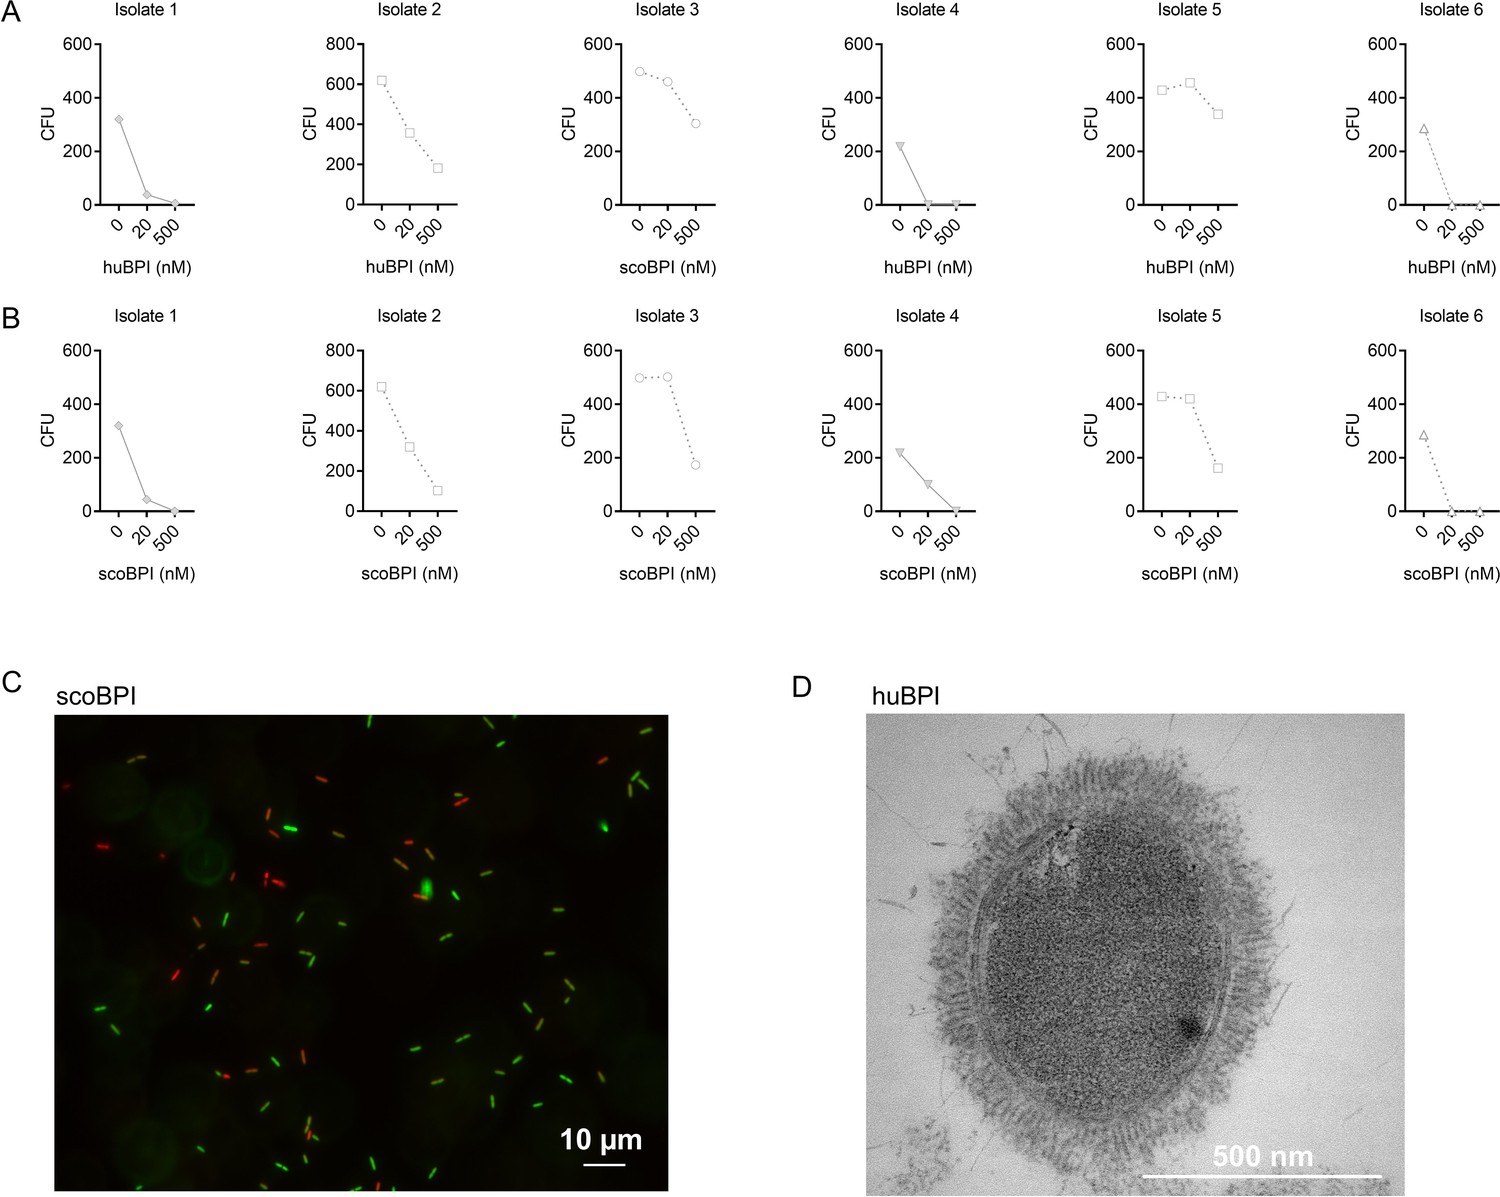
Bactericidal activity of human bactericidal/permeability-increasing protein (huBPI) and scorpionfish BPI (scoBPI) against individual multiple drug resistance (MDR) isolates of Pa corresponding to data shown in Figure 4.
(A, B) Antibacterial activity of huBPI (A) and scoBPI (B) at concentrations of 20 and 500 nM against six MDR isolates of Pa obtained from five individual people with cystic fibrosis (PwCF). Isolates 2 and 5 originate from the same patient, and isolates 1 and 4 are both mucoid isolates (also see Table 1). Absolute colony-forming units (CFUs) are depicted. (C) Representative image of bacterial viability assay performed with scoBPI-treated Pa MDR strain at the time of transmission electron microscopy (TEM). Viable bacteria are seen in green and dead bacteria in red, respectively. Scale bars for 10 µm. (D) TEM of the representative Pa MDR isolate shown in Figure 4D and E after treatment with huBPI for 2 hr.
-
Figure 4—figure supplement 1—source data 1
Raw data for Figure 4—figure supplement 1A and B.
- https://cdn.elifesciences.org/articles/86369/elife-86369-fig4-figsupp1-data1-v1.zip
Author response image 1
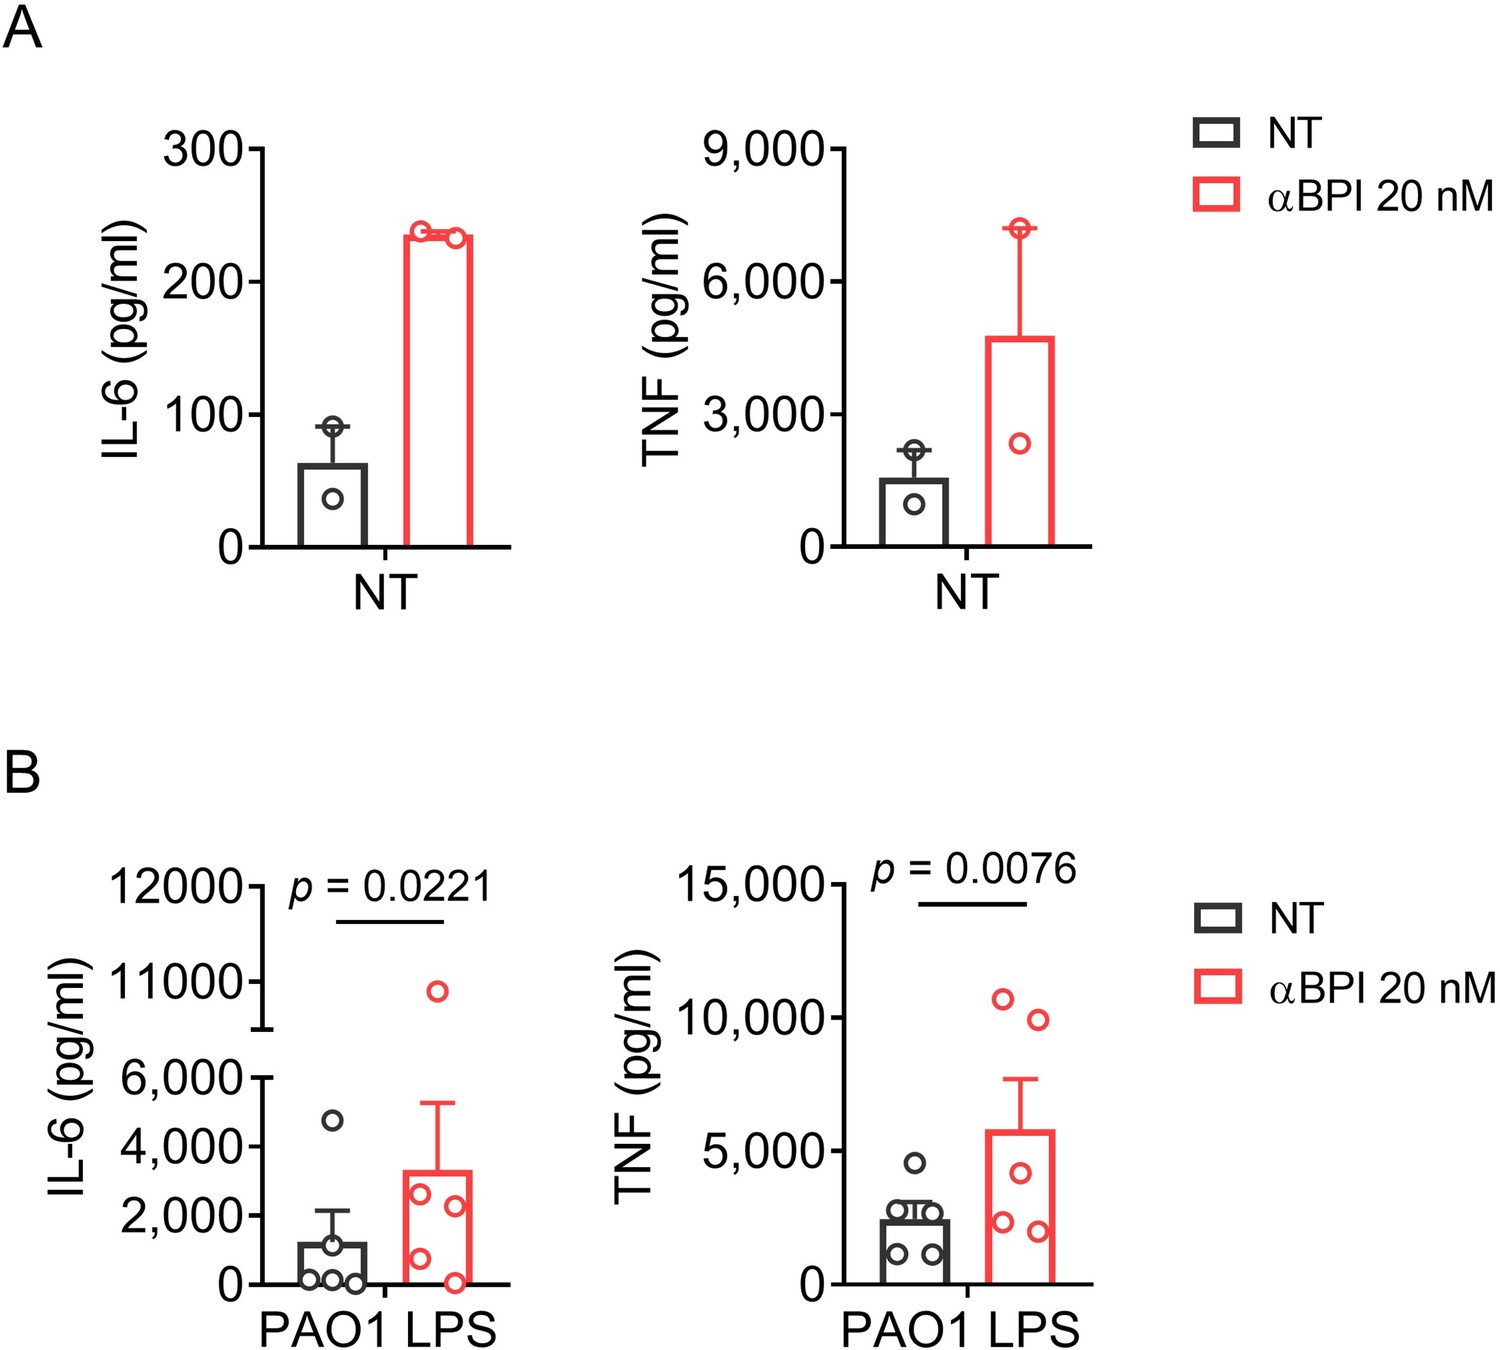
Background activity of a rabbit polyclonal anti-huBPI in PBMCs.
(A) Levels of IL-6 and TNF in supernatants of PBMCs stimulated for 24 h with a polyclonal anti-huBPI antibody. (B) Levels of IL-6 and TNF in supernatants of PBMCs stimulated for 24 h with PAO1 LPS (10 ng/ml) or medium ± polyclonal anti-huBPI antibody. Experiments were performed using PBMCs of two (A) or five (B) individual blood donors. Data are shown as means ± SEM. Statistical testing was performed using the student’s ratio paired t test (A). Statistical significance is indicated by p values. NT: not treated.
Author response image 2
Potent anti-inflammatory action of scoBPI in human immune cells corresponding to data shown in Figure 3.
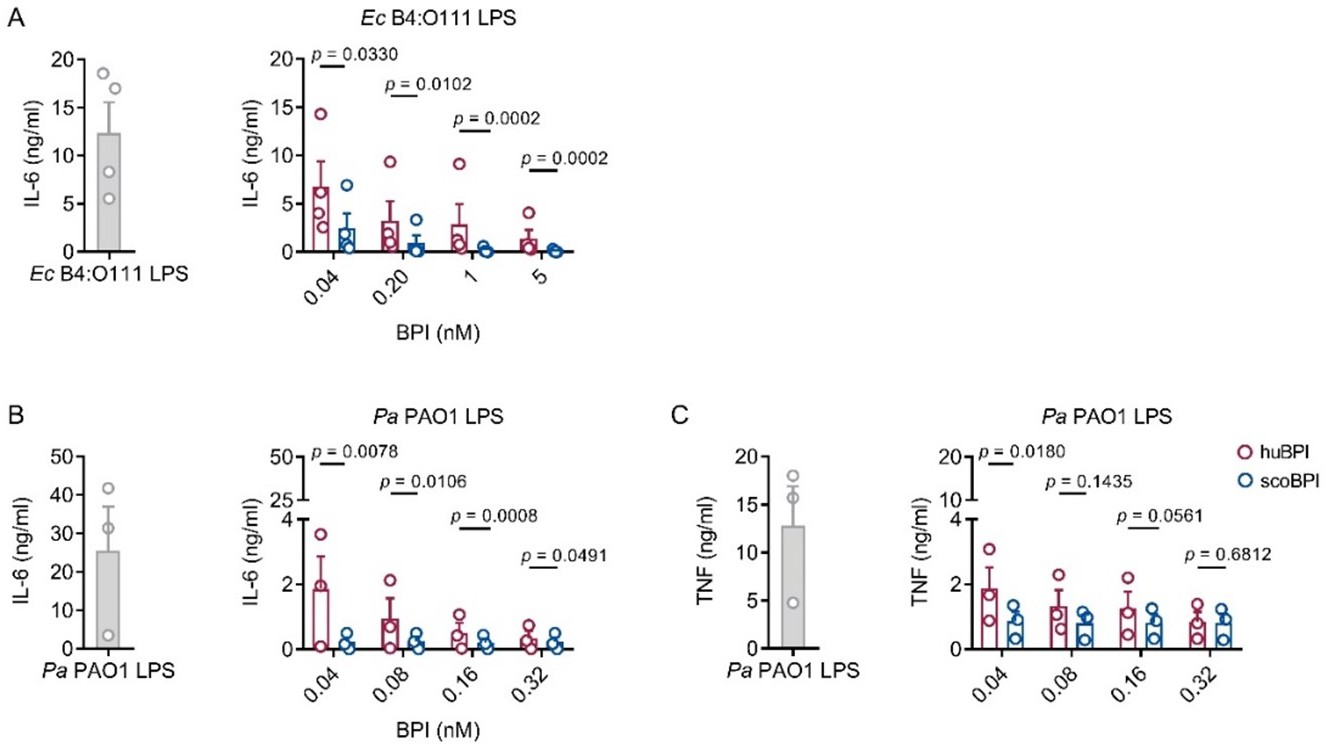
(A) Absolute levels of IL-6 in supernatants of PBMCs stimulated for 24 h with Ec B4:O111 LPS (10 ng/ml) ± huBPI (red) or scoBPI (blue) in concentration as indicated. (B, C) Absolute quantification of IL-6 (B) and TNF (C) levels in supernatants of PBMCs stimulated for 24 h with Pa PAO1 LPS (100 ng/ml) ± huBPI (red) or scoBPI (blue) in concentrations as indicated (n = 3). Experiments were performed using PBMCs of four (A) or three (B, C) individual blood donors. Data are shown as means ± SEM. Statistical testing was performed using the student’s ratio paired t test. Statistical significance is indicated by p values.
Author response image 3
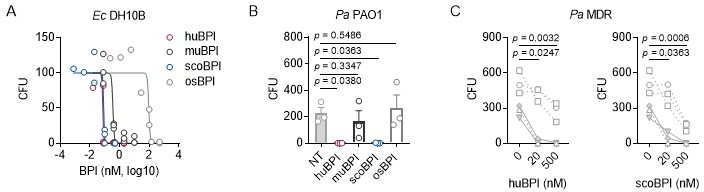
Bactericidal activity of orthologous proteins corresponding to data shown in Figure 4.
(A) Dose-response curves Ec DH10B incubated with increasing concentrations of huBPI, muBPI, scoBPI or osBPI (n = 3). (B) Bactericidal activity of huBPI, muBPI, scoBPI and osBPI 500 nM against Pa PAO1 (n = 3). (C) Antibacterial activity of huBPI and scoBPI at concentrations of 20 and 500 nM against six MDR isolates of Pa obtained from five individual PwCF. Isolates (isolate 2 and 5 in Table 1) that originate from the same donor are shown as a square. Mucoid isolates are displayed as filled symbols connected by continuous lines. Data are shown as individual points (A, C) or means ± SEM (B) of absolute values. Statistical testing was performed using the student’s paired t test. Statistical significance is indicated by p values.
Tables
Table 1
Characteristics of PwCF and MDR Pa isolates.
| Isolate | Age at sampling(years) | Sex | Comment | Ciprofloxacin | Piperacillin± Tazobactam | Ceftazidime/Cefepime | Imipenem/Meropenem |
|---|---|---|---|---|---|---|---|
| 1 | 31.7 | M | Mucoid | R | R | R | R |
| 2 | 22.9 | F | -/- | R | R | R | R |
| 3 | 31.0 | F | -/- | R | R | R | R |
| 4 | 12.1 | M | Mucoid | R | R | R | R |
| 5 | 26.2 | F | -/- | R | R | R | R |
| 6 | 24.0 | F | -/- | R | R | R | R |
-
Resistance was determined according to zone diameter breakpoints for Pa (EUCAST, version 13.0, published December 2022). Isolates 2 and 5 were derived from one individual patient with a time lag of 3.3 y.
-
MDR, multiple drug resistance; PwCF, people with cystic fibrosis; R, resistance to indicated antibiotic.
Additional files
Download links
A two-part list of links to download the article, or parts of the article, in various formats.
Downloads (link to download the article as PDF)
Open citations (links to open the citations from this article in various online reference manager services)
Cite this article (links to download the citations from this article in formats compatible with various reference manager tools)
Scorpionfish BPI is highly active against multiple drug-resistant Pseudomonas aeruginosa isolates from people with cystic fibrosis
eLife 12:e86369.
https://doi.org/10.7554/eLife.86369


