The Opto-inflammasome in zebrafish as a tool to study cell and tissue responses to speck formation and cell death
- European Molecular Biology Laboratory, Germany
- Department of Biochemistry, University of Lausanne, Switzerland
- Skin Research Laboratories, A*STAR, Singapore
- Institute of Molecular and Cell Biology, A*STAR, Singapore
- Department of Pediatrics, National University of Singapore (NUS), Singapore
- Medical Genetics Department, Koç University School of Medicine (KUSOM), Turkey
- Laboratory of Human Genetics & Therapeutics, Genome Institute of Singapore (GIS), A*STAR, Singapore
Figures
Figure 1 with 1 supplement
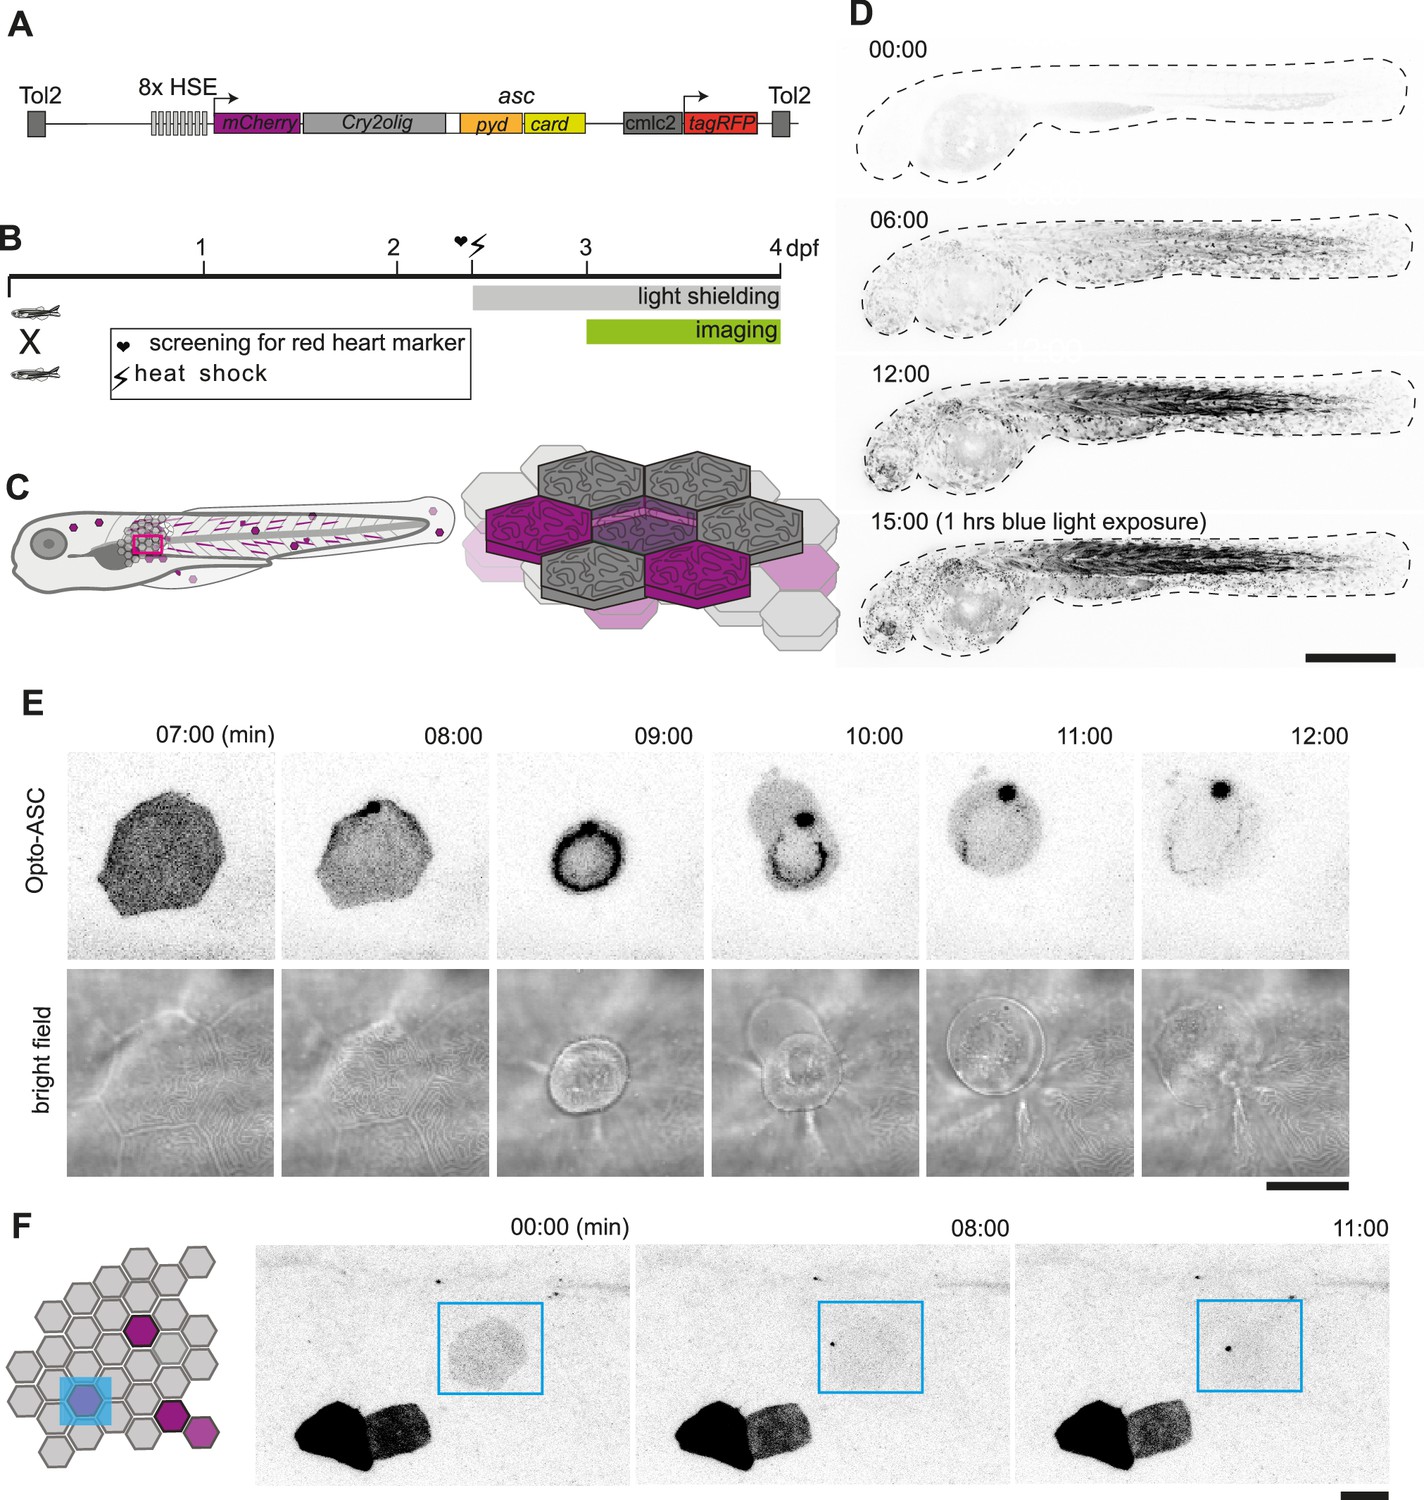
Optogenetic tools for ASC-dependent inflammasome formation.
(A) The optogenetic construct (Opto-ASC) consists of a heat shock element placed upstream of a cassette containing the sequences for mCherry, the photoactuator Cry2olig domain and asc, followed by a cassette containing the “red heart” marker cmlc2:tagRFP. The two cassettes are placed between Tol2 sites for insertion into the genome. (B) Experimental set-up: Progeny from the transgenic lines are first screened for the expression of the red heart marker at 2 dpf. Positive larvae expressing cmlc2:tagRFP are heat-shocked and kept in dark conditions to prevent spontaneous Opto-ASC activation throughout the experiment. Imaging is performed at 3 dpf. (C) Schematic depicting the stochastic expression of Opto-ASC. Left: overview of larva; right: diagram of the epidermis with the periderm on top (dark colour) and basal cell layer below (light colour). (D) Time lapse images of 3dpf larva expressing Opto-ASC. Expression of Opto-ASC becomes detectable at 6 hr post heat shock. The frame rate is 15 min, time points are hours after heat shock, scale bar is 200 µm. (E–F) Example of Opto-ASC forming specks in the epithelial layer of 3dpf larva expressing Opto-ASC. Scale bars are 20 µm. (E) Time-lapse imaging after 488 nm laser illumination of the periderm cells. Top row: ASC-expressing cell forming a speck (t=8 mins). Bottom row: morphology of the dying cell in bright field. Within a minute of speck formation, the cell changes morphology and is extruded. All bright field images are at the plane of the periderm cells; fluorescent images are z-projections 30 planes (z=1 µm). (F) Local activation of Opto-ASC in a single cell. Diagram of periderm showing four cells expressing Opto-ASC and region of optogenetic activation (blue square). The cell with the lowest expression of Opto-ASC was illuminated by 2-photon laser. Only this cell forms a speck.
Figure 1—figure supplement 1
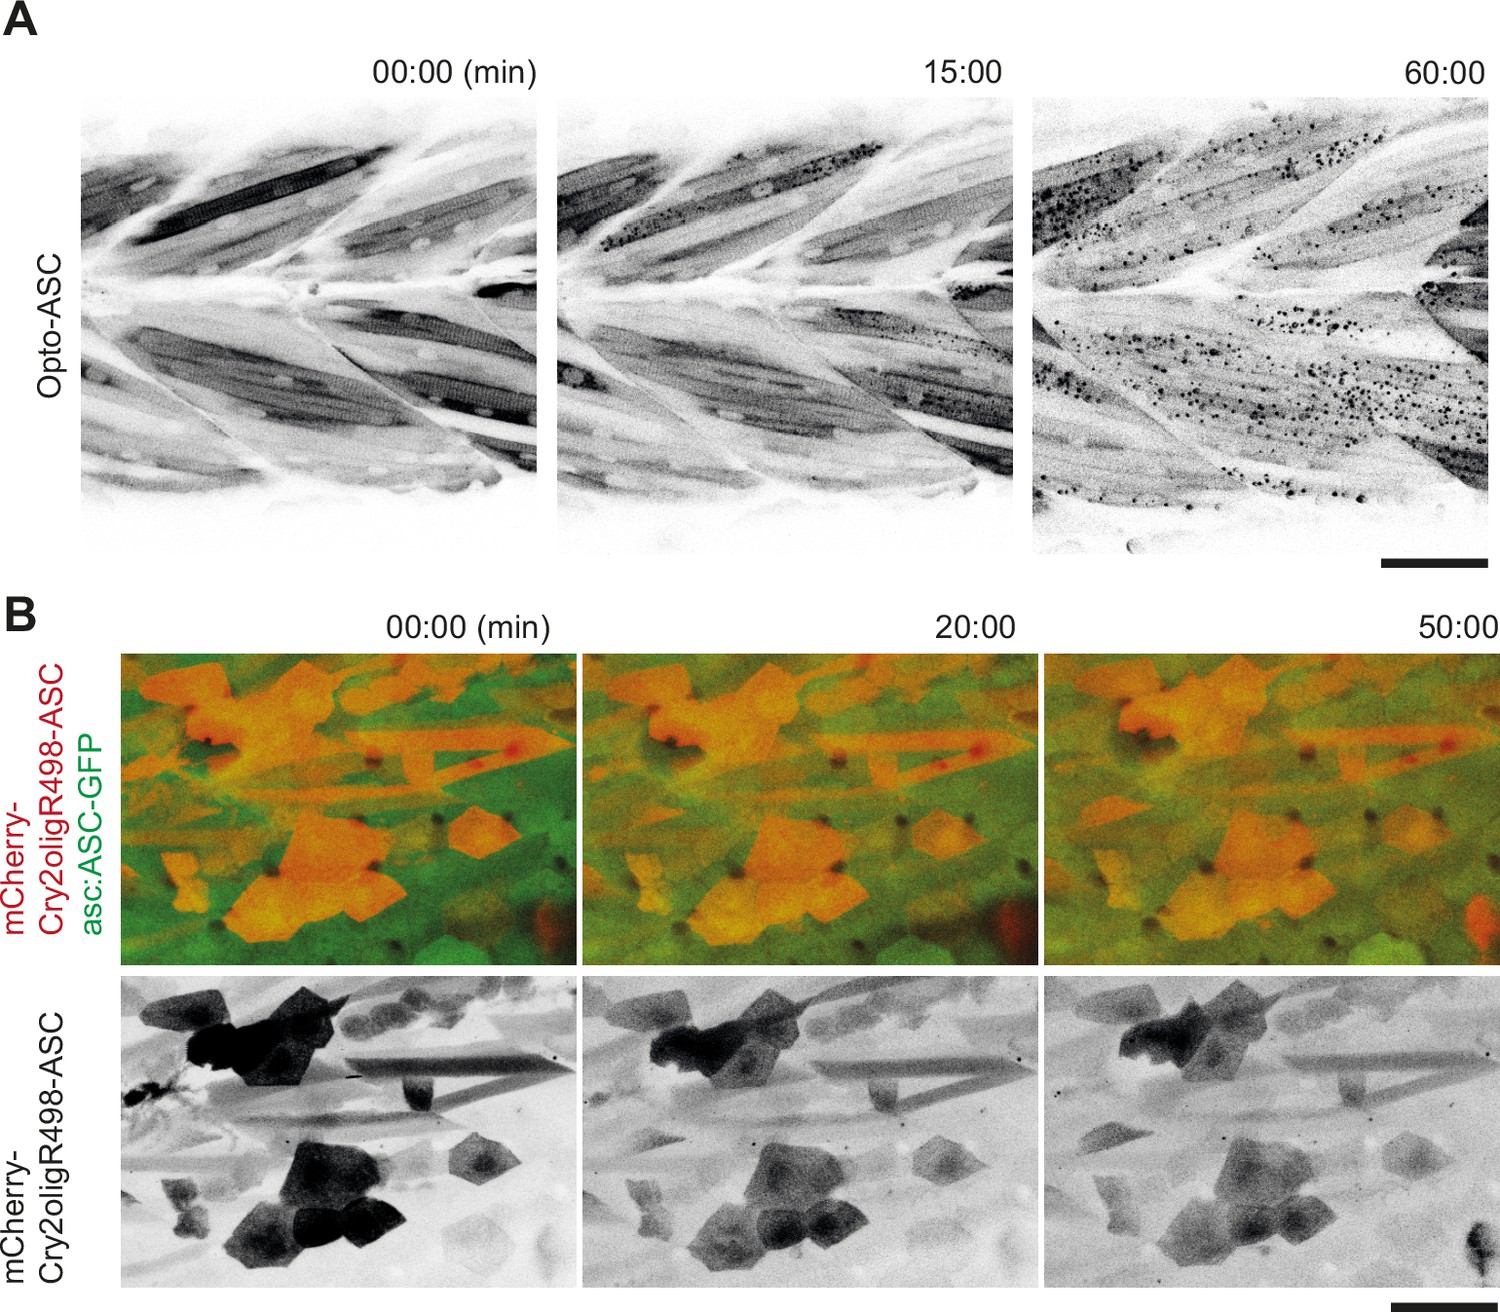
Control experiments for speck formation in muscle cells with Opto-ASC and with mutated Cry2olig in periderm cells.
(A) Opto-ASC Tg(mCherry-Cry2olig-asc) specks induced by blue light (488 nm) in muscle cells in 3dpf larva. Multiple oligomers are formed by the end of the movie (60 mins). Opto-ASC is in black. Scale bar is 50 μm. (B) Periderm cells in a 3dpf larva expressing mCherry-Cry2oligR498-ASC (in red). The mutated version of Cry2olig does not form oligomers even after 50 min of constant illumination by blue light (488 nm). Endogenous ASC-GFP in green. Scale bar is 50 μm.
Figure 2
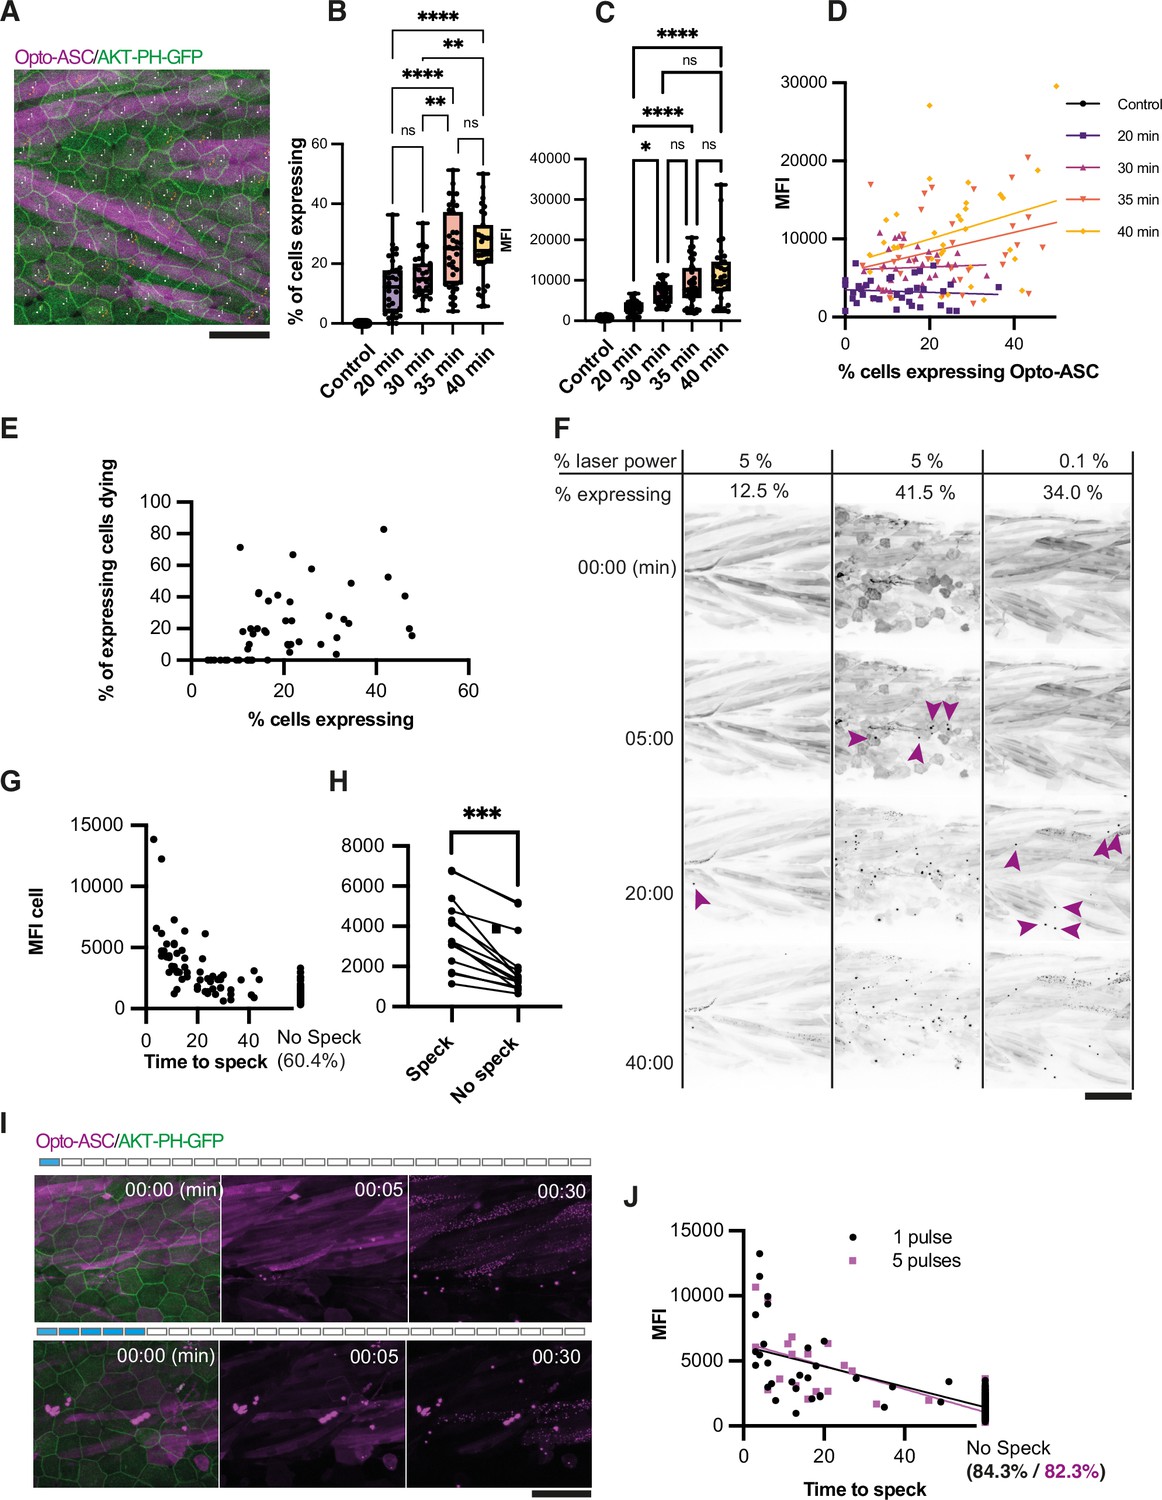
Effect of heat shock and light exposure.
(A) Periderm in a larva expressing Opto-ASC (magenta) and AKT-PH-GFP to mark membranes (green) at 16 hr post heat shock (hrpHS). Cells are individually numbered for subsequent quantification of ASC expression. Opto-ASC in this figure is mainly visible in muscles underlying the epidermis, which are seen in this maximum Z-projection. For quantification of Asc-expressing periderm cells, individual z-planes within the periderm are evaluated. Scale bar: 50 µm (B–D) Dependence of Opto-ASC expression on heat-shock protocol. (B) Percentage of Opto-ASC expressing cells and (C). overall mean fluorescence intensity (MFI, measured on max projections) in larvae heat-shocked for different time periods (N>29 for each condition; each dot represents one larva). (D) Correlation between percentage of Opto-ASC-expressing cells and overall MFI for all larvae for each condition measured in B (N=136/>29 per condition). (E) Correlation between the percentage of Opto-ASC expressing cells and the number of expressing cells dying within 60 min (N=47 movies; each dot one larva); all movies at 1 min frame rate, 5% relative laser power. (F) Examples of larvae expressing Opto-ASC after exposure to 488 laser light at different laser powers. The number of Opto-ASC expressing periderm cells (shown as % positive cells) does not correlate strictly with the level of laser power, nor does the expression level in the underlying muscles. If a sufficient number of periderm cells are positive, specks are formed even at low laser power. First appearance of specks is indicated by magenta arrows. (G) Correlation between MFI of Opto-ASC in single cells and the time from beginning of 488 laser light exposure to speck formation. Cells were followed for 60 min; 60.4% of the cells had not formed a speck at this time. N=156 cells from 14 different larvae. (H) Comparison of average MFI between Opto-ASC expressing cells in individual larvae that form and do not form a speck within 60 min (N=15 individual larvae). The values representing the average MFI for speck-forming and non-speck-forming cells for each larva are connected by a line; p<0.001. (I) Time lapse of Opto-ASC expressing larva exposed to a single or to 5 laser light pulses (1 or 5 frames acquired with 488 laser light). Scale bar is 50 µm. (J) Correlation between MFI of single cells and onset of speck formation in cells exposed to either 1 (red circles) or 5 (black outlined squares) pulses of 488 laser light. Cells were followed for 60 min. N=164 cells in 9 larvae for 1 pulse, N=86 cells in 5 larvae for 5 pulses.
Figure 3 with 1 supplement
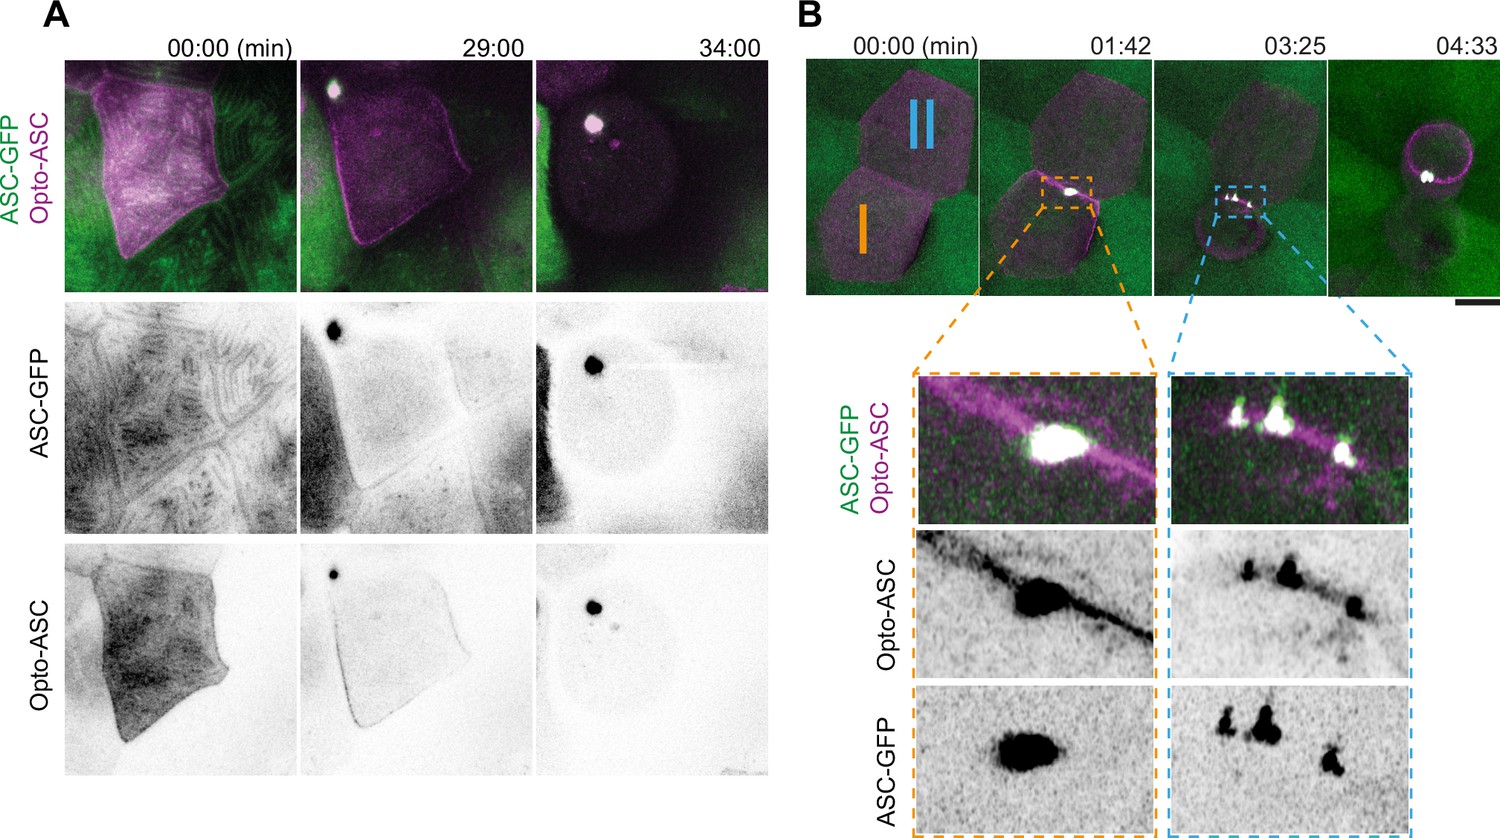
Speck formation dynamics of Opto-ASC and recruitment of endogenous ASC.
(A) Time lapse of speck formation induced by Opto-ASC (magenta) and recruitment of endogenous ASC (green, ubiquitous) in a periderm cells. Scale is 10 µm. (B) Two neighboring cells (I and II) forming either a single speck (cell I) or multiple specks (cell II) along the cell membrane. The specks coalesce as the cell shrinks. Scale is 2 µm.
Figure 3—figure supplement 1
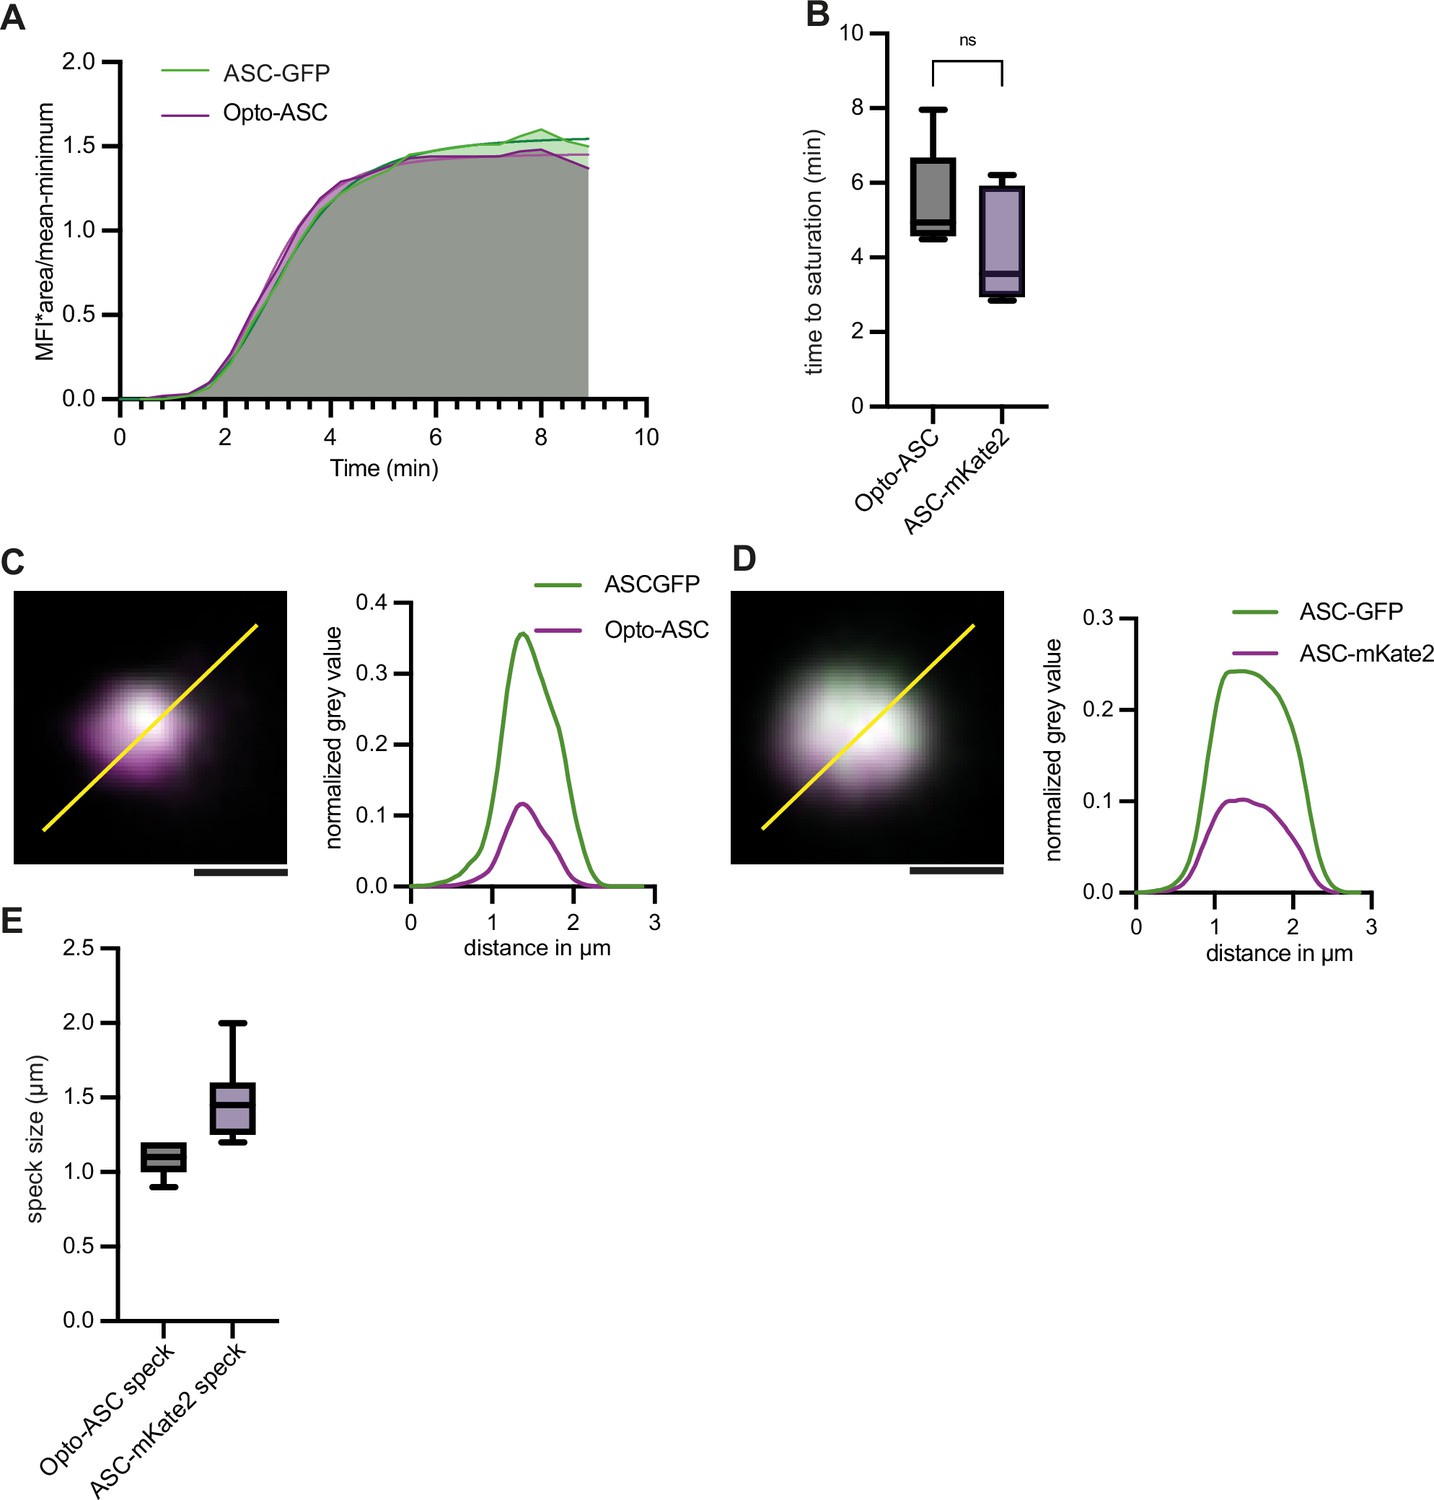
Recruitment dynamics in Opto-ASC specks and ASC-mKate2 specks.
(A) Recruitment dynamics of endogenous ASC (ASC-GFP) and Opto-ASC to a speck induced by blue light (488 nm). MFI was measured for GFP and mCherry at each time point over the entire area of the growing specks. Representative curve for 10 specks measured in three different larvae. (B) Recruitment of ASC-mKate2 and Opto-ASC in ASC-mKate2 specks and Opto-ASC specks. MFI of mKate2 and mCherry was measured at each point over the entire area of the growing speck and the time point at which the MFI value was constant was recorded. (C) Overlap of Opto-ASC (magenta) and endogenous ASC-GFP in light-induced speck at high resolution (Airyscan image acquired by Zeiss LSM 880). (D) Overlap of ASC-mKate2 (magenta) speck with endogenous ASC (GFP). The line ROI is drawn across the two specks and the normalized grey values are plotted along the line ROI. The distribution of the endogenously tagged Opto-ASC with ASC-GFP is uniform similar to that of the speck of ASC-mKate2 and ASC-GFP. (E) Comparison of diameter (in μm) of Opto-ASC specks (=11) and ASC-mKate2 specks (n=8).
Figure 4
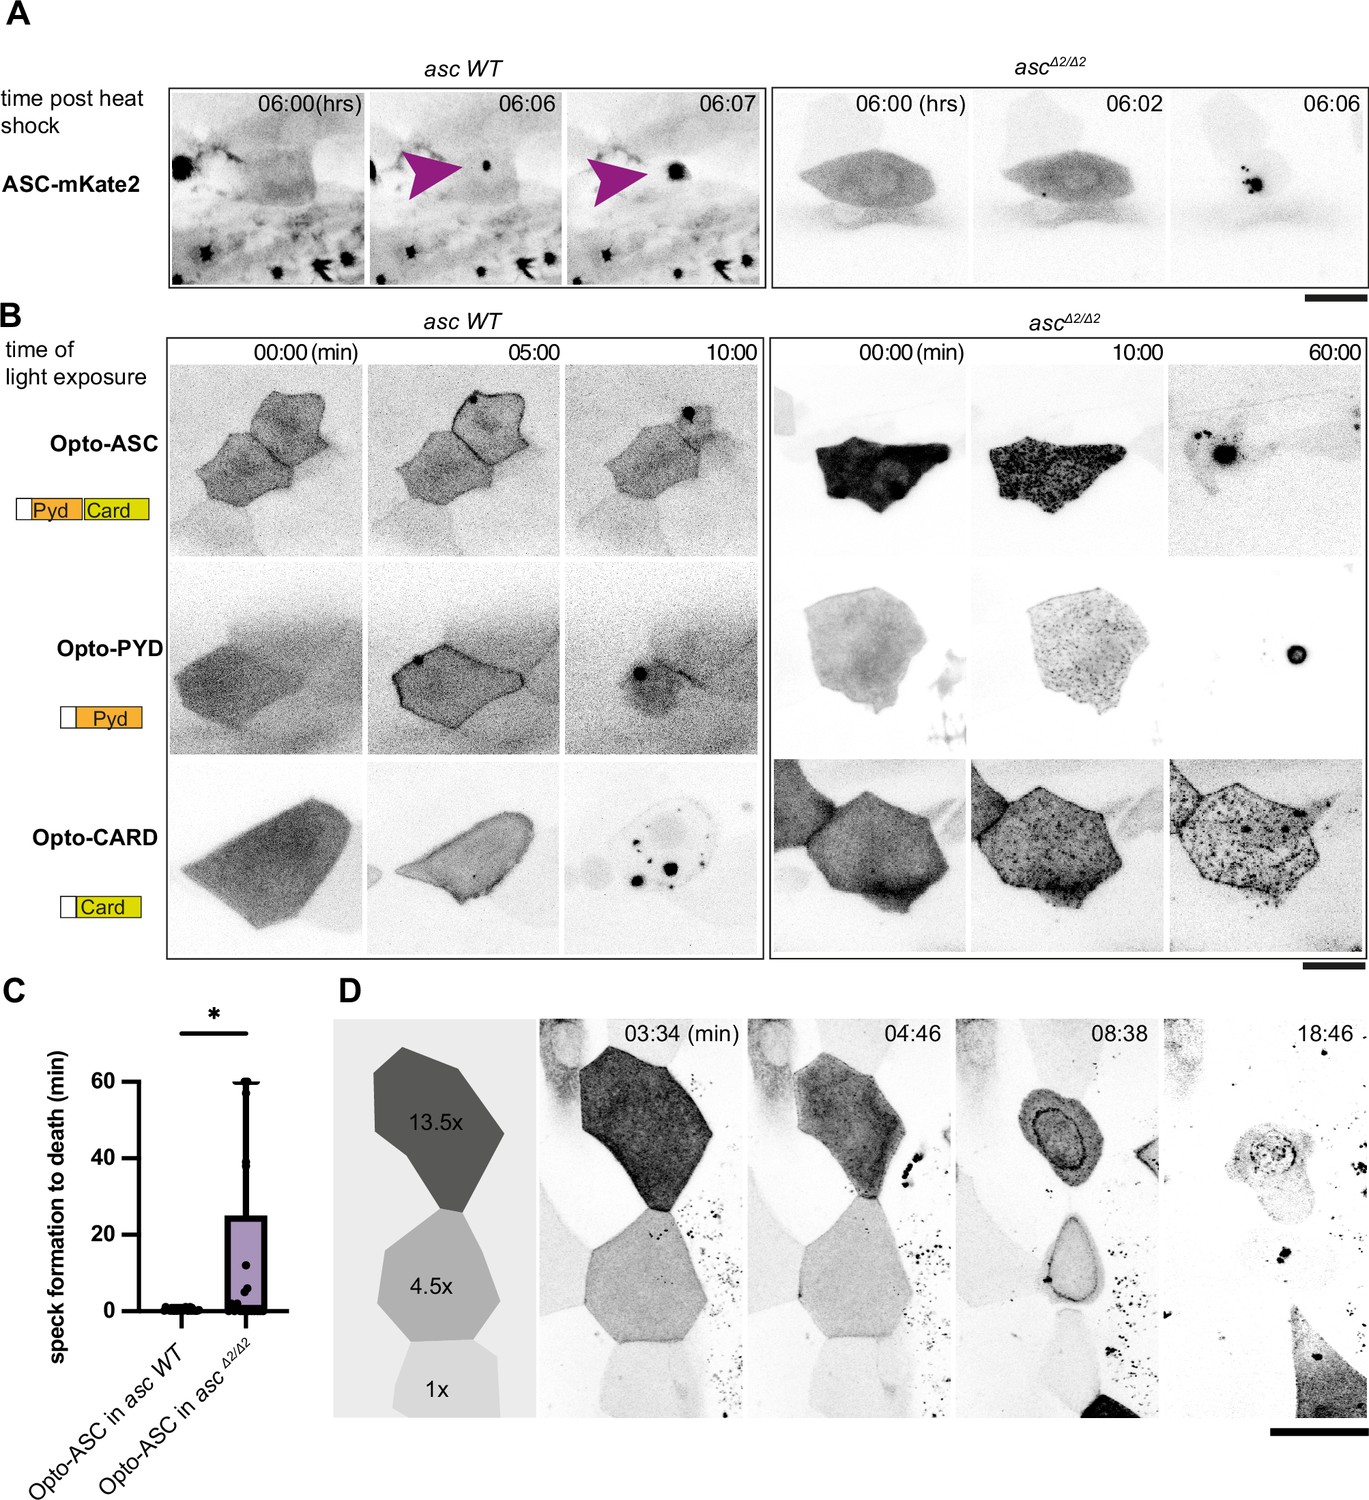
Opto-ASC speck formation and dependence on endogenous ASC.
(A, B) Speck formation induced by ASC-mKate2, Opto-ASC, Opto-PYD and Opto-CARD in wildtype larvae and ascΔ2/Δ2 larvae. Scale bar is 20 µm. (A) Time for ASC-induced specks is counted from end of heat shock. Purple arrow heads mark the speck in the cell of interest. Specks formed by surrounding cells can be seen as black spots. (B) Time is in min counted from the last timepoint before visible speck formation. (C) Time is measured between first detectable appearance of a speck and first morphological sign of cell death (deformation of cell) in wildtype (N=23) and ascΔ2/Δ2 (N=14) larvae. *=p < 0.05. (D) Dynamics of speck formation in three cells with different expression levels of Opto-PYD. Relative intensity levels shown in the diagram on the left are measured in relation to the cell with the lowest level (1x) after background subtraction. Time is measured in minutes; scale bar is 20 µm.
Figure 5
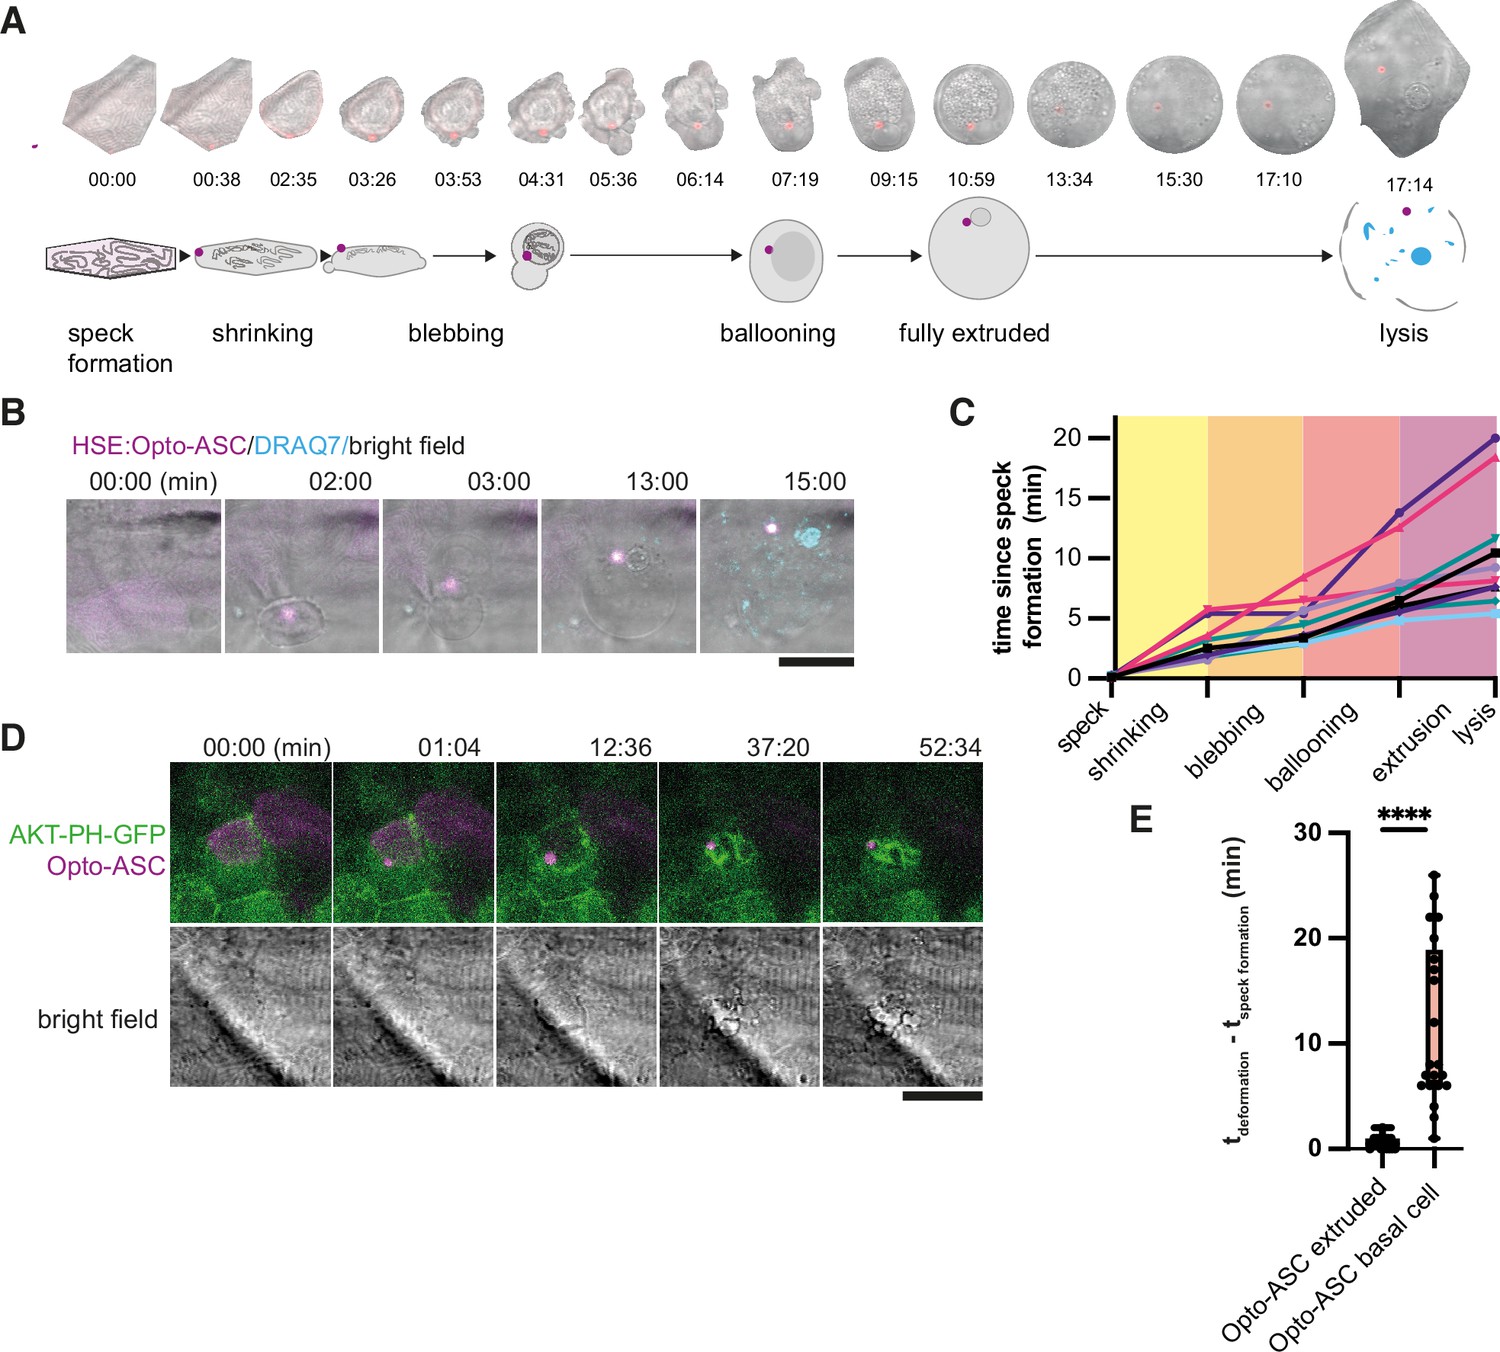
Stages of ASC-speck-induced e extrusion from the periderm.
(A) Example of a single cell from a bright-field movie (top) and a schematic showing stages of periderm cell extrusion and lysis after speck formation (bottom). (B) DRAQ7 staining of a cell that lyses after the full extrusion from the periderm. Scale bar is 20 µm. (C) Time lines for 10 periderm cells undergoing the steps of cell extrusion described in A. Time is in minutes. (D) Basal cell dying after formation of an Opto-ASC-speck (magenta). Cell membrane is labeled by AKT-PH-GFP (green). (E) Time between Opto-ASC speck formation and the appearance of first morphological signs of cell death (deformation of cell) in periderm (N=49) and basal cells (N=20). ****=p < 0.0001.
Figure 6 with 3 supplements
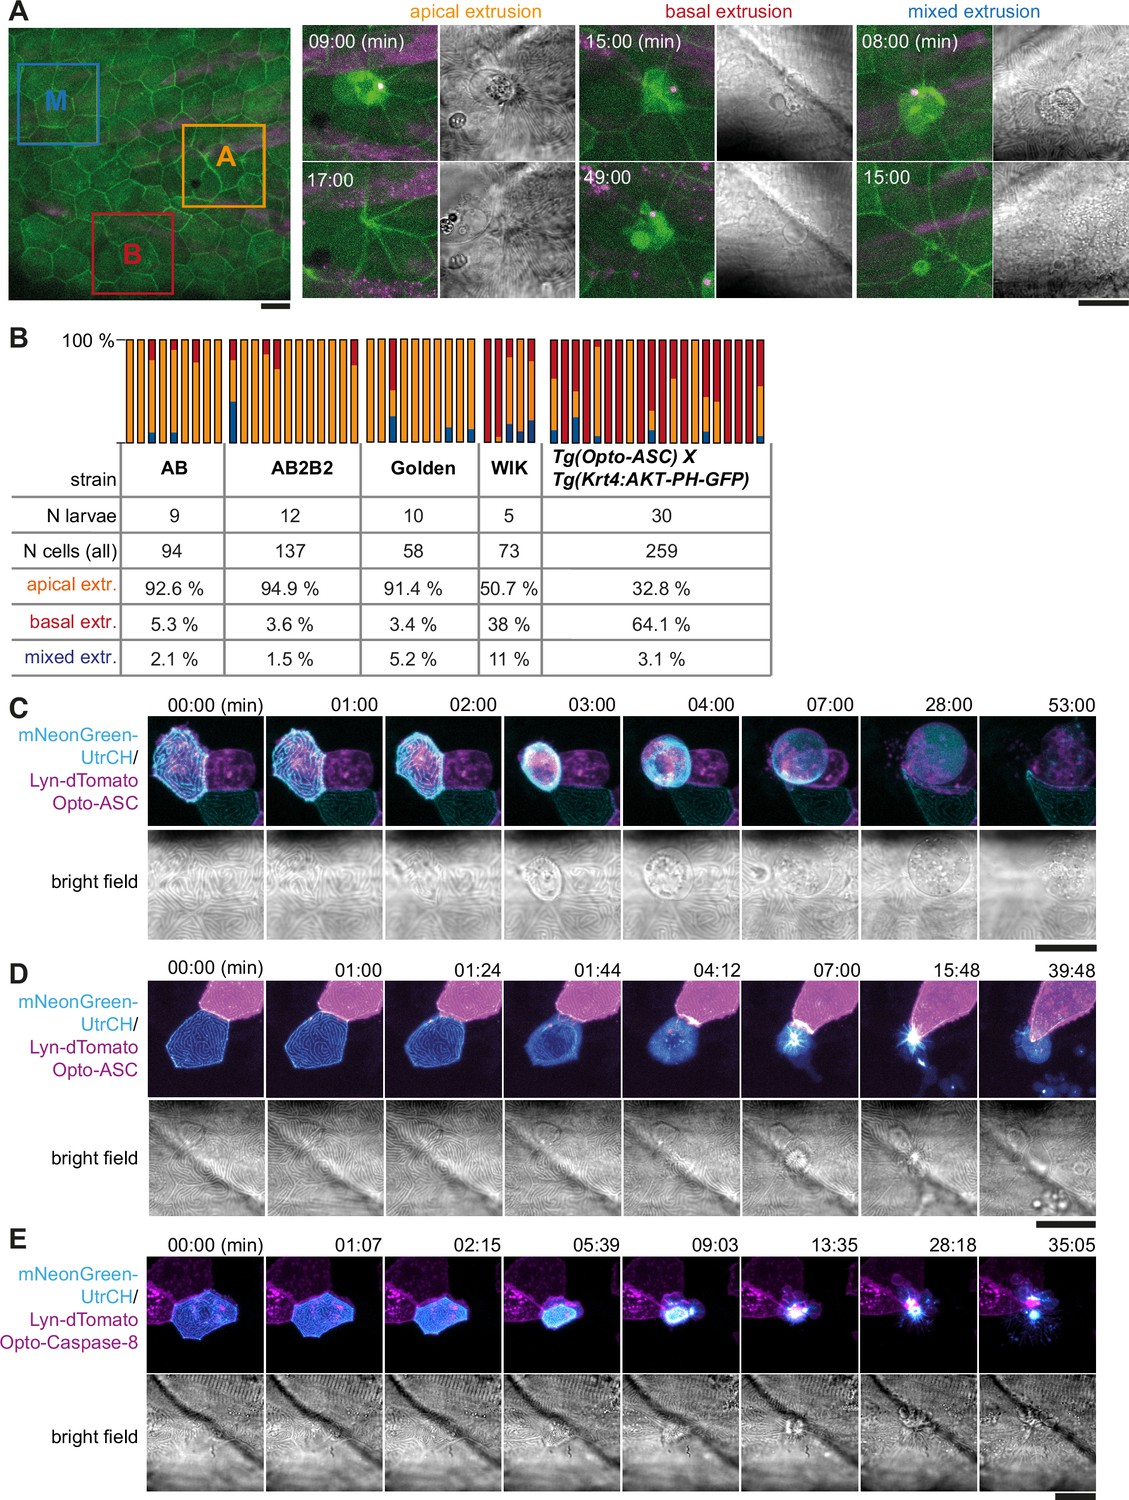
Apical and basal extrusion during Opto-ASC induced cell death.
(A) Examples of responses to Opto-ASC (magenta) speck formation in three periderm cells within the same larva (marked by blue, orange and red squares in the overview image); cell borders marked by AKT-PH-GFP, green. Dying periderm cells can be extruded apically (orange), basally (blue) or in both directions (red). (B) Percentage of periderm cells extruded either apically, basally or in both directions (mixed) after Opto-ASC speck formation in different Danio rerio laboratory strains and transgenic Tg(Opto-asc X Krt4:Akt-PH-GFP) larvae. Each bar represents one larva, the y-axis shows what fraction of cells undergoes which type of extrusion. (C–D) Response of the actin cytoskeleton in cells that are apically (C) or basally (D) extruded after formation of an ASC speck (magenta) shown as z-projections. Actin is labeled using mosaic expression of mNeonGreen-UtrCH (cyan). The apical cortical actin ridges can also be seen in bright field images. Membranes of cells are mosaically labeled by expression of lyn-tagRFP (also magenta). (E) Actin response to Opto-Caspase-8-induced apoptosis in periderm cells; actin in the dying cell is in cyan (mNeonGreen-UtrCH). Membranes of cells are mosaically labeled by lyn-tagRFP (also magenta). Scale bars in all images are 20 µm.
Figure 6—figure supplement 1
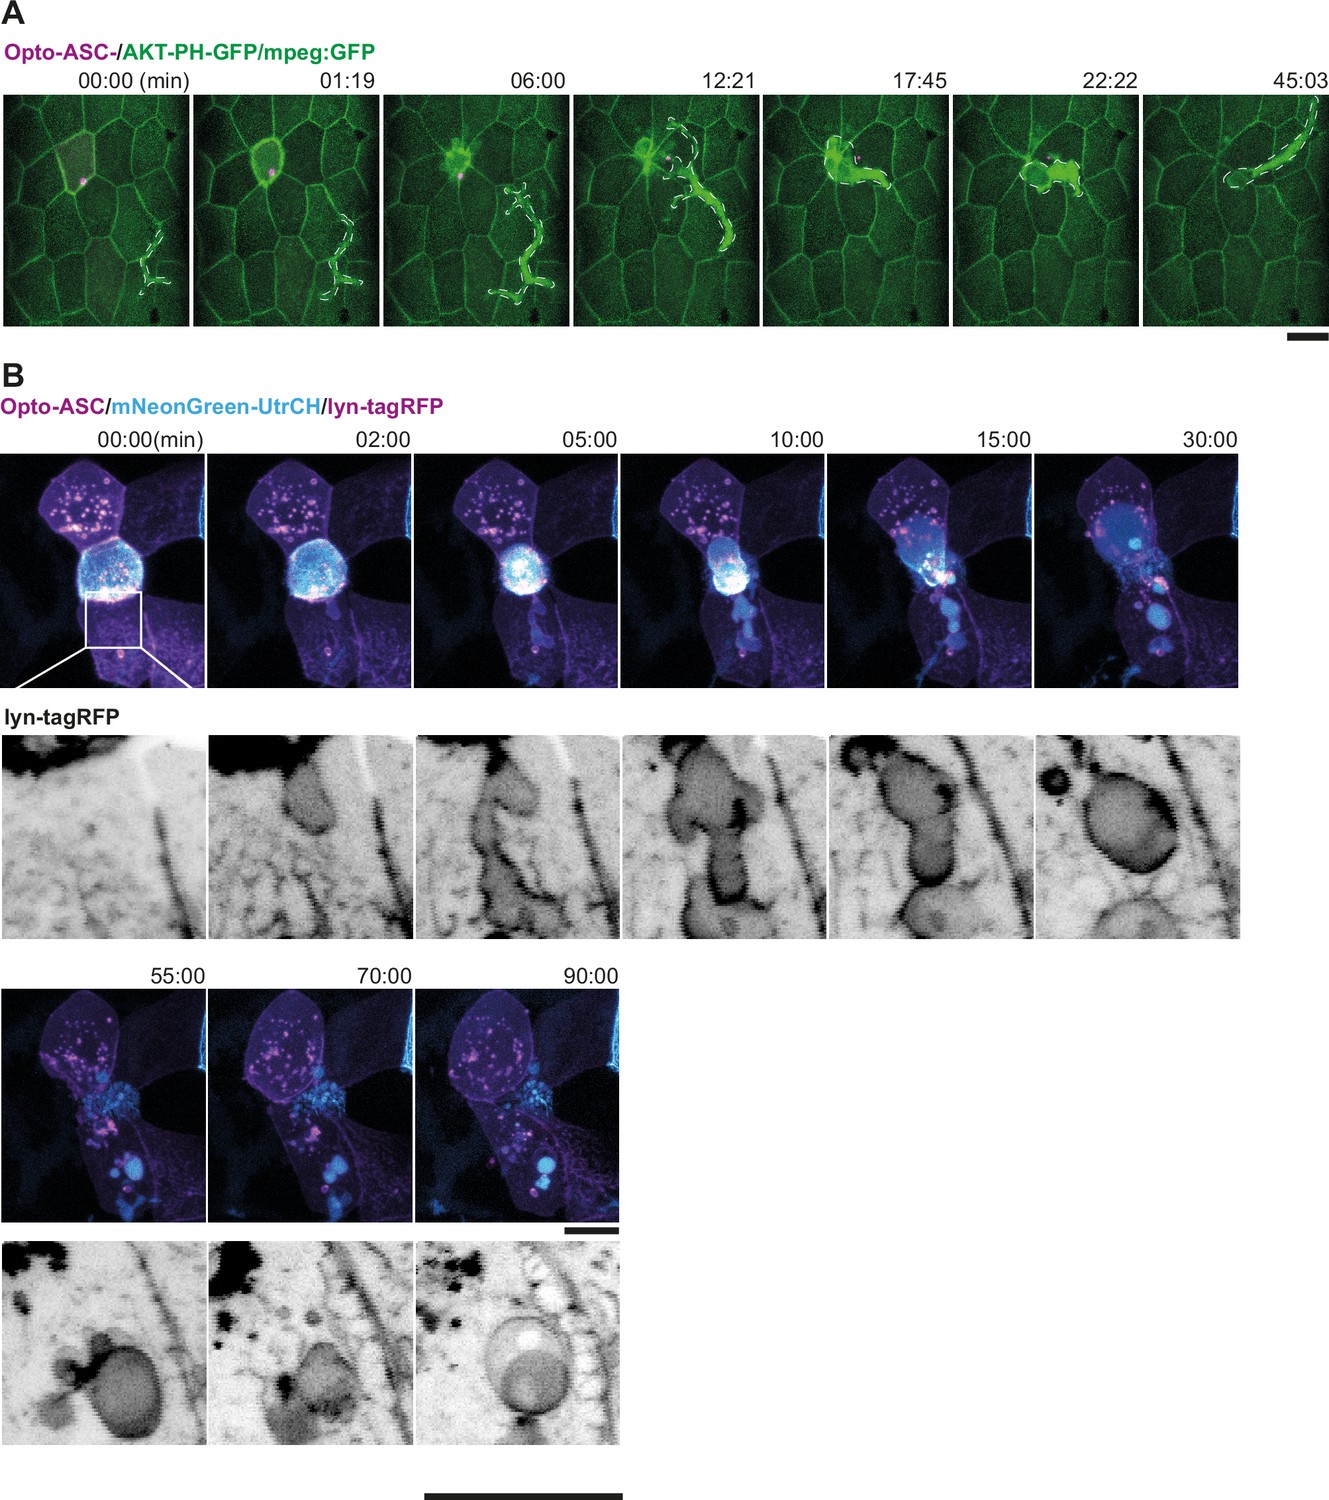
Response of neighbouring cells to cell death after ASC-speck formation.
(A) Response of macrophage to a basally extruded periderm cell (Opto-ASC in magenta). The macrophage (marked in yellow dashed outline) moves towards the dying cell which starts shrinking at 1:19 min, and engulfs the cell completely by 22:22 min. The macrophage is labelled with mpeg-gfp, and the periderm cell membranes with AKT-PH-GFP (both green). The scale bar is 20 µm. (B) Response of the surrounding periderm to a basally extruding periderm cell after Opto-ASC (magenta) speck formation. The white box marks the region of contact between the dying cell and a neighboring periderm cell. The same area is shown at higher magnification below with only the membrane label in grey scale. Blebs start to form as the dying cell disintegrates, and the remaining cell debris appears to be taken up by the surrounding cells. Actin is labelled by mNeonGreen-UtrCH (cyan) and the cell membranes by lyn-tagRFP (magenta).
Figure 6—figure supplement 2
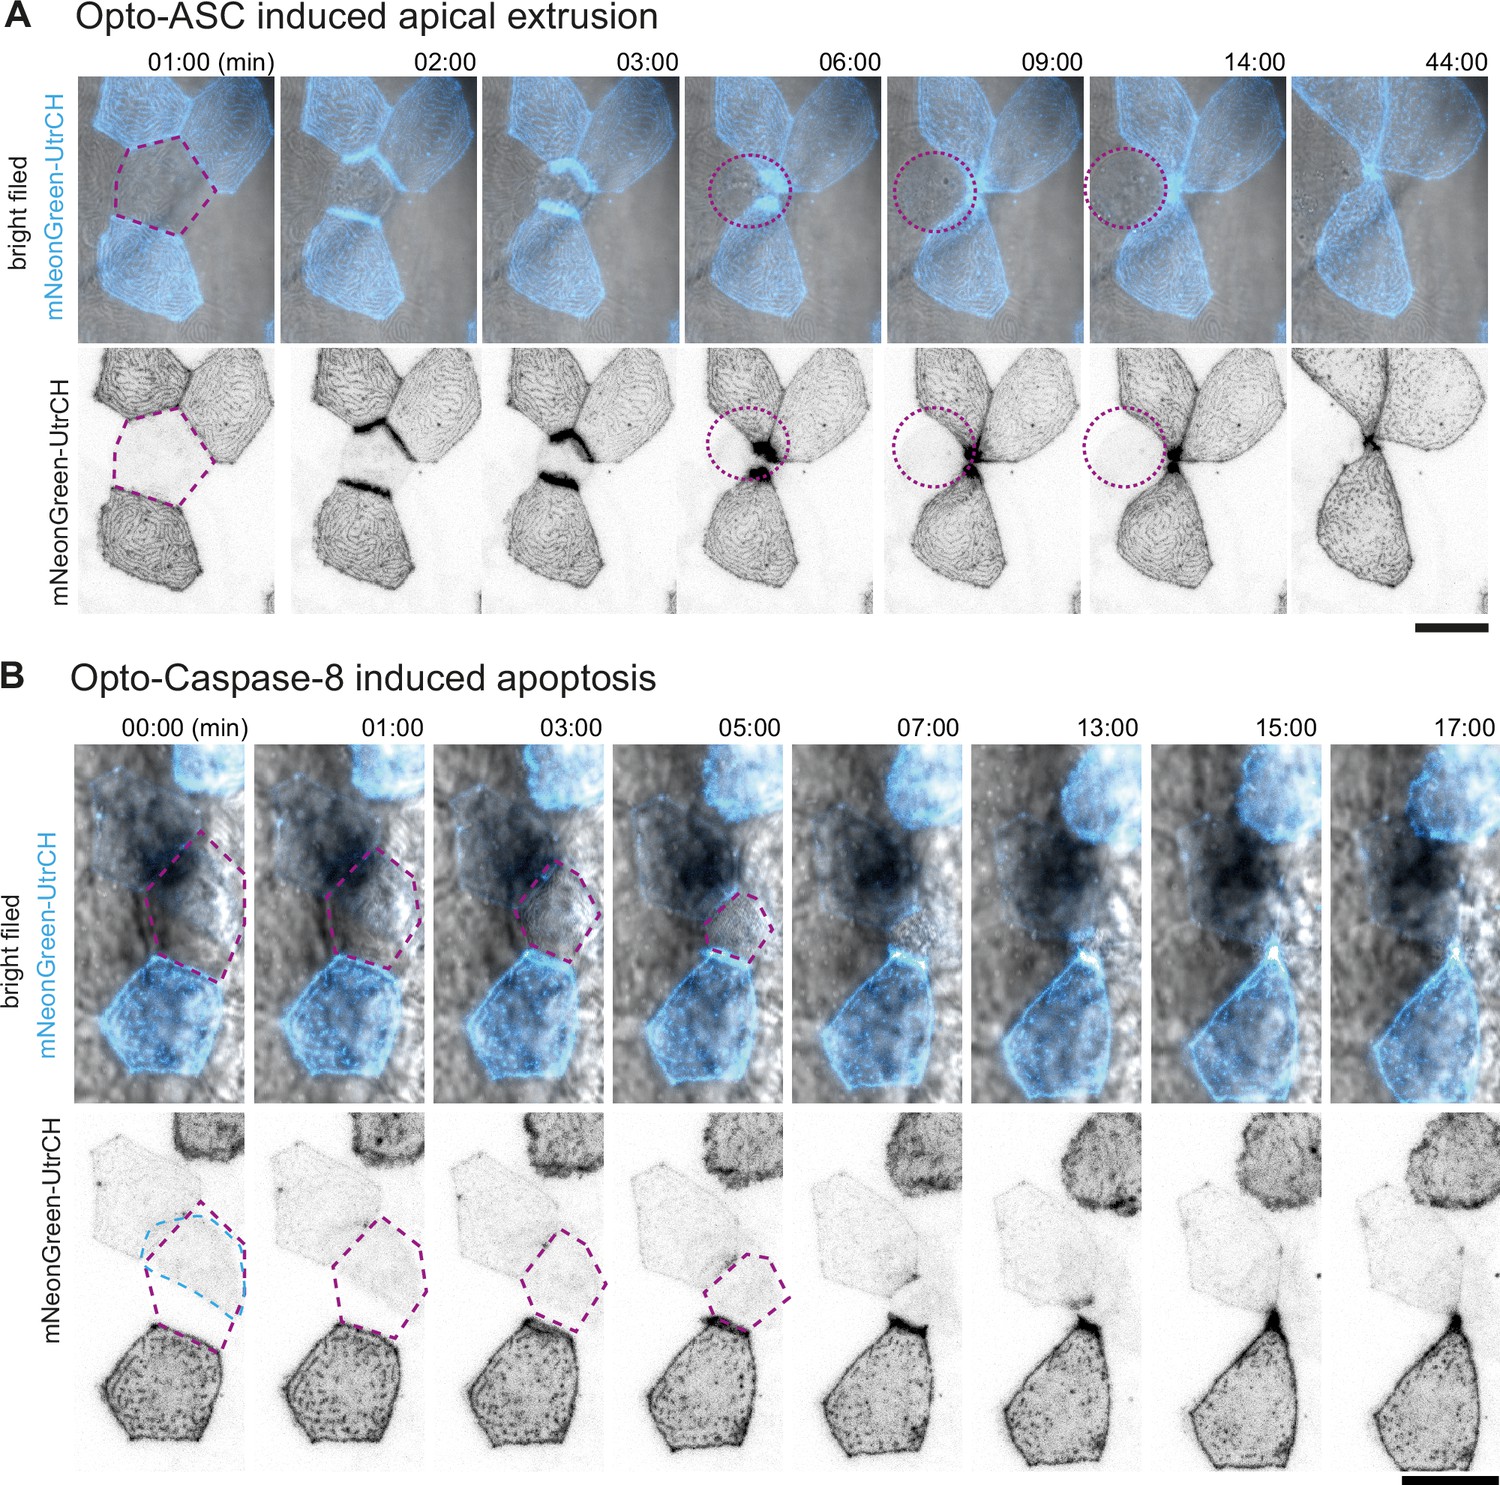
Actin rearrangement in periderm cells near dying cells.
(A, B) Actin, labelled by mNeonGreen-Utr-CH (cyan in top row and black in the bottom row) is expressed in a mosaic pattern. As the surrounding cells close the gap over the dying cells, actin accumulates at the lateral membranes which are in contact with the dying cell. (A) Response of neighboring periderm cells to Opto-ASC induced apical extrusion. Opto-ASC is induced in the periderm cell marked in purple dotted line. (B) Response of neighboring cells to apoptosis induced by Opto-Caspase 8 in the periderm cell marked in purple. This cell does not express mNeonGreen-Utr-CH, but the signal comes from an underlying basal cell (outlined in blue).
Figure 6—figure supplement 3
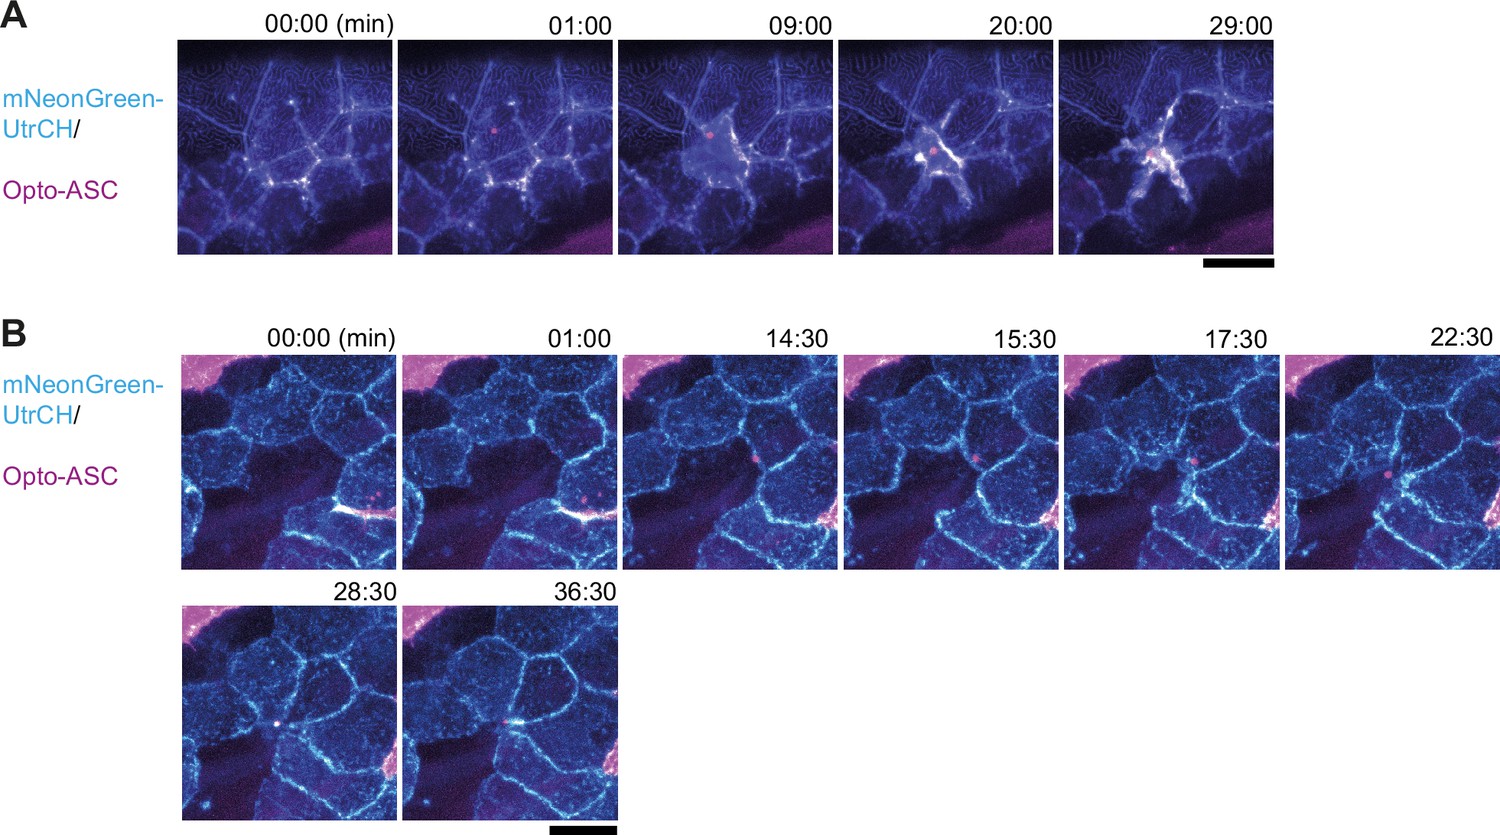
Actin dynamics in neighboring cells after Opto-ASC-induced cell death in basal cells.
(A, B) Tg(Opto-asc) (magenta) was crossed with Tg(UAS:mNG-UtrCH) to label actin (shown in cyan). (A) Opto-ASC is induced in a basal cell. The speck is seen within 1 min. Actin concentrates at the periphery of the dying cell, but it is not clear whether it is in the dying or the neighboring cells. No actin rearrangement is observed in the periderm above the dying basal cell. (B) An Opto-ASC speck is induced in the central basal cell which does not express UAS:mNG-UtrCH. The speck is first seen at 14:30 min. The surrounding cells form lamellipodia that fill in the gap above the dying cell, but no strong actin concentration is seen, indicating that the actin at the periphery of the cell in panel A is the actin of the dying cell. Scale bar: 20 μm.
Figure 7 with 2 supplements
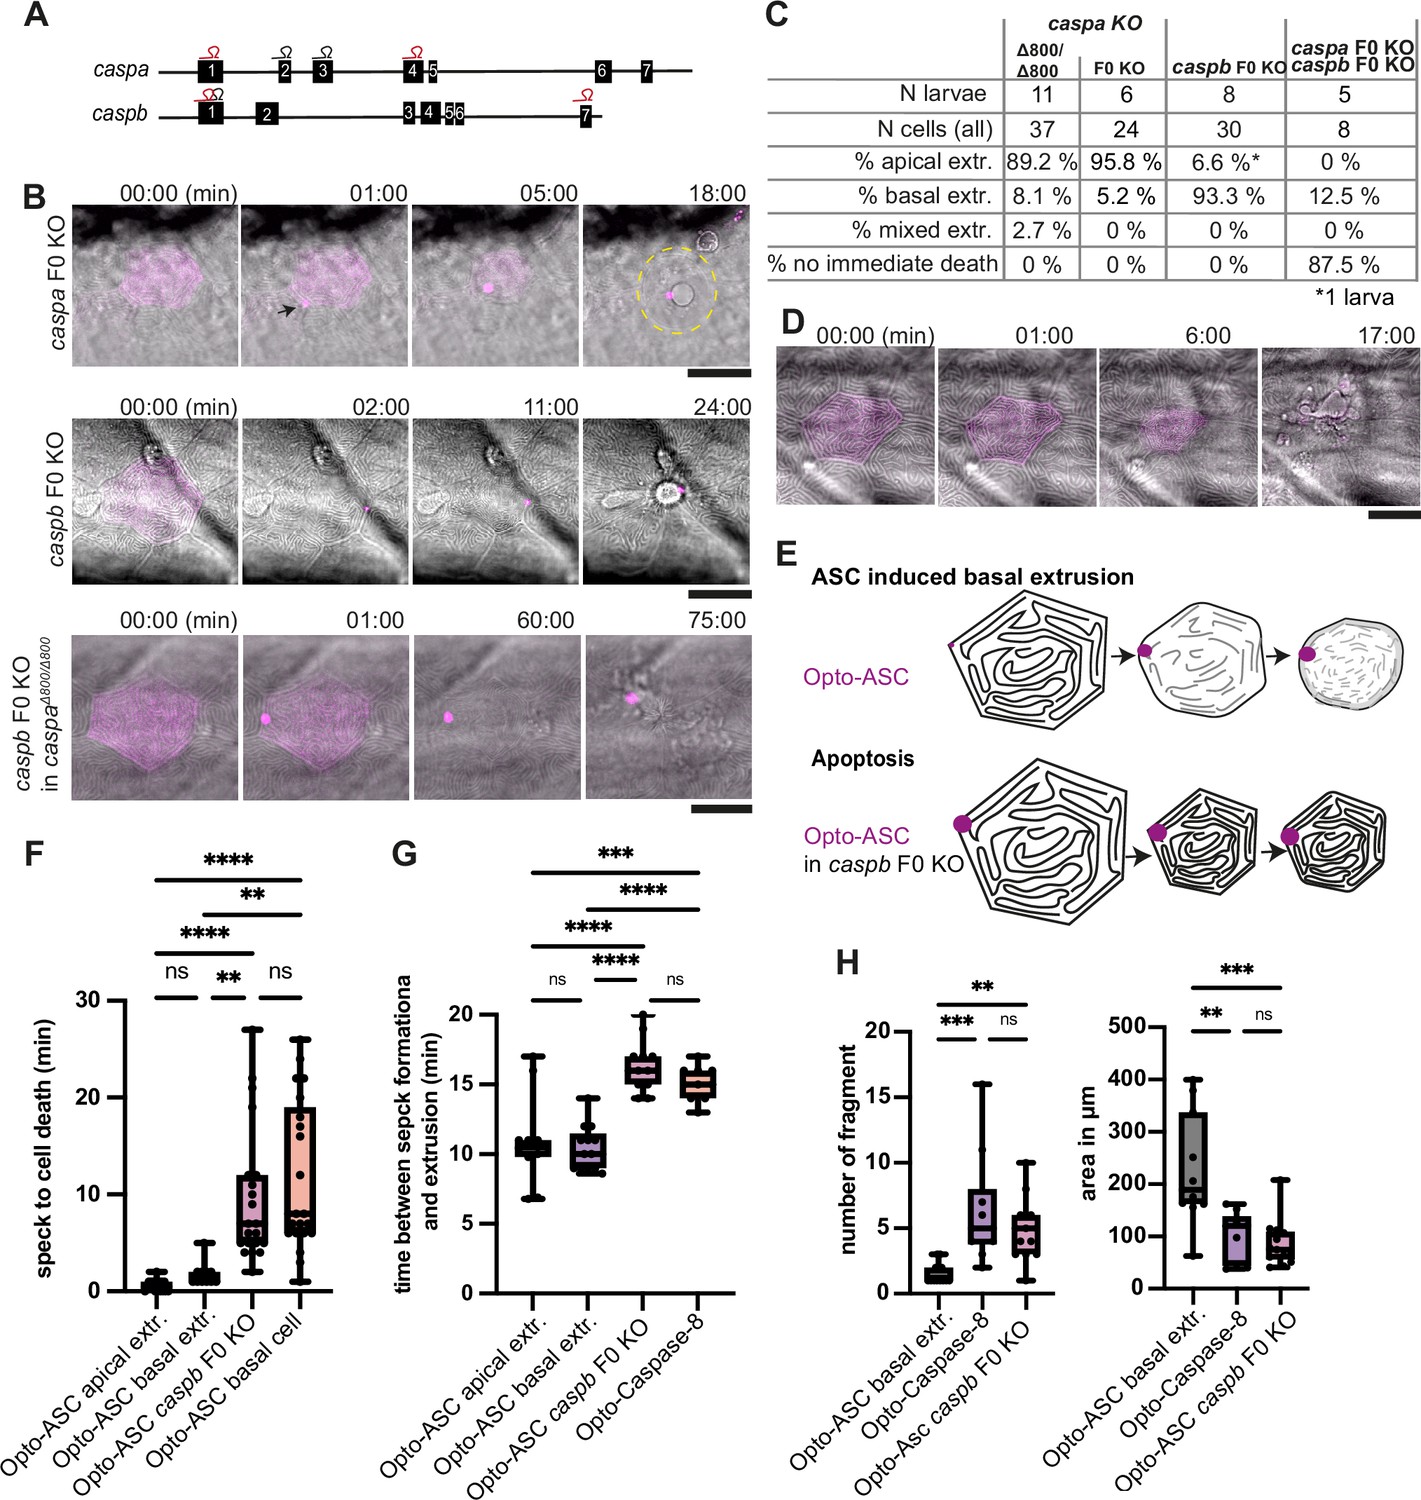
Inflammatory caspases in cell extrusion and rapid cell death after ASC-speck formation.
(A) Schematic of the caspa and caspb genes and sgRNA binding sites for F0 CRISPR/Cas9 knock-outs (F0 KO). (B) Representative responses of periderm cells after speck formation in caspa F0 KO, caspb F0 KO and caspa F0 KO/caspb F0 KO. Scale bar is 20 µm. (C) Percentages of apically extruded and basally extruded cells and cells that do not die within the observation time of >60 min after Opto-ASC speck formation in different F0 KO backgrounds. (D) Periderm cell dying by apoptosis after Opto-Caspase-8 induction; scale bar is 20 µm. (E) Schematic of basally extruding cell after Opto-ASC induction and isomorphic shrinkage as seen in in caspb F0 KO larvae after Opto-ASC induction. (F) Time between Opto-ASC speck formation and first morphological signs of cell death (deformation of cell) in the indicated conditions. (G) Time of gap closure after death of single periderm cells which are either extruded or retained after the indicated treatments. (H) Number of fragments at the time of gap closure and area of the largest cell fragment of retained cells after ASC-Speck formation in WT and caspb F0 KO larvae and of apoptotic cells after Opto-Caspase-8 induction. (F–H) **=p < 0.01, ***=p < 0.001, ****=p < 0.0001.
Figure 7—figure supplement 1
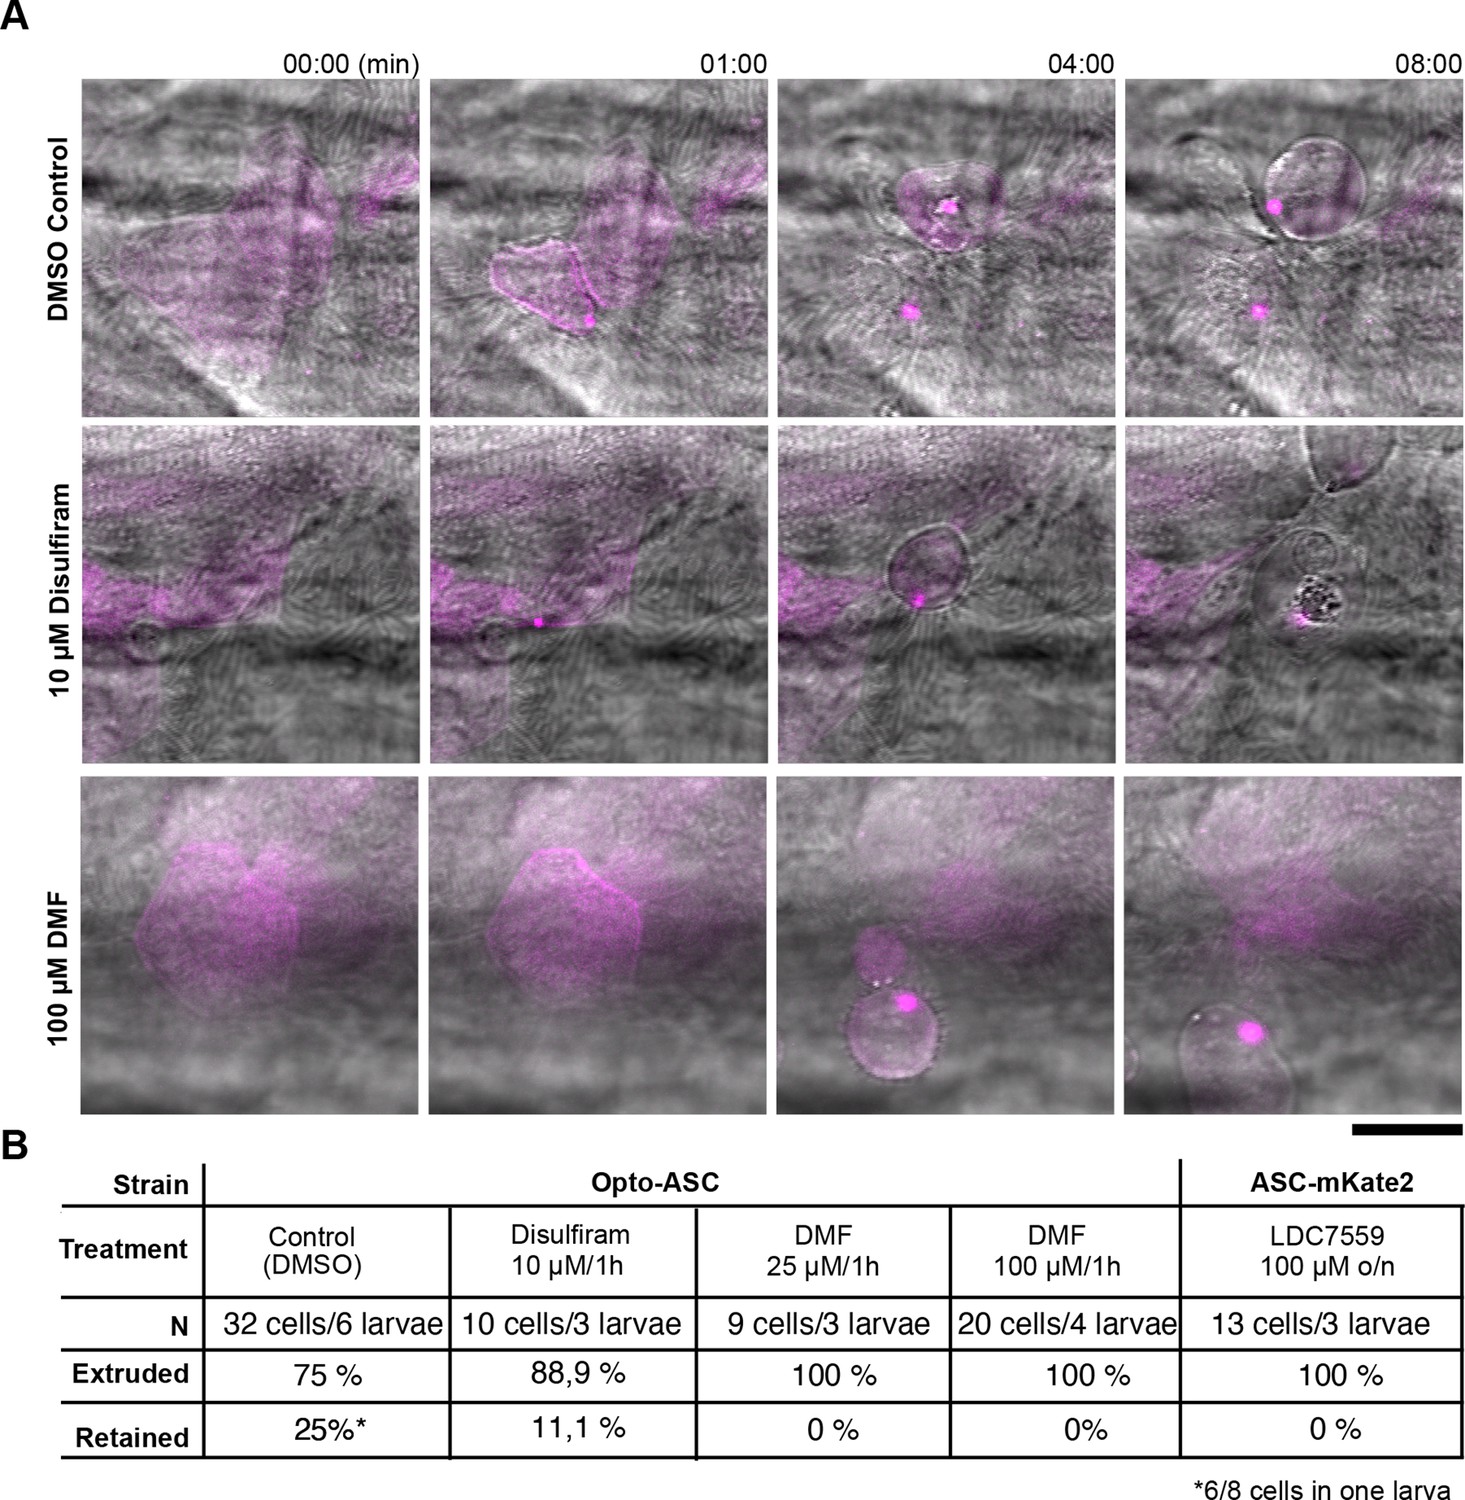
Extrusion of periderm cells after ASC speck formation under treatment with Gasdermin D or pyroptosis inhibitors.
(A) Apically extruded cells after Opto-ASC speck induction in control larvae and larvae treated with 10 µM Disulfiram or 100 µM DMF for 1 hr before and during activation. (B) Fraction of apically or basally extruded cells in Opto-ASC larvae and in ASC-mKate2 larvae after the indicated treatments.
Figure 7—figure supplement 2
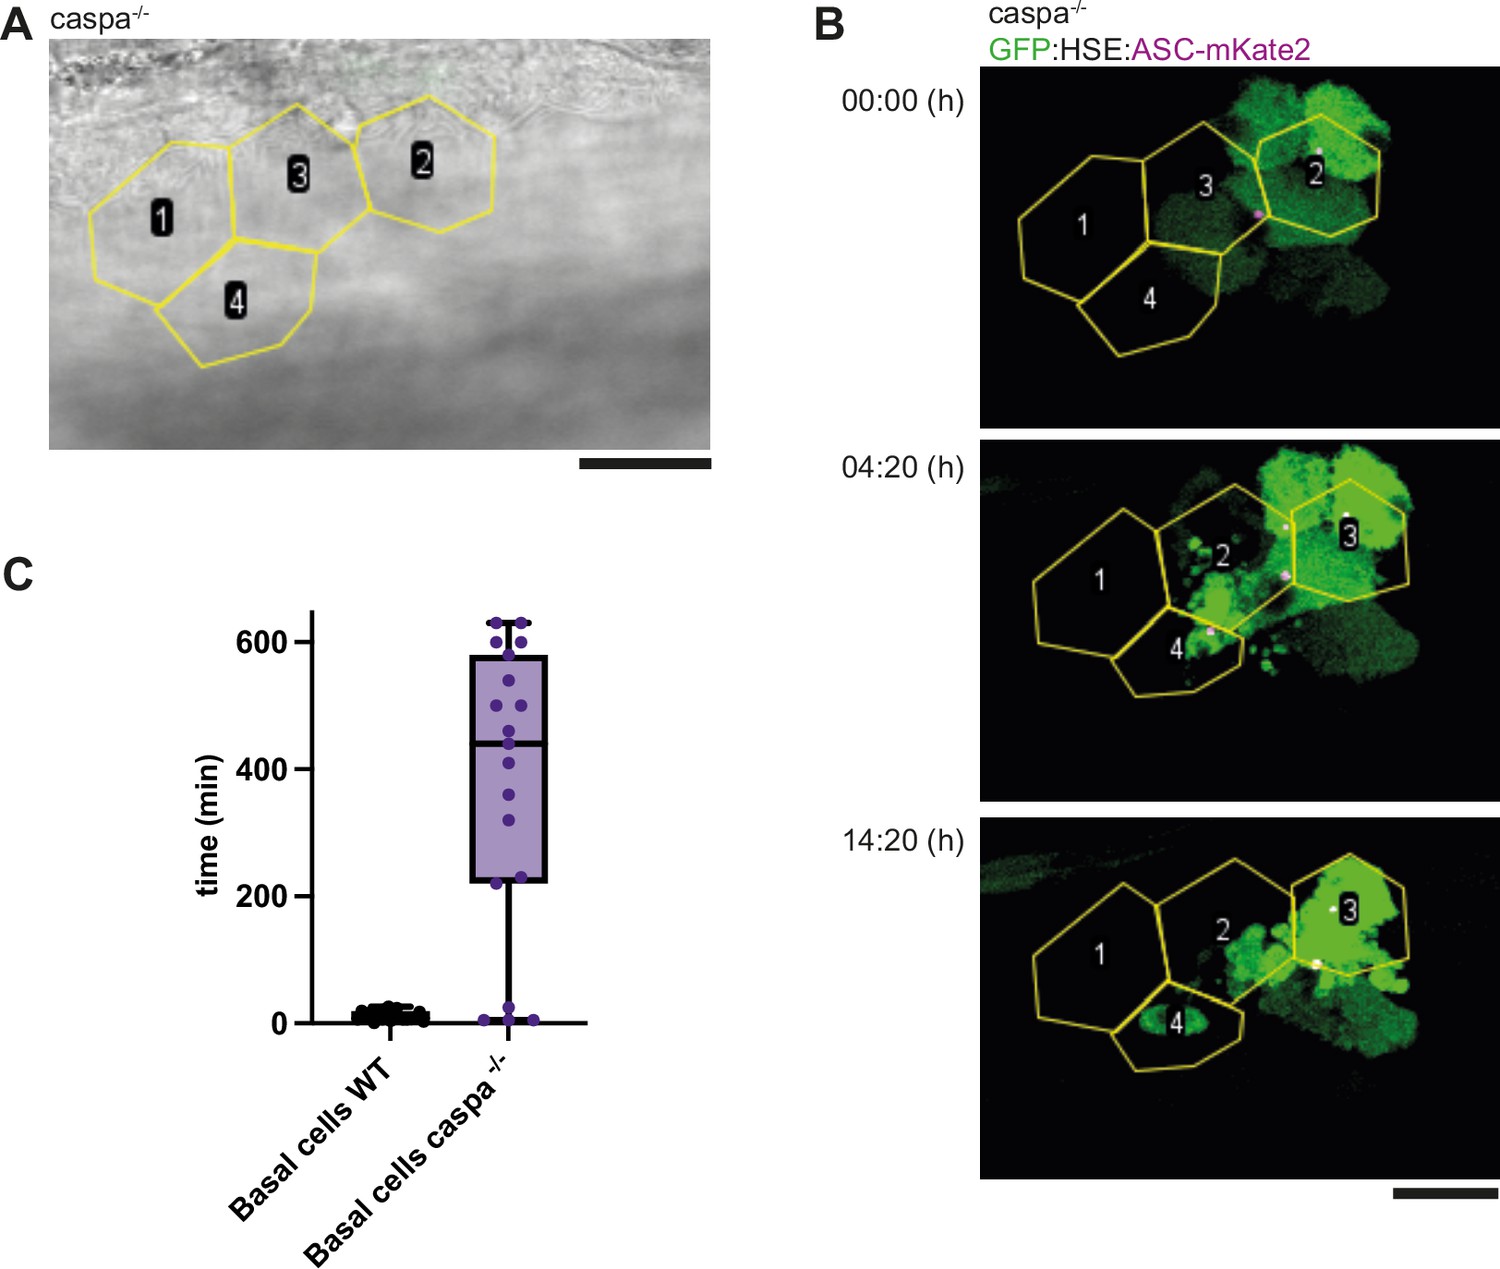
Transient expression of HSE: GFP/ASC-mKate2 in basal cells.
(A) Bright field image of the skin of a caspa-/- larvae showing the outlines of periderm cells (yellow) which were identified by scanning though the z-planes of the stack. Scale bar is 20 µm. (B) Time laps of basal cells transiently expressing HSE: GFP/ASC-mKate2 underlying the periderm cells identified in A and outlines in yellow. GFP is in green, ASC.mKate2 in magenta. Scale bar is 20 µm. (C) Time between speck formation and cell death measure in minutes in basal cells of larvae of the tg(HSE:Opto-Asc) (N=23) lines compared to basal cells in transiently expressing caspa-/- (N=20) larvae.
Figure 8 with 2 supplements
Ca2+ signaling in epithelial cells in response to dying cells.
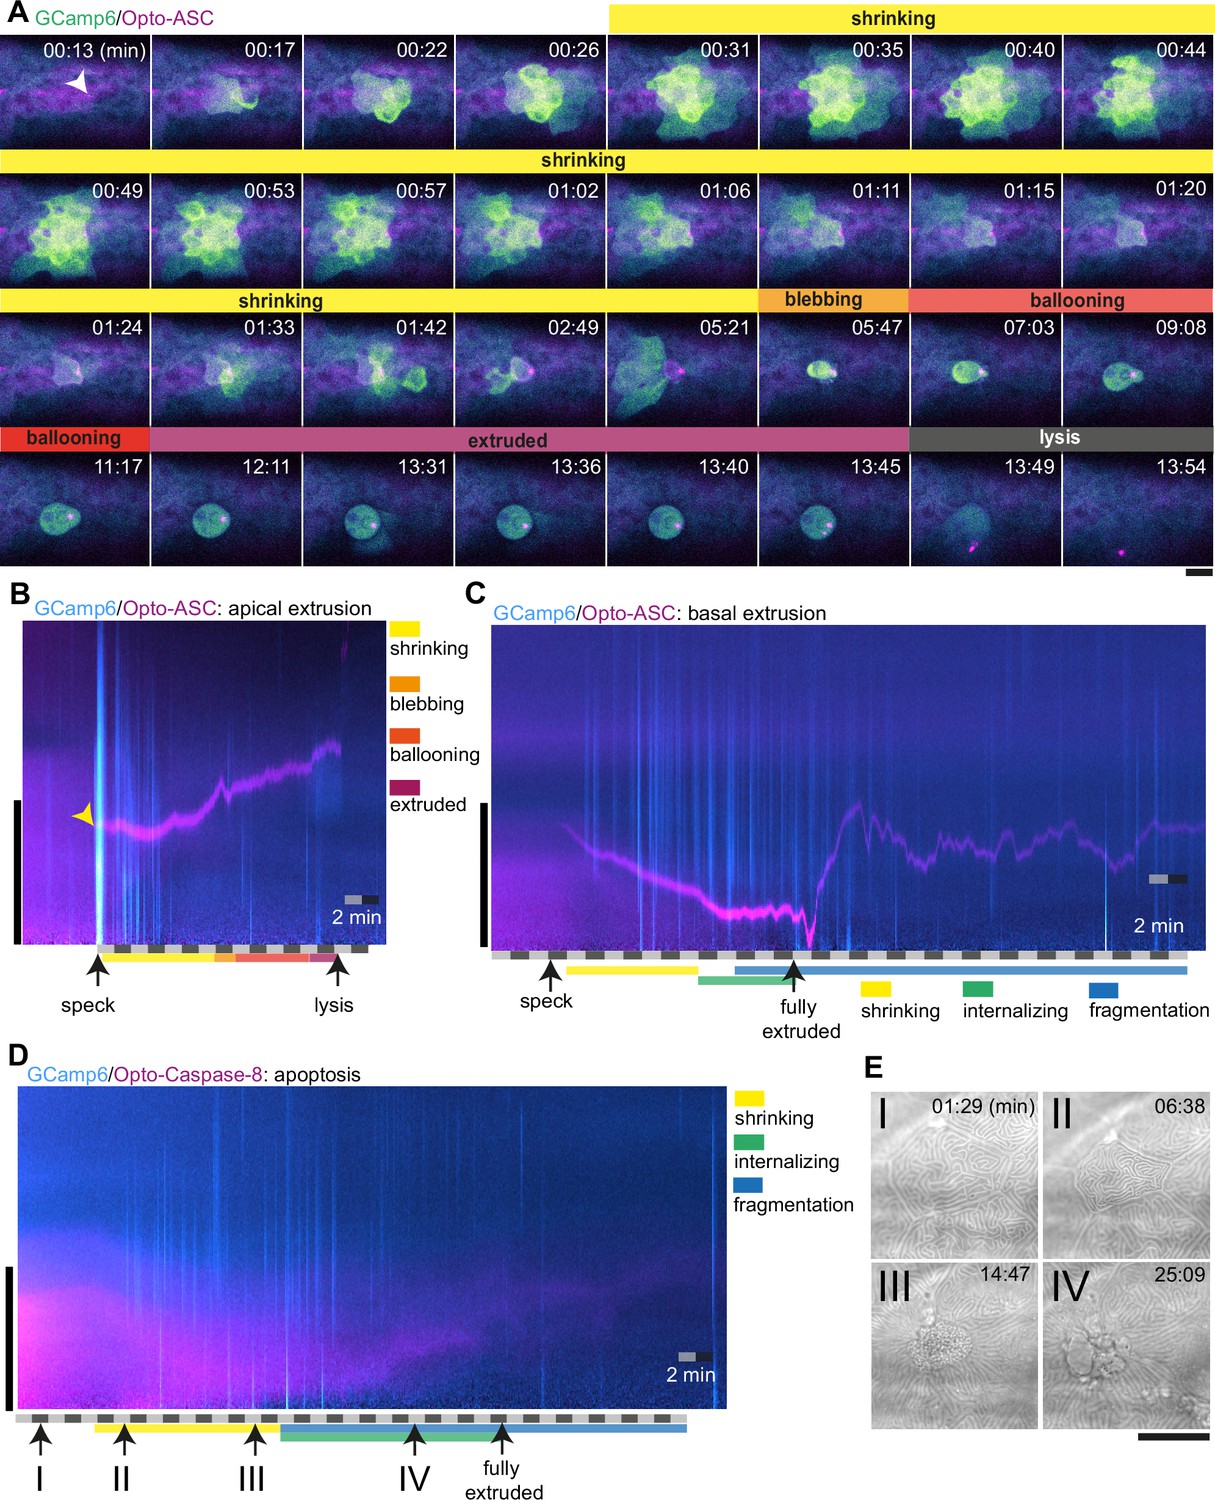
(A) Example of Ca2+ signaling in epithelial cells surrounding a cell forming an Opto-ASC speck (yellow arrow head) and being extruded from the tissue. Frames from a time-lapse image sequence of a larva expressing GCamp6 (light green) and Opto-ASC (magenta). Phases of the extrusion were characterized using the bright field channel, as described in Figure 5 and are color coded (yellow-black). Scale bar is 20 µm. (B–D) Two-dimensional representation in time and space (derived from 3D kymographs) of the Ca2+ response to cell death in the larval epidermis. The y-axis shows the radial space around the dying cell, as described in Figure 8—figure supplement 1. GCamp6 Ca2+ sensor signal intensity is shown in cyan and Opto-ASC in magenta. The scale bar on the y-axis is 20 µm. Time is marked along the x-axis in 2 min blocks. (B) Ca2+ signaling response to Opto-ASC-induced apical extrusion as shown in A. The phases of extrusion are color coded (yellow to dark red) as in panel A and Figure 5C. (C) Opto-ASC-induced cell death with basal extrusion. Phases of extrusion marked along the x-axis. (D) Opto-Caspase-8 (magenta)-induced apoptosis. Numbers on the x-axis refers to the images in E. (E) Bright field images of the cell analyzed in D illustrating stages of apoptotic cell death. I: Cell morphology before the first signs of cell death; II: isomorphic shrinkage of cell; III: microridge pattern has dissolved and cell starts to internalize; IV: cell has started to fragment. Scale bar in all images is 20 µm.
Figure 8—figure supplement 1
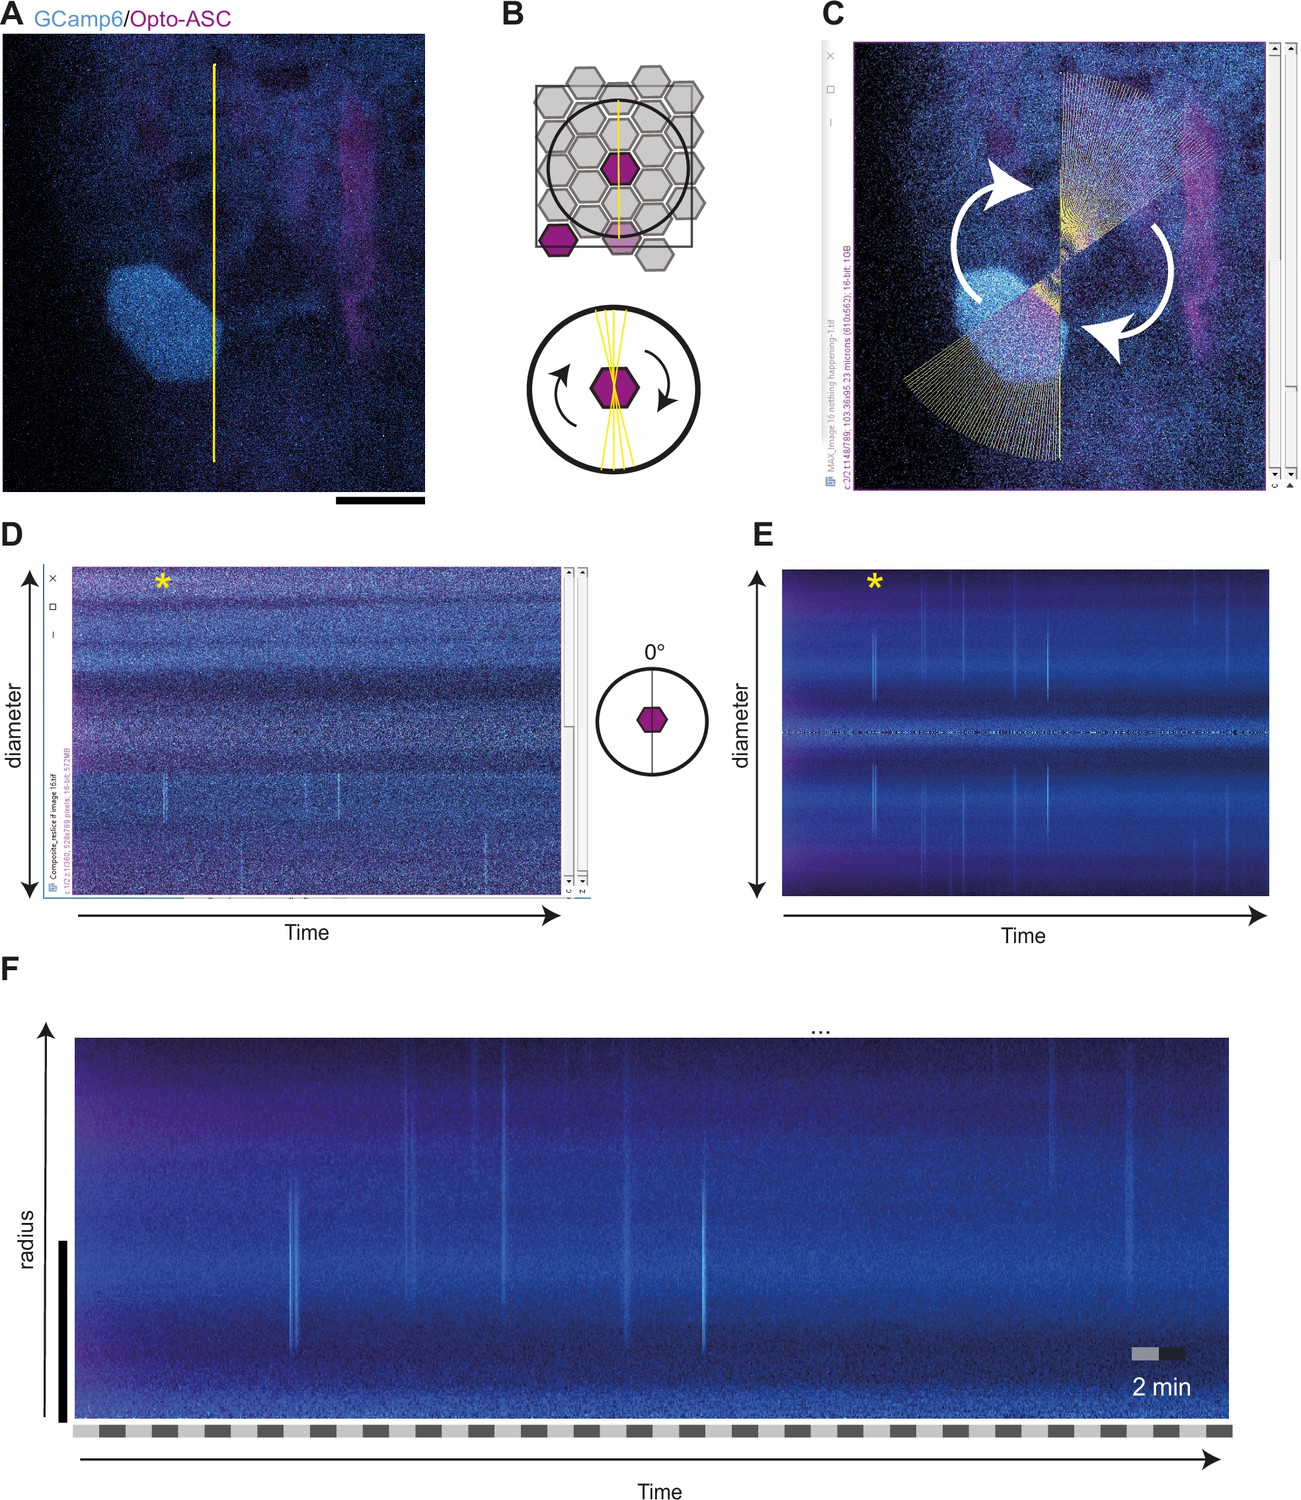
Method for scoring calcium signalling in time and space and control for background signalling.
(A to F) Analysis of control larva expressing β-actin:GCamps (cyan) and Opto-ASC (magenta), yellow line: ROI; Scale bar in all panels: 20 μm (A) Imaged region with the cell of interest (which is not activated in this control) is in the center. The yellow line shows the line ROI at 0° along which fluorescence intensity is measured. (B) Top: Cartoon of the periderm. The circle around the cell of interest outlines the area that is analyzed in the kymograph. Bottom: A line ROI is drawn across the center of the cell. This line is swept by 360 degrees in 1° degree steps to cover a 82.19 μm diameter circle surrounding the center of the cell. (C) Screen shot taken during the experimental course of measurement (at the 56° measurement). The fluorescence intensity at each point along the diameter is measured at each angle. (D) Fluorescence intensities along the diameter (y-axis) at the starting angle, 0°, over time (x-axis). The image in panel A represents t=8 min. (*) represents the time point in C and D. (E, F) The intensity measurements at each point of the diameter are averaged over all angles, that is over the entire circumference at each distance from the center for each time point. Since the diameter sweeps across each point twice (once with each radius), this results in a symmetrical representation, of which only one half is shown in the final kymograph. (F) Resulting two-dimensional (kymograph) of calcium signaling in time and space. The vertical cyan lines in the graph represent the calcium signal in periderm and basal cells with the distance from the central cell represented along the y-axis.
Figure 8—figure supplement 2
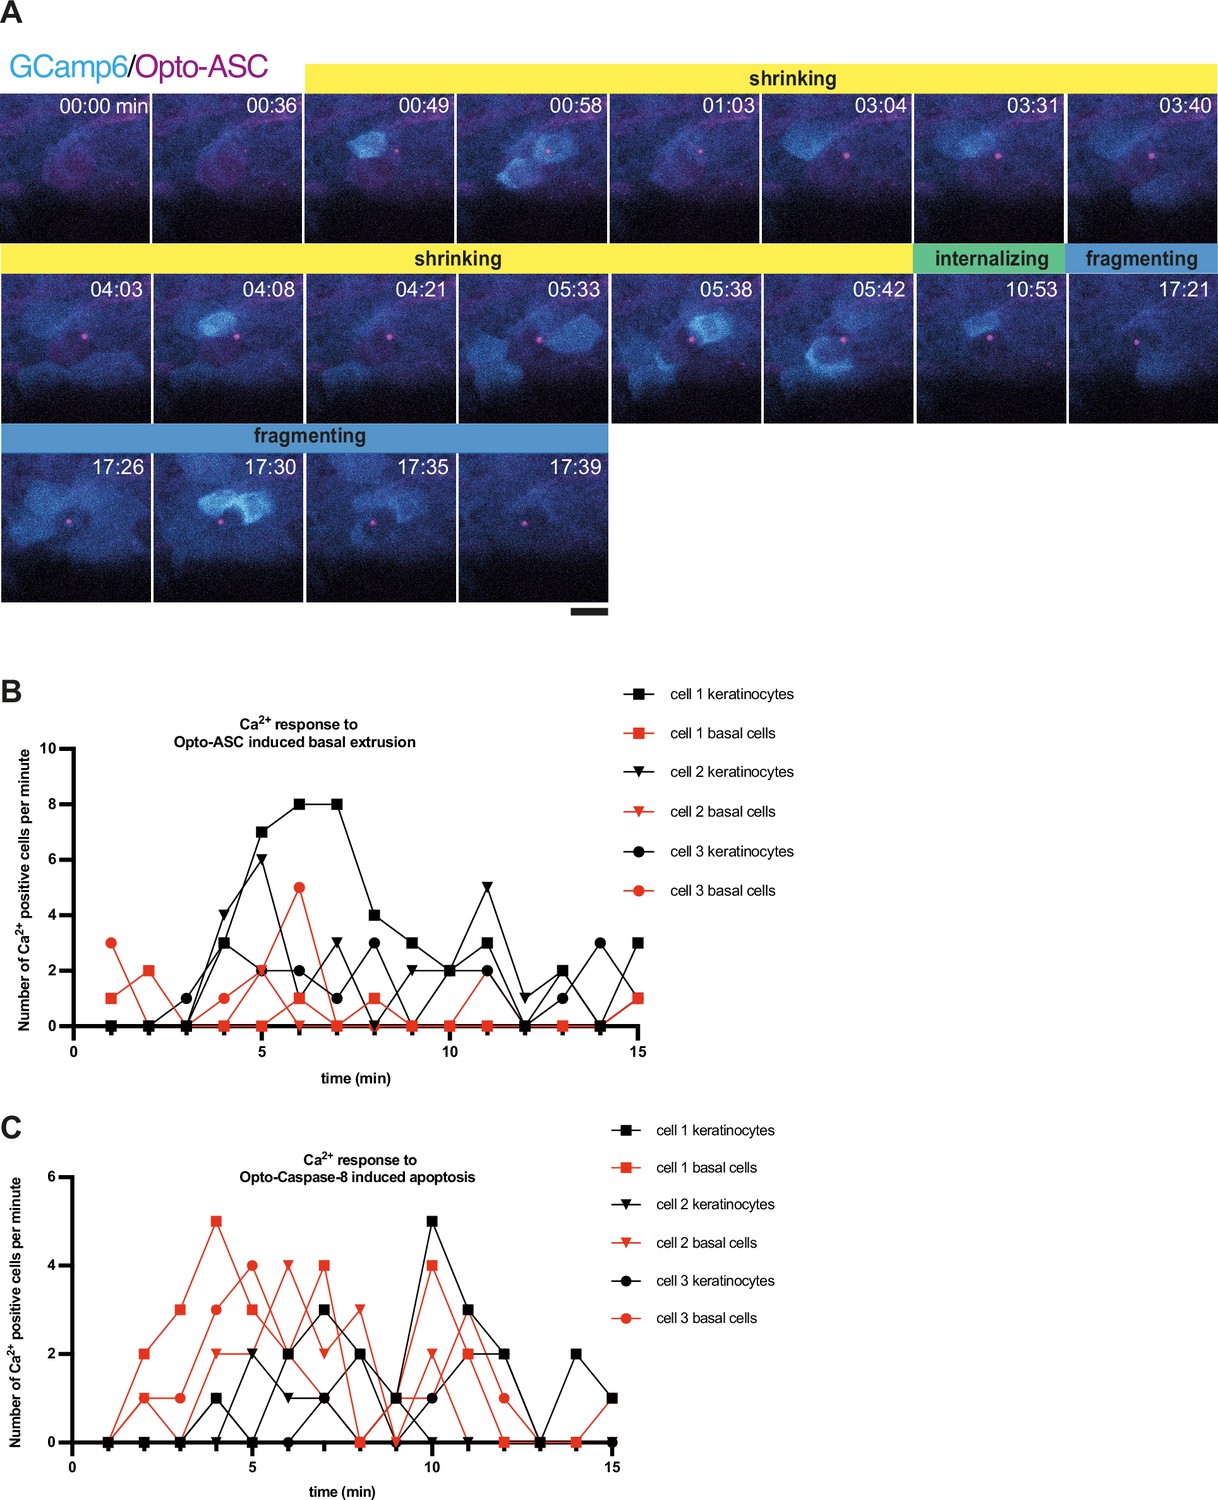
Ca2+ response of neighboring cells to Opto-ASC induced basal extrusion and its quantification.
(A) Example of Ca2+ signaling in epithelial cells for basally extruding periderm cells imaged at high temporal resolution (15 frames per minute). Opto-ASC (magenta) is induced in a periderm cell in the center of the frame by blue light (488 nm). Both the speck and the Ca2+ signal in the neighboring cell appear simultaneously at 00:49 min. The stages of cell death are indicated as defined in Figure 5: shrinking in yellow, internalizing in green, and fragmentation in blue. (B–C) Ca2+ responses in cells adjacent to the dying cell. Number of neighboring cells that show a Ca2+ elevation in response to Opto-ASC-induced basal extrusion and Opto-Caspase-8-induced apoptosis. Three movies, indicated by triangles, squares and circles, were analyzed in each experiment. Number of 1st neighbors (cells directly in contact with the dying cell) to Opto-ASC-induced dying cells (B) and to Opto-Caspase-8-induced dying cells (C) plotted over time. periderm cells are represented in black, and basal cells are in red.
Author response image 1

Stability of Opto-ASC specks in muscle cells after exposure to a single pulse of blue light specks in muscle cells expressing Opto-AscTg(mCherry-Cry2olig-asc) are induced by a single illumination with blue light (488nm) at t = 0 for 32 seconds.
Multiple oligomers begin to form within 6 minutes, continue to gradually increase in number and, and remain until the end of the movie (60 mins). Cell outlines in the overlying epithelium labeled by AKT-PH-GFP are faintly visible in the first frame. Scale bar is 20 mm.
Author response image 2

Localization of actin in the yz and xz planes in Opto-Asc-induced cell death and Opto-caspase-8-induced apoptosisOrthogonal projections of images of apically (A) and basally (B, C) extruded cells at four time points from time lapse recordings.
Each time point shows the x-z plane and the orthogonal yz and xz planes, in which the apical sides of the epithelium faces the x-z image. Actin is labeled with mNeonGreen-UtrCH (cyan), plasma membranes and internal membranes by lyn-tagRFP (magenta). Actin is initially concentrated in the apical cortical ridges of periderm cells.A. Apically extruded cell after death is induced by Opto-Asc. As the cell dies actin is lost from the apical ridges and accumulates in the cell cortex in a plane above the original apical surface of the epithelium.B. Basally extruded cell after death is induced by Opto-Asc. Actin is retained in the apical ridges as the cell shrinks and moves below the epithelium within the dying cell.C. Basally extruded cell after death is induced by Opto-Caspase 8. The apical surfaces forms a transient dome in which the actin ridges remain intact before the dying cell is internalized.
Videos
Video 1
Overnight time lapse of 3dpf larva expressing mCherry-Cry2olig-ASC (Opto-ASC) without blue light exposure (video sequence 1) and then being exposed to 488 nm laser light.
Time is in minutes and the frame rate is 15 min. The scale bar is 200 µm.
Video 2
Example of three periderm cells of a 3 dpf larva expressing Opto-ASC that form specks after exposure to 488 nm blue light.
Scale bars are 20 µm.
Video 3
Local activation of Opto-ASC (red) in a single periderm cell (white endogenous ASC-GFP visible in illuminated area and speck).
Frame rate is 30 s, scale bar is 20 µm.
Video 4
Three examples of larvae expressing Opto-ASC (magenta) exposed to 488 nm laser light at different laser powers.
Membranes are marked with AKT-PH-GFP (green). Time is in minutes, scale bar is 20 µm.
Video 5
Time lapse of Opto-ASC expressing larvae exposed to one or five 488 nm laser light pulses (1 or 5 frames acquired with 488 laser light).
Scale bar is 20 µm. Time is in minutes.
Video 6
High resolution imaging of speck formation in a single (first video sequence) and two neighbouring periderm cells (second video sequence).
Opto-ASC (magenta) speck formation is induced by 488 nm laser light illumination. Endogenous ASC (green, ubiquitous) is recruited to the speck. Time is in minutes.
Video 7
Time lapse of ASC-mKate2-induced speck formation in periderm cells of wildtype and ascΔ2/Δ2 larvae.
Time is in minutes.
Video 8
Time lapse of periderm cells of larvae expressing Opto-ASC (first video sequence), Opto-PYD (second video sequence) and Opto-CARD (third video sequence) in wildtype larvae and ascΔ2/Δ2 larvae exposed to 488 nm laser light.
Time is in minutes.
Video 9
Time lapse of three neighboring periderm cells in which Opto-PYD is expressed at different levels.
Time is in minutes.
Video 10
Time lapse of an apically extruded cell after Opto-ASC induced speck formation at high temporal resolution.
Frame rate is 13 s.
Video 11
DRAQ7 (cyan) staining of a cell that lyses after its extrusion from the periderm in response to Opto-ASC-induced speck formation (magenta).
Video 12
Basal cell dying after formation of an Opto-ASC-speck (magenta).
Cell membrane is labeled by AKT-PH-GFP (green).
Video 13
Thee examples of responses to Opto-ASC (magenta) speck formation in three periderm cells within the same larva (marked by blue, orange and red squares in the overview image); cell borders marked by AKT-PH-GFP, green.
Overview image (movie sequence 1). Apically extruded cell (image sequence 2), basally extruded cell (image sequence 3) or periderm cell extruded in both directions (image sequence 4). ree examples of responses to Opto-ASC (magenta) speck formation in three periderm cells within the same larva (marked by blue, orange and red squares in the overview image); cell borders marked by AKT-PH-GFP, green. Overview image (movie sequence 1). Apically extruded cell (image sequence 2), basally extruded cell (image sequence 3) or periderm cell extruded in both directions (image sequence 4).
Video 14
Response of the actin cytoskeleton in cells that are apically (image sequence 1) or basally (image sequence 2) extruded after formation of an ASC speck (magenta) or dies apoptotic after Opto-Caspase-8 activation (image sequence 3).
Actin is labeled using mosaic expression of mNeonGreen-UtrCH (cyan). Membranes of cells are mosaically labeled by expression of lyn-tagRFP (also magenta).
Video 15
Representative responses of periderm cells after speck formation in caspa F0 KO (image sequence 1), caspb F0 KO (image sequence 2) and caspa F0 KO/caspb F0 KO (image sequence 3).
Scale bar is 20 µm.
Video 16
Periderm cell dying by apoptosis after Opto-Caspase-8 induction; scale bar is 20 µm.
Time is in hours.
Video 17
Ca2+ signaling (light green) in epithelial cells surrounding a cell forming an Opto-ASC speck (magenta) and being extruded from the tissue.
Time is in minutes.
Video 18
Ca2+ signaling (light green) in epithelial cells surrounding a cell dying apoptotically after Opto-Caspase-8 (magenta) induction.
Time is in minutes.
Tables
Appendix 1—key resources table
| Reagent type (species) or resource | Designation | Source or reference | Identifiers | Additional information |
|---|---|---|---|---|
| Strain, strain background (Dario rerio) | AB2B2 | Peri & Gilmour lab strain | EMBL heidelberg Fish facility | |
| Strain, strain background (Dario rerio) | AB | ZIRC | EMBL heidelberg Fish facility | |
| Strain, strain background (Dario rerio) | Golden | ZIRC | EMBL heidelberg Fish facility | |
| Strain, strain background (Dario rerio) | WIK Upenn | ZIRC | EMBL heidelberg Fish facility | |
| Genetic reagent (Danio rerio) | Opto-ASC: Tg(HSE:mCherry-Cry2olig-asc) | this work | EMBL heidelberg Fish facility, stable fish line expressing HSE:mCherry-Cry2olig-asc, expression can be induced by heatshock | |
| Genetic reagent (Danio rerio) | ASCΔ2/Δ2 knockout | this work | CRISPR/cas9 generated ASC mutant line, deletion of two basepairs creats a frameshift with premature stop codon, Reversade lab fish facility | |
| Genetic reagent (Danio rerio) | Tg(Krt4:AKT-PH) | Wada et al., 2013 doi: 10.1016 /j.cub.2013.06.035 | ||
| Genetic reagent (Danio rerio) | Tg(6xUAS:mNeonGreen-UtrCH_6xUAS:lyn-tagRFP) | kindly provided by Darren Gilmour and Jonas Hartmann | ||
| Genetic reagent (Danio rerio) | Tg(HSE:mCherry-Cry2olig-caspa) | Shkarina et Shkarina et al., 2022 doi: 10.1083/jcb.202109038 | available on request, fish are kept at Heidelberg fish facility | |
| Genetic reagent (Danio rerio) | Tg(HSE:mCherry-Cry2olig-caspase-8) | Shkarina et Shkarina et al., 2022 doi: 10.1083/jcb.202109038 | available on request, fish are kept at Heidelberg fish facility | |
| Genetic reagent (Danio rerio) | Tg(rcn3:Gal4) | Ellis et al., 2013 doi: 10.1083/jcb.201212095 | ||
| Genetic reagent (Danio rerio) | Tg(HSE:asc-mKate2) | Kuri et al., 2017 doi: 10.1101/111542. | ||
| Genetic reagent (Danio rerio) | asc:asc-GFP | Kuri et al., 2017 doi: 10.1101/111542. | ||
| Genetic reagent (Danio rerio) | Tg(ß-actin:GCamp6) | Chen et al., 2017 doi: 10.1016 /j.ydbio.2017.03.010. | ||
| Recombinant DNA reagent | HSE:mCherry-Cy2olig ASC (Plasmid) | this work | EPR Plasmid #421 | Deposited at European Plasmid Repository (https://www.plasmids.eu) |
| Recombinant DNA reagent | HSE:mCherry-Cy2olig PYD (Plasmid) | this work | EPR Plasmid #422 | Deposited at European Plasmid Repository (https://www.plasmids.eu) |
| Recombinant DNA reagent | HSE:mCherry-Cy2olig CARD (Plasmid) | this work | EPR Plasmid #423 | Deposited at European Plasmid Repository (https://www.plasmids.eu) |
| Recombinant DNA reagent | HSE:mCherry-Cry2oligR489E (Plasmid) | this work | EPR Plasmid #424 | Deposited at European Plasmid Repository (https://www.plasmids.eu) |
| Recombinant DNA reagent | HSE:ASC-mKate2 | Kuri et al., 2017 doi: 10.1101/111542. | EPR Plasmid #427 | Deposited at European Plasmid Repository (https://www.plasmids.eu) |
| Sequence-based reagent | caspa_F | Kuri et al., 2017 doi: 10.1101/111542. | PCR Primer (Genotyping) | TGGGTTAACTAGGCAAGTCAGGG |
| Sequence-based reagent | caspa_R | Kuri et al., 2017 doi: 10.1101/111542. | PCR Primer (Genotyping) | AGGGTGTATCAGGACTTGGGCCC |
| Sequence-based reagent | caspa_R2 | Kuri et al., 2017 doi: 10.1101/111542. | PCR Primer (Genotyping) | CCACACATGGGAGGTGTGAA |
| Sequence-based reagent | asc_F | PCR Primer (Genotyping) | sgRNA sequence:GTCAGCAFCTTCAACGAGAG | |
| Sequence-based reagent | asc_R | PCR Primer (Genotyping) | sgRNA sequence: ACATTGCCCTGTGTTCCTCA | |
| Sequence-based reagent | caspa_Ex1_T2 | Merck VC40007 sgRNA | sgRNA | sgRNA sequence: CTGGTACAGGTGGCTCCGGCTGG |
| Sequence-based reagent | caspa_Ex1_T15 | Merck VC40007 sgRNA | sgRNA | TTGGGGCGGATAATCTAAGAAGG |
| Sequence-based reagent | caspa_Ex3_T8 | Merck VC40007 sgRNA | sgRNA | GAACATGGAAAAGCTGTTAAAGG |
| Sequence-based reagent | caspa_Ex4_T3 | Merck VC40007 sgRNA | sgRNA | AATGGCGTCTCTTTTGCCGTGGG |
| Sequence-based reagent | caspb EX2_T2 | Merck VC40007 sgRNA | sgRNA | AGCAGAACGAACGTGCAAAGCGG |
| Sequence-based reagent | caspb_ EX5_T | Merck VC40007 sgRNA | sgRNA | GGCCTGAATCAGGATAACCTTGG |
| Sequence-based reagent | caspb_EX8_T1 | Merck VC40007 sgRNA | sgRNA | sgRNA sequence: GCAAGAGTTTCGCCTGACCTTGG |
| Sequence-based reagent | gsdmea_Ex1_T1 | Merck VC40007 sgRNA | sgRNA | sgRNA sequence: GTCCGACACATAGATCCTTCAGG |
| Sequence-based reagent | gsdmea_Ex2_T6 | Merck VC40007 sgRNA | sgRNA | sgRNA sequence: AAACTTCTGAACGACACCAGAGG |
| Sequence-based reagent | gsdmea_Ex4_T8 | Merck VC40007 sgRNA | sgRNA | sgRNA sequence: TGTGTTGGCCTACAGTGTAATGG |
| Sequence-based reagent | gsdmea_Ex7_T1 | Merck VC40007 sgRNA | sgRNA | sgRNA sequence: ATGGCGTCTGATCAGAATGGTGG |
| Sequence-based reagent | gsdmeb_Ex1_T12 | Merck VC40007 sgRNA | sgRNA | sgRNA sequence: TCCGGAGCCACCTATATTAATGG |
| Sequence-based reagent | gsdmeb_Ex2_T14 | Merck VC40007 sgRNA | sgRNA | sgRNA sequence: sgRNA sequence:TCCGGAGCCACCTATATTAATGG |
| Sequence-based reagent | gsdmeb_Ex5_T2 | Merck VC40007 sgRNA | sgRNA | sgRNA sequence: TCACAGTTAGTGCTGCACCAGGG |
| Sequence-based reagent | gsdmeb_Ex9_T15 | Merck VC40007 sgRNA | sgRNA | sgRNA sequence: GAAGTGCTGTAGCAGAACTTGGG |
| Peptide, recombinant protein | Cas9 | PepCORE facility, EMBL | ||
| Peptide, recombinant protein | NEBuilder HiFi DNA AssemblyNEBuilder HiFi DNA Assembly Master Mix | NEB | Cat No: E2621 | |
| Chemical compound, drug | Draq7 | Invitrogene | Cat. No.:D15106 | |
| Chemical compound, drug | LDC7559 | MedCehm Express | Cat. No.: HY-111674 | |
| Chemical compound, drug | Disulfiram, European Pharmacopoeia (EP) Reference Standard | Merck | Cat. No.:D2950000 | |
| Chemical compound, drug | dimethyl fumarate | Merck | Cat.No.:242926 | |
| Software, algorithm | Prism version 9 | Graphpad | ||
| Software, algorithm | Fiji distribution of ImageJ | Schindelin et al., 2012 | ||
| Software, algorithm | Radial Reslice Fiji plugin | Cooper, 2009 | ||
| Software, algorithm | CCTop | Stemmer et al., 2015 | https://cctop.cos.uni-heidelberg.de:8043/index.html |
Additional files
Download links
A two-part list of links to download the article, or parts of the article, in various formats.
Downloads (link to download the article as PDF)
Open citations (links to open the citations from this article in various online reference manager services)
Cite this article (links to download the citations from this article in formats compatible with various reference manager tools)
The Opto-inflammasome in zebrafish as a tool to study cell and tissue responses to speck formation and cell death
eLife 12:e86373.
https://doi.org/10.7554/eLife.86373


