The role of B cells in immune cell activation in polycystic ovary syndrome
- Department of Internal Medicine, Medical University of Graz, Austria
- Department of Physiology and Pharmacology, Karolinska Institute, Sweden
- Centre for Bone and Arthritis Research, Department of Internal Medicine and Clinical Nutrition, Sahlgrenska Academy, University of Gothenburg, Sweden
- Department of Drug Treatment, Sahlgrenska University Hospital, Region Västra Götaland, Sweden
- Department of Microbiology, Tumor and Cell Biology, Karolinska Institute, Sweden
Figures
Figure 1 with 1 supplement
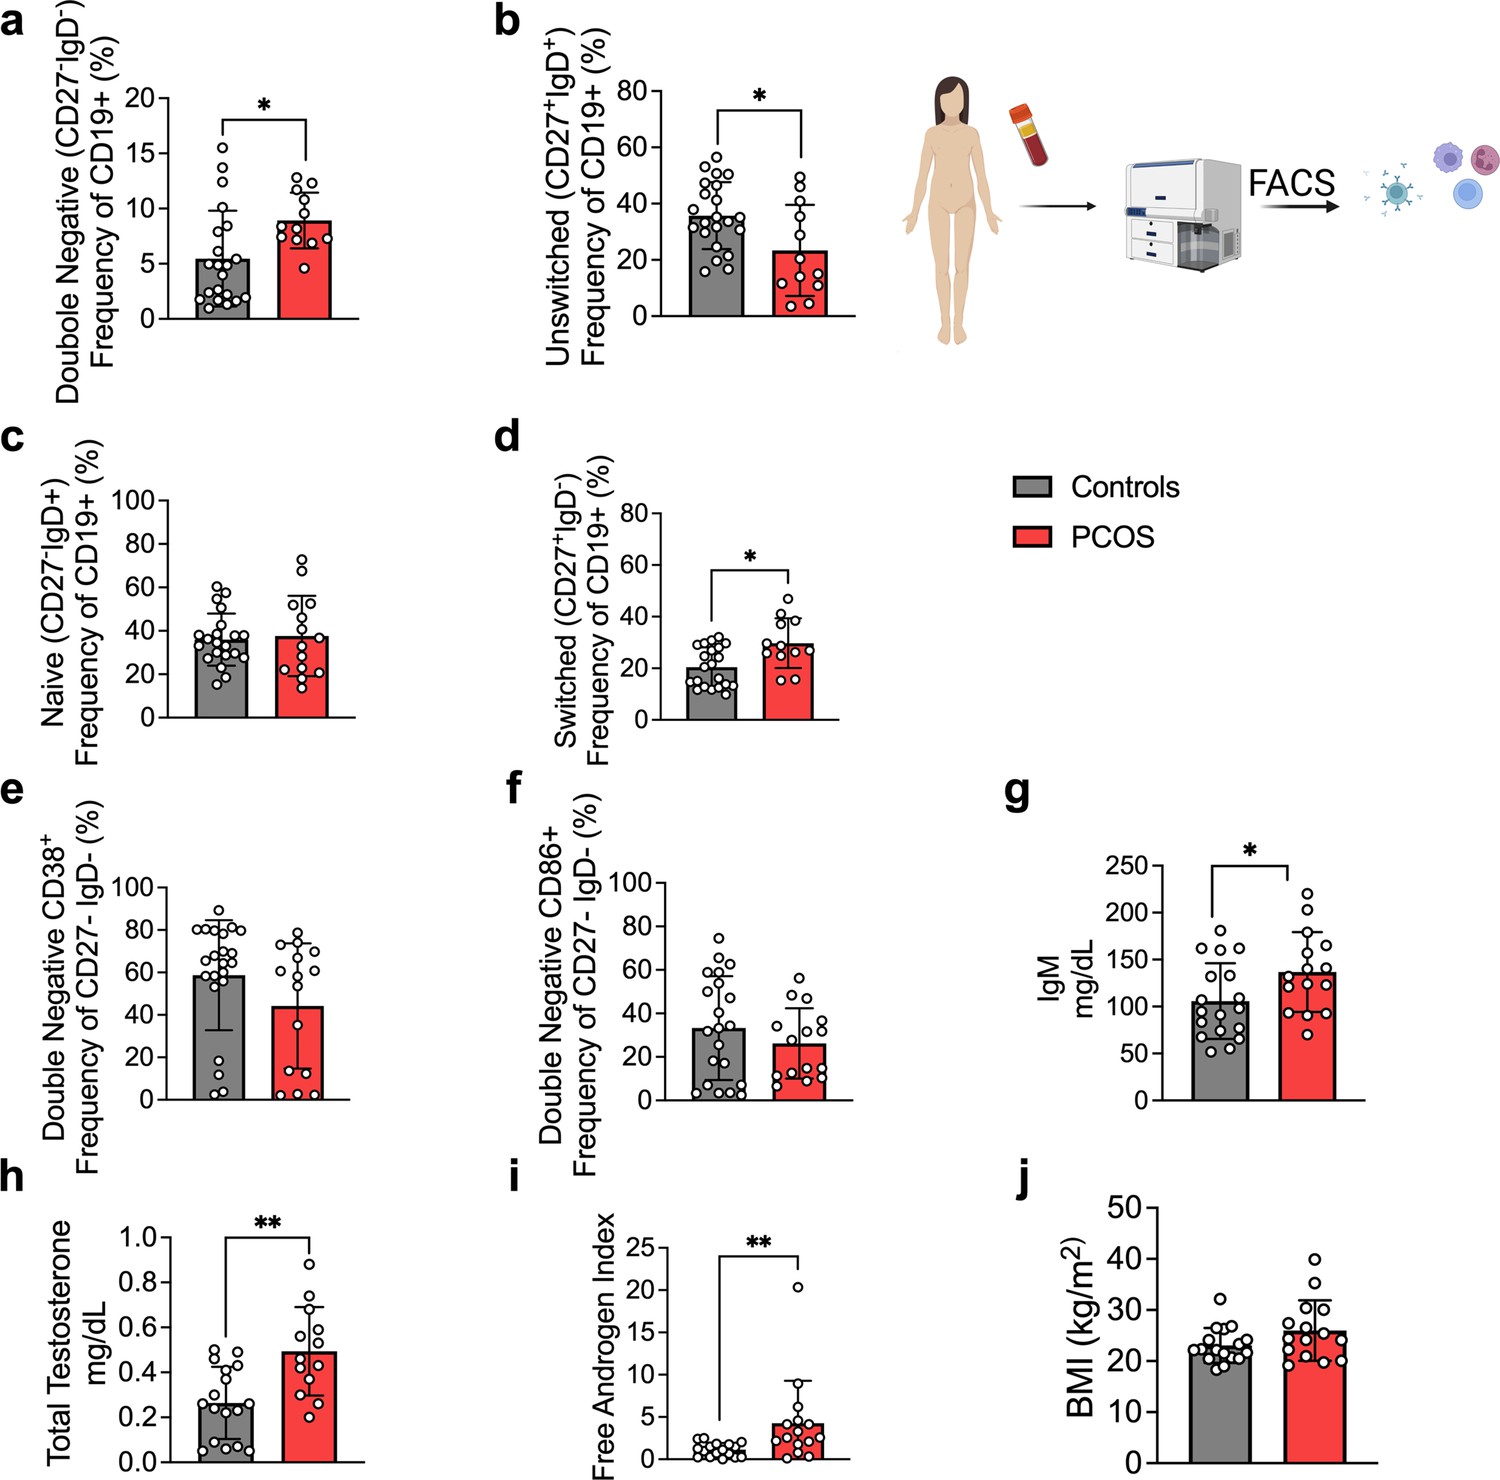
B cell frequencies and immunoglobulin M (IgM) variations in women with polycystic ovary syndrome (PCOS).
(a) Total CD19+ double-negative (DN) B cells (CD27- IgD-). (b) Total unswitched B cells (CD27+IgD+ ). (c) Total naive B cells (CD27- IgD+). (d) Total switched B cells (CD27+IgD-). (a–d) Total CD19+ populations (controls n = 22; PCOS n = 15). (e, f) Expression on double-negativeDN B cells respectively of the surface markers CD38 and CD86. (g) Circulating IgM titers. (h) Total testosterone. (i) Free androgen index (FAI). (j) Body mass index (BMI). (g–j) Controls n = 18; PCOS n = 15. All bars indicate means, error bars SD, circles represent human individuals. In the case of missing values due to lack of measurement, individuals were excluded from the analysis report for that variable. Unpaired Student’s t-test for analysis of naive, unswitched, and DN CD86+ B cells, total testosterone, and BMI. Mann–Whitney test for all other B cell frequencies, antibody titers, and FAI. *p<0.05, **p<0.01, ***p<0.001.
Figure 1—figure supplement 1
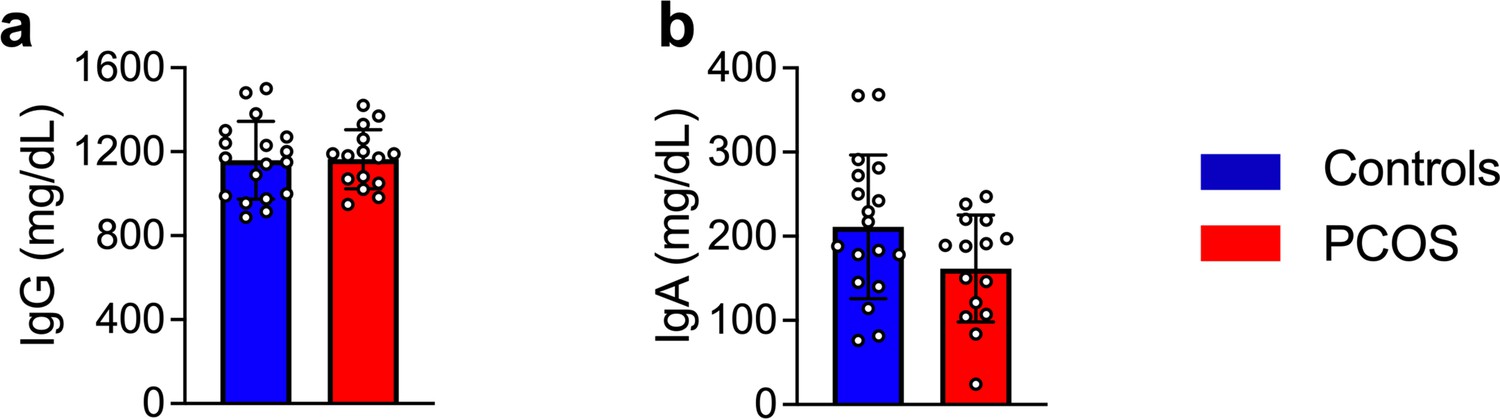
Circulating antibody titers in women with and without polycystic ovary syndrome (PCOS).
(a) Circulating immunoglobulin G (IgG) titers. (b) Circulating immunoglobulin A (IgA) titers in women without PCOS (controls n = 18) and in women with PCOS (n = 15). All bars indicate means, circles represent human individuals. Mann–Whitney U-test for analysis of antibody titers.
Figure 2
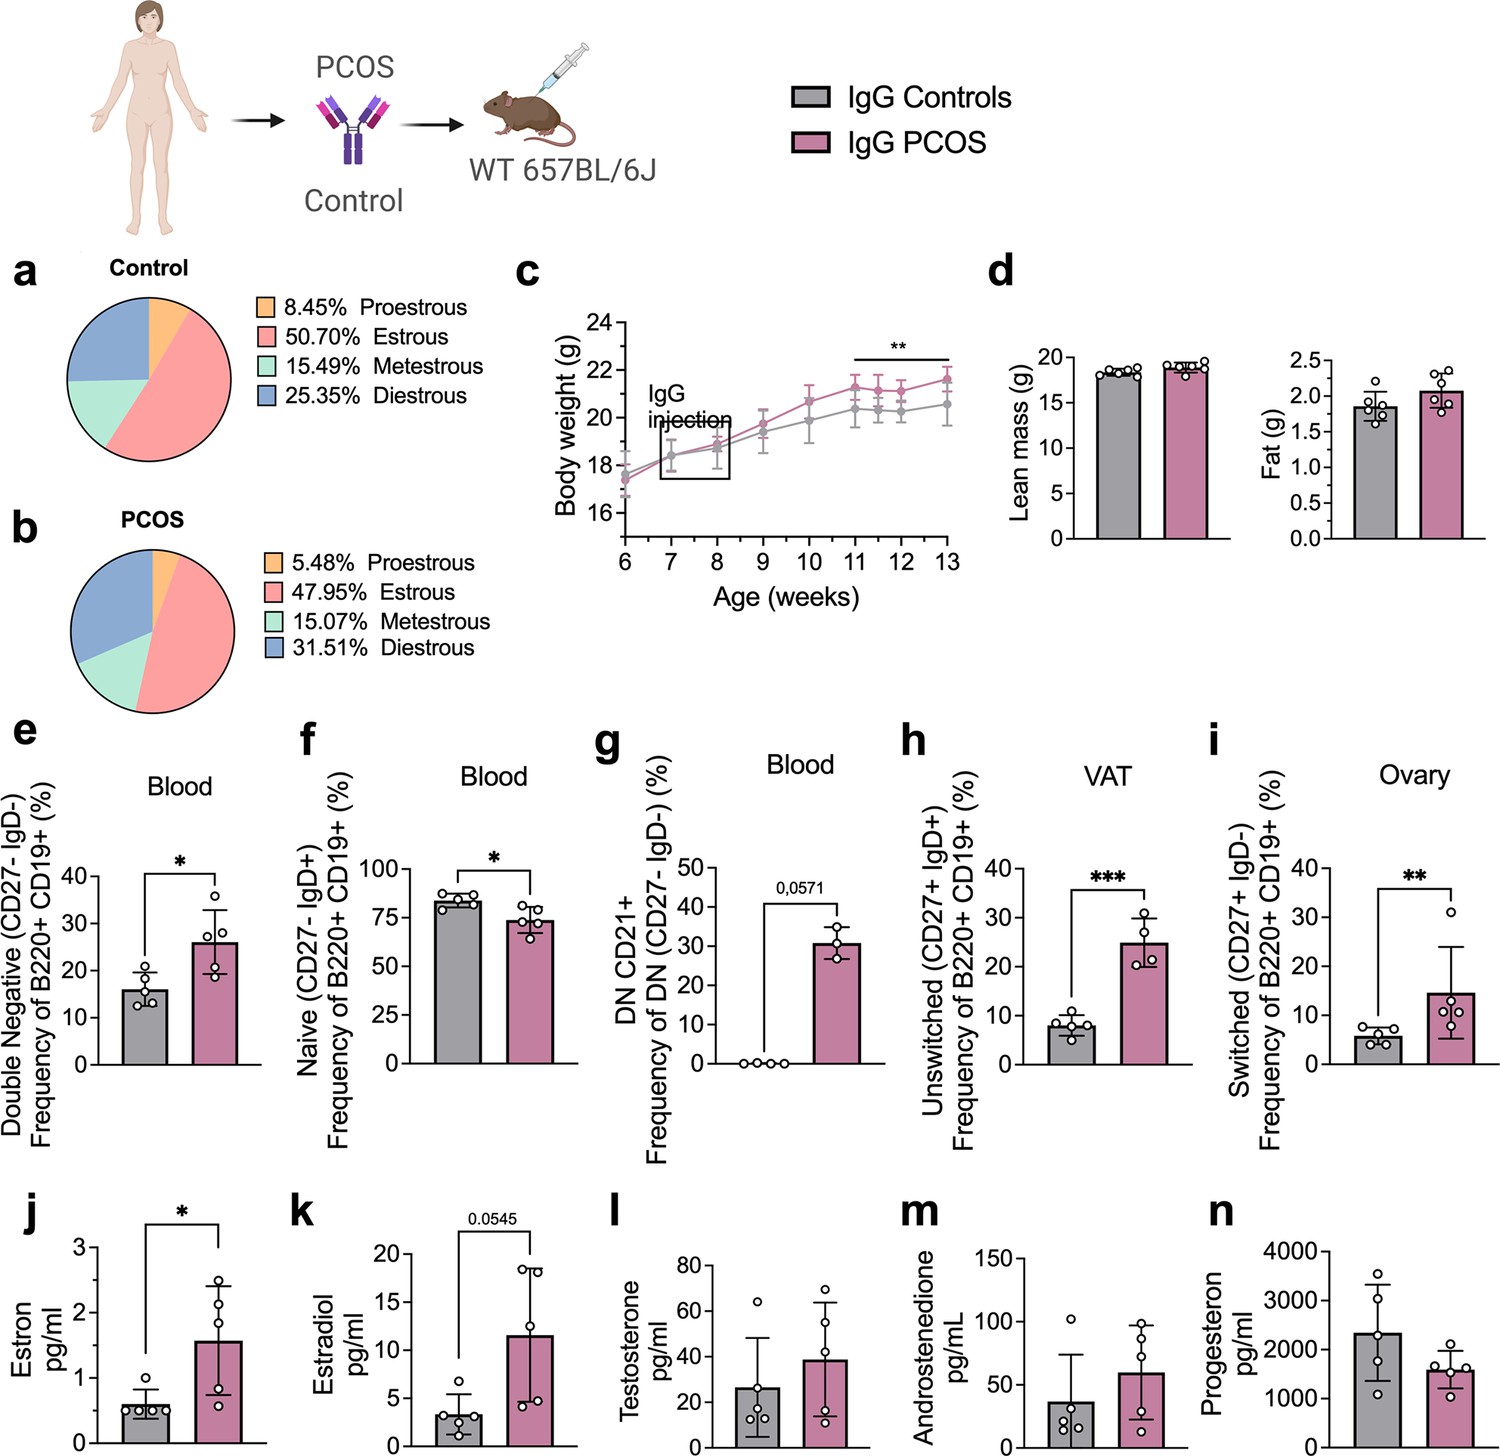
Immunoglobulin G (IgG) transfer to wild-type (WT) mice.
(a) Estrous cycles in mice receiving control IgG. (b) Estrous cycles in mice receiving polycystic ovary syndrome (PCOS) IgG. (c) Weekly body weight (BW) recordings. (d) EcoMRI results for body fat and lean mass composition. (e) Double-negative (DN) B cells in blood. (f) Naive B cells in blood. (g) DN CD21+ B cells in blood. (h) Unswitched B cells in visceral adipose tissue (VAT). (i) Switched B cells in ovary. (j) Testosterone. (k) Androstenedione. (l) Estradiol. (m) Estron. (n) Progesterone. (a–n) IgG donors; controls n = 4, PCOS n = 4 (see Table 2). Mice receiving control IgG (n = 6), mice receiving PCOS IgG (n = 6). All bars indicate means, circles represent individual mice. In the case of missing values due to lack of measurement, mice were excluded from the analysis report for that variable. Unpaired Student’s t-test for analysis of EchoMRI results and all B cell frequencies except DN CD21+ and switched; two-way ANOVA with Sidak’s post hoc test for analysis of weekly BW recordings; Mann–Whitney test for analysis of DN CD21+, switched, estron, testosterone, and androstenedione, Welch´s t-test for analysis of estradiol and progesterone. *p<0.05, **p<0.01, ***p<0.001.
Figure 3
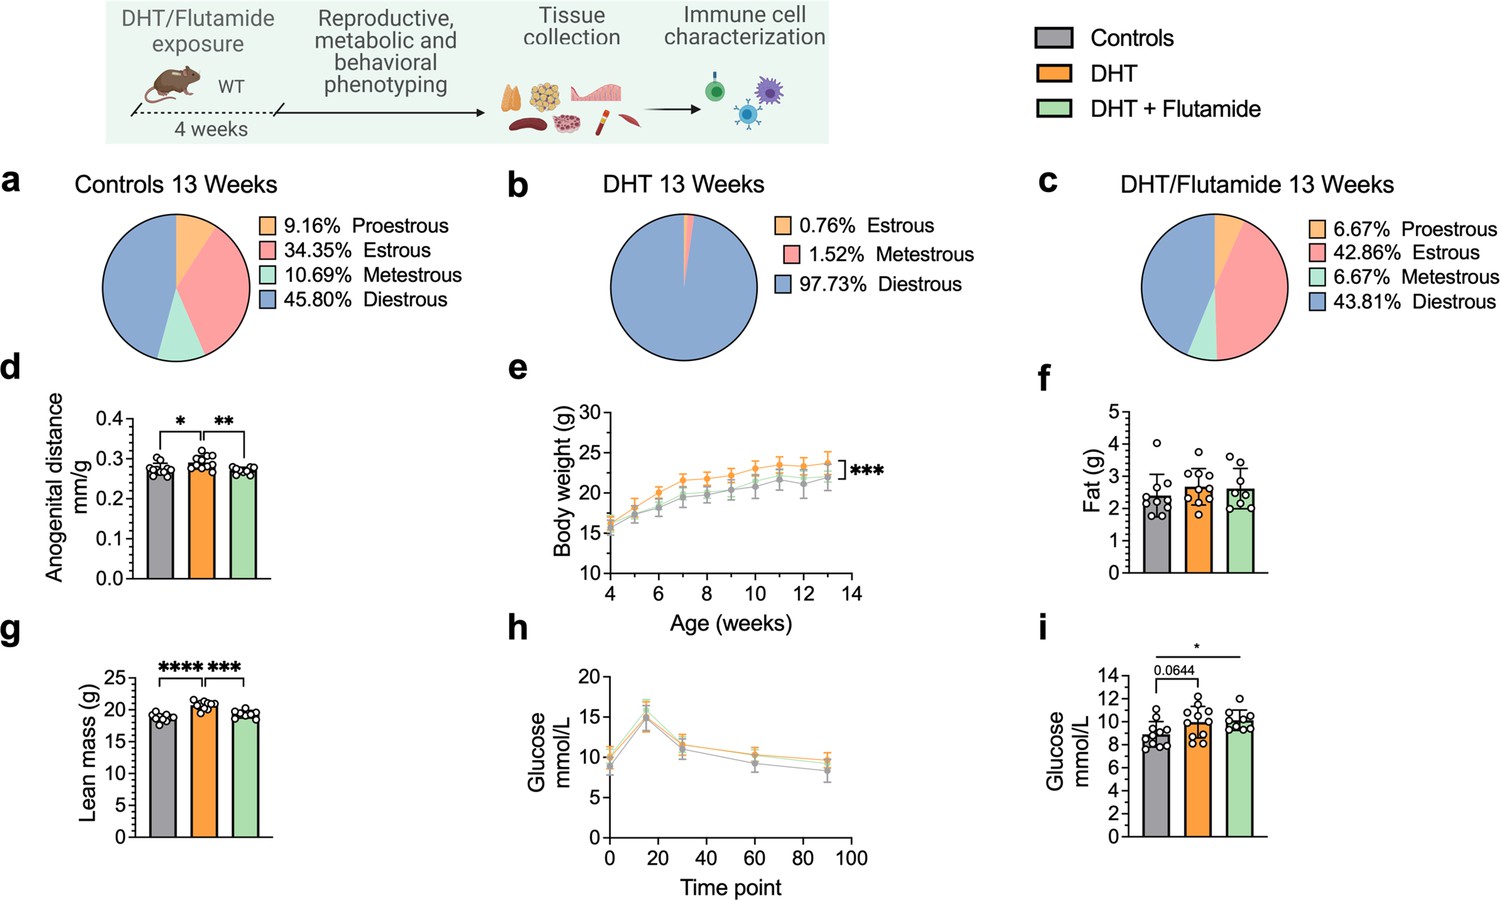
Dihydrotestosterone (DHT)-induced polycystic ovary syndrome (PCOS)-like mouse model phenotypic study at 13 weeks of age.
(a) Estrous cycles in WT control mice. (b) Estrous cycles in mice receiving DHT pellet implant. (c) Estrous cycles in mice receiving DHT pellet and flutamide implant. (d) Normalized anogenital distance. (e) Weekly body weight (BW). (f) EchoMRI record of fat body composition. (g) EchoMRI record of lean body composition. (h) Oral glucose tolerance test (OgTT). (i) Fasting glucose. (a–i) WT control mice (n = 11), mice receiving DHT pellet implant (n = 11), mice receiving DHT pellet, and flutamide implant (n = 10). All bars indicate means, circles represent individual mice. In the case of missing values due to lack of measurement, mice were excluded from the analysis report for that variable. Unpaired Student’s t-test for analysis of anogenital distance difference between groups, as well as EchoMRI results and fasting glucose; two-way ANOVA with Sidak’s post hoc test for analysis of weekly BW recordings and blood glucose throughout the study. *p<0.05, **p<0.01, ***p<0.001.
Figure 4
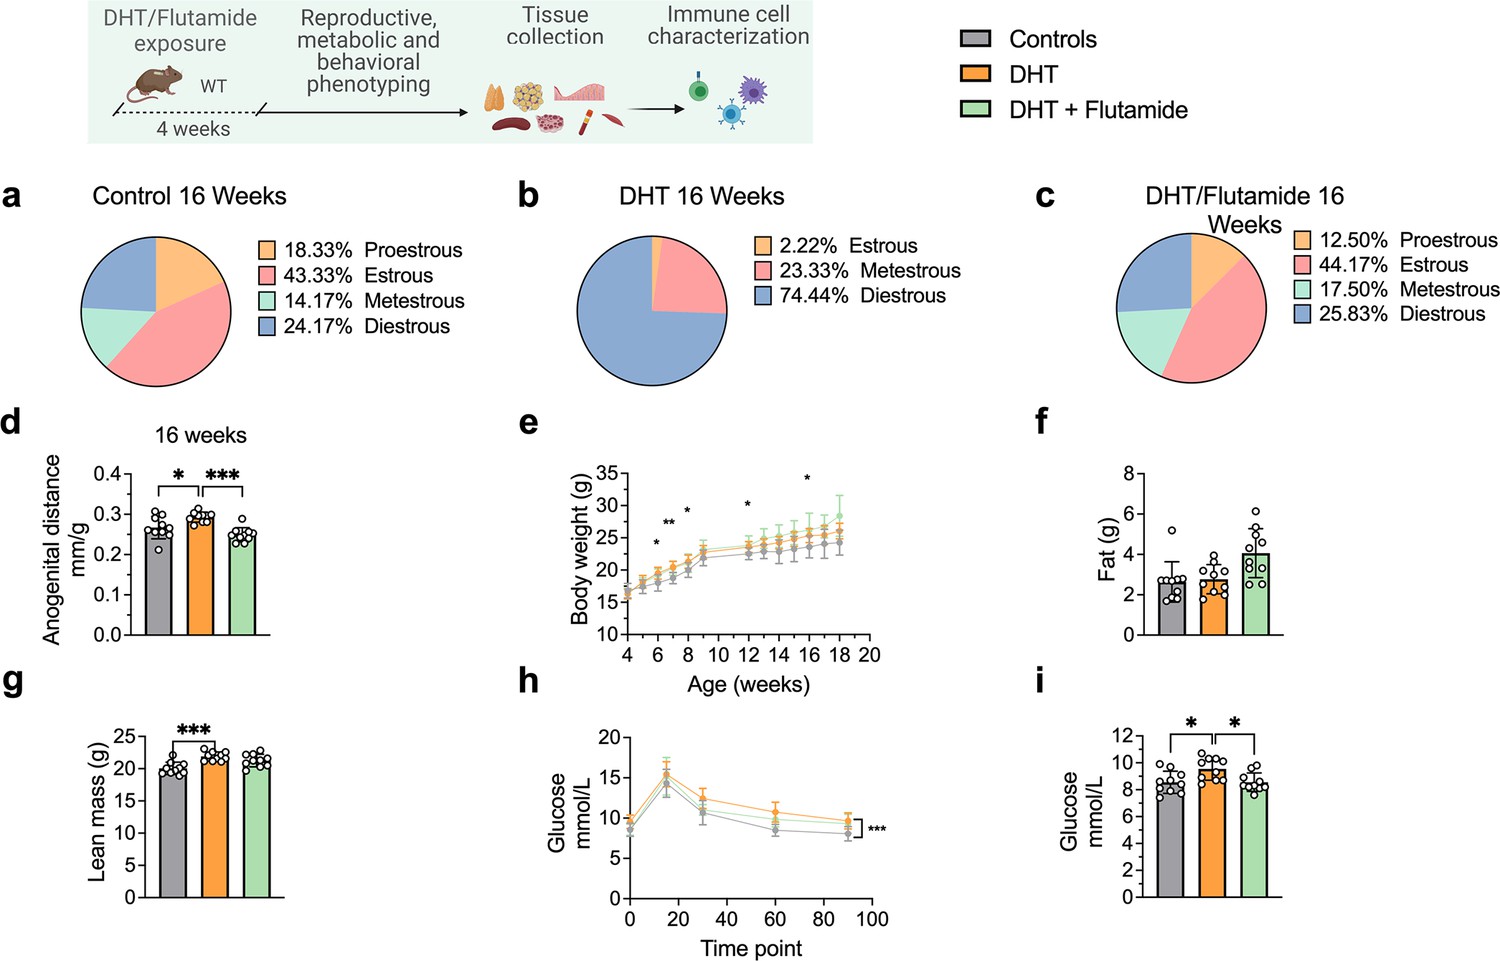
Dihydrotestosterone (DHT)-induced polycystic ovary syndrome (PCOS)-like mouse model phenotypic study at 16 weeks of age.
(a) Estrous cycles in WT control mice. (b) Estrous cycles in mice receiving DHT pellet implant. (c) Estrous cycles in mice receiving DHT pellet and flutamide implant. (d) Anogenital distance normalized to body weight (BW). (e) Weekly BW. (f) EchoMRI record of fat body composition. (g) EchoMRI record of lean body composition. (h) Oral glucose tolerance test (OgTT). (i) Fasting glucose. (a–i) WT control mice (n = 10), mice receiving DHT pellet implant (n = 10), mice receiving DHT pellet and flutamide implant (n = 10). All bars indicate means, circles represent individual mice. In the case of missing values due to lack of measurement, mice were excluded from the analysis report for that variable. Unpaired Student’s t-test for analysis of anogenital distance difference between groups, as well as EchoMRI results and fasting glucose; two-way ANOVA with Sidak’s post hoc test for analysis of weekly BW recordings and blood glucose throughout the study. *p<0.05, **p<0.01, ***p<0.001.
Figure 5 with 1 supplement
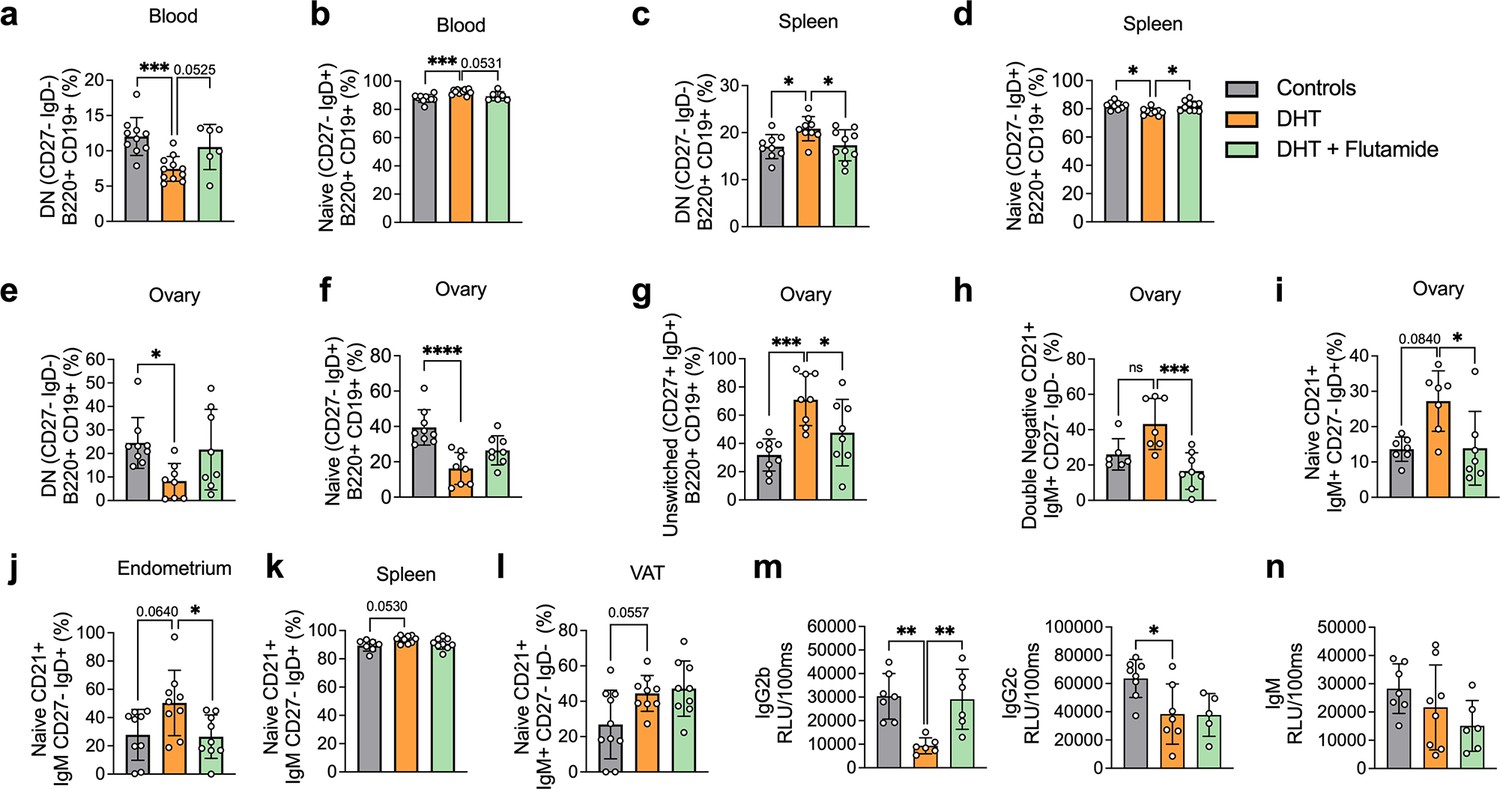
Dihydrotestosterone (DHT)-induced polycystic ovary syndrome (PCOS)-like mouse model B cell frequencies.
(a) Blood double-negative (DN) B cells in 13-week-old mice. (b) Blood naive B cells in 13-week-old mice. (a, b) 13-week-old WT control mice (n = 10), mice receiving DHT pellet implant (n = 11), and mice receiving DHT pellet and flutamide implant (n = 10). (c) Spleen DN B cells in 20-week-old mice. (d) Spleen naive B cells in 20-week-old mice. (e) Ovary DN B cells in 20-week-old mice. (f) Ovary naive B cells in 20-week-old mice. (g) Ovary unswitched B cells in 20-week-old mice. (h) Ovary DN CD21+ B cells in 20-week-old mice. (i) Ovary naive CD21+ B cells in 20-week-old mice. (j) Visceral adipose tissue (VAT) naive CD21+ B cells in 20-week-old mice. (k) Spleen naive CD21+ B cells in 16-week-old mice. (l) Endometrium naive CD21+ B cells in 20-week-old mice. (m) Circulating IgG titers in 20-week-old mice. (n) Circulating IgM titers in 20-week-old mice. (c–n) 16–20-week-old WT control mice (n = 10), mice receiving DHT pellet implant (n = 9), and mice receiving DHT pellet and flutamide implant (n = 10). All bars indicate means, circles represent individual mice. In the case of missing values due to lack of measurement, mice were excluded from the analysis report for that variable. One-way ANOVA for multiple-comparisons of normally distributed data, Kruskal–Wallis test for data that is not normally distributed. *p<0.05, **p<0.01, ***p<0.001.
Figure 5—figure supplement 1

Circulating antibody titers in dihydrotestosterone (DHT)-induced (PCOS)-like mouse model.
(a) Circulating IgG1 titers in control (n = 8), DHT (n = 7), and DHT+ flutamide (n = 6) exposed mice. (b) Circulating IgG3 titers in control (n = 8), DHT (n = 8), and DHT+ flutamide (n = 6) exposed mice. All bars indicate means, circles represent individual mice. Mann–Whitney U-test for analysis of antibody titers.
Figure 6
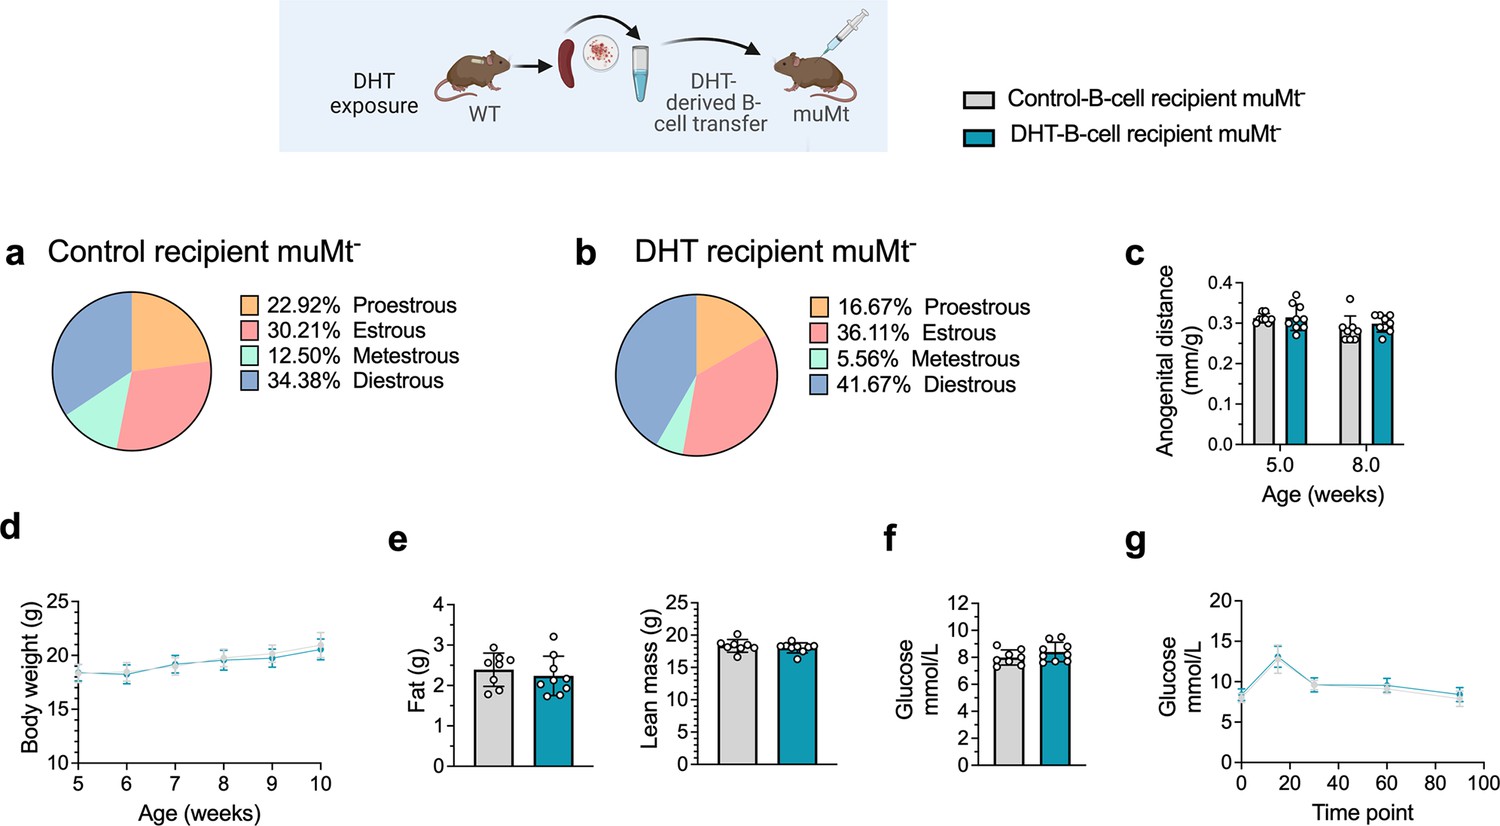
B cell transfer from dihydrotestosterone (DHT)-induced polycystic ovary syndrome (PCOS)-like mice into recipient muMt- B cell-deficient mice.
(a) Estrous cycles in 13-week-old muMt- mice receiving control B cells. (b) Estrous cycles in 13-week-old muMt- mice receiving DHT exposed B cells. (c) Normalized anogenital distance in 13-week-old muMt- recipient mice. (d) Weekly body weight (BW) in 13-week-old muMt- recipient mice. (e) EchoMRI record of fat and lean body composition in 13-week-old muMt- recipient mice. (f) Fasting glucose levels. (g) Oral glucose tolerance test (OgTT) in 13-week-old muMt- recipient mice. (a–g) 13-week-old muMt- mice receiving control B cells (n = 8), 13-week-old muMt- mice receiving DHT-exposed B cells (n = 9). All bars indicate means, circles represent individual mice. In the case of missing values due to lack of measurement, mice were excluded from the analysis report for that variable. Unpaired Student’s t-test for analysis of anogenital distance difference between groups, as well as EchoMRI results and fasting glucose; two-way ANOVA with Sidak’s post hoc test for analysis of weekly BW recordings and blood glucose throughout the study; *p<0.05, **p<0.01, ***p<0.001.
Figure 7
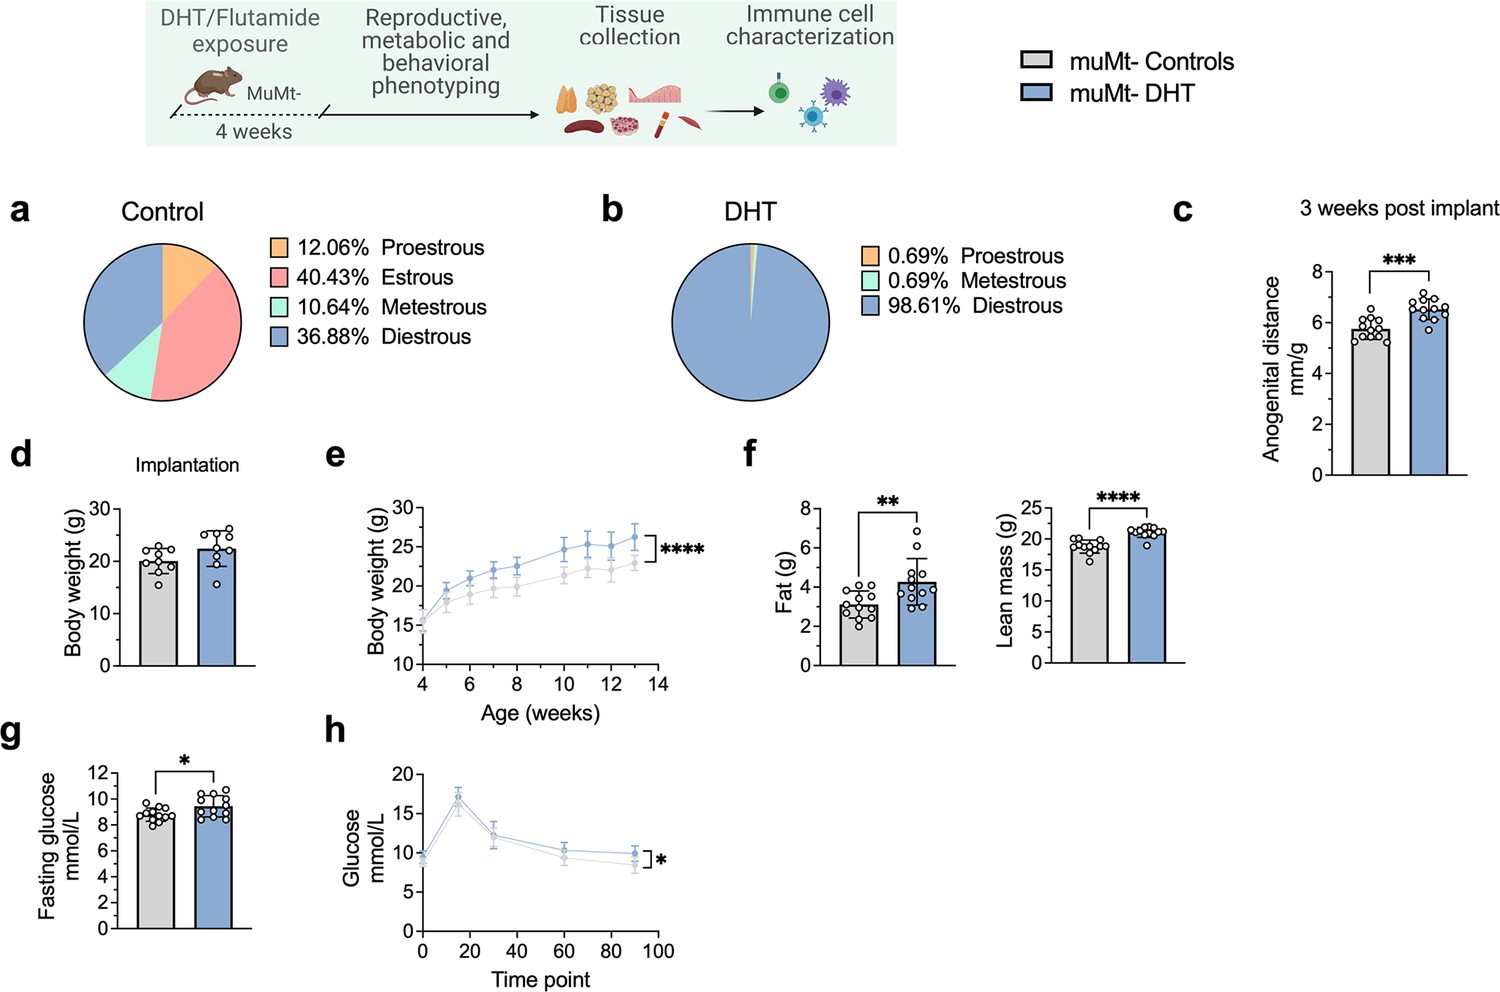
MuMt- dihydrotestosterone (DHT)-induced mouse model phenotypic study.
(a) Estrous cycles in muMt- control mice. (b) Estrous cycles in muMt- mice receiving DHT pellet implant. (c) Normalized anogenital distance 3 wk post pellet implantation. (d) Body weight (BW) at pellet implantation. (e) Weekly BW recordings. (f) EchoMRI record of fat and lean body composition. (g) Fasting glucose levels. (h) Oral glucose test results. (a–h) muMt- control mice (n = 12), muMt- mice receiving DHT pellet implant (n = 12). All bars indicate means, circles represent individual mice. In the case of missing values due to lack of measurement, mice were excluded from the analysis report for that variable. Unpaired Student’s t-test for analysis of anogenital distance difference between groups, as well as BW at implantation, fat mass, and fasting glucose; Mann–Whitney test for analysis of lean mass; two-way ANOVA with Sidak’s post hoc test for analysis of weekly BW recordings and blood glucose throughout the study; *p<0.05, **p<0.01, ***p<0.001.
Tables
Table 1
Clinical characteristics of women with polycystic ovary syndrome (PCOS) and women without the syndrome used for characterization of main B cell lineages and subpopulations based on pan B cell surface marker CD19.
| Controls(n = 22) | PCOS(n = 15) | p-Value | |
|---|---|---|---|
| Age (years) | 36.3 (21-50) | 26.4 (24-38) | 0.003 |
| Anthropometry | |||
| BMI (kg/m2) | 22.18 (18.31–32.15) | 24.39 (19.16–39.89) | 0.128 |
| Waist-to-hip-ratio | 0.8 (0.74–0.91) | 0.82 (0.71–0.92) | 0.237 |
| Endocrine measure | |||
| Free testosterone (ng/mL) | 0.25 (0,06–0.49) | 0.43 (0.02–0.88) | 0.037 |
| Total testosterone (ng/mL) | 0.86 (0.8–1.74) | 1.49 (0.07–3.05) | 0.037 |
| Free androgen index (FAI) | 1.2 (0.22–2.48) | 2.6 (0.11–20.34) | 0.003 |
| Androstenedione (ng/mL) | 2.8 (1.17–5.99) | 3.9 (2.27–6.53) | 0.003 |
| Metabolic measures | |||
| Cholesterol (mg/dL) | 177 (128–217) | 180 (135–214) | 0.469 |
| HDL (mg/dL) | 67 (46–87) | 51 (36–90) | 0.001 |
| LDL (mg/dL) | 97.3 (45.8–115.8) | 108.6 (78.6–160.4) | 0.049 |
| Triglycerides (mg/dL) | 65.5 (44-97) | 82 (56–124) | 0.011 |
| Glucose (mg/dL) | 88 (76–104) | 91 (77–111) | 0.491 |
-
Data are median ± range. Comparisons between groups were made using Mann–Whitney U-test.
-
BMI, body mass index; HDL, high-density lipoprotein; LDL, low-density lipoprotein.
Table 2
Clinical characteristics of immunoglobulin G (IgG) donors, women with polycystic ovary syndrome (PCOS) and women without the syndrome.
| Controls(n = 4) | PCOS(n = 4) | p-Value | |
|---|---|---|---|
| Age (years) | 27 (22–31) | 25 (23–35) | >0.999 |
| Anthropometry | |||
| BMI (kg/m2) | 26 (19.4–29.8) | 25 (21.3–28.2) | >0.999 |
| Waist-to-hip-ratio | 1 (0.79–0.91) | 1 (0.70–0.91) | 0.857 |
| Endocrine measure | |||
| LH (mU/mL) | 7 (4.40–11.40) | 10 (5.19–38.60) | 0.343 |
| FSH (mU/mL) | 4 (2.74–6.91) | 7 (5.59–8.61) | 0.057 |
| Progesterone (ng/mL) | 10 (0.20–13.60) | 1 (0.60–1.05) | 0.343 |
| Free testosterone (ng/mL) | 2 (0.84–2.68) | 3 (0.29–3.03) | 0.685 |
| Total testosterone (ng/mL) | 0 (0.17–0.40) | 0 (0.30–0.40) | 0.228 |
| Androstenedione (ng/mL) | 3.11 (1.21–4.56) | 4 (1.98–4.69) | 0.685 |
| SHBG (nmol/L) | 63 (52.8–88.8) | 62 (43.9–105) | 0.952 |
| Free androgen index (FAI) | 0 (0.3–0.6) | 1 (0.5–0.7) | 0.171 |
| AMH (ng/mL) | 4 (2.40–4.66) | 8 (4.97–9.96) | 0.028 |
| Metabolic measures | |||
| Cholesterol (mg/dL) | 160 (132–184) | 153 (146–172) | 0.686 |
| HDL (mg/dL) | 77 (42–80) | 62 (49–71) | 0.343 |
| LDL (mg/dL) | 75 (66–89) | 74 (67–107) | 0.828 |
| Triglycerides (mg/dL) | 71 (43–91) | 74 (68–82) | 0.885 |
-
Data are median ± range. Comparisons between groups were made using Mann–Whitney U-test.
-
AMH, anti-Müllerian hormone; HDL, high-density lipoprotein; LDL, low-density lipoprotein; SHBG, sex hormone-binding globulin; FSH, follicle-stimulating hormone; LH, luteinizing hormone.
Key resources table
| Reagent type (species) or resource | Designation | Source or reference | Identifiers | Additional information |
|---|---|---|---|---|
| Strain, strain background (Mus musculus) | C57BL/6JRj | Janvier Labs | Female mice | |
| Strain, strain background (M. musculus) | B6.129S7-Rag1, C57BL/6JRj | Jackson Laboratory | IMSR_JAX:002216 | Breeding pairs, homozygous for Rag1 |
| Strain, strain background (M. musculus) | B6.129S2-Ighm, C57BL/6JRj | Jackson Laboratory | IMSR_JAX:002288 | Breeding pairs, homozygous for Ighm |
| Antibody | Anti-human CD19-VioGreen, (clone REA675) (human monoclonal) | Miltenyi Biotec | AB_2726202 | 1:400 |
| Antibody | Anti-human anti-IgD-VioBlue (clone IgD26) (mouse monoclonal) | Miltenyi Biotec | AB_2659773 | 1:400 |
| Antibody | Anti-human CD27-APC (clone M-T271) (mouse monoclonal) | Miltenyi Biotec | AB_1036201 | 1:400 |
| Antibody | Anti-human CD86-PE-Vio770 (clone FM95) (mouse monoclonal) | Miltenyi Biotec | AB_275113 | 1:400 |
| Antibody | Anti-human CD38-FITC (clone IB6) (mouse monoclonal) | Miltenyi Biotec | AB_615091 | 1:400 |
| Antibody | Anti-human anti-IgM-PE (clone PJ2-22H3) (mouse monoclonal) | Miltenyi Biotec | AB_1036088 | 1:400 |
| Antibody | Alkaline phosphatase (AP)-labeled (goat polyclonal) anti-human IgM | μ-chain specific; Sigma-Aldrich | n/a | 1:50,000 in TBS BSA |
| Antibody | Alkaline phosphatase (AP)-labeled (goat polyclonal) anti-human IgG | γ-chain specific; Sigma-Aldrich | n/a | 1:50,000 in TBS BSA |
| Antibody | Alkaline phosphatase (AP)-labeled (goat polyclonal) anti-human IgA | α-chain specific; Sigma-Aldrich | n/a | 1:50,000 in TBS BSA |
| Antibody | Anti-mouse IgD-Pacific Blue (clone 11–26c.2a) (rat monoclonal) | BioLegend | AB_1937245 ( Cat#. 405711); AB_1937244 (Cat# 405712) | 1:400 |
| Antibody | Anti-mouse CD19-BV480 (clone 1D3) (rat monoclonal) | BD Biosciences | AB_2739509 | 1:400 |
| Antibody | Anti-mouse CD19-PE/Cyanine7 (clone 6D5) (rat monoclonal) | BioLegend | AB_313654 (Cat# 115519); AB_313655 (Cat# 115520) | 1:400 |
| Antibody | Anti-mouse CD45R/B220-FITC (clone RA3-6B2) (rat monoclonal) | BD Biosciences | AB_394618 | 1:400 |
| Antibody | Anti-mouse CD21/CD35-PE-CF594 (clone 7G6) (rat monoclonal) | BD Biosciences | AB_2738511 | 1:400 |
| Antibody | Anti-mouse CD138-PE/Cyanine7 Syndecan-1 (clone 281-2) (rat monoclonal) | BioLegend | AB_2562197 (Cat# 142513); AB_2562198 (Cat# 142514) | 1:400 |
| Antibody | Anti-mouse CD27-APC (clone LG.3A10) (Armenian hamster monoclonal) | BD Biosciences | AB_1727455 | 1:400 |
| Antibody | Anti-mouse IgM-APC/Cyanine7 (clone RMM-1) (rat monoclonal) | BioLegend | AB_10690815 (Cat# 406515); AB_10660305 (Cat# 406516) | 1:400 |
| Antibody | CD86-BV510 (clone GL1) (rat monoclonal) | BD Biosciences | Cat# 563077; RRID:AB_2737991 | 1:400 |
| Antibody | Anti-mouse IgM (μ-chain specific) (goat polyclonal M8644) | Sigma | MFCD00145913 | 2 μg/mL |
| Antibody | Anti-mouse IgG1 RMG1-1 (rat monoclonal) | BioLegend | AB_315060 (Cat# 406601); AB_315061 (Cat# 406602) | 2 μg/mL |
| Antibody | Anti-mouse IgG2b (clone R9-91) (rat monoclonal) | BD Biosciences | AB_394834 | 3 μg/mL |
| Antibody | Anti-mouse IgG2c (STAR135) (goat polyclonal) | Bio-Rad | AB_1102666 | 1 μg/mL |
| Antibody | Anti-mouse IgG3 (clone R2-38) (rat monoclonal) | BD Biosciences | AB_394841 | 4 μg/mL |
| Antibody | Anti-mouse IgA (clone C10-3) (rat monoclonal) | BD Biosciences | AB_396541 | 3 μg/mL |
| Antibody | Anti-mouse IgG1 (clone A85-1) (rat monoclonal) | BD Biosciences | AB_393553 | |
| Antibody | Anti-mouse IgG2b (clone R12-3) (rat monoclonal) | BD Biosciences | ||
| Antibody | Anti-mouse AffiniPure anti-mouse IgG, Fcγ subclass 2c specific, (goat polyclonal) | Jackson | JIR 115-065-208 | |
| Antibody | Anti-mouse IgG3 (clone R40-82) (rat monoclonal) | BD Biosciences | ||
| Antibody | Anti-mouse IgA (clone C10-1) (rat monoclonal) | BD Biosciences | ||
| Commercial assay or kit | HiTrap Protein G HP purification column | Bio-Sciences AB | GE17-0404-01 | |
| Commercial assay or kit | Amicon Ultra-15 Centrifugal Filters | Merck Millipore | 30 kDa MWCO | |
| Commercial assay or kit | Automated chemiluminescence immunoassay | ADVIA Centaur XP | ||
| Commercial assay or kit | ELISA kit | Crystal Chem | ||
| Chemical compound, drug | Lumi-Phos | Lumigen | 33% solution in water |
Additional files
Download links
A two-part list of links to download the article, or parts of the article, in various formats.
Downloads (link to download the article as PDF)
Open citations (links to open the citations from this article in various online reference manager services)
Cite this article (links to download the citations from this article in formats compatible with various reference manager tools)
The role of B cells in immune cell activation in polycystic ovary syndrome
eLife 12:e86454.
https://doi.org/10.7554/eLife.86454


