A class-specific effect of dysmyelination on the excitability of hippocampal interneurons
- INMED, INSERM, Aix Marseille Université, France
- INSERM, Institut du Fer à Moulin, Sorbonne Université, Faculté des Sciences et Ingénierie, France
- Department of Basic Sciences, University of Crete Medical School and Institute of Molecular Biology and Biotechnology, Foundation for Research and Technology, University of Crete, Greece
Figures
Figure 1 with 4 supplements
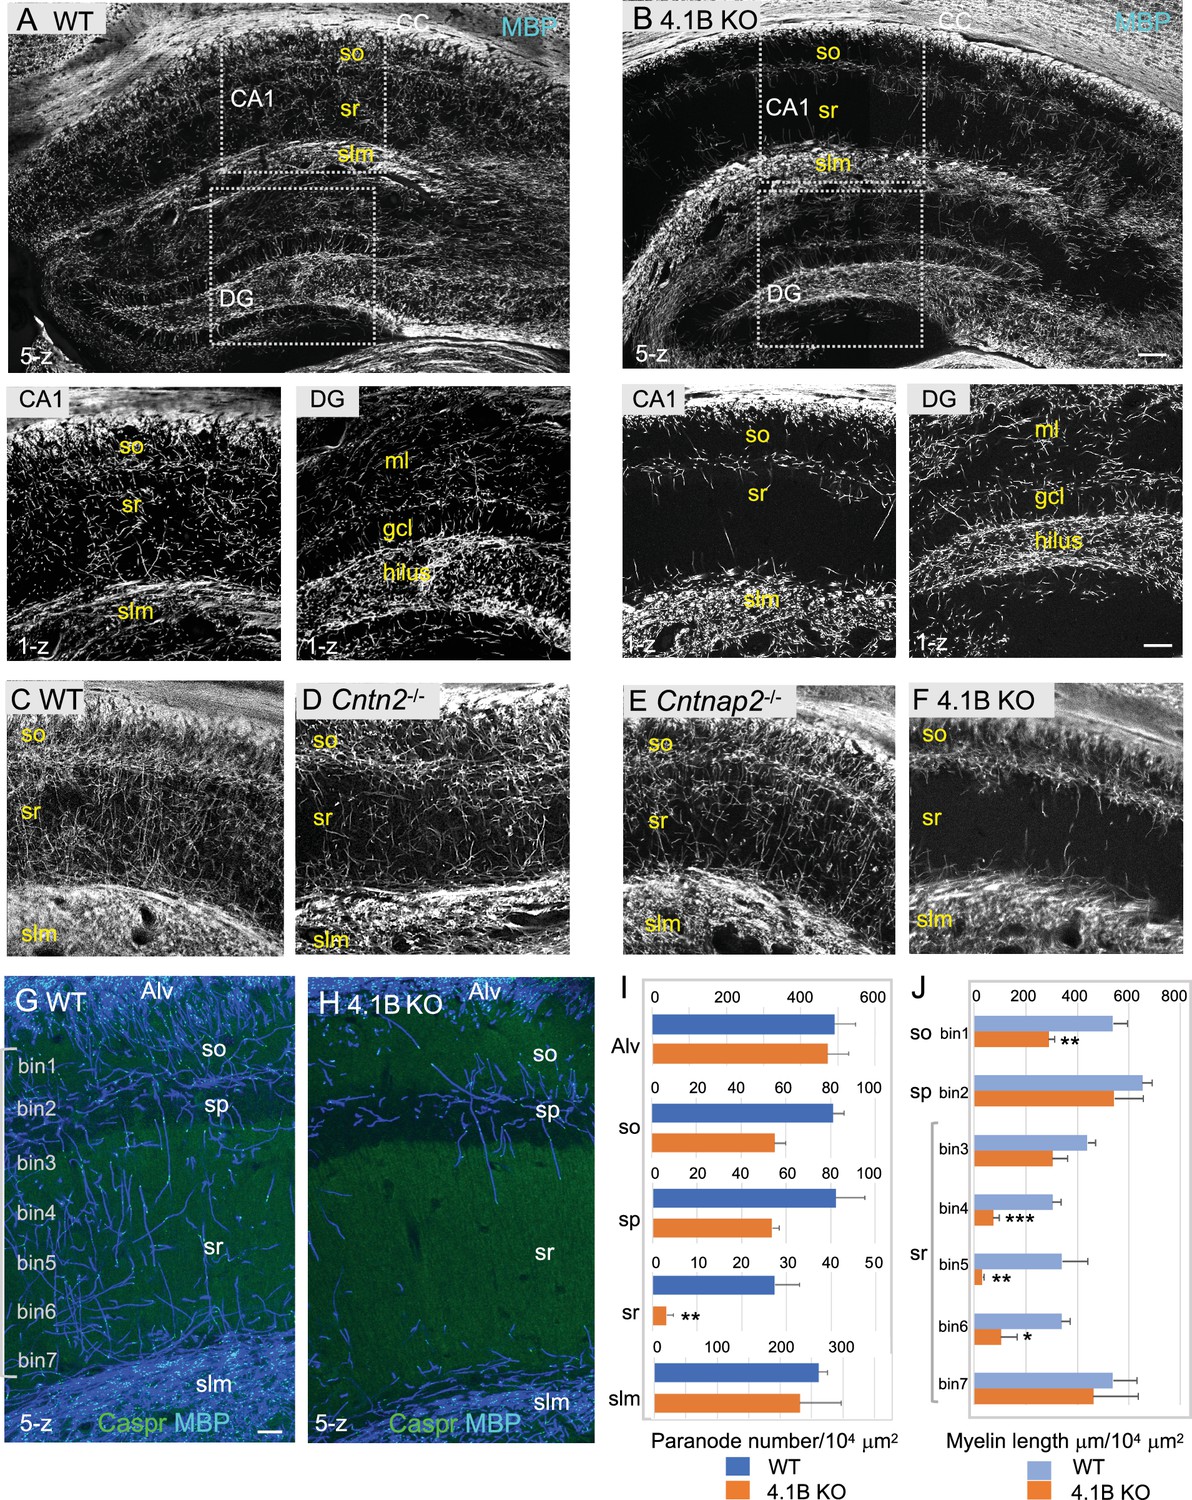
4.1B KO mice show strong reduction of myelin in the adult hippocampus.
(A–B) Hippocampal vibratome sections from P35 wild-type and 4.1B KO mice immunostained for MBP as a myelin marker. Note the lack of myelin sheaths in the CA1 stratum radiatum of the hippocampus whereas myelin of the corpus callosum (CC) is preserved in 4.1B KO mice. Insets show high magnification of CA1 regions and dentate gyrus (DG) (C–F) Hippocampus from P70 wild-type, Cntn2-/-, Cntnap2-/-, and 4.1B KO mice immunostained for MBP. Only 4.1B KO mice show a selective and massive loss of myelin in the stratum radiatum. (G, H) Double-staining for MBP (blue) and Caspr (green) as a paranodal marker. Maximum intensity of confocal images (5-z steps of 2 µm). (I) Quantification of the number of paranodes/104 µm2 in the different layers of the CA1 hippocampus. (J) Quantification of the total myelin length/104 µm2 in the so (bin1), sp (bin2), and sr divided in 5 bins (40x300 µm). Mean ± SEM of 4 mice for each genotype. Significant difference by comparison with wild-type: * p<0.05, ** p<0.01, and *** p<0.001 using the Student’s t test. Alv: Alveus, so: stratum oriens, sp: stratum pyramidale, sr: stratum radiatum, slm: stratum lacunosum moleculare, ml: molecular layer, gcl: granule cell layer. Bar: 200 µm in (A, B) 50 µm in insets and (C–F) 25 µm in (G, H).
-
Figure 1—source data 1
Length of myelinated axons and paranode density in the different layers of the CA1 hippocampus of wild-type and 4.1B KO mice.
- https://cdn.elifesciences.org/articles/86469/elife-86469-fig1-data1-v2.xlsx
Figure 1—figure supplement 1
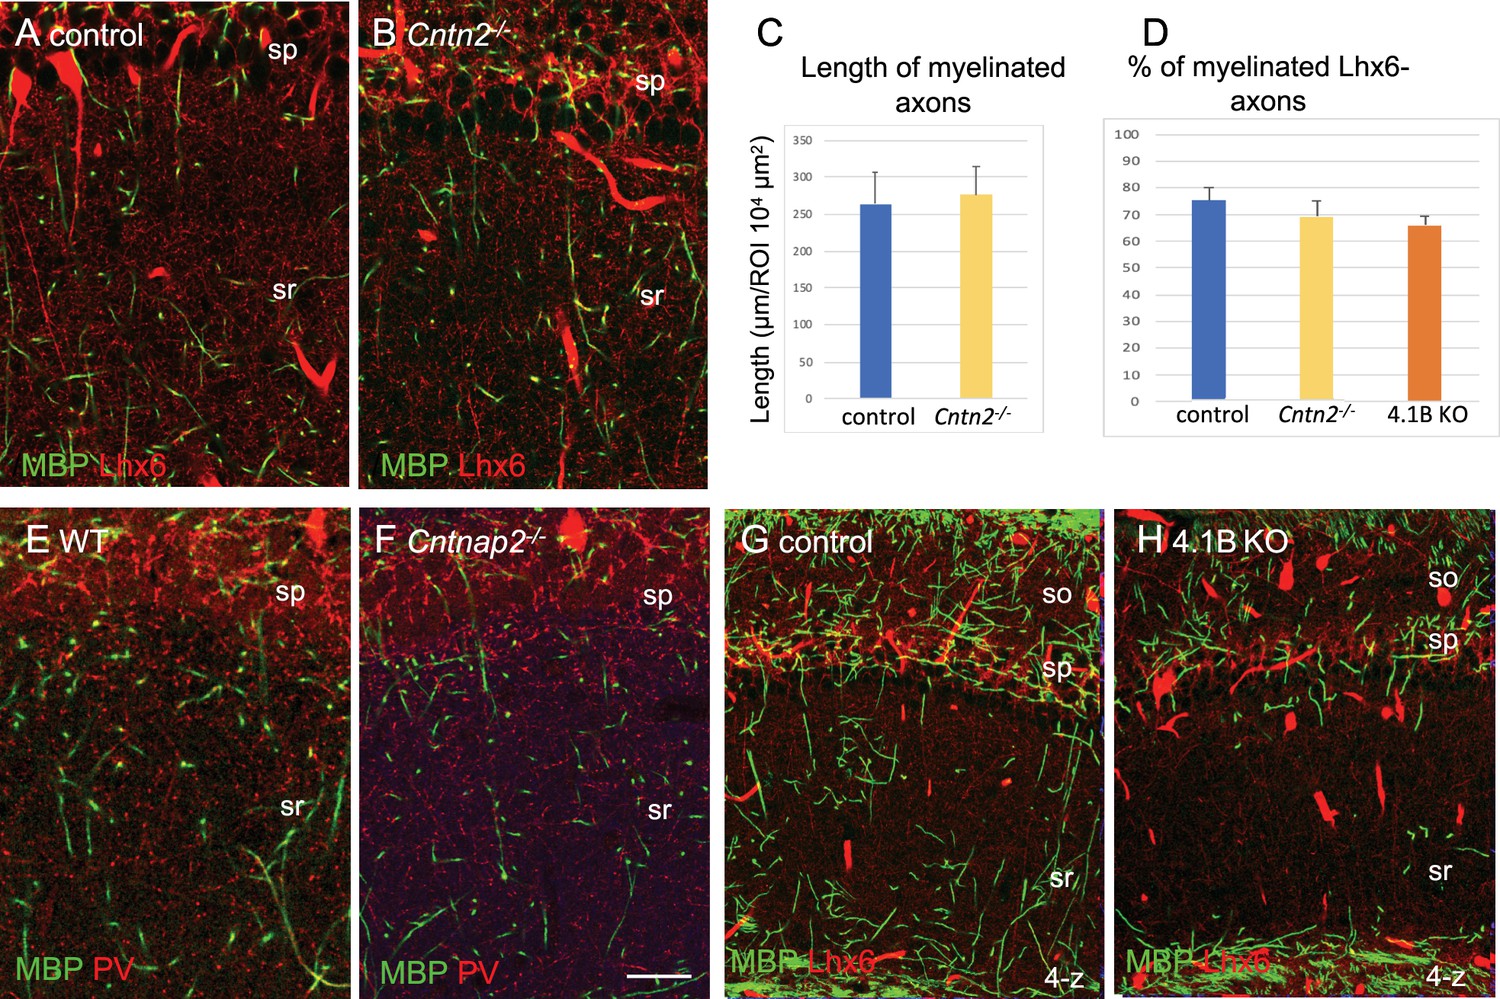
Myelin pattern in the CA1 hippocampus of Cntn2-/-, Cntnap2-/-, and 4.1B KO mice.
CA1 hippocampus stained for MBP (green). (A, B, G, H) Lhx6-Cre;tdTomato mice: control (A, G), Cntn2-/- (B) and 4.1B KO (H) mice at P70 showing axons of PV and SST cells expressing the tdTomato (red). Note that the blood vessels are fluorescent. Single confocal image (A, B) or maximum intensity of confocal images of 4-z steps of 2 µm (G, H). (E, F) CA1 hippocampus of wild-type and Cntnap2-/- mice at P70 immunostained for MBP (green) and PV (red). Bar: 20 µm. (C, D) Quantification of total myelin length/104 µm2 in the stratum radiatum of control and Cntn2-/- mice and percentage of myelinated Lhx6-expressing axons in control, Cntn2-/- and 4.1B KO mice at P35. Mean ± SEM of 3 mice/genotype. No significant difference by comparison with control (p=0.4, p=0.3, and p=0.3, respectively; Mann-Whitney test).
Figure 1—figure supplement 2

Myelin pattern is preserved in the cortex of 4.1B KO mice at P70.
Coronal brain sections showing the somato-sensory cortex of Lhx6-Cre;tdTomato control (A) and 4.1B KO (B) mice at P70. Double-staining for MBP (Cyan) and Caspr (green). Note in the inset that the myelin pattern (grey) is preserved in the cortical layer 2/3 of 4.1B KO mice. Bar: 100 µm, insets: 20 µm.
Figure 1—figure supplement 3
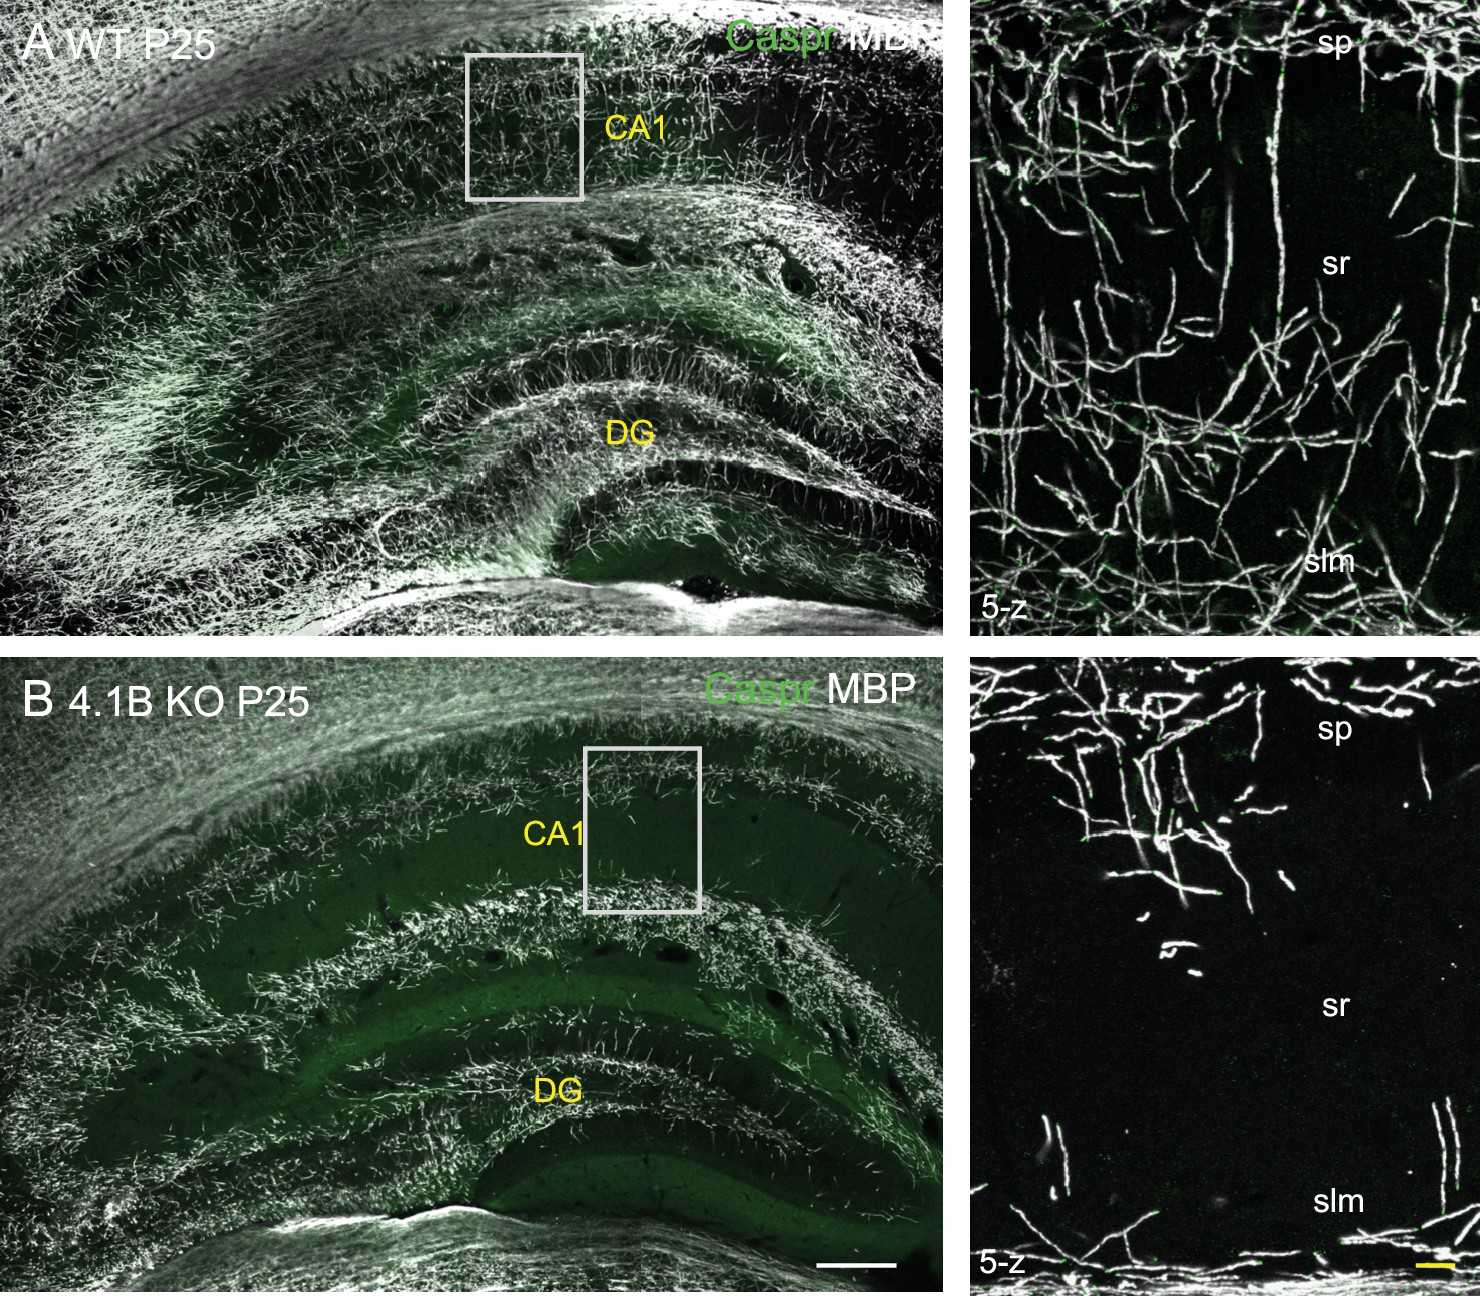
Myelin pattern alteration in the hippocampus of 4.1B KO mice at P25.
Hippocampus from P25 wild-type and 4.1B KO mice immunostained for MBP (grey) and caspr (green). Note the severe loss of myelin sheaths in the CA1 stratum radiatum of the 4.1B-deficient hippocampus at early stage. Bar: 200 µm in (A, B) 25 µm in the insets.
Figure 1—figure supplement 4
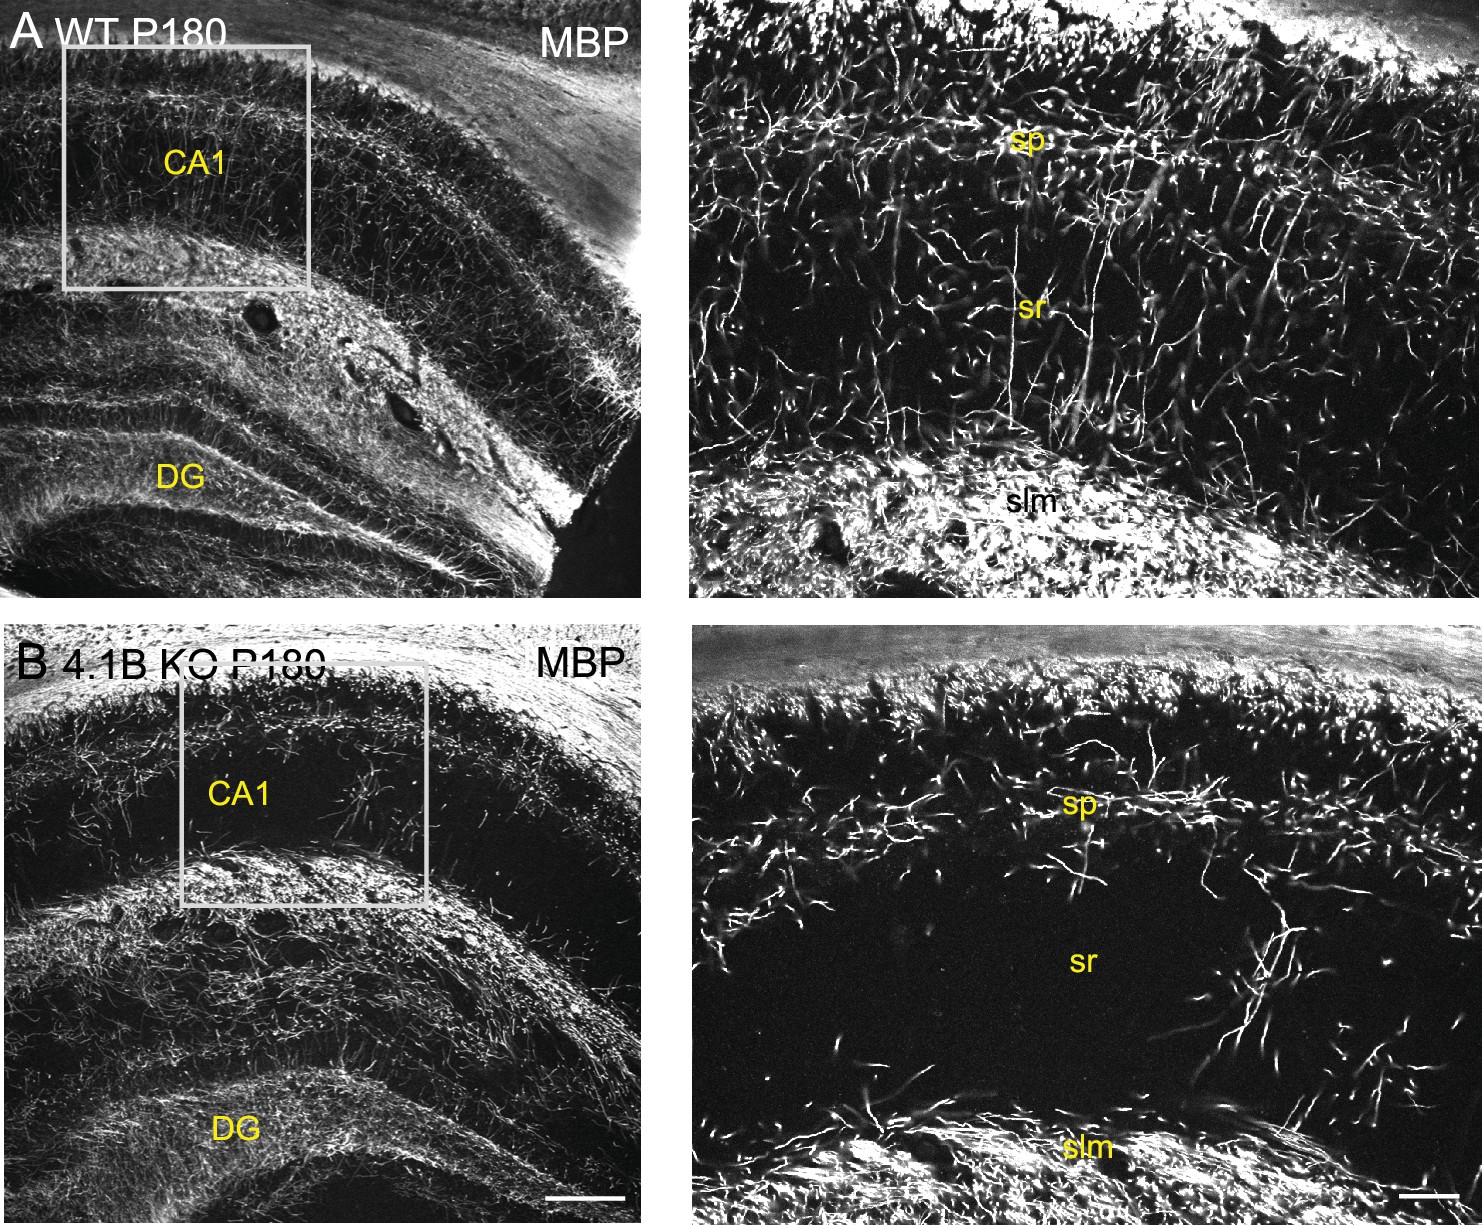
Myelin pattern alteration in the hippocampus of 4.1B KO mice at P180.
Hippocampus from P180 wild-type and 4.1B KO mice immunostained for MBP (grey). Note the severe loss of myelin sheaths in the CA1 stratum radiatum of the 4.1B-deficient hippocampus that persists at mature stages. Bar: 200 µm in (A, B) 50 µm in the insets.
Figure 2
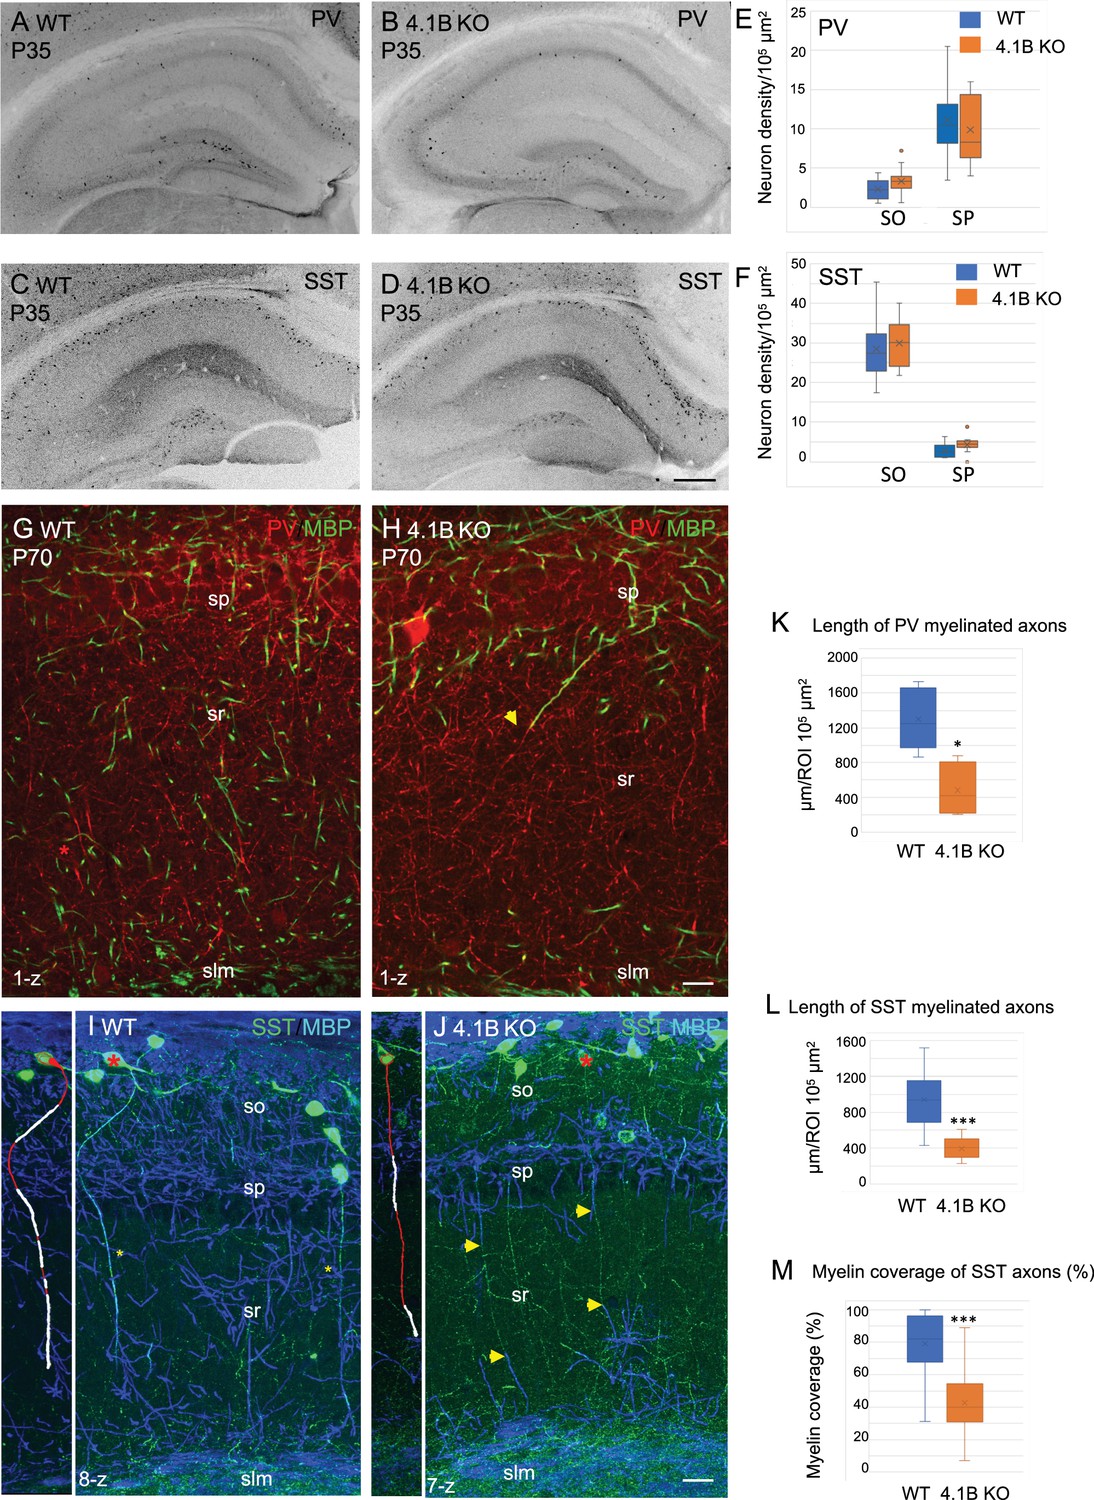
Parvalbumin and somatostatin axons are dysmyelinated in the 4.1B KO hippocampus.
(A–D) Hippocampal sections of wild-type and 4.1B KO mice immunostained for PV (A, B) or SST (C, D) at P35. (E, F) Quantification of the cell density/105 µm2 in the CA1 stratum oriens (SO) and stratum pyramidale (SP). No statistical difference in cell density between the genotypes (PV cell density: SO, p=0.108; SP, p=0.412 and SST cell density: SO, p=0.493; SP, p=0.057; Student’s t test; n=10–12 ROIs in hippocampal sections at 2 levels in the antero-posterior axis, 3 mice/genotype). (G, H) Double-staining for PV (red) and MBP (green) at P70 showing that PV axons are present in the stratum radiatum and poorly myelinated in the 4.1B KO mice (H). The arrow in H points to a PV axon, which is partly myelinated. (K) Quantification of the total length of PV myelinated axon/105 µm2 in the stratum radiatum at P70 (n=5 ROIs, 3 mice/genotype). (I, J) Double-staining for SST (green) and MBP (blue) at P35 showing O-LM SST cells in the stratum oriens extending their axon through the stratum radiatum to project into the stratum lacunosum moleculare. Insets show 3D reconstructions of myelinated O-LM neurons indicated with red asterisks (myelin in white). Note that SST axons in the stratum radiatum are fully myelinated in the WT (asterisks in I) and partly myelinated in 4.1B KO mice (arrows in J). (L, M) Quantitative analyses of the total length of SST myelinated axon/105 µm2 in the stratum radiatum at P35 (n=10 ROIs, 3 mice/genotype) and the percentage of myelin coverage of individual SST axons (n=29–35 axons, 3 mice/genotype; the mean length of selected axons is 174±9 µm in WT and 197±12 µm in 4.1B KO mice). Significant difference by comparison with wild-type: * p<0.05; *** p<0.001; Mann-Whitney test. Bar: 200 µm in (A-D) 20 µm in (G, H) 25 µm in (I, J).
-
Figure 2—source data 1
Density of PV and SST cells and length of myelinated PV and SST axons in the hippocampus of wild-type and 4.1B KO mice.
- https://cdn.elifesciences.org/articles/86469/elife-86469-fig2-data1-v2.xlsx
Figure 3
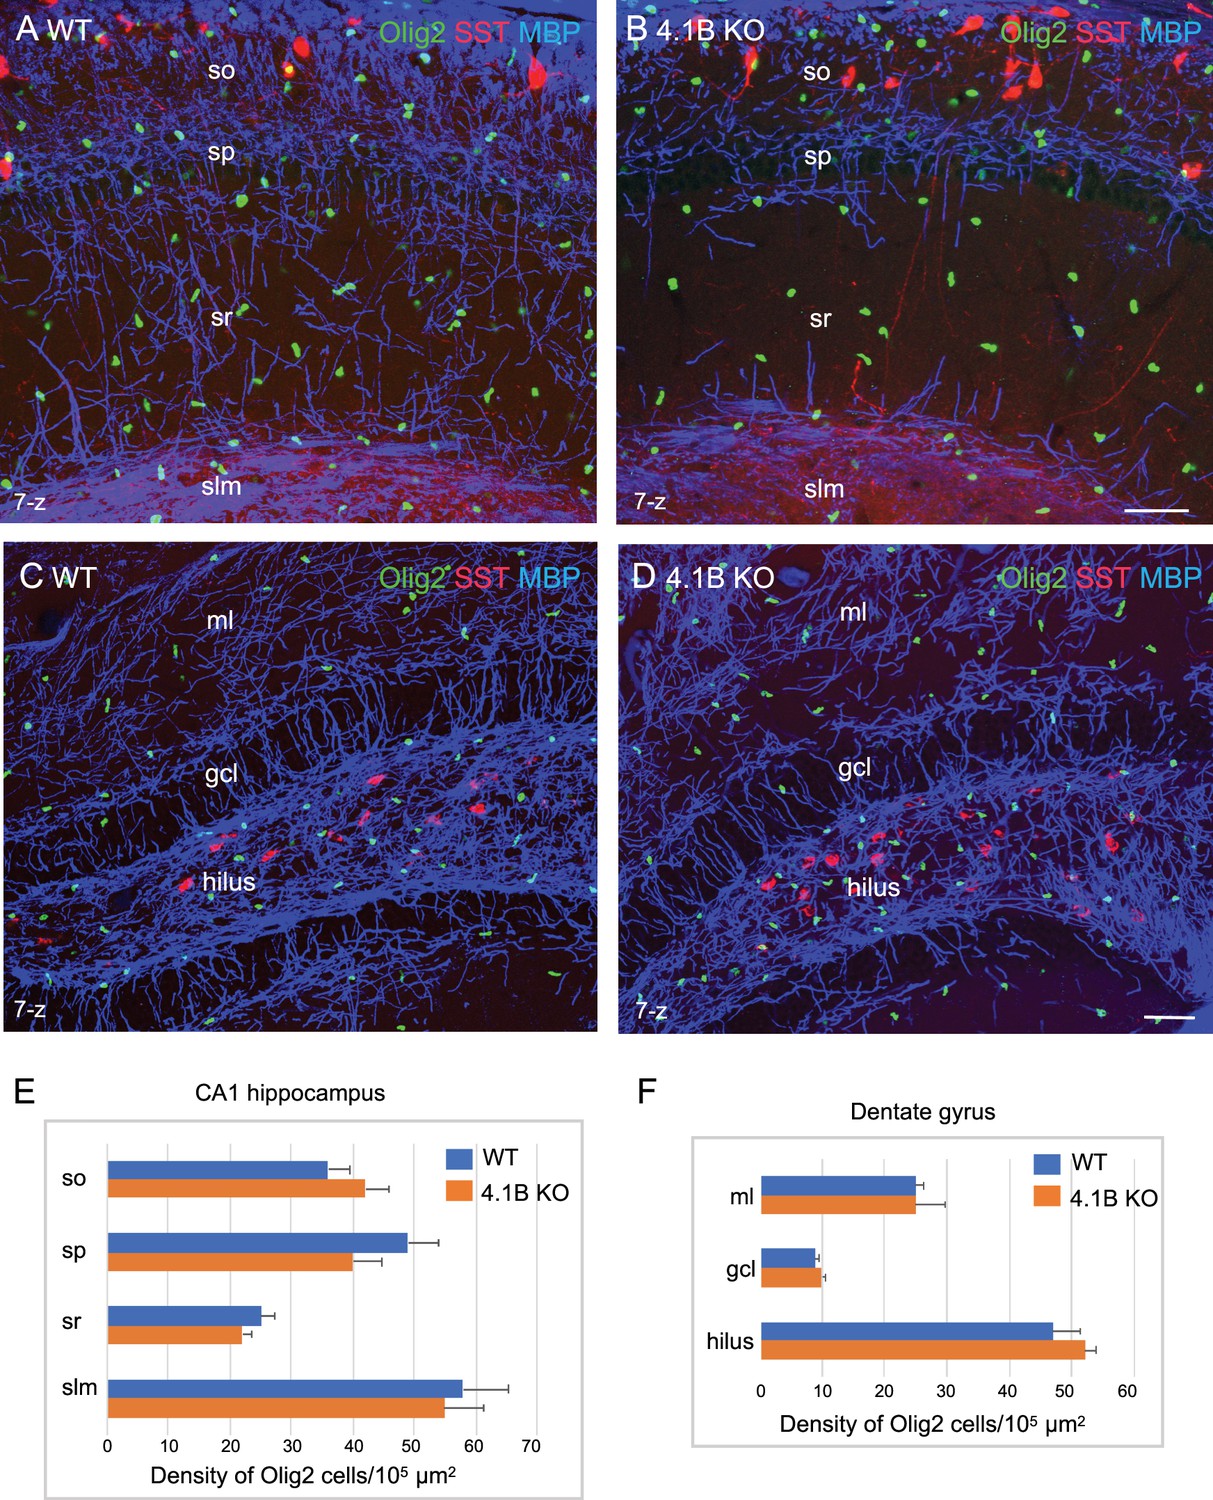
The density of oligodendroglial cells is preserved in the 4.1B KO hippocampus.
Hippocampal sections of wild-type and 4.1B KO mice at P35 immunostained for MBP (blue), SST (red) and Olig2 (green) as a marker of the oligodendrocyte lineage. CA1 region (A, B) and dentate gyrus (C, D), maximum intensity of confocal images from 7-z steps of 2 µm. Bar: 50 µm. (E, F) Quantitative analysis of the density in Olig2-positive cells/105 µm2 in the different layers of the CA1 hippocampus (n=11–12 ROIs, 3 mice/genotype) and dentate gyrus (ml: molecular layer; gcl: granular cell layer; n=3 ROIs; 3 mice/genotype). No significant difference between the genotypes (so: p=0.311; sp: p=0.171; sr: p=0.262; slm: p=0.806; ml: p=1; gcl: p=0.491; hilus: p=0.262; Student’s t test).
-
Figure 3—source data 1
Density of Olig2-positive cells in the CA1 hippocampus and dentate gyrus of wild-type and 4.1B KO mice.
- https://cdn.elifesciences.org/articles/86469/elife-86469-fig3-data1-v2.xlsx
Figure 4

4.1B is enriched at paranodes of GABAergic axons and involved in internodal elongation.
(A) Schematic drawing to depict the role of 4.1B at paranodes mediating the anchorage between Caspr and the ßII-spectrin at the boundary with the nodal ßIV-spectrin. (B) Distribution of internodal lengths as percentage. Quantitative analysis was performed on hippocampal sections of Lhx6-Cre;tdTomato control and 4.1B KO mice at P70 immunostained for MBP and Caspr. Confocal imaging of 25–50 µm width z-stack were used to measure the length of myelin sheaths between two paranodes in the CA1 region (n=275 in control and n=191 in 4.1B KO mice). Significant difference by comparison with control: * p<0.05; Mann-Whitney test (Means ± SEM of 4 ROIs from 2 mice/genotype). (C–E) Hippocampal sections of 4.1B KO (C) and wild-type (D–F) mice at P35 immunostained for MBP (blue), PV or SST (red) and 4.1B (green). Note that 4.1B is detected at the soma of PV interneurons (D). As a control for specificity, no staining is detected in 4.1B-deficient hippocampus (C). 4.1B is enriched at paranodes and not detected at the nodal gap (arrows) in myelinated PV (E) and SST (F) axons. Bar: 10 µm in (C, D) 5 µm in (E, F).
-
Figure 4—source data 1
Internodal length of myelinated axons in the CA1 hippocampus of control and 4.1B KO mice.
- https://cdn.elifesciences.org/articles/86469/elife-86469-fig4-data1-v2.xlsx
Figure 5 with 1 supplement
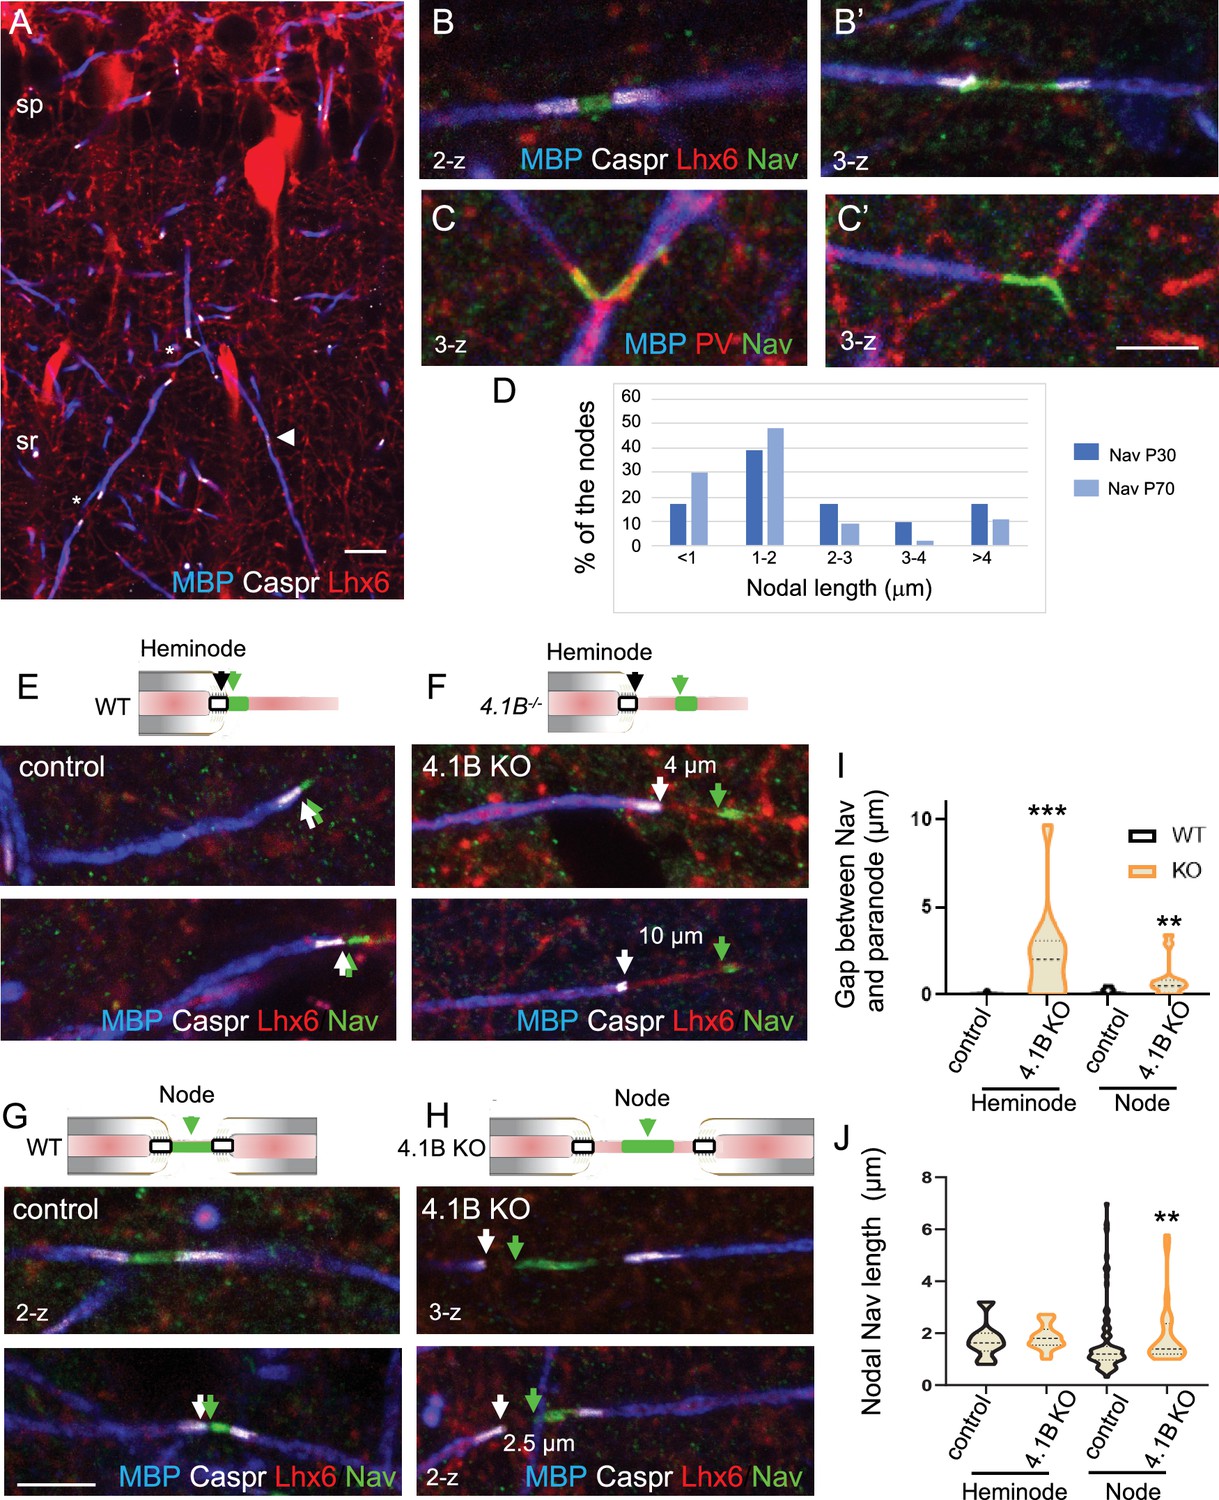
Misplacement of heminodal and nodal of Nav channels in 4.1B-deficient GABAergic axons.
Hippocampal sections of P70 Lhx6-Cre;tdTomato control and 4.1B KO mice were immunostained for MBP (blue), Caspr (white) and panNav (green). tdTomato expressed in Lhx6-positive cells or PV immunostaining (C) is in red. (A) shows a branched myelinated Lhx6 axon with contiguous (arrowhead) and spaced (asterisks) internodes. Immunostaining for panNav at nodes with different lengths (B, B’) and at branch points (C, C’). (D) Distribution of nodal lengths in Lhx6-positive axons at P30 and P70 in CA1 expressed as percentages. The length of nodal Nav was measured between two paranodes (n=41 at P30 and n=64 at P70, 2 mice/age). (E–J) Clustering of Nav channels at the heminodes (E, F) and nodes (G, H) of control and 4.1B KO mice in the CA1 hippocampus. Nav clusters are close to paranodes both at heminodes (E) and nodes (G) in control GABAergic axons (arrows). In contrast, a gap is frequently observed between Nav clusters and paranodes at heminodes (F) and nodes (H) in 4.1B-deficient GABAergic axons (arrows). Confocal images with maximum intensity of 2-z or 3-z steps of 1 µm. Bar: 10 µm in (A) 5 µm in (B, C, E–H). (I) Quantitative analysis of the distance between Nav cluster and paranode at heminodes and nodes. (J) Quantitative analysis of the length of nodal Nav cluster at heminodes and nodes. Significant difference by comparison with wild-type: ** p<0.01; *** p<0.001; Mann-Whitney test (heminodes: n=25/genotype; nodes: n=87 in control and n=26 in 4.1B KO mice, 2–3 mice/genotype).
-
Figure 5—source data 1
Length and positioning of Nav channels in GABAergic axons of control and 4.1B KO mice.
- https://cdn.elifesciences.org/articles/86469/elife-86469-fig5-data1-v2.xlsx
Figure 5—figure supplement 1
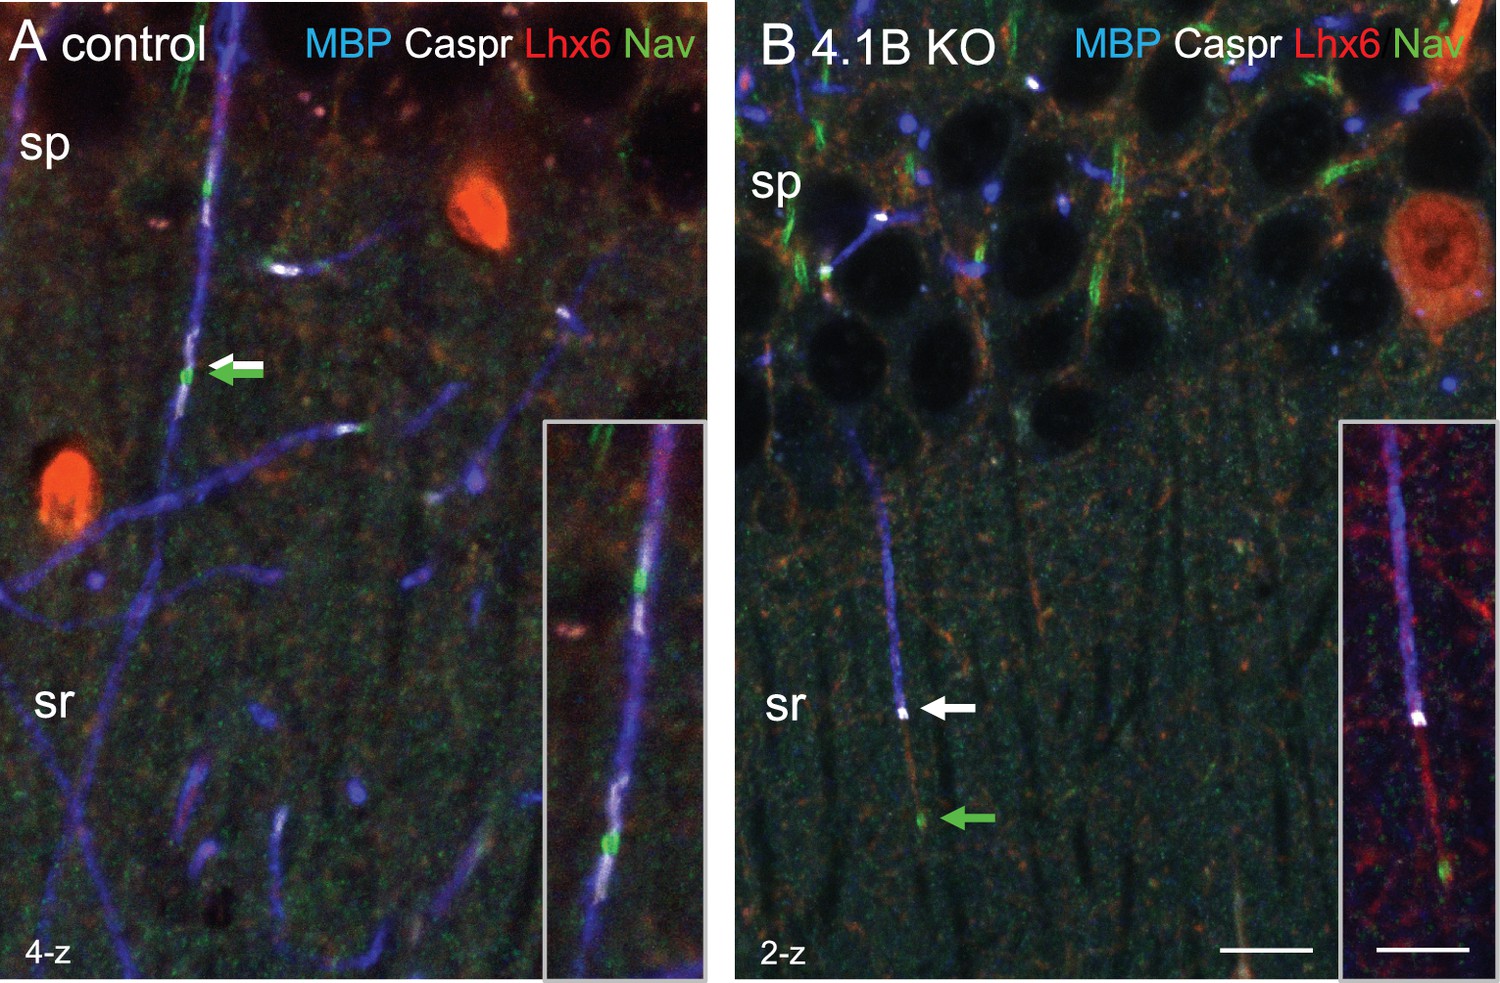
Myelination and positioning of Nav channels are altered in 4.1B-deficient GABAergic axons.
Hippocampal sections of P70 Lhx6-Cre;tdTomato control and 4.1B KO mice were immunostained for MBP (blue), Caspr (white) and panNav (green). tdTomato expressed in Lhx6-positive cells is in red. (A) a control myelinated Lhx6-positive axon crossing the stratum radiatum showing nodes of Ranvier (A, arrows). (B) a partially myelinated Lhx6-positive axon displays a large gap between the Nav cluster and heminode in 4.1B-deficient hippocampus (B, arrows). Confocal images with maximum intensity of 2-z or 4-z steps of 1 µm. Bar: 10 µm, insets: 14 µm.
Figure 6
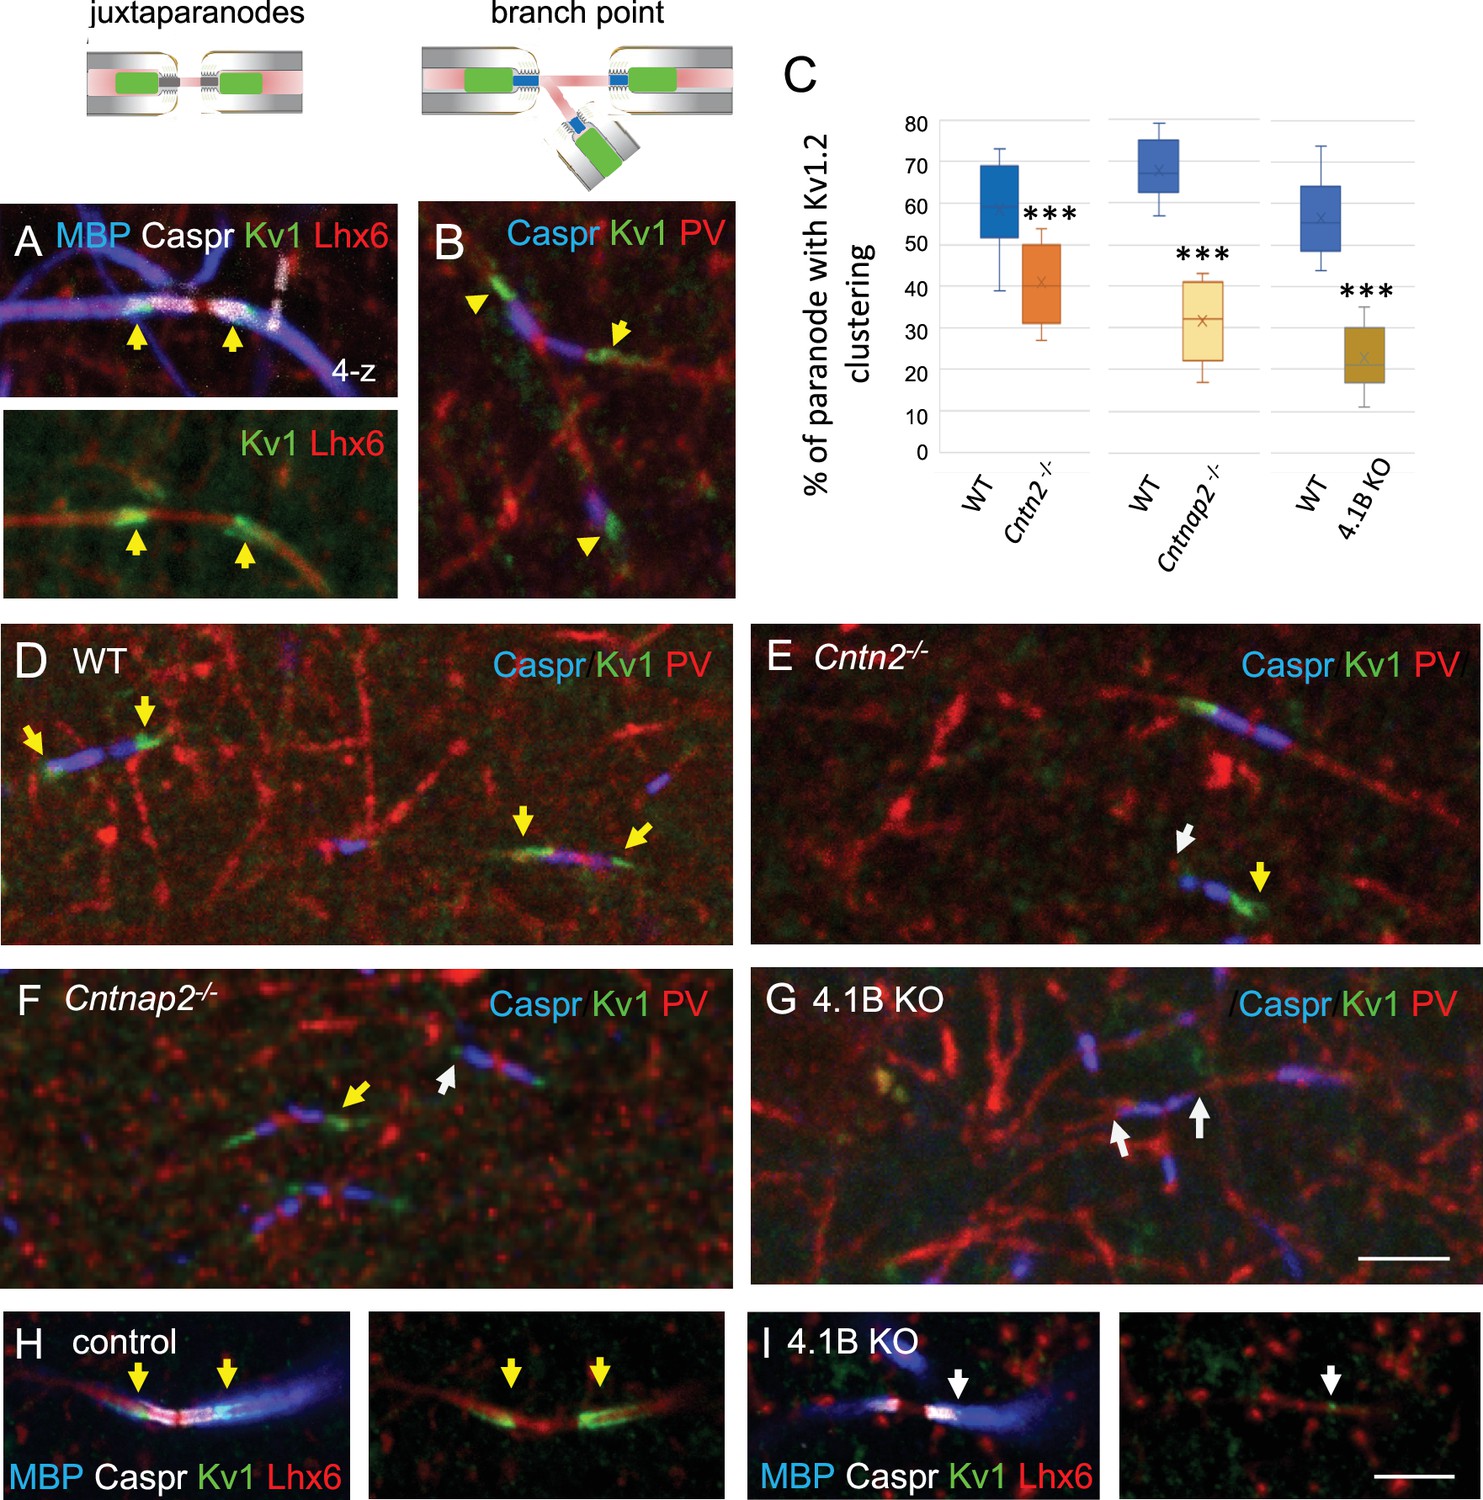
The clustering of juxtaparanodal Kv1 channels is reduced in GABAergic axons from Cntn2-/-, Cntnap2-/-, and 4.1 KO mice.
Immunostaining for Kv1.2 channels in GABAergic axons of the stratum radiatum in CA1 at P70. (A) Juxtaparanodal clustering of Kv1 channels in Lhx6-Cre;tdTomato control mouse immunostained for MBP (blue), Caspr (white) and Kv1.2 (green). tdTomato expressed in Lhx6-positive cells is in red. (B) Juxtaparanodal clustering of Kv1 channels (green) in wild-type at PV axon branch point (red) with paranodes stained for Caspr (blue). (C) Quantification of the percentage of paranodes associated with Kv1.2 clustering in the PV axons of the CA1 stratum radiatum. Mutant mice are compared with their respective controls. Means ± SEM of 7–11 ROIs from 3 mice/genotype. Significant difference by comparison with wild-type: *** p<0.001 using the Mann-Whitney test. (D–G) Immunostaining for Kv1.2 (green) in wild-type (D), Cntn2-/- (E), Cntnap2-/- (F), and 4.1B KO (G) PV axons (red) with paranodes stained for Caspr (blue). Yellow arrows point to juxtaparanodal clustering of Kv1 in control or mutant mice and white arrows indicate the lack of proper Kv1 clustering in mutants. Loss of Kv1 clustering is also observed in 4.1B KO crossed with Lhx6-Cre;tdTomato mice (I compared to control in H). Bar: 5 µm.
-
Figure 6—source data 1
Juxtaparanodal clustering of Kv1 channels in PV axons of wild-type, Cntn2-/-, Cntnap2-/-, and 4.1 KO mice.
- https://cdn.elifesciences.org/articles/86469/elife-86469-fig6-data1-v2.xlsx
Figure 7
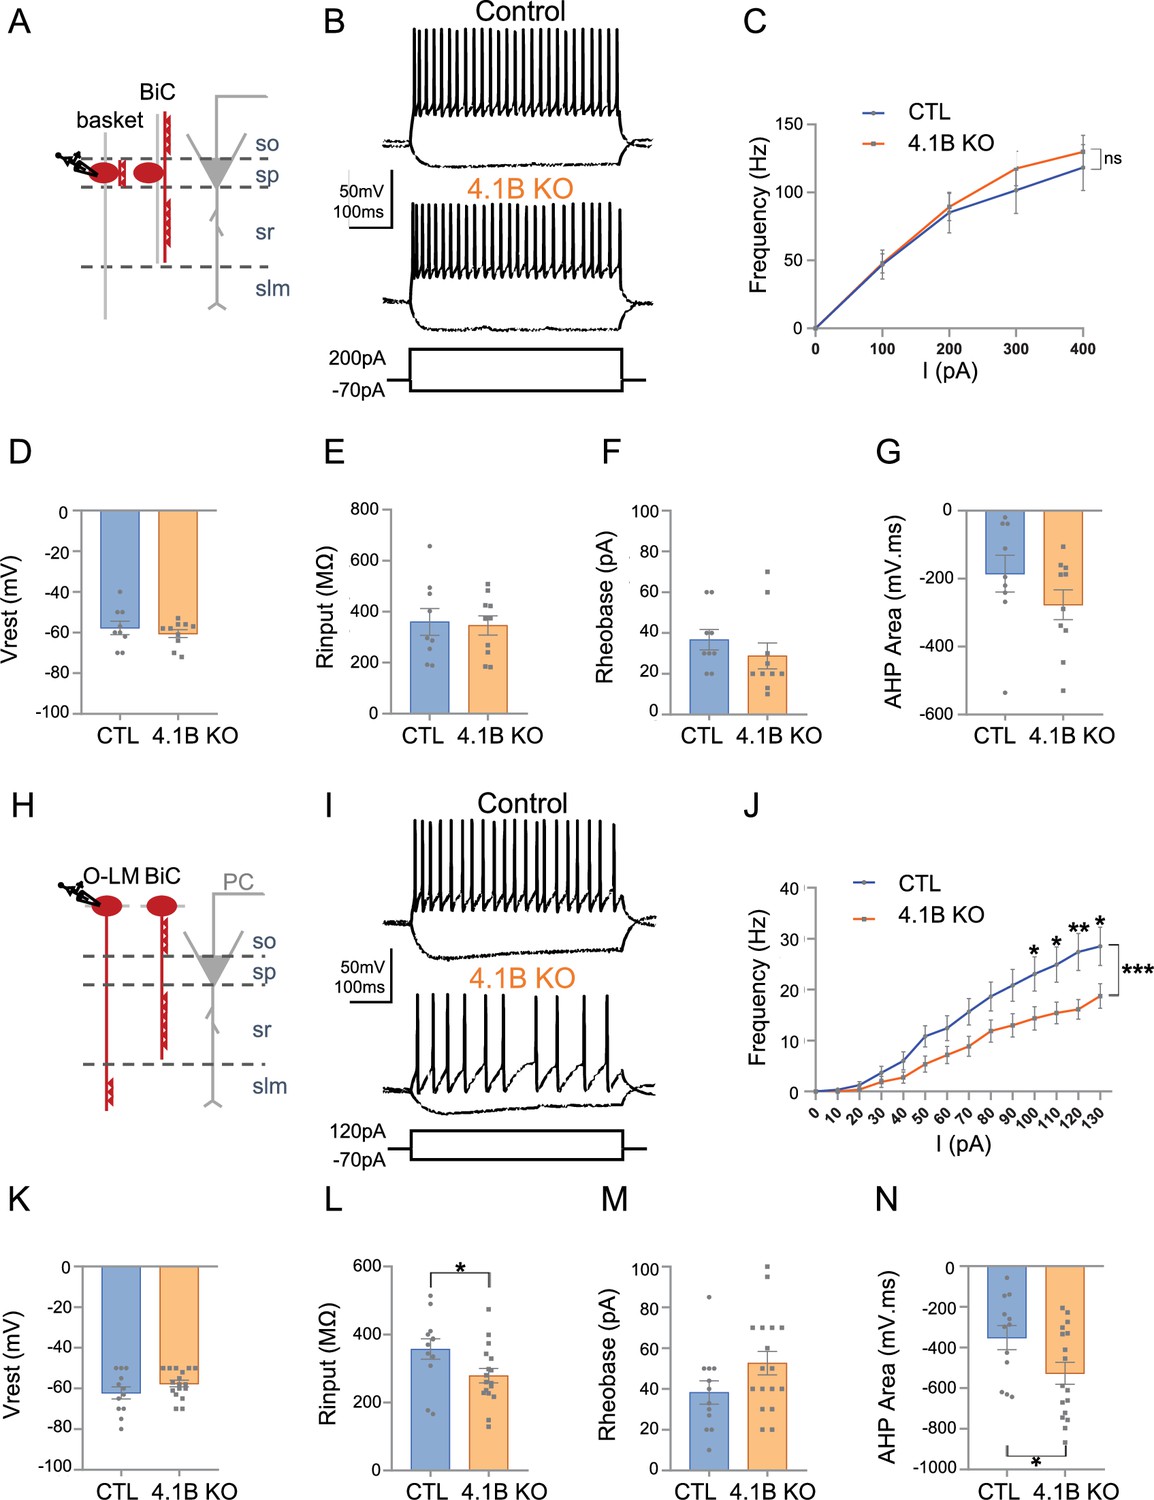
The excitability of SST interneurons in the stratum oriens is selectively decreased in 4.1B KO mice.
(A–G) Patch-clamp recordings of Lhx6-positive PV fast-spiking interneurons in the stratum pyramidale (SP). (A) Schematic illustration of basket and bistratified (BiC) cells in CA1 located in the SP and innervating the soma and dendrites of a pyramidal cell (PC). (B) Typical fast-spiking activity evoked by a 200 pA stimulation during 500ms showing similar firing patterns of 4.1B-deficient and control PV cells. (C) F-I relationship of mean spike frequency depending on current intensities is not different between the genotypes. The resting membrane potential (Vrest) (D), input resistance (Rinput) (E), rheobase (F) and afterhyperpolarization (AHP) area (G) are not affected in 4.1B KO mice. Means ± SEM. Detailed statistical analysis using Mann-Whitney test, see Table 1. (H–N) Patch-clamp recordings of Lhx6-positive interneurons in the stratum oriens (SO) from control and 4.1B KO mice. (H) O-LM and bistratified cells in CA1 located in the SO and innervating PC dendrites. (I) Example of continuous spike train discharge elicited by a 120 pA depolarizing current pulse during 500ms and voltage response to a –70 pA hyperpolarizing current in control and 4.1B KO mice. (J) F-I curves. The mean frequency is significantly reduced in 4.1B-deficient inhibitory neurons compared to controls (two-way ANOVA, ***p<0.0001, **p<0.01, *p<0.05). (K) The resting membrane potential is not affected. (L) The Rinput is significantly decreased and the rheobase (M) is not changed. (N) The AHP area of individual AP is significantly increased (*p<0.05, Mann-Whitney test). For a detailed statistical summary of intrinsic parameters, see Table 1 and Table 2 (n=6–9 mice/genotype).
-
Figure 7—source data 1
Electrophysiological properties of Lhx6-positive PV fast-spiking interneurons in the stratum pyramidale from control and 4.1B KO mice.
- https://cdn.elifesciences.org/articles/86469/elife-86469-fig7-data1-v2.xlsx
-
Figure 7—source data 2
Electrophysiological properties of Lhx6-positive interneurons in the stratum oriens from control and 4.1B KO mice.
- https://cdn.elifesciences.org/articles/86469/elife-86469-fig7-data2-v2.xlsx
Figure 8
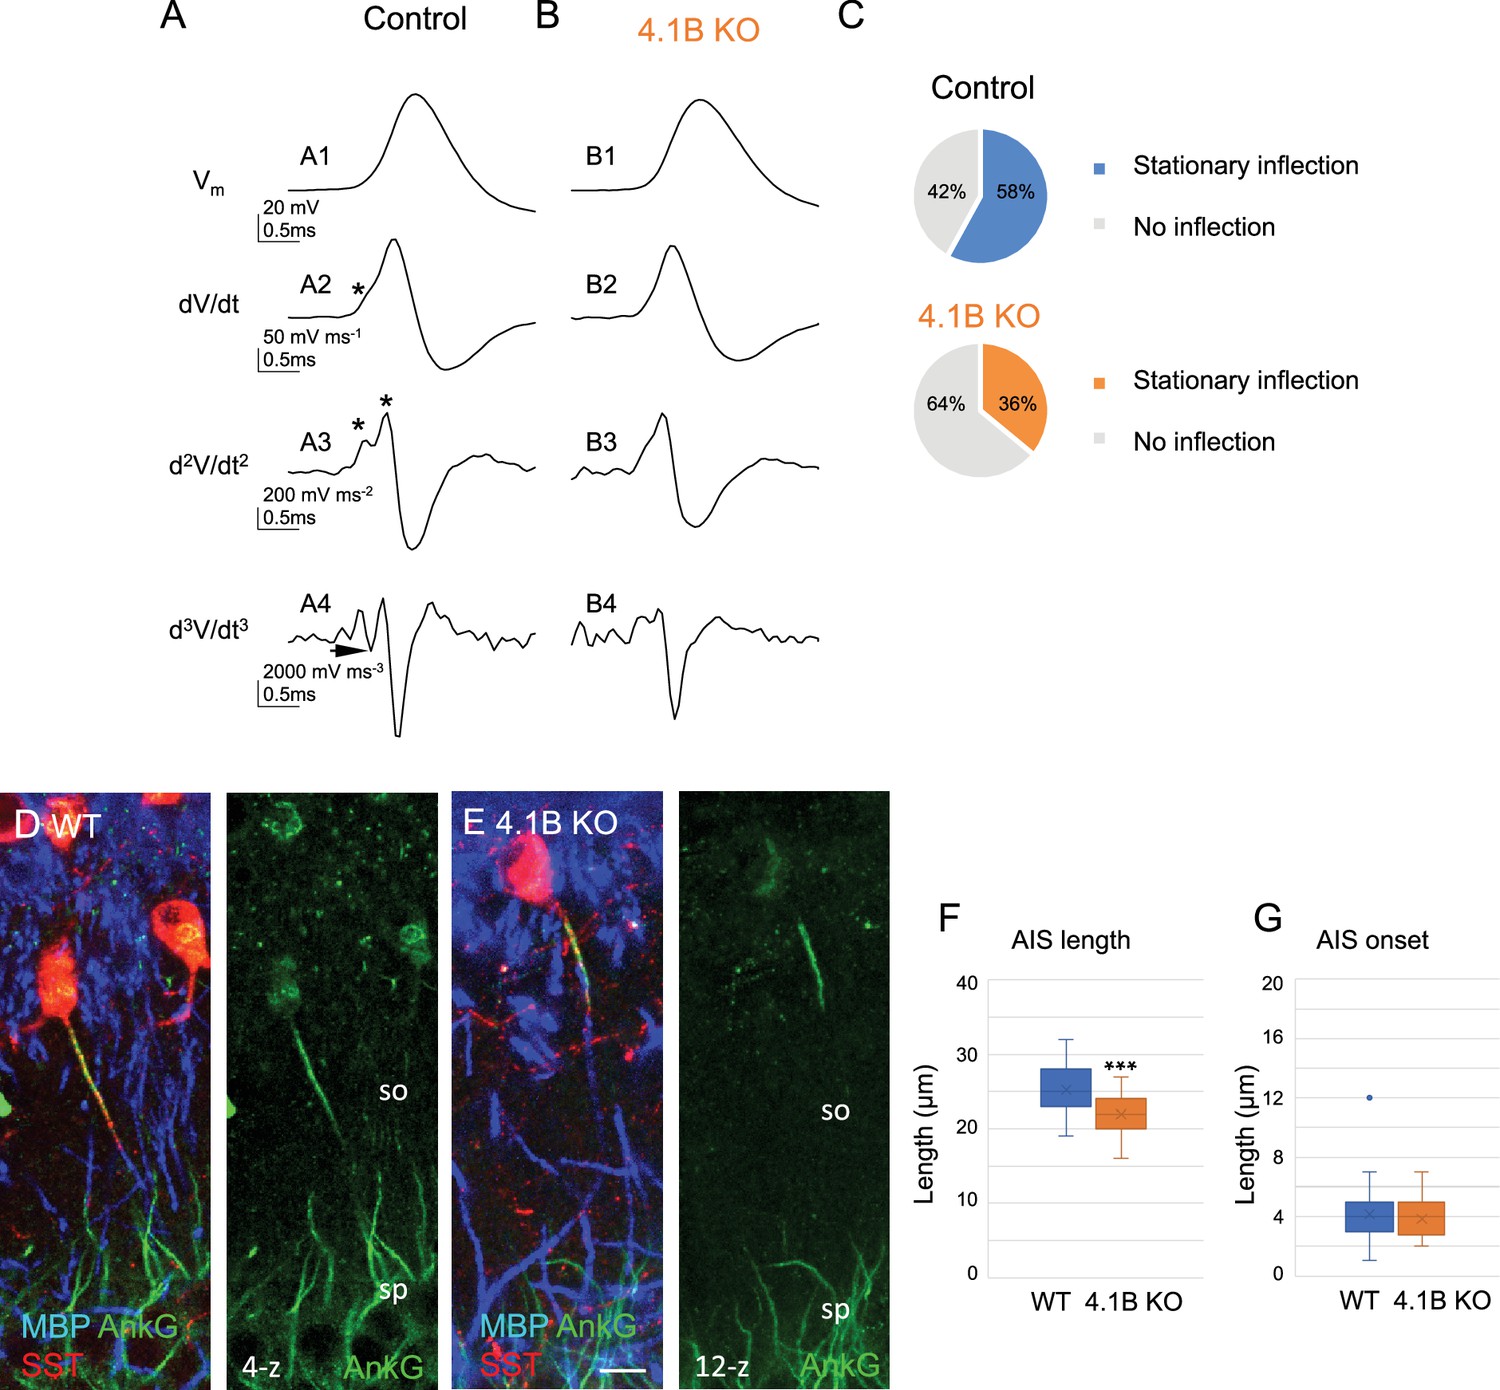
Structural modification of the AIS of SST interneurons in 4.1B KO mice.
(A–C) Analysis of somatic action potentials (APs). Representative examples illustrating the voltage waveform of the AP (A1 and B1; in mV) from a control (A1) and a 4.1B KO neurons (B1). Below are presented the first (A2 and B2; dV/dt, in mV/ms), second (A3 and B3; d2V/dt2, in mV/ms2), and third derivatives (A4 and B4; d3V/dt3, in mV/ms3). The stationary inflection in the d2V/dt2 trace is indicated with asterisks. The third derivative allows to detect the second inflection point when the trace reaches or goes under zero (arrow). (C) We observed a second inflection point in 58% of control (top pie graph) and 35% of 4.1B-deficient cells (bottom pie graph). This difference in the number of cells displaying an inflection point (asterisks in A2 and A3) is significant (p=0.017, Fisher’s exact test) (n=12 cells from 9 control mice and n=17 cells from 8 4.1B KO mice). This could be due to the AIS shortening in 4.1B-deficient SST interneurons. (D, E) Hippocampal sections of wild-type (D) and 4.1B KO (E) mice at P35 immunostained for MBP (blue), SST (red) and AnkyrinG (green). Confocal images with maximum intensity of z-steps of 0.54 µm. (F) Length of AIS measured for AnkyrinG immunostaining of SST interneurons in the stratum oriens (SO). Significant difference by comparison with wild-type: *** p<0.0001 using Mann-Whitney test. (G) Distance of AIS onset from the soma is not changed between wild-type and 4.1B KO mice (p=0.6509, Mann-Whitney test; n=30 cells in wild-type and 4.1B KO mice; 3mice/genotype). Bar: 10 µm in (D, E).
-
Figure 8—source data 1
Length and onset of AIS measured for AnkyrinG immunostaining of SST interneurons in the stratum oriens of wild-type and 4.1B KO mice.
- https://cdn.elifesciences.org/articles/86469/elife-86469-fig8-data1-v2.xlsx
Figure 9
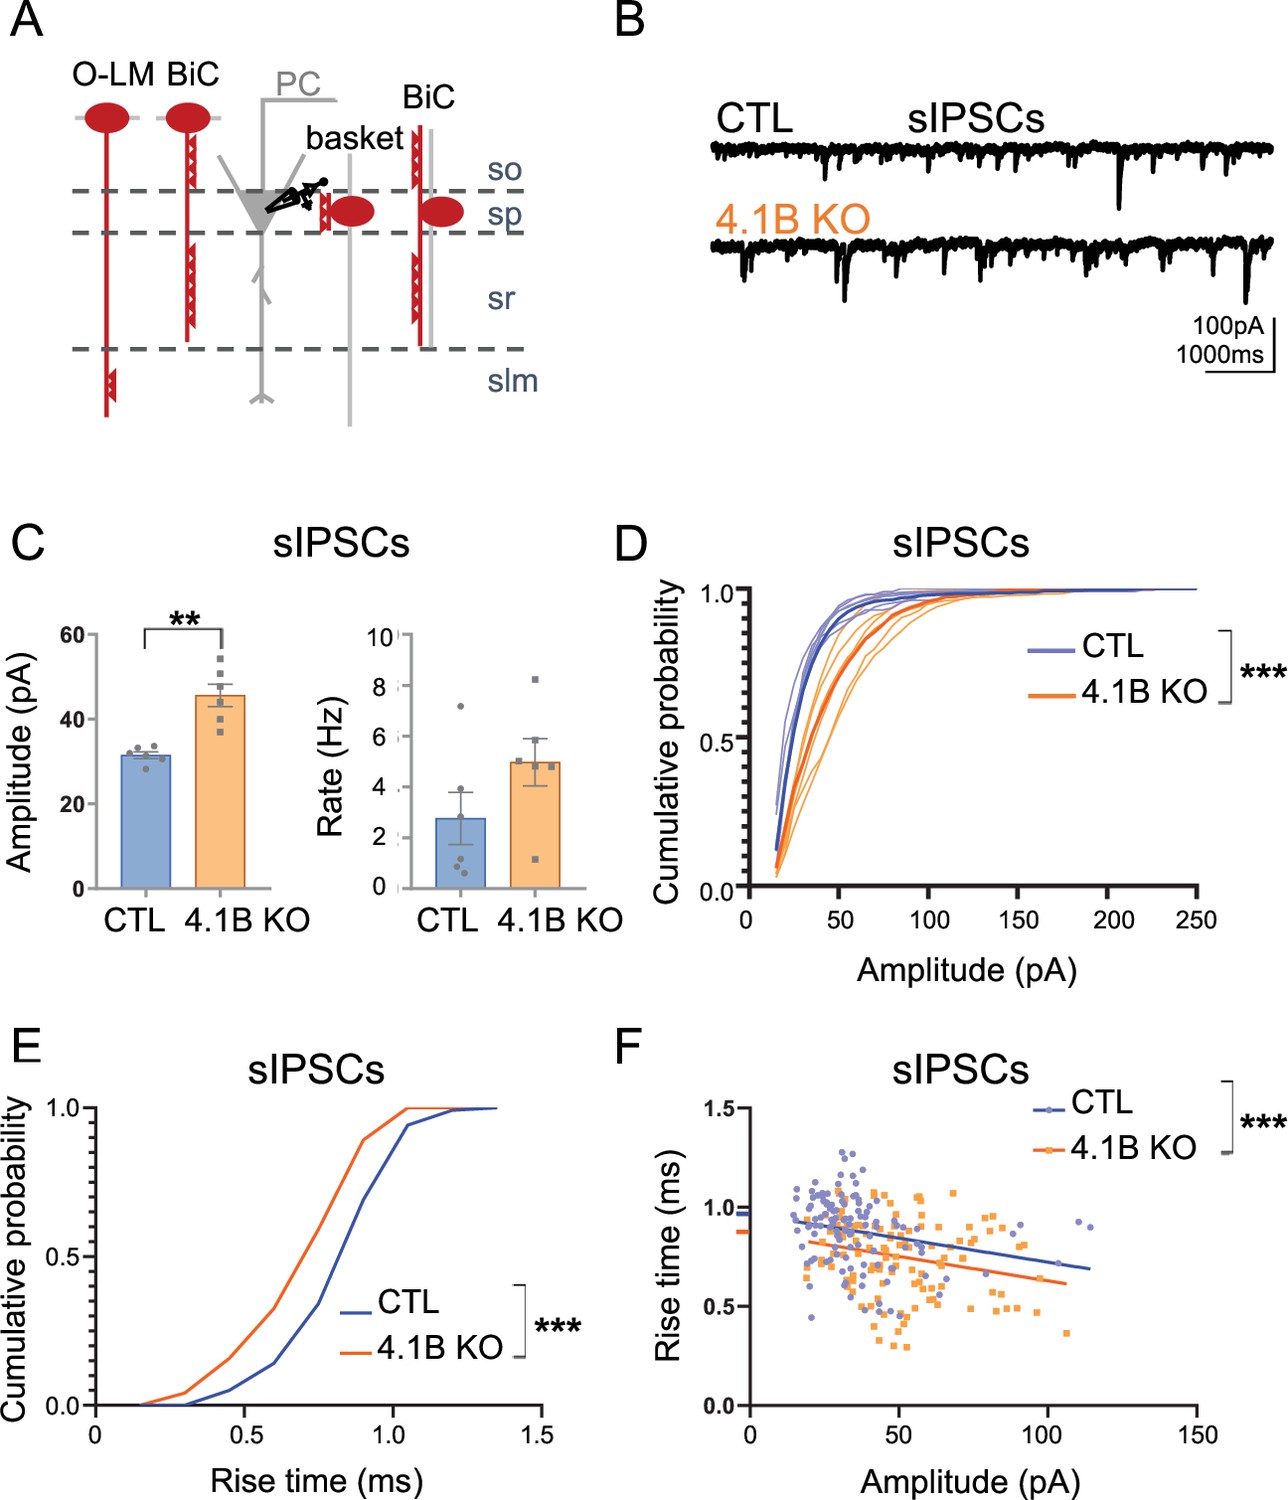
Inhibitory inputs onto CA1 pyramidal neurons are affected in 4.1B KO mice.
(A) Schematic illustration of inhibitory inputs onto the soma, proximal and distal dendrites of pyramidal cells. (B) Example traces of sIPSCs onto CA1 pyramidal neurons of control and 4.1B KO mice. (C) The amplitude of sIPSCs is significantly increased in 4.1B KO mice (**p=0.0022) and the frequency is not affected (p=0.1320); 15–400 pA events analyzed during 3 min. Statistical values were performed with a Mann-Whitney test. (D) Cumulative probability for the amplitude of sIPSCs (3 min, 6 cells and 4–5 mice/genotype) showing a significant different distribution between genotypes (Kolmogorov-Smirnov test, ***p<0.0001). Note that the probability of small amplitude events is reduced in 4.1B KO mice. (E) Cumulative probability for the rise time of sIPSCs (20 isolated events/cell, 6 cells and 4–5 mice/genotype) showing a significant difference in the distribution between genotypes towards faster rise time in 4.1B KO mice (Kolmogorov-Smirnov test, ***p<0.0001). (F) Relationship between rise time and amplitude of events in E and linear regression for each genotype; this shows a significant difference between the elevations of the linear regressions towards faster rise time in 4.1B KO mice (Null hypothesis test, ***p=0.0003).
-
Figure 9—source data 1
Amplitude and frequency of sIPSCs onto CA1 pyramidal neurons in the control and 4.1B KO mice.
- https://cdn.elifesciences.org/articles/86469/elife-86469-fig9-data1-v2.xlsx
Videos
Video 1
O-LM axons are partly myelinated in the lower and upper regions of the stratum radiatum in 4.1B KO mice at P35.
Double-staining for MBP (pink) and SST (green). 25-z steps of 1 µm.
Video 2
O-LM axons crossing the stratum radiatum are myelinated in wild-type mice at P35.
Double-staining for MBP (pink) and SST (green). 25-z steps of 1 µm.
Tables
Table 1
Intrinsic electrophysiological properties of fast-spiking Lhx6-interneurons in the stratum pyramidale.
| Control (mean ± SEM, n=9) | 4.1B KO (mean ± SEM, n=10) | MW test, p value | |
|---|---|---|---|
| Passive properties | |||
| Resting membrane potential (mV) | 57.67±3.26 | 60.50±1.99 | MW, 0.6748 |
| Input resistance (MΩ) | 360.11±52.46 | 346.20±37.77 | MW, 0.8421 |
| Rheobase (pA) | 36.67±5.00 | 28.80±6.33 | MW, 0.1305 |
| Action potential parameters | |||
| Amplitude (mV) | 60.42±3.47 | 56.54±2.79 | MW, 0.3882 |
| Area (mV.s) | 58.69±6.00 | 56.44±4.74 | MW, 0.4967 |
| Half-width (ms) | 0.92±0.07 | 0.94±0.06 | MW, 0.9838 |
| Threshold (mV) | 46.79±2.28 | 46.60±1.78 | MW, 0.9682 |
| AHP area (mV.ms) | 185.39±54.05 | 276.69±42.71 | MW, 0.2775 |
| AHP peak (mV) | 10.35±1.85 | 10.65±1.10 | MW, 0.6607 |
-
Statistical differences between groups were calculated with a Mann-Whitney test (MW). Control: n=9 mice; 4.1B KO: n=6 mice.
Table 2
Intrinsic electrophysiological properties of Lhx6-interneurons in the stratum oriens.
| Control (mean ± SEM, n=9) | 4.1B KO (mean ± SEM, n=17) | MW test, p value | |
|---|---|---|---|
| Passive properties | |||
| Resting membrane potential (mV) | 62.17±2.93 | 57.59±1.65 | MW, 0.2527 |
| Input resistance (MΩ) | 357.33±30.30 | 278.94±21.12 | MW, 0.0236* |
| Rheobase (pA) | 38.25±5.73 | 52.65±5.79 | MW, 0.1221 |
| Action potential parameters | |||
| Amplitude (mV) | 65.34±1.84 | 64.06±1.94 | MW, 0.6788 |
| Area (mV.s) | 111.44±17.87 | 104.80±8.93 | MW, 0.8788 |
| Half-width (ms) | 1.61±0.25 | 1.63±0.16 | MW, 0.5929 |
| Threshold (mV) | 45.69±1.83 | 43.65±1.43 | MW, 0.5558 |
| AHP area (mV.ms) | 351.29±58.99 | 526.59±53.50 | MW, 0.0380* |
| AHP peak (mV) | 12.57±1.79 | 16.24±1.25 | MW, 0.1280 |
-
Statistical differences between groups were calculated with a Mann-Whitney test (MW). Control: n=9 mice; 4.1B KO: n=8 mice.
Additional files
Download links
A two-part list of links to download the article, or parts of the article, in various formats.
Downloads (link to download the article as PDF)
Open citations (links to open the citations from this article in various online reference manager services)
Cite this article (links to download the citations from this article in formats compatible with various reference manager tools)
A class-specific effect of dysmyelination on the excitability of hippocampal interneurons
eLife 12:e86469.
https://doi.org/10.7554/eLife.86469


