Functionally refined encoding of threat memory by distinct populations of basal forebrain cholinergic projection neurons
- National Institute of Neurological Disorders and Stroke, NIH, United States
- Yale Interdepartmental Neuroscience Program, Yale University, United States
- Kansas City University of Medicine and Biosciences, United States
- Stony Brook University, United States
- National Institute of Environmental Health Sciences, United States
- Program in Neuroscience, Stony Brook University, United States
- State Key Laboratory of Membrane Biology, Peking University School of Life Sciences, China
- PKU-IDG/McGovern Institute for Brain Research, China
- Peking-Tsinghua Center for Life Sciences, Academy for Advanced Interdisciplinary Studies, Peking University, China
- Department of Psychiatry, Yale University, United States
Figures
Figure 1 with 4 supplements
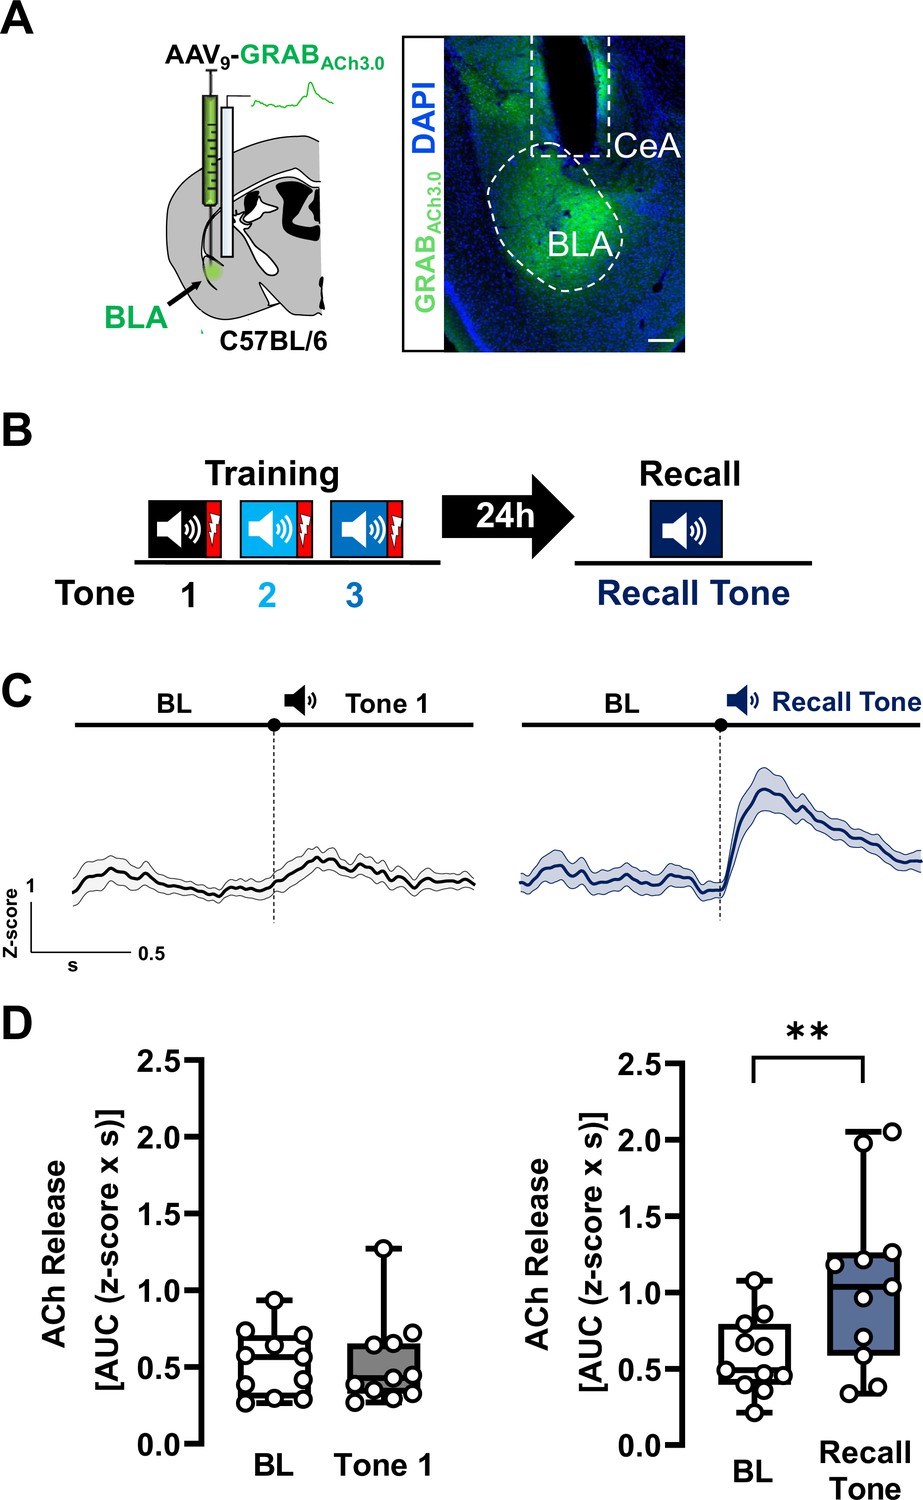
Acetylcholine (ACh) is released in basolateral amygdala (BLA) during threat recall (see also Figure 1—figure supplements 1–4).
(A) Left: Schematic of strategy for targeting the genetically encoded ACh sensor (GRABACh3.0) to BLA. Right: Image of ACh sensor expression (green). White dotted oval delineates ACh sensor-labeled BLA. White dotted box denotes prior location of optical fiber. Scale bar = 100 µm. Please refer to Figure 1—figure supplement 4 for fiber placement mapping in all mice. (B) Schematic of the associative threat-learning protocol employed consisting of three tone + shock pairings during the training period and tone alone during the recall session. (C) Average traces of ACh release in response to tone; shading represents standard error of the mean (SEM): naive tone (Tone 1 during training) in black, recall tone in deep blue (tone onset indicated by bar above; n = 11). BL = baseline. (D) Quantification of ACh release (area under the curve (AUC)) during baseline period (1 s prior to tone onset) and in response to the first (naive) tone and in response to the recall tone (1 s following tone onset). Naive tone did not induce significant increase in ACh release in the BLA (Wilcoxon matched-pairs signed rank test, BL vs. Tone 1, p = 0.8311, W = −6). Recall tone induced a significant increase in ACh release in the BLA (paired t-test, BL vs. Recall tone, ** p = 0.0039 (two-tailed), t = 3.732, df = 10). See also Figure 1—figure supplements 1–4.
-
Figure 1—source data 1
Processed ACh release fiber photometry data for Figure 1.
- https://cdn.elifesciences.org/articles/86581/elife-86581-fig1-data1-v2.csv
Figure 1—figure supplement 1
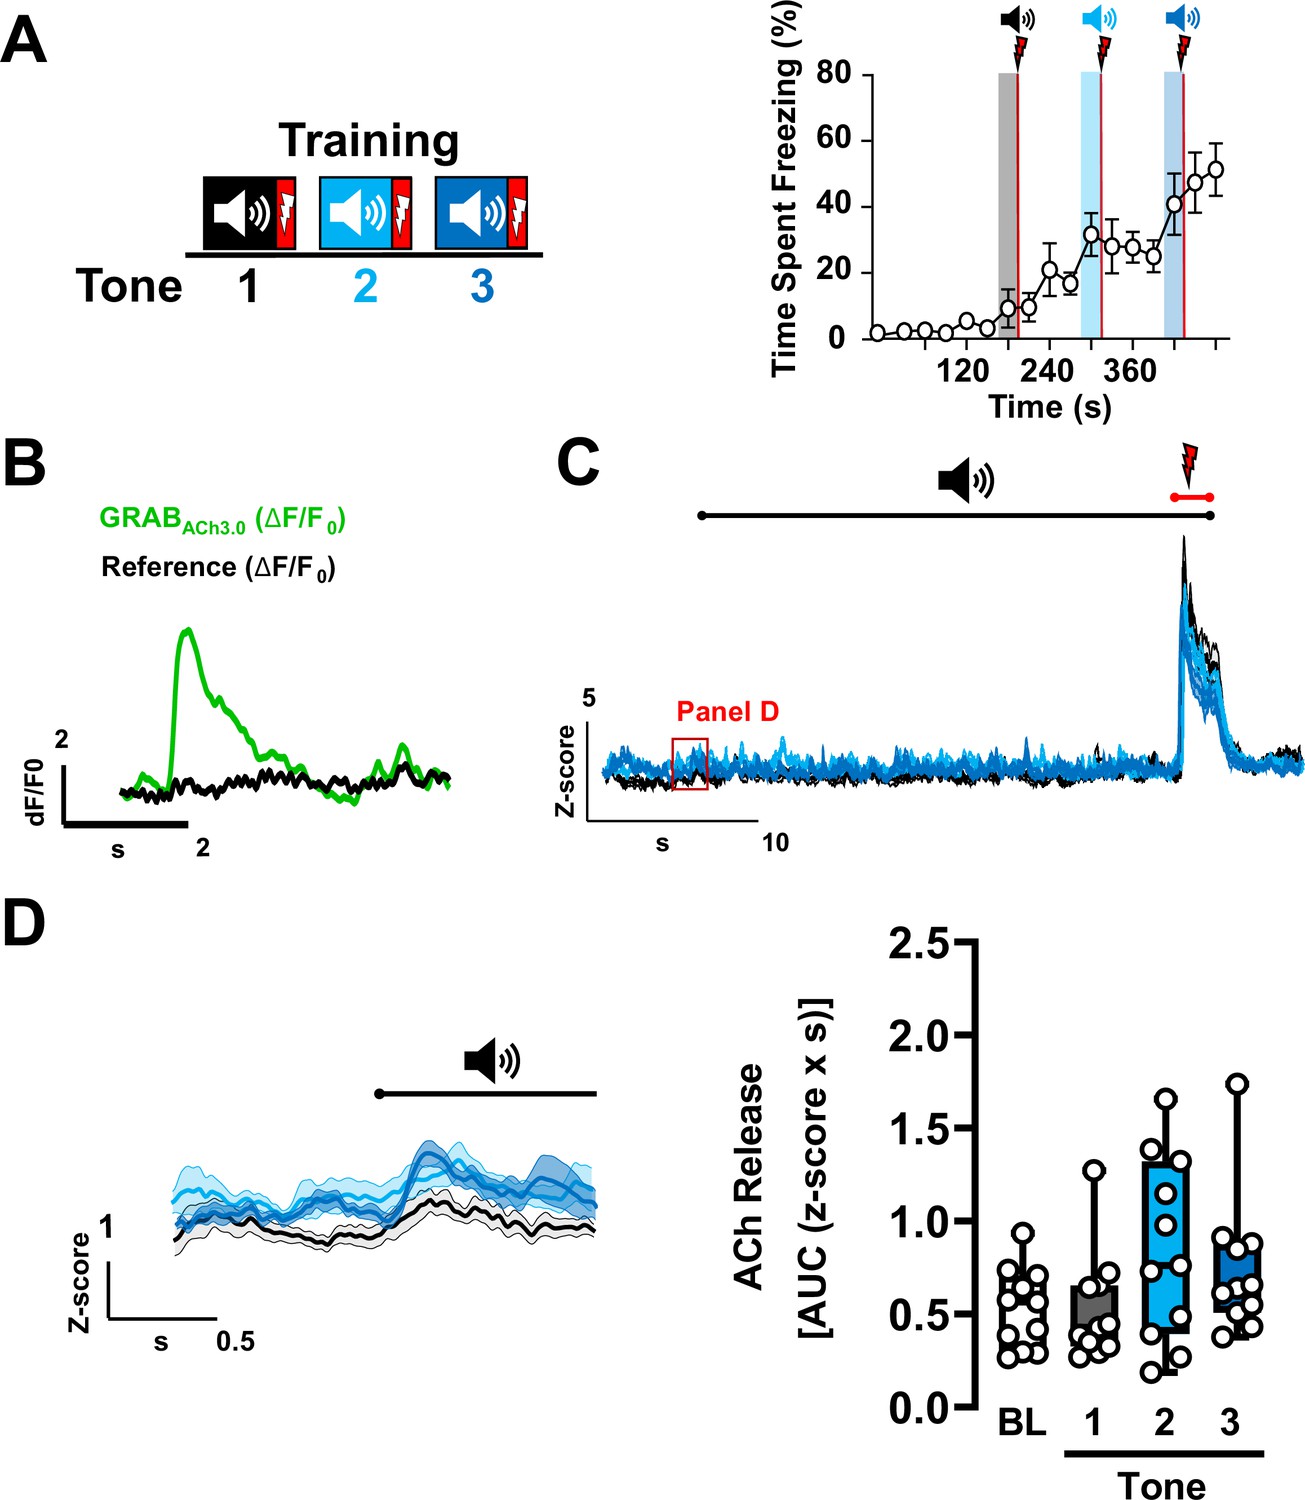
Exposure to tones during tone–shock pairings does not significantly alter acetylcholine (ACh) release in the basolateral amygdala (BLA) during training.
(A) Left: Schematic of the associative threat-learning protocol employed consisting of three tone + shock pairings during the training period. Right: Quantification of typical freezing behavior throughout the training session (30 s time bins; n = 9). Shaded blue bars indicate periods of tone ( )–shocks (
 ) pairings. (B) Sample traces of raw GRABACh3.0 fluorescence in the BLA (green) and reference channel (black). (C) Average traces of ACh release for the three tone + shock pairings (30 s) with 5 s prior to tone onset and 5 s after tone (n = 11); shading represents standard error of the mean (SEM) (Tone 1: black, Tone 2: deep sky blue, Tone 3: navy blue). (D) ACh release in response to tone (
 ) during training (n = 11). Average traces of ACh release in response to tone; shading represents SEM. Quantification of ACh release (area under the curve (AUC)) during BL (1 s prior to onset of Tone 1) and during Tones 1, 2, and 3 (1 s after tone onset) (Tone 1: black, Tone 2: deep sky blue, Tone 3: navy blue) for each tone + shock pairing. There were no significant changes in ACh release in response to tone during training (Friedman test, p = 0.1381).
Figure 1—figure supplement 2
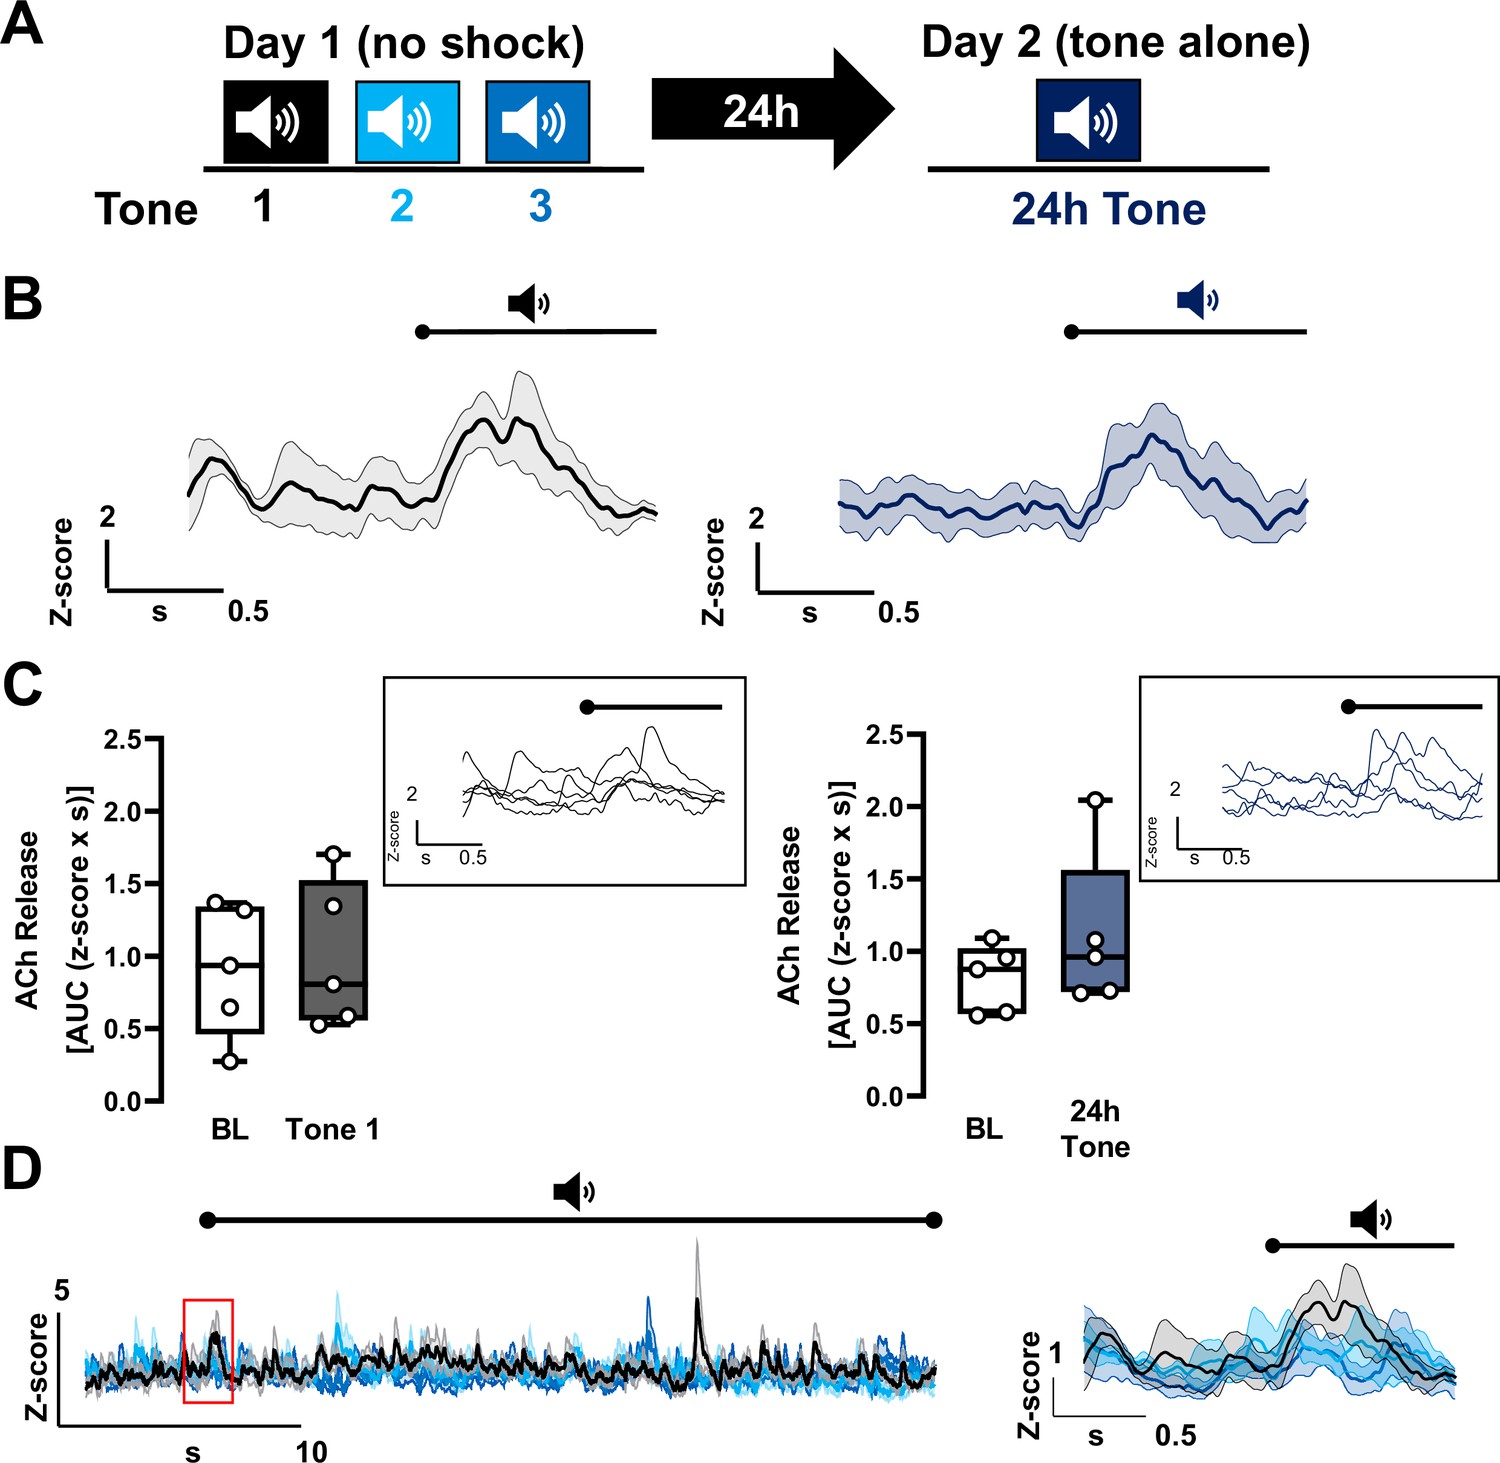
Repeat tone exposures without foot shock during either a training session or a recall session fail to induce significant changes in acetylcholine (ACh) release in the basolateral amygdala (BLA).
(A) Schematic of tone only training protocol consisting of three 30 s tones on day 1 without shocks followed by presentation of the same tone 24 hr later, on day 2. (B) Average traces of ACh release in response to tone; shading represents standard error of the mean (SEM): naive tone (Tone 1 on day 1) in black, 24 hr tone in deep blue (tone onset indicated by bar above; n = 5). (C) Quantification of ACh release (area under the curve (AUC)) during baseline period (1 s prior to tone onset) and in response to the first (naive) tone and in response to the 24 hr tone (1 s following tone onset). Insets display traces from individual mice in response to the respective tones; bar above trace indicates tone onset. Neither the naive tone nor the repeat tone presentation (24 hr tone) significantly increased ACh release relative to baseline (paired t-test. BL vs. Tone 1, p = 0.8437, t = 0.2103, df = 4. BL vs. 24 hr tone, p = 0.3152, t = 1.147, df = 4). (D) Average traces of ACh release for the three tones on day 1 (30 s) with 5 s prior to tone onset (n = 5). Shading represents SEM (Tone 1: black, Tone 2: deep sky blue, Tone 3: navy blue). Red inset showing 1 s before and after onset of the tones is expanded on the right.
-
Figure 1—figure supplement 2—source data 1
Processed ACh release fiber photometry data for Figure 1—figure supplement 2.
- https://cdn.elifesciences.org/articles/86581/elife-86581-fig1-figsupp2-data1-v2.xlsx
Figure 1—figure supplement 3
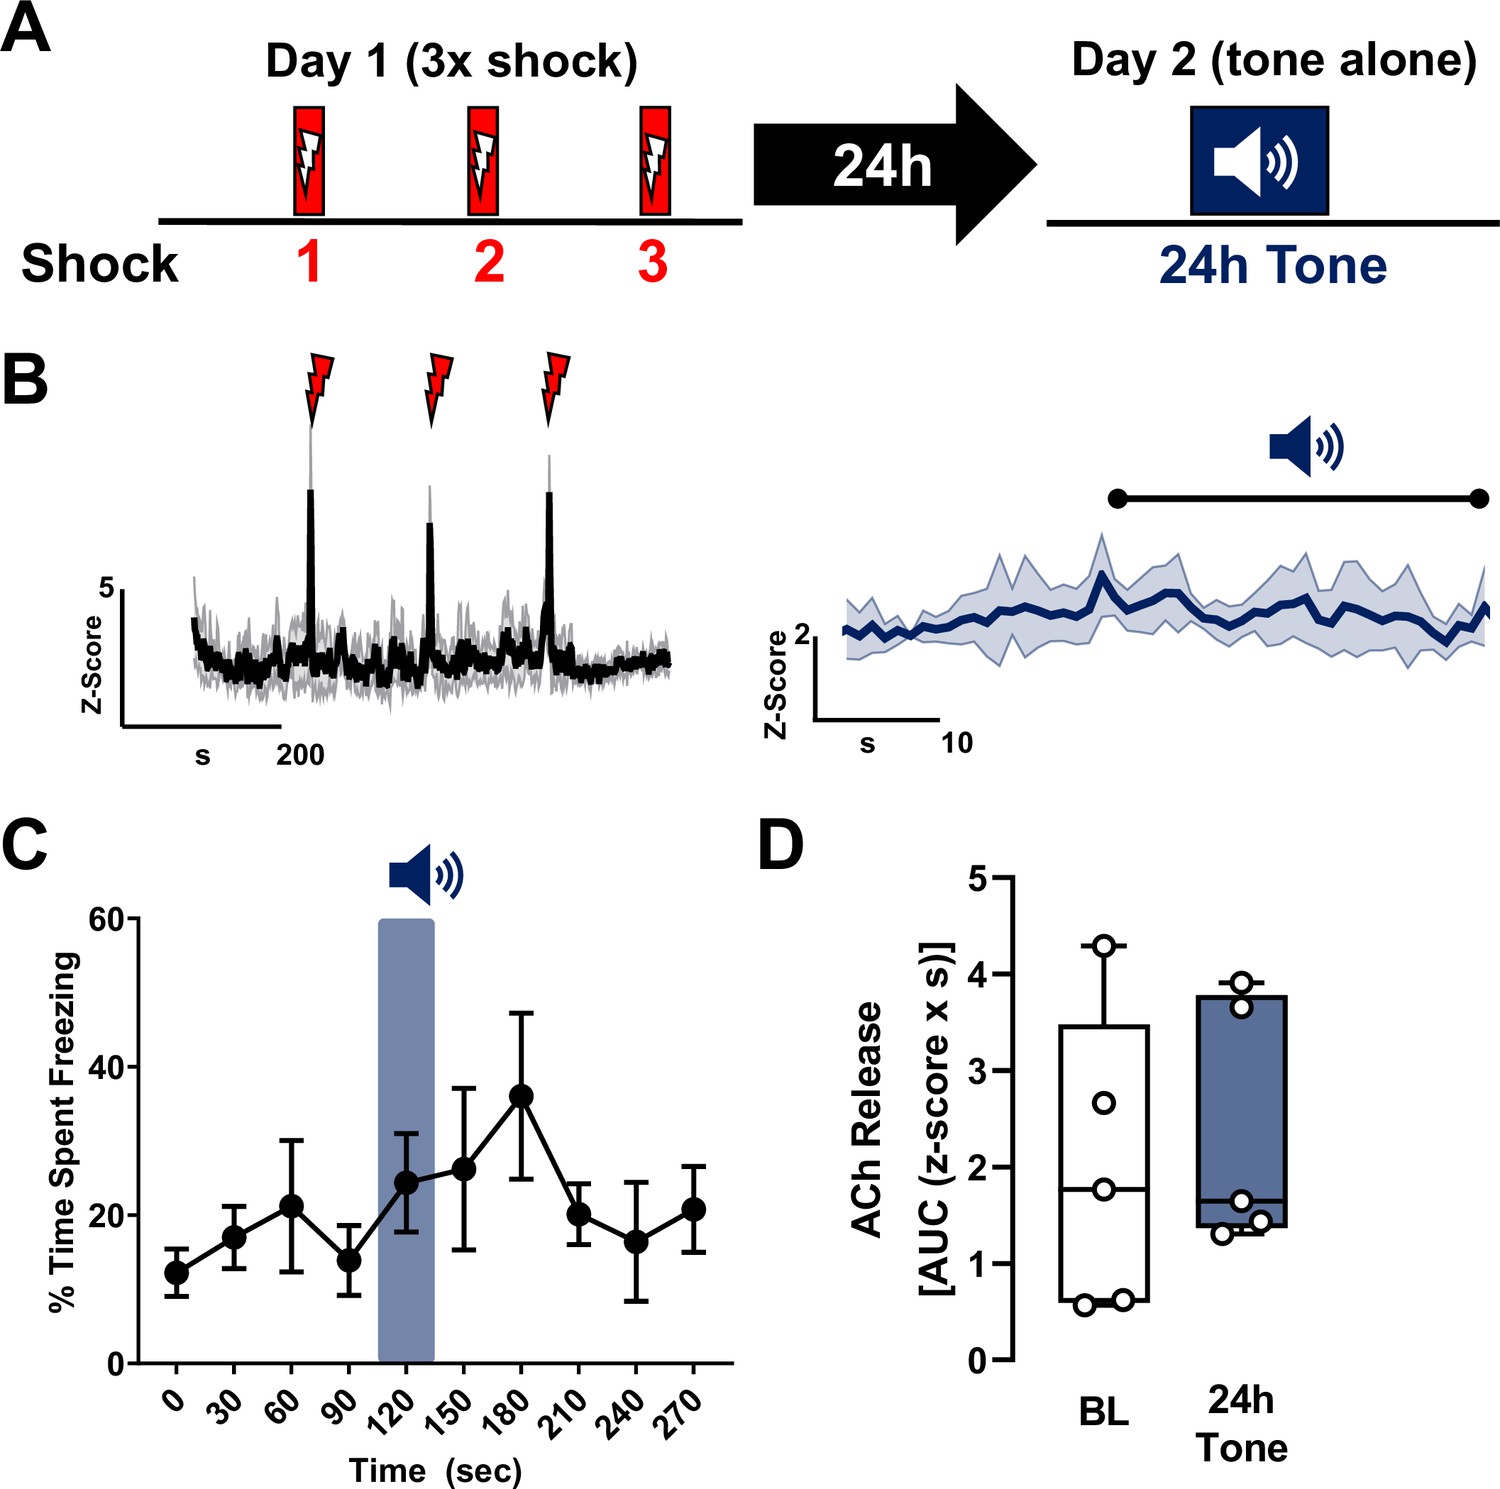
Shock alone does not sensitize cholinergic tone responses in the basolateral amygdala (BLA).
(A) Top: Schematic of shock only training and recall protocol consisting of three 2 s shocks during the training session (day 1) and a single 30-s tone during the recall session (day 2). Acetylcholine (ACh) release in response to shocks ( ) during training and to tone alone (
 ) 24 hr following exposure to three-foot shocks (shock without tone) (n = 5). (B) Left: Average trace of ACh release in response to shocks (
 ) shows robust ACh release in response to each shock. Right: Average trace of ACh release in response to tone (
 ). Shading represents standard error of the mean (SEM). (C) Freezing behavior during the ‘recall’ (tone alone 24 hr after shock only training) session. Blue shaded bar represents the ‘24 hr tone’. There was no significant increase in freezing in response to the tone when training was conducted with shock alone (p = 0.2418, repeated measures (RM) one-way analysis of variance (ANOVA), F(2.381, 9.523) = 1.657). (D) Quantification of ACh release (area under the curve (AUC)) during the 24 hr tone session during the 1 s following 24 hr tone onset compared to baseline (1 s prior to tone onset). There was no change in ACh release in response to the tone when training with shock alone (no tone–shock pairing) (AUC, p = 0.7272 (two-tailed), t = 0.3742, df = 4, paired t-test).
-
Figure 1—figure supplement 3—source data 1
Processed ACh release data for Figure 1—figure supplement 3.
- https://cdn.elifesciences.org/articles/86581/elife-86581-fig1-figsupp3-data1-v2.xlsx
Figure 1—figure supplement 4
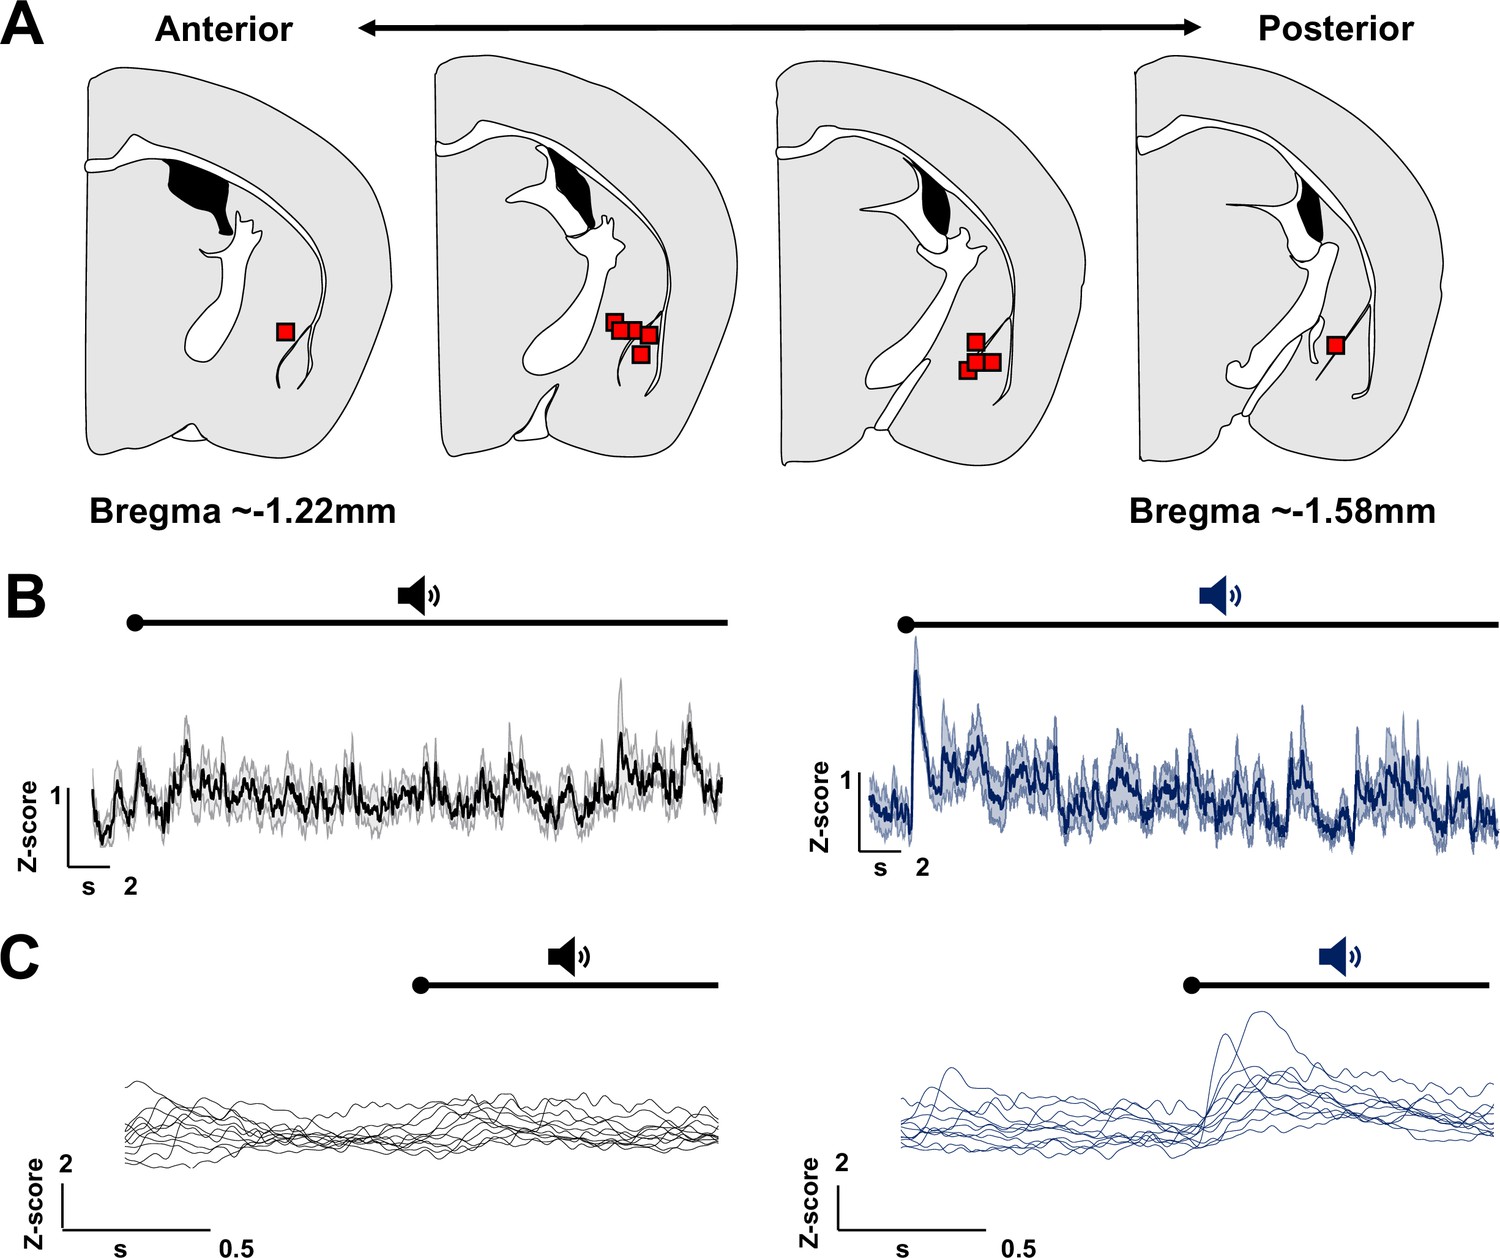
Remapping of optic fiber placements.
(A) Relocalization of fiber optic placement mapped across the anterior–posterior axis of the basolateral amygdala (BLA). Top: Atlas images showing fiber tip locations (red squares). (B) Left: Average traces of acetylcholine (ACh) release for the 2 s prior to tone onset through 28 s of recall tone during the naive tone (Tone 1) presentation (black line) from mice that underwent the training (tone + shock) + recall (tone alone) paradigm. Right: Average traces of ACh release for 2 s prior to tone onset through 28 s of the recall tone (deep blue line) from mice that underwent the training (tone + shock) + recall (tone alone) paradigm; shading represents standard error of the mean (SEM; n = 11). Tone onset indicated by black bar above trace. (C) Expanded traces of ACh release from individual mice for the naive tone (Tone 1, left) and recall tone (right) over 2 s including 1 s prior to tone onset and 1 s after tone onset from mice that underwent the training (tone + shock) followed by recall (1× tone) paradigm (n = 11) (Tone 1, left: black lines; Recall tone, right: deep blue lines).
Figure 2 with 1 supplement
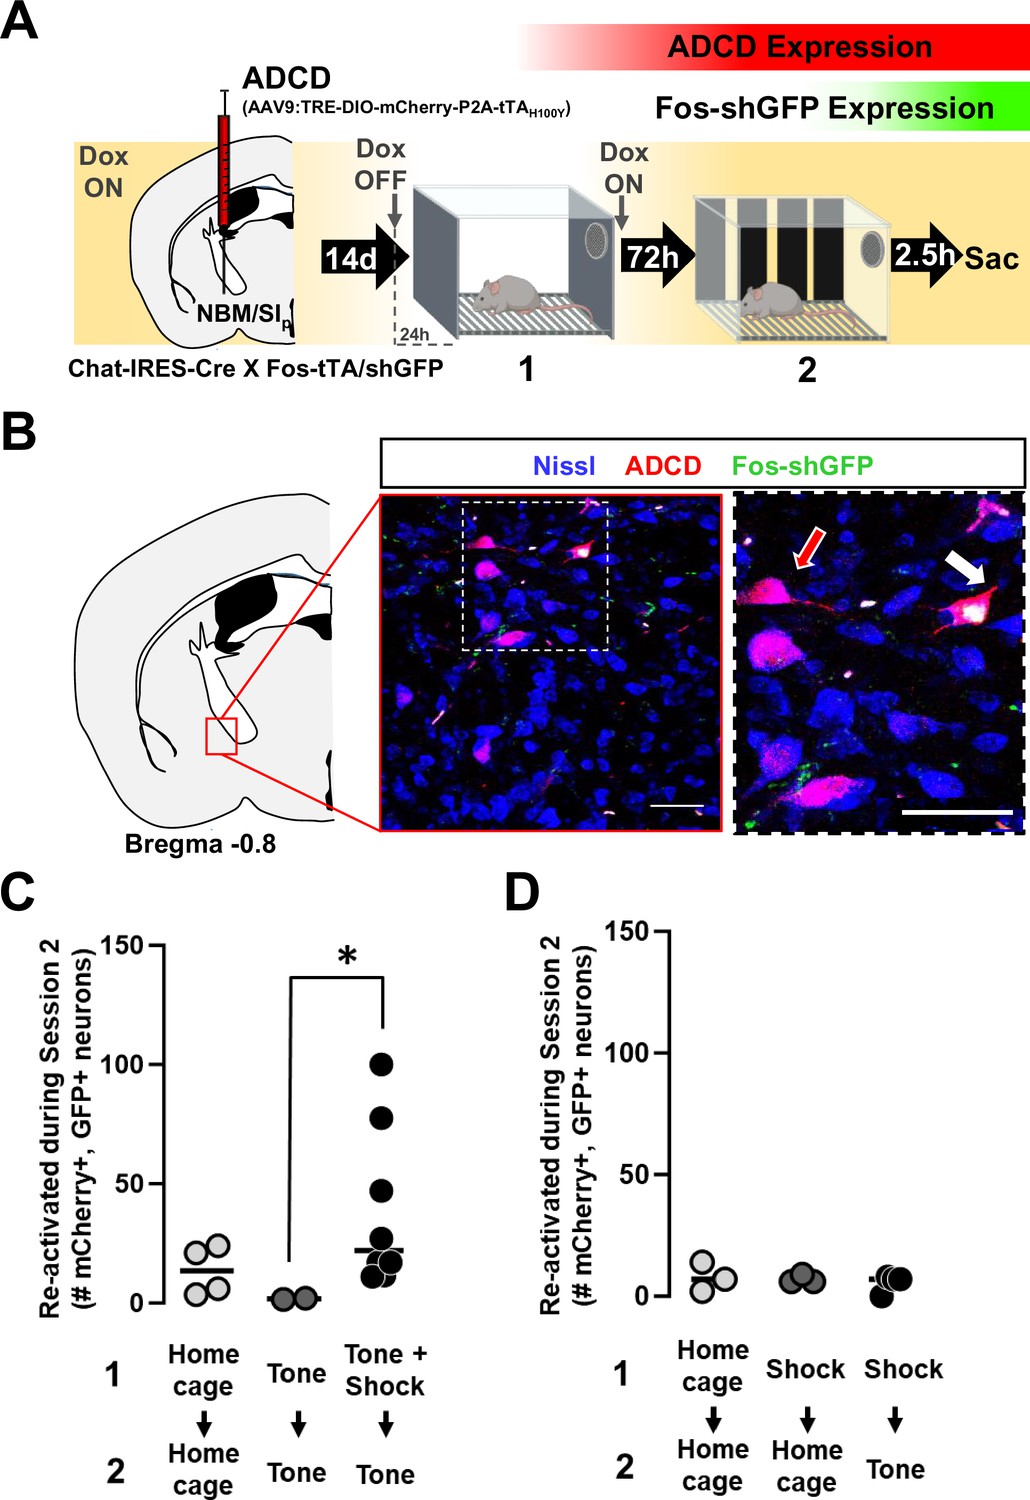
Nucleus basalis and posterior substantia innominata (NBM/SIp) cholinergic neurons are activated by threat learning and reactivated during threat memory recall (see Figure 2—figure supplement 1).
(A) Strategy for labeling activated NBM/SIp cholinergic neurons during both training and recall. Chat-IRES-Cre × Fos-tTA/shGFP mice (n = 14) were injected in the NBM/SIp with ADCD-mCherry virus (AAV9: TRE-DIO-mCherry-P2A-tTAH100Y). During session 1 (off Dox) mice either remained in their home cage, were exposed to three tones (Tone alone), or were exposed to three tone–shock pairings (training session). During session 2, mice remained in home cage or were exposed to a single tone (recall session). Cholinergic neurons activated during training express ADCD-mCherry stably after training (red during training), and neurons activated during recall transiently express GFP (green during recall). (B) Image of the NBM/SIp showing cholinergic neurons activated during training (red arrow) or by both training and recall (reactivated – white arrow; image taken at A/P ~ −0.8 from Bregma; scale bar = 50 µm). (C) Quantification of the number of cholinergic neurons activated during session 1 (ADCD-mCherry+) that were reactivated during session 2 (both mCherry and GFP positive (activated both during session 1 (training) and during session 2 (recall))). Home cage (n = 7 sections from 4 mice), tone only (n = 4 sections from 2 mice) and tone + shock (n = 17 sections from 8 mice) conditions. Significantly more cholinergic neurons were reactivated by tone following tone–shock pairings (Kruskal–Wallis p = 0.0249). Tone–shock compared to tone only (*p = 0.0464, Dunn’s corrected). (D) Quantification of number of reactivated cholinergic neurons (activated both during session 1 and during session 2 vs. the total number of cholinergic neurons activated during session 1). Home cage → home cage (n = 9 sections from 3 mice), shock → home cage (n = 17 sections from 4 mice), and shock → tone (n = 11 sections from 3 mice). Kruskal–Wallis p = 0.9471, KW = 0.1219.
© 2024, BioRender Inc. Figure 2 was created using BioRender, and is published under a CC BY-NC-ND license. Further reproductions must adhere to the terms of this license.
Figure 2—figure supplement 1
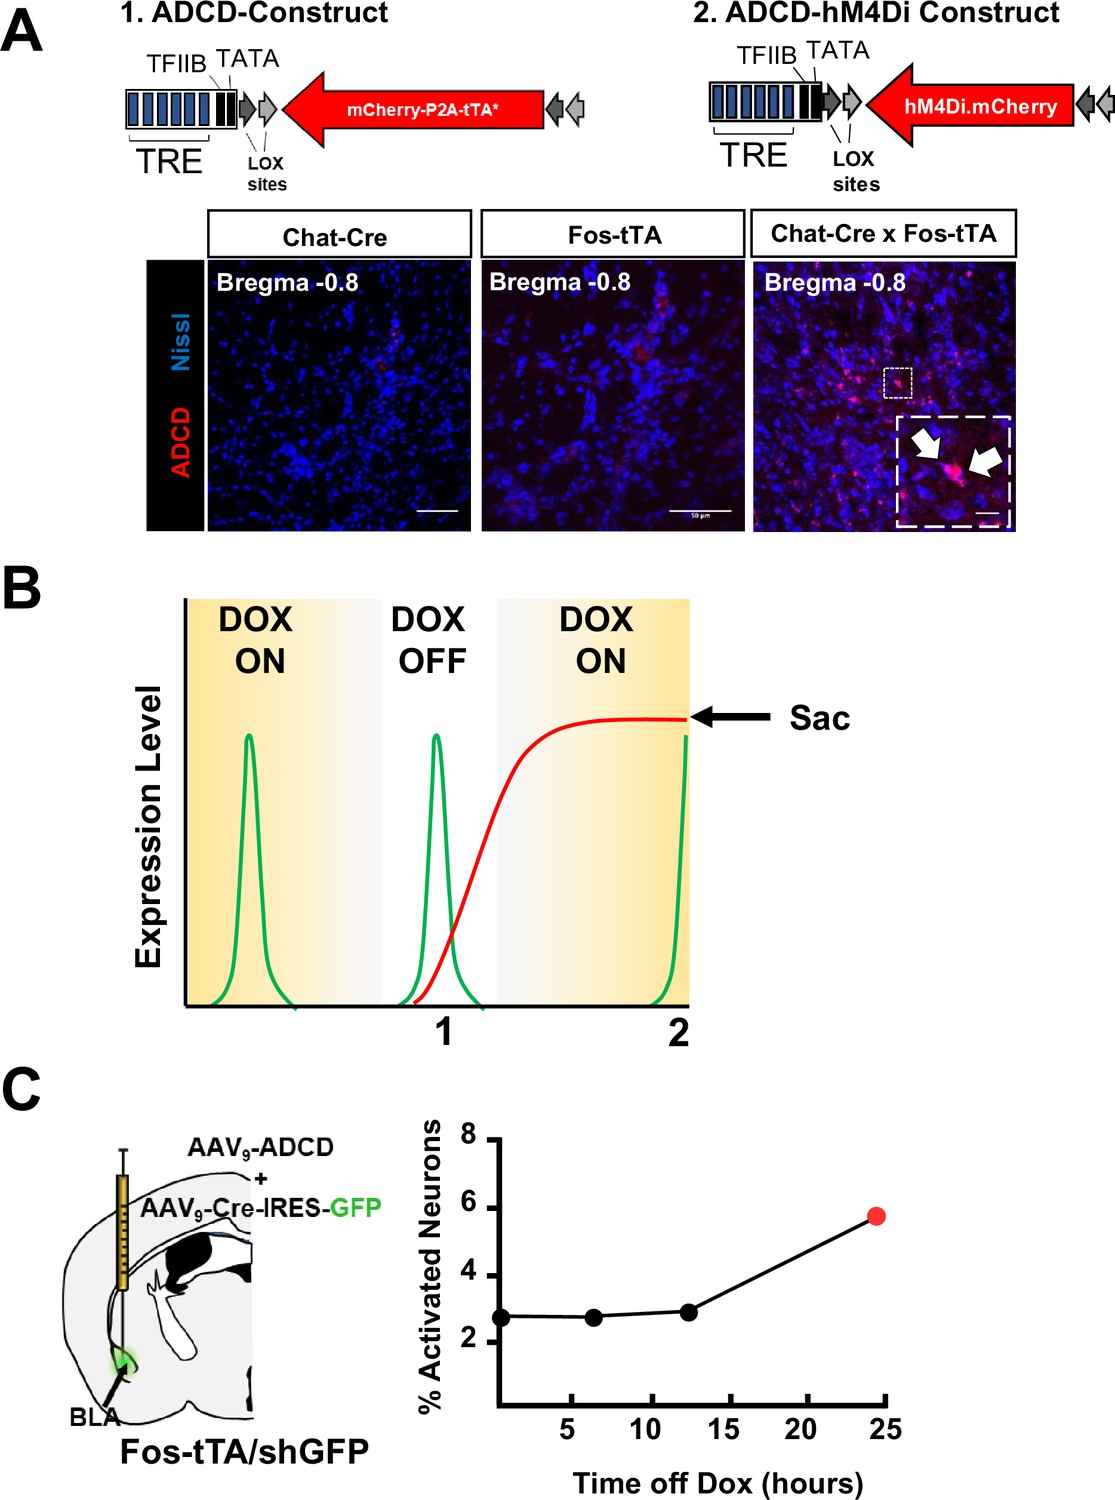
Construction of viral vectors for tagging activated cholinergic neurons.
(A) Top: Diagrams of 1. ADCD and 2. ADCD hM4Di viral constructs. Activity dependence is conferred by the Tet response element (TRE – 7 repeats of the tetO sequence followed by a minimal promoter). Cre dependence is conferred by pairs of loxP and lox2272 sites flanking the ‘cargo’ in an antisense orientation. Cargos: permanent labeling ADCD includes an oChIEF-mCherry fusion followed by a P2A element and a doxycycline insensitive tTA (tTA*). ADCD-hM4Di cargo includes an hM4Di-mCherry fusion protein without the dox-insensitive tTA. Bottom: Images showing lack of ADCD expression in Chat-Cre and Fos-tTA mice, and ADCD expression in Chat-IRES-Cre × Fos-tTA/shGFP mice. Scale bar = 50 µm. Inset shows magnified image of two cells expressing ADCD-mCherry (white arrows). Scale bar = 10 µm. (B) Schematic representing transient expression of the shGFP under control of the Fos promoter. Activated neurons express shGFP (green line), which peaks in expression ~2.5 hr following activation. This GFP expression is not influenced by the presence or absence of doxycycline and is transient. The virally delivered ADCD construct can only be expressed in (cre expressing) cholinergic neurons, in the absence of doxycycline (DOX OFF). Once expression initiates, it is maintained even in the presence of Dox by a dox-insensitive tTA (red line), thereby resulting in permanent labeling. However, labeling in cells that were not activated during the DOX OFF period is prevented. Intercepting the peak of a shGFP signal (for example following a second behavioral assay) can allow for identification of cells that express mCherry (activated during DOX OFF) and cells that express GFP (activated 2.5 hr prior to euthanasia). (C) Test to determine the minimal time off dox to allow ADCD expression. Mice were kept on dox food for 2 weeks (starting 2 days prior to ADCD +AAV9-camk2a-Cre-IRES-GFP injection into the basolateral amygdala (BLA)) (Dox ON). They were then shifted to regular chow either 6, 12, or 24 hr prior to training (Dox OFF). They were returned to dox-chow immediately following training (ON). ADCD expression was quantified 72 hr later as % of mCherry+ cells out of total GFP/Cre+ cells in the BLA. (Note the background level of expression in the presence of Dox. See Methods for details.)
Figure 3 with 1 supplement
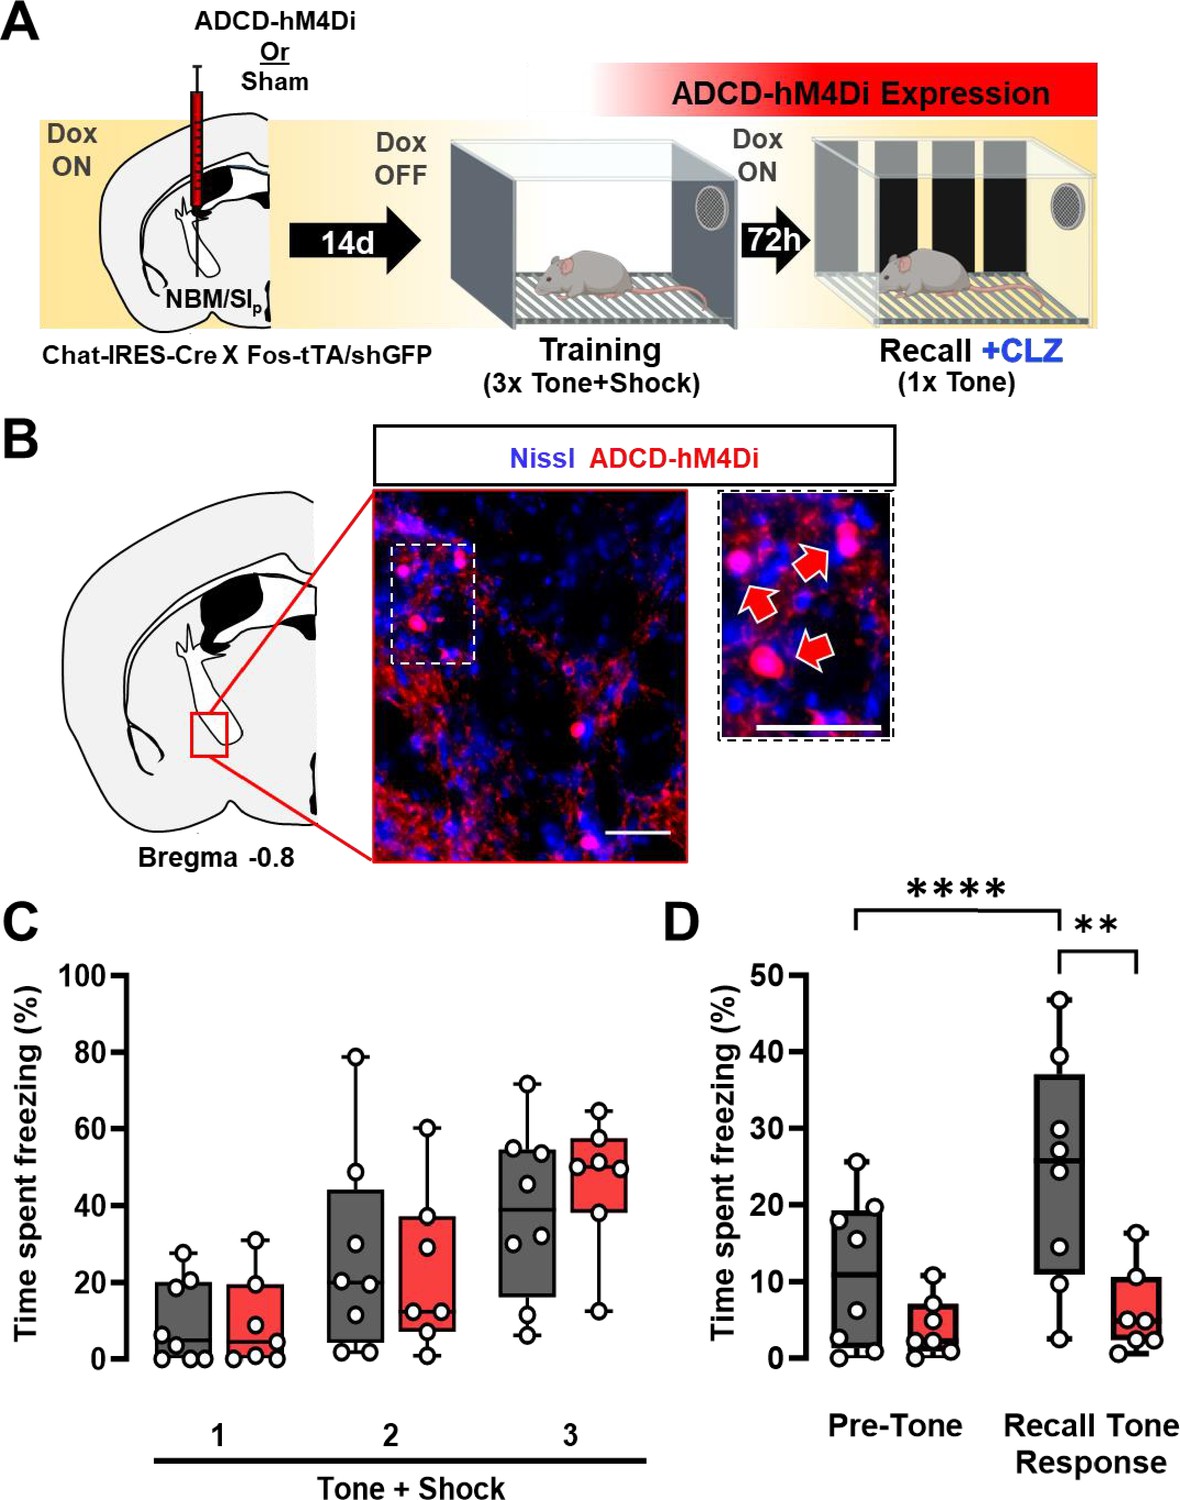
Re-activation of a subset of nucleus basalis and posterior substantia innominata (NBM/SIp) cholinergic neurons is required for threat memory retrieval (see Figure 3—figure supplement 1).
(A) ADCD-hM4Di (AAV9: TRE-DIO-hM4Di.mCherry) was injected into the NBM/SIp of Chat-IRES-Cre × Fos-tTA/shGFP mice. Two weeks later mice underwent training on regular chow (Dox-chow removed 24 hr prior to training session) to allow hM4Di.mCherry to be selectively expressed in training-activated cholinergic neurons. Three days later, recall was tested in Dox on conditions. Clozapine (CLZ) was injected 10 min before the recall session to activate the inhibitory DREADD, hM4Di specifically in previously activated cholinergic neurons. (B) Representative image taken at Bregma −0.8 mm of mCherry (ADCD-hM4Di.mCherry) expressing cells. Inset shows higher magnification images of ADCD expression (red arrows). Scale bar = 50 µm. (C) Freezing behavior during training in sham (gray, n = 8 mice) and ADCD-hM4Di injected (red, n = 7 mice) for each 30 s bin during tone presentation (Tone + Shock 1, 2, 3). There were no significant differences between the groups during the training session (repeated measures (RM) two-way analysis of variance (ANOVA) Time × Group p = 0.6482; Group p = 0.7311). (D) Freezing behavior during recall following selective hM4Di-mediated inhibition of training-activated cholinergic neurons in the NBM/SIp. Sham (gray, n = 8 mice) and hM4Di (red, n = 7 mice) groups. There were significant differences between pre-tone vs. tone-related freezing for sham (****Pre-Tone vs. Recall Tone Response, p = 0.0001, Bonferroni corrected), response to tone between sham and hM4Di (**p = 0.0026, Bonferroni corrected) and a significant main effect of Time × Group interaction (RM two-way ANOVA (GLM) Time × Group, p = 0.0052). (See Figure 3—figure supplement 1 for details on time periods comprising Pre-Tone and Recall Tone Response periods.)
© 2024, BioRender Inc. Figure 3 was created using BioRender, and is published under a CC BY-NC-ND license. Further reproductions must adhere to the terms of this license.
Figure 3—figure supplement 1

Time-resolved freezing plot from recall following silencing of training-activated NBM/SI basal forebrain cholinergic neurons (BFCNs).
(A) Freezing behavior during training in sham (black, n = 8 mice) and ADCD-hM4Di injected (red, n = 7 mice). Error bars represent standard error of the mean (SEM). Tone 1 ( ), Tone 2 (
 ), Tone 3 (
 ), and shock (
 ) presentation denoted with symbols above traces. (B) Freezing behavior during recall in sham (black, n = 6 mice) and ADCD-hM4Di injected (red, n = 5 mice). Error bars represent SEM. Recall tone (
 ) denoted by symbol above traces.
Figure 4
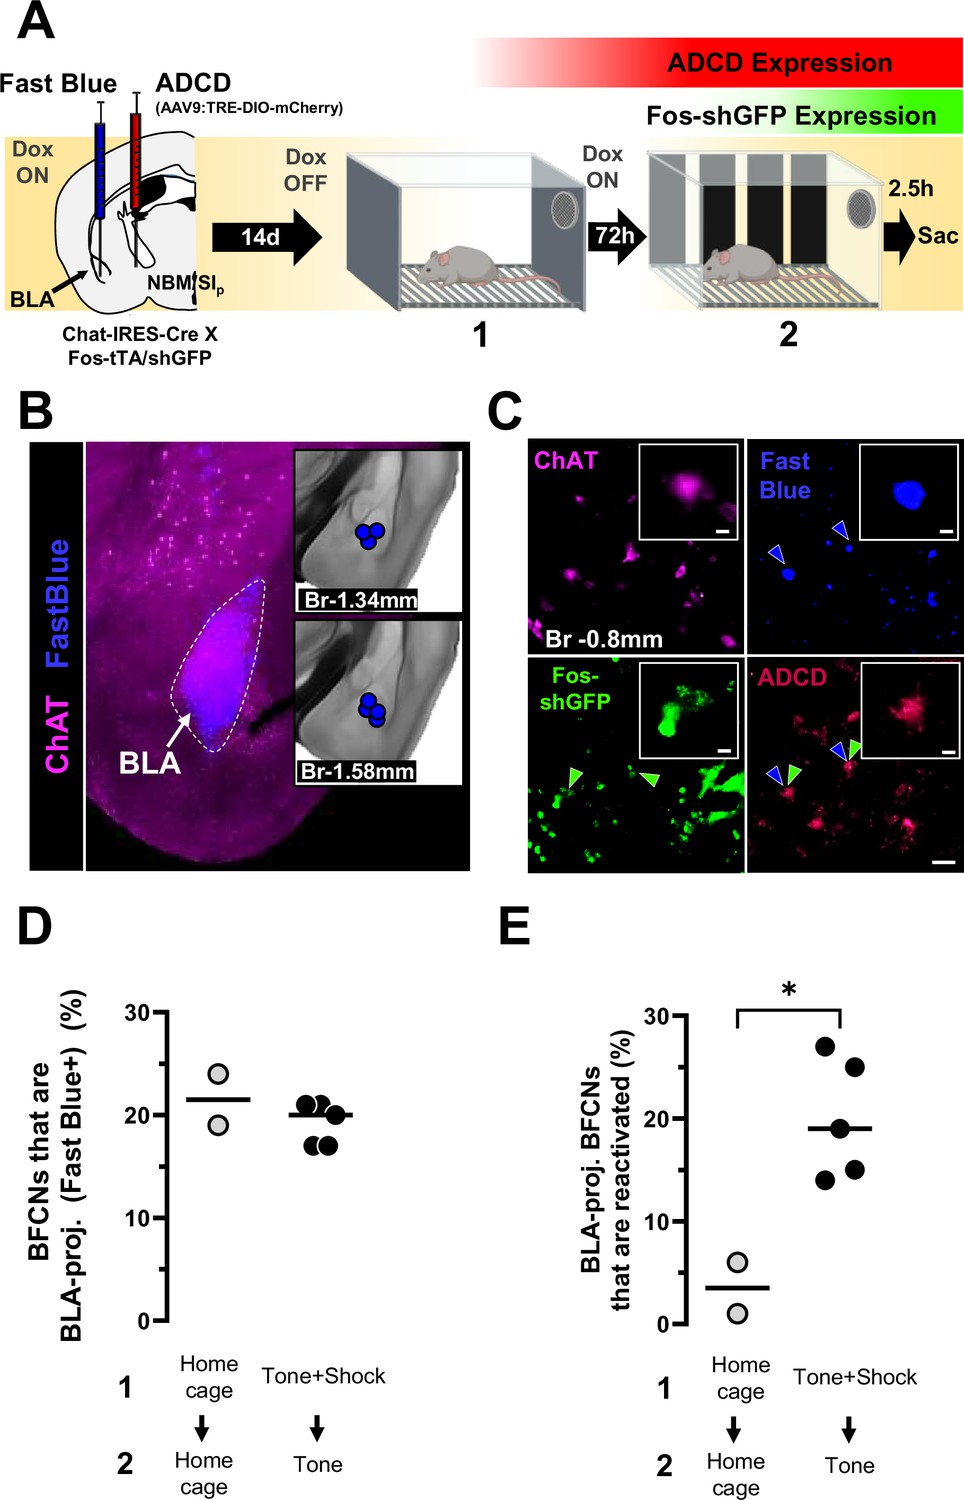
Basolateral amygdala (BLA)-projecting nucleus basalis and posterior substantia innominata (NBM/SIp) cholinergic neurons are reactivated by the conditioned tone stimulus.
(A) Left: Strategy for labeling activated NBM/SIp cholinergic during both training and recall along with mapping of BLA-projecting neurons. Chat-IRES-Cre × Fos-tTA/shGFP mice (n = 7) were injected in the NBM/SIp with ADCD-mCherry virus and in the BLA with Fast Blue dye. During session 1 (off Dox) mice either remained in their home cage or were exposed to three tone–shock pairings. During session 2 (recall session), mice remained in home cage or were exposed to a single tone. Cholinergic neurons activated during training express GFP transiently and express ADCD-mCherry stably after training (red during training), and neurons activated during recall transiently express GFP (green during recall). Neurons projecting to the BLA were labeled by Fast Blue (blue). Cholinergic neurons were identified by ChAT staining (magenta). (B) Image of a Fast Blue injection site in the BLA; Inset: Mapping of injection sites for all Fast Blue experiments. (C) Representative image showing (clockwise), ChAT+ neurons in the NBM/SIp at bregma −0.8 mm (magenta), BLA-projecting neurons (blue, blue arrowheads), training-activated cells (ADCD) (red), and recall-activated neurons (green, green arrow heads). BLA-projecting basal forebrain cholinergic neurons (BFCNs) activated by training and recall are denoted by double arrowheads (blue and green). Scale bar = 50 µm. Inset scale bar = 10 µm. (D) Quantification of percentage of ChAT+ neurons that were labeled by Fast Blue in mice from the home cage group (gray) and mice from the training + recall group (black) from bregma −0.8 mm. No significant differences were found between groups (Welch’s t-test, p = 0.5192). (E) Quantification of percentage of BLA-projecting BFCNs (ChAT+/Fast Blue+) at bregma −0.8 mm that were reactivated during session 2 (ADCD + GFP) in mice from the home cage group (n = 2) (gray) and mice from the training + recall group (n = 5) (black). Mice that underwent training and recall had significantly higher numbers of engram-enrolled BLA-projecting BFCNs (Welch’s t-test, *p = 0.0183).
© 2024, BioRender Inc. Figure 4 was created using BioRender, and is published under a CC BY-NC-NDlicense. Further reproductions must adhere to the terms of this license.
Figure 5 with 2 supplements
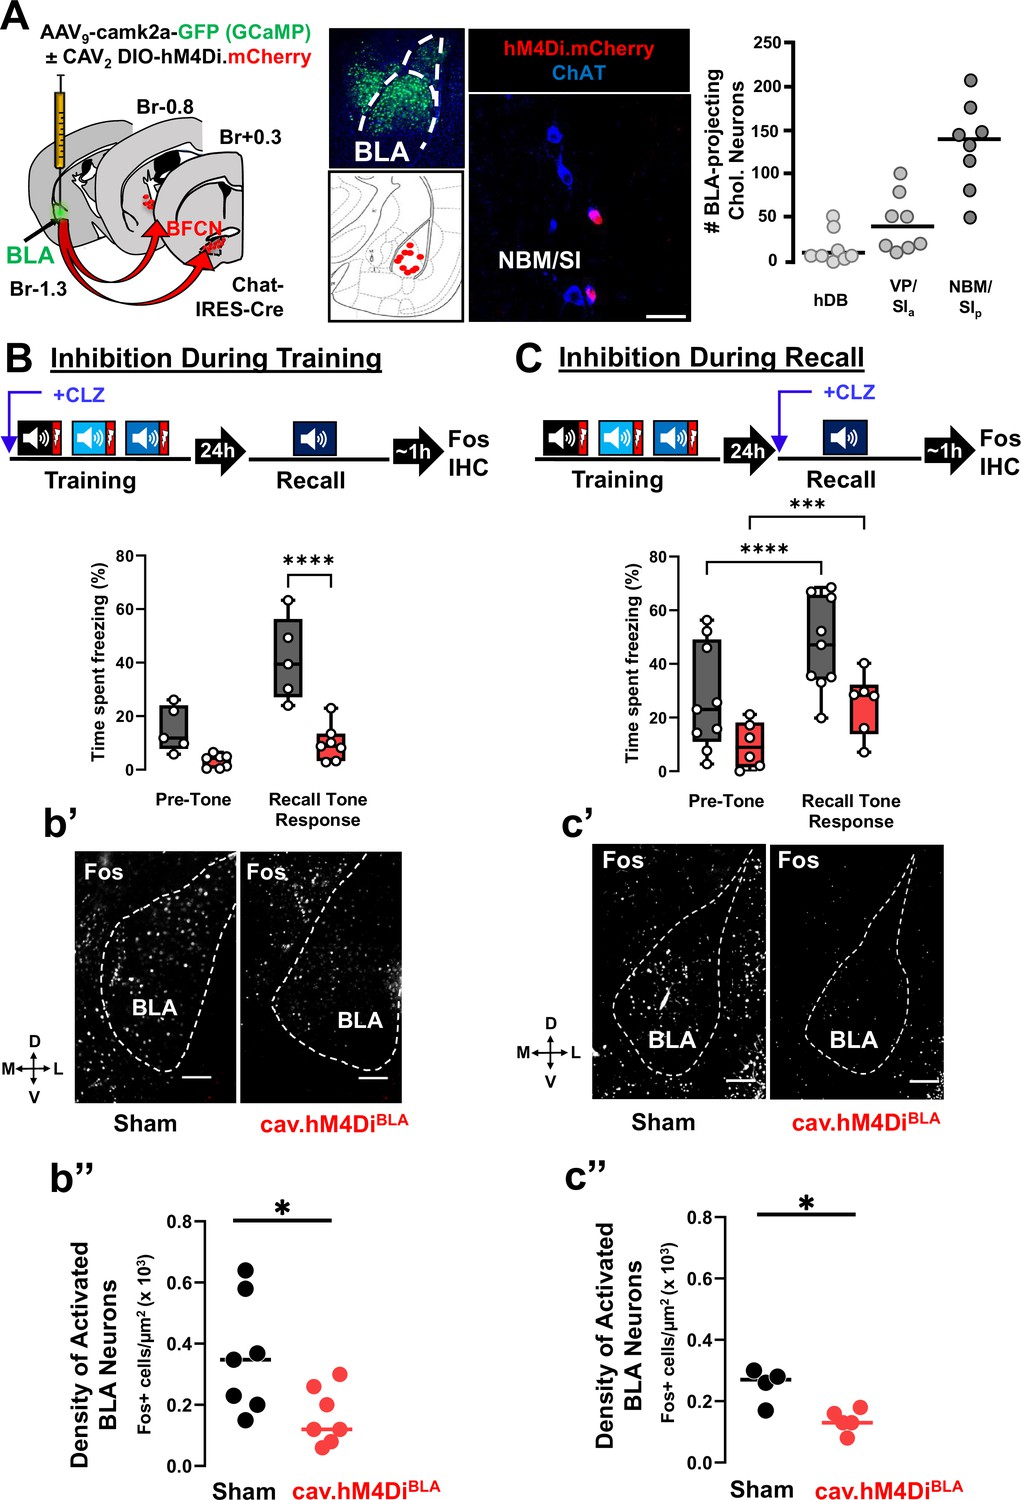
Basolateral amygdala (BLA)-projecting cholinergic neuronal activity is required both during training and during recall for learned threat processing (see Figure 5—figure supplements 1 and 2).
(A) Left: Strategy for retrograde targeting of hM4Di DREADD to BLA-projecting cholinergic neurons. Middle: Re-localization of BLA injection sites (using AAV9-camk2a-GCaMP6f to mark the injection site), and identification of retrogradely labeled cholinergic neurons within the nucleus basalis and posterior substantia innominata (NBM/SIp; scale bar = 50 µm). Right: Quantification of hM4Di-expressing cholinergic populations (mCherry+) across the basal forebrain (n = 8 mice, 56–80 sections) (Bregma +0.6 mm to −1.5 mm). (B) BLA-projecting cholinergic neurons were silenced by injecting mice with clozapine (CLZ) 10 min prior to training. Percent time freezing during the recall session including the pre-tone (baseline) period and in response to the conditioned tone. CLZ was only administered during the training session (repeated measures (RM) two-way analysis of variance (ANOVA), Time × Group p = 0.0047; Group p = 0.0007). Sham vs. DREADD (Tone response, ****p < 0.0001, Bonferroni corrected). (b’) DREADD-induced silencing of BLA-projecting cholinergic neurons during training reduced BLA Fos immunoreactivity following recall. Representative BLA images from sham injected and CAV2-DIO-hM4Di mice fixed and stained with anti-Fos antibodies (white) at 45–60 min following recall. Dotted line outlines the BLA (scale bar = 100 µm). (b’’) The density of recall-activated BLA neurons under sham injected conditions vs. following selective inhibition of the BLA-projecting cholinergic neurons using CAV2-hM4Di (Fos+). Fos+ cell density in BLA sham injected (black) vs. CAV2-DIO-hM4Di.mcherry (red) (n = 7 mice/group, averaged from 22 sections sham vs. 28 sections hM4Di). Mann–Whitney test: *p = 0.0286. Lines represent median for each group. (C) BLA-projecting cholinergic neurons were silenced during recall (clozapine given ONLY 10 min prior to the recall). Freezing differed significantly between pre-tone vs. recall tone response for sham and DREADD groups (RM two-way analysis of variance (ANOVA), pre-tone vs. recall tone response, sham ****p < 0.0001; DREADD ***p = 0.0003). There was a significant effect of group, p = 0.0312. sham and DREADD groups were significantly different in their response to the recall tone, p = 0.0279. All multiple comparisons were Bonferroni corrected. (c’) hM4Di-induced silencing of BLA-projecting cholinergic neurons during recall reduced BLA Fos immunoreactivity following recall. BLA images following Fos immunostaining (scale bar = 100 µm). (c’’) Fos+ cell density in BLA between sham injected (black) vs. CAV2-DIO-hM4Di.mcherry (red) injected mice (n = 4–5 mice/group, averaged from 30 sections sham vs. 32 sections hM4Di). Mann–Whitney test: *p = 0.0317.
Figure 5—figure supplement 1
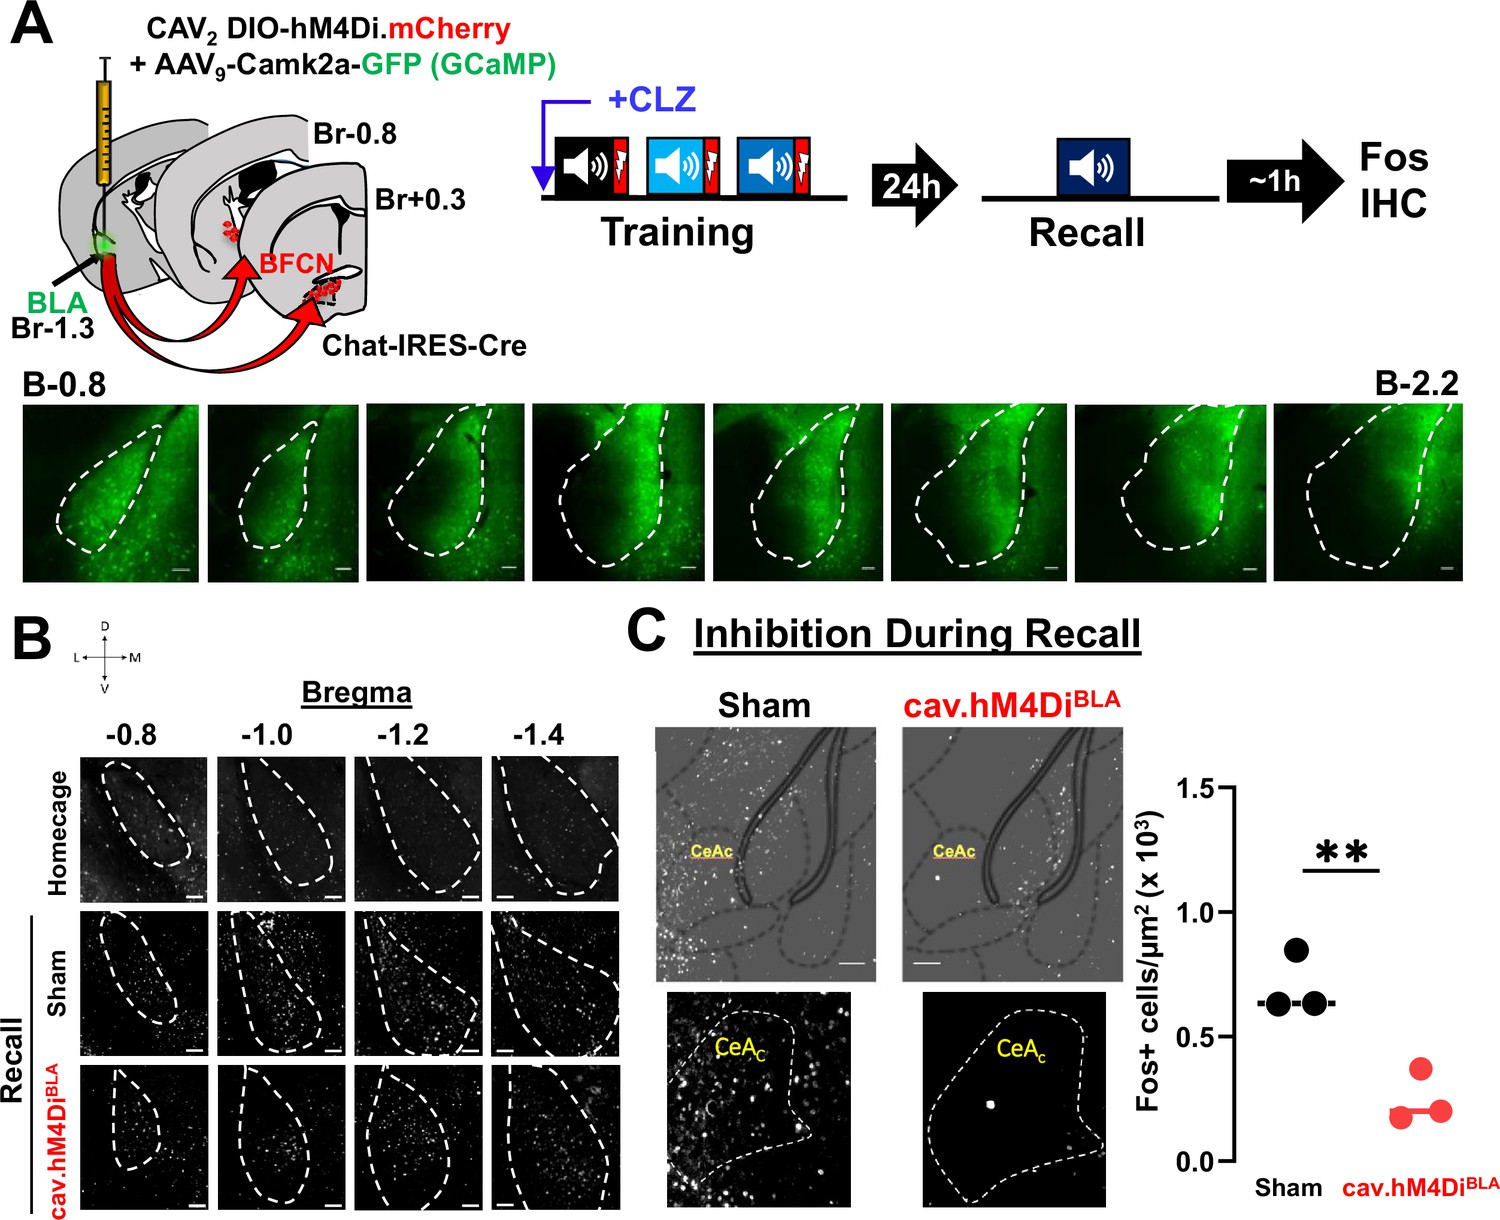
DREADD-induced silencing of basolateral amygdala (BLA)-projecting cholinergic neurons reduces threat induced activation of anterior BLA and CeC neurons.
(A) Top: Strategy for retrograde targeting of hM4Di DREADD to BLA-projecting cholinergic neurons. BLA-projecting cholinergic neurons were silenced by injecting mice with clozapine (CLZ) prior to training. Recall was conducted 24 hr later and mice were euthanized 45–60 min after recall and probed for Fos immunoreactivity in the BLA. Bottom: Representative images from a mouse showing expression of GFP (AAV9-camk2a-GCaMP6f co-injected with the CAV2-DIO-hM4Di.mCherry virus) across the A–P extent of the BLA. Scale bar = 50 µm. (B) Representative images from home cage control, sham and cav.hM4DiBLA mice at bregma locations from −0.8 to −1.4 mm showing Fos immunoreactivity (grayscale). Silencing BLA-projecting basal forebrain cholinergic neurons (BFCNs) during training reduced Fos expression in the BLA during recall. BLA is outlined by white dashed lines. Scale bar = 50 µm. (C) Silencing BLA-projecting cholinergic neurons during Recall reduced Fos immunoreactivity in the capsular portion of the central amygdala (CeAc/CeC) when profiled following recall. Images of CeC Fos immunoreactivity in sham vs. CAV2-DIO-hM4Di.mcherry (image taken at A/P = −0.8 from Bregma− low-magnification images shown above with atlas overlay). Fos+ cell density in CeC of sham vs. CAV2-DIO-hM4Di.mcherry injected mice (n = 3 mice/group, averaged from 6 sections control vs. 7 sections hM4Di). Welch’s t-test: **p = 0.0091.
Figure 5—figure supplement 2

Role of nucleus basalis and posterior substantia innominata (NBM/SIp) in associative threat memory recall.
(A) Top: NBM/SIp of Chat-IRES-Cre mice was directly targeted with an AAV9-DIO-hM4Di.mCherry (DREADD) or AAV9-DIO-eCFP (sham) and cholinergic neurons were silenced during recall. Bottom: Freezing behavior during recall (pre-tone period, recall tone response) (repeated measures (RM) two-way analysis of variance (ANOVA; GLM) Time × Group p = 0.0017); Sham mice displayed significant increase in freezing to the recall tone (pre-tone vs. recall tone response, ***p = 0.0004). Silencing the NBM/SIp significantly reduced freezing to the tone (p = **0.0058) (sham, n = 5, hM4Di n = 4).
Figure 6 with 2 supplements
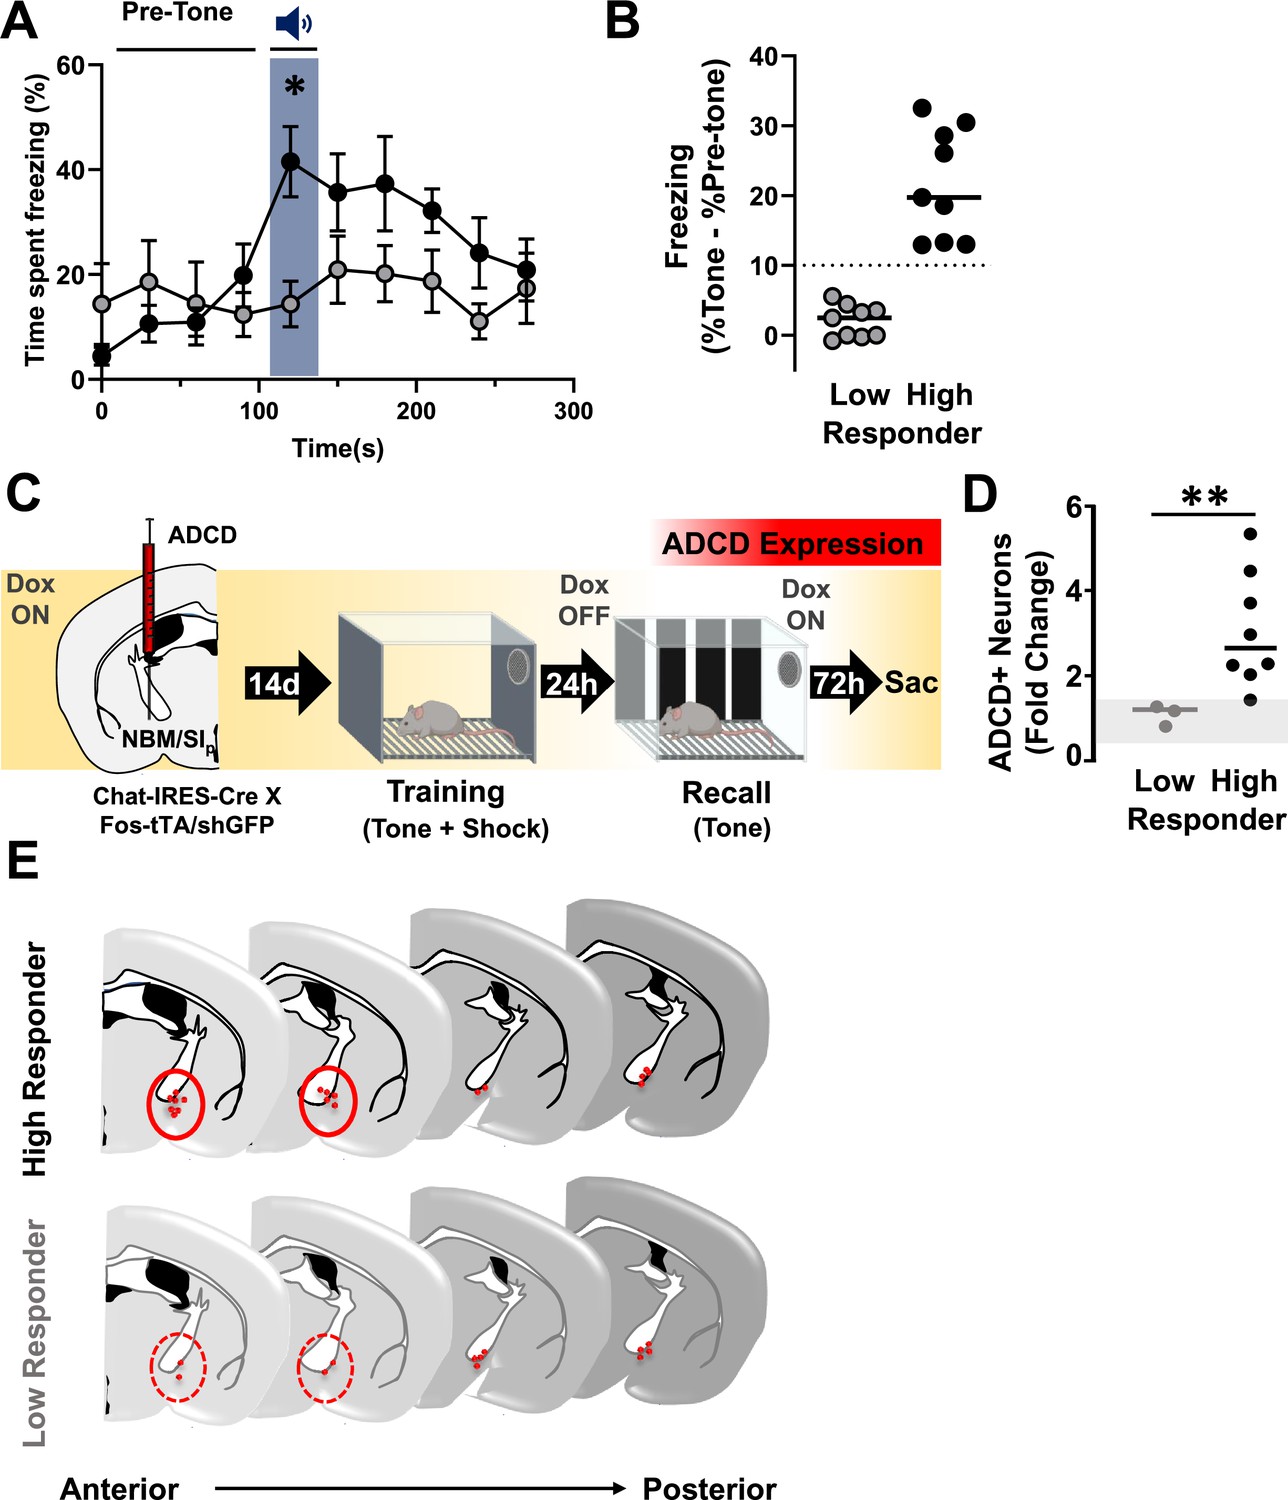
The extent of cholinergic neuronal activation in the anterior nucleus basalis and posterior substantia innominata (NBM/SIp) co-varies with the behavioral performance during threat memory recall (see Figure 6—figure supplements 1 and 2).
(A) Behavioral performance (freezing) from recall session showing High (black, n = 9) and Low (gray, n = 9) responding mice. High Responders show significantly higher freezing to recall tone whereas low responders do not (two-way repeated measures (RM) analysis of variance (ANOVA)). Interaction effect (Time × Group classification, p = 0.0001; Time, p = 0.0042. High vs. Low Responder *p = 0.0454; Pre-tone vs. Tone: High Responder, p = 0.0016; Low Responder, p > 0.9999). All multiple comparisons were Bonferroni corrected. (B) Quantification of change in freezing responses during recall session in Low and High Responders (pre-tone to tone). Dotted line delineates 10% points change in freezing, which was set as criteria for separating the two populations (see Methods for rationale on stratification criteria, n = 9 Low Responder, n = 9 High Responder). (C) Mice injected in the NBM/SIp with ADCD-mCherry underwent training on Dox and recall off Dox to label recall-activated NBM/SIp cholinergic neurons (n = 11). (D) Quantification of change in number of cholinergic neurons activated (ADCD+) in low or High Responders relative to the home cage. The number of ADCD+ neurons differed significantly between Low and High Responders (Mann–Whitney test, **p = 0.01) (n = 3 Low Responder, n = 8 High Responder). Gray shading represents the range of fold-change in ADCD+ cells in individual home cage mice relative to the average of all home cage mice (n = 5) (Mann–Whitney test, home cage vs. Low Responder, p > 0.9999; home cage vs. High Responder, p = 0.0121). (E) Schematic showing anatomical distribution of ADCD-labeled NBM/SIp basal forebrain cholinergic neurons (BFCNs) activated during recall across the anterior (bregma ~−0.8 mm) to posterior (bregma ~−1.3 mm) extent of the NBM/SIp in High Responders (Top) vs. Low Responders (Bottom). Red circles highlight region of notable difference between High and Low responding mice.
© 2024, BioRender Inc. Figure 6 was created using BioRender, and is published under a CC BY-NC-ND license. Further reproductions must adhere to the terms of this license.
Figure 6—figure supplement 1

Reactivation of training-activated cholinergic neurons scales with associative threat learning and with behavioral performance during memory recall.
(A) Left: Strategy for labeling activated nucleus basalis and posterior substantia innominata (NBM/SIp) cholinergic during training and recall. Chat-IRES-Cre × Fos-tTA/shGFP mice (n = 14) were injected in the NBM/SIp with ADCD-mCherry virus. During Session 1 (off Dox) mice either remained in their home cage, were exposed to three tones (Tone alone), or were exposed to three tone–shock pairings. During session 2 (recall session, on Dox, conducted 72 hr after training), mice remained in home cage or were exposed to a single tone. Cholinergic neurons activated during training express mCherry (red during training), and cells activated during recall transiently express GFP (green during recall). Non-activated neurons are shown in gray. Right: Quantification of percent reactivated cholinergic neurons (activated both during session 1 and during session 2 vs. the total number of cholinergic neurons activated during session 1). Home cage (n = 4 mice), tone only (n = 2 mice) and tone + shock (n = 11 mice – High Responders (based on threshold of 10%-point change in freezing to recall tone) (n = 2 mice), Low responders (n = 6 mice)) conditions. Lines in scatter plots represent medians. (B) Left: Strategy for retrograde targeting of hM4Di DREADD to basolateral amygdala (BLA)-projecting cholinergic neurons. Right: Silencing BLA-projecting cholinergic neurons increases the proportion of low responding mice. Control and hM4Di expressing mice to which clozapine was injected 10 min prior to training (left) or recall (right) were stratified into Low Responders (black fill) and High Responders (white fill). Silencing BLA-projecting cholinergic neurons during training resulted in 100% Low Responders during recall (sham 1 of 5 Low Responders; hM4Di 7 of 7 Low Responders), whereas silencing BLA-projecting cholinergic neurons during recall shifted the proportion of Low Responders from ~11% in the sham (1 of 9) to 50% (3 of 6).
Figure 6—figure supplement 2
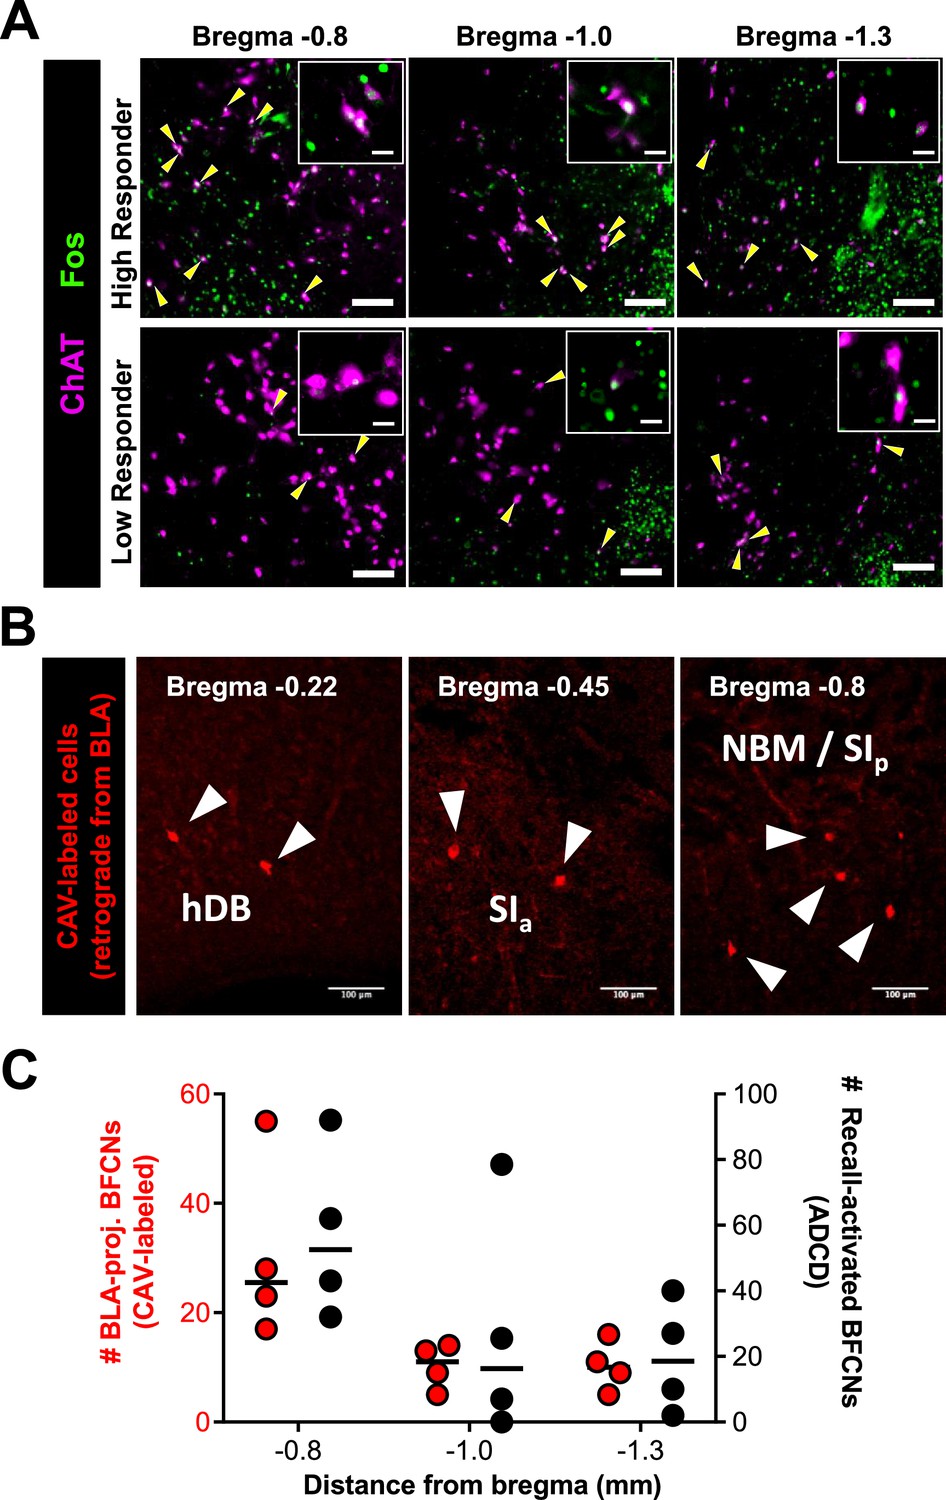
Recall-activated basal forebrain cholinergic neurons (BFCNs) in nucleus basalis and posterior substantia innominata (NBM/SIp) of ‘High Responder’ mice are located at a basolateral amygdala (BLA)-projecting locus in the cholinergic basal forebrain.
(A) Representative images of the NBM/SIp at bregma locations −0.8, 1.0, and 1.3 mm from a Fos-tTA/shGFP High Responder (top) and Low Responder (bottom) mouse sacrificed 2.5 hr after recall. Brain sections were stained for ChAT (magenta), and GFP to amplify Fos signal (green). ChAT+ and Fos+ co-labeled cells are marked by yellow arrowheads. Scale bar = 50 µm. Insets show magnified images of ChAT+ and Fos+ neurons. Scale bar = 10 µm. (B) Representative images from Chat-IRES-Cre mice injected with CAV2-DIO-hM4Di.mCherry. mCherry-expressing (red) represent BLA-projecting cholinergic neurons retrogradely labeled. Scale bar = 100 µm. (C) Quantification of BLA-projecting BFCNs (red dots, left y-axis) and Recall-activated BFCNs (black dots, right y-axis) in the NBM/SIp stratified by bregma locations (n = 4 mice).
Figure 7 with 1 supplement
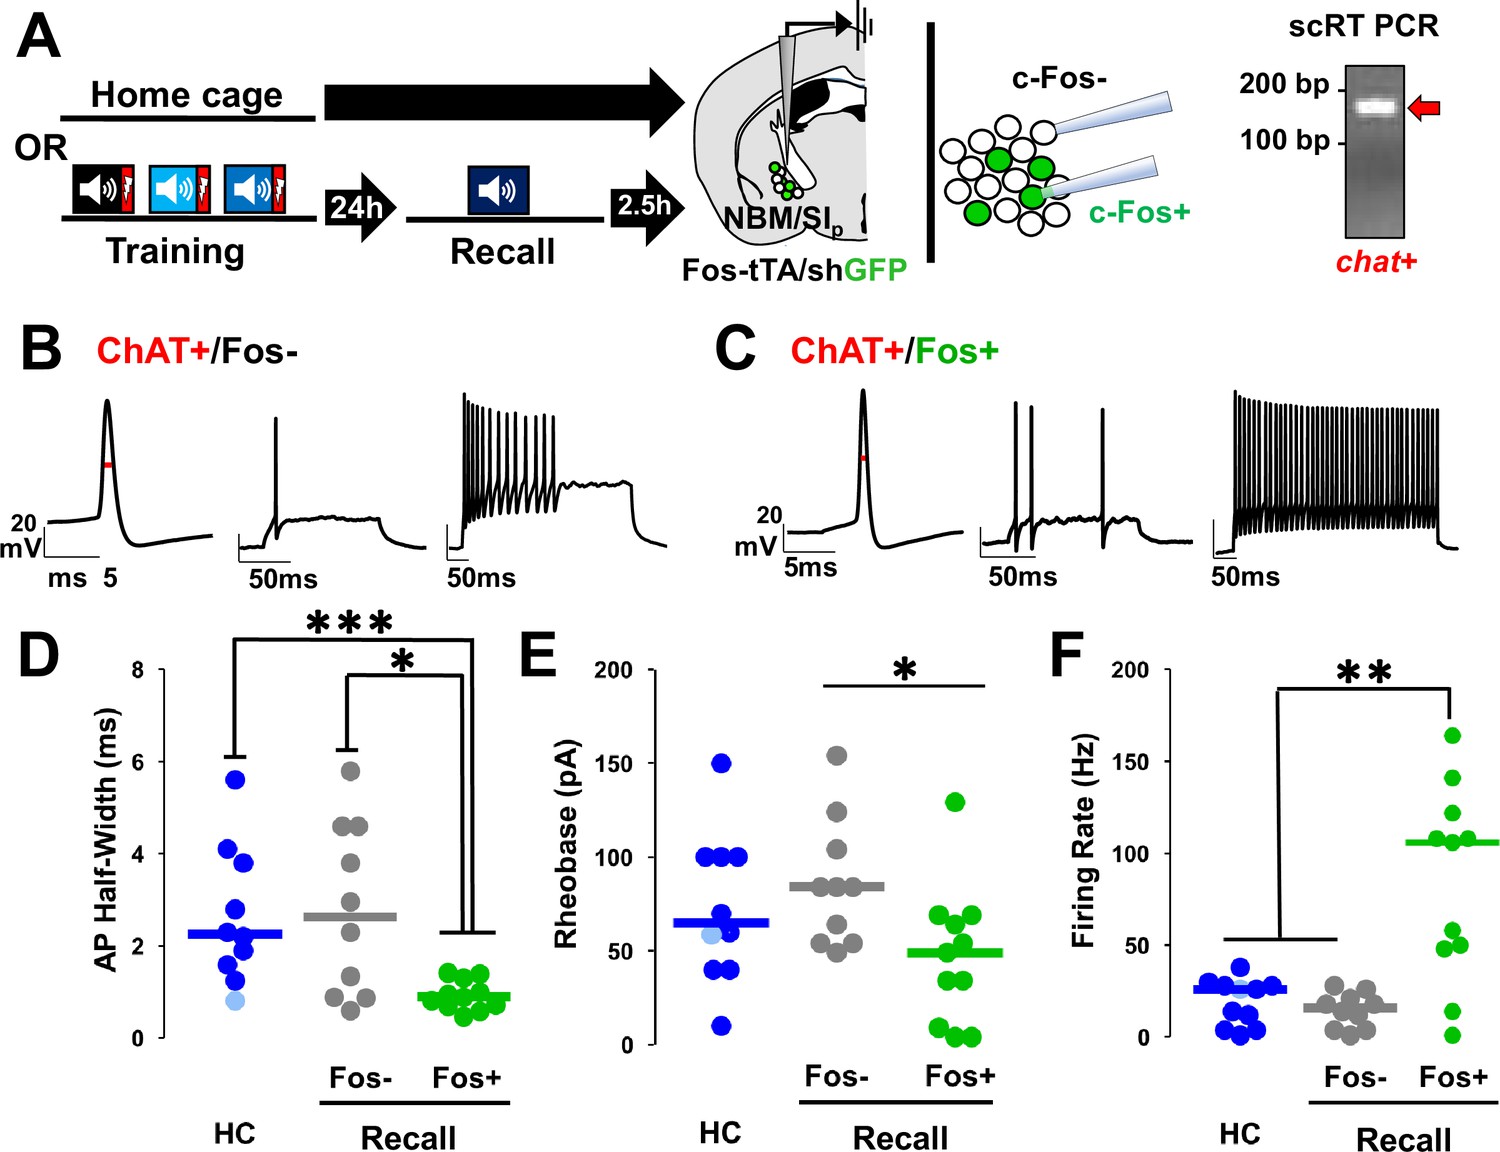
Nucleus basalis and posterior substantia innominata (NBM/SIp) cholinergic neurons show increased intrinsic excitability following threat memory recall (see Figure 7—figure supplement 1).
(A) Schematic of electrophysiological profiling of activated (Fos−shGFP+) vs. non-activated (Fos−shGFP−) neurons from mice following recall or in home cage mice, with post hoc identification of cholinergic identity by single-cell RT-PCR and evaluation of chat expression. (B) Representative traces following injection of current into a Fos−shGFP− NBM/SIp cholinergic neuron (ChAT+/Fos−). Red line denotes action potential (AP) half-width measurement. (C) Representative traces following step current injection in Fos-shGFP+NBM/SIp cholinergic neuron (ChAT+/Fos+). Red line denotes AP half-width measurement. (D–F) Population data (dot plot + line at median) for the electrophysiological properties of post hoc identified cholinergic neurons. Analyses assess passive and active membrane properties including AP (D) half-width, (E) rheobase, and (F) maximal firing rate in response to 200–500 ms depolarization from rest potential (−60 mV), from home cage (HC; n = 10–11 ChAT+ neurons from 10 to 11 mice) and following recall to tone alone (n = 10 ChAT+Fos−shGFP− neurons from 5 mice vs. n = 11 ChAT+Fos−shGFP+ neurons from 6 mice). (D) Kruskal–Wallis tests; AP half-width: p = 0.0054 (Dunn’s Corrected p-values: HC vs. Fos−shGFP−: p = 0.8971, HC vs. Fos−shGFP+: ***p = 0.0006, Fos−shGFP− vs. Fos−shGFP+: *p = 0.0206). (E) Rheobase: KW = p = 0.05 (Dunn’s Corrected p-values: HC vs. Fos−shGFP−: p = 0.6153, HC vs. Fos−shGFP+: p = 0.0938, Fos−shGFP− vs. Fos−shGFP+: *p = 0.0228). (F) Max firing rate: p = 0.0032 (Dunn’s Corrected p-values: HC vs. Fos−shGFP−: p = 0.3206, HC vs. Fos−shGFP+: **p = 0.003, Fos−shGFP− vs. Fos−shGFP+: **p = 0.0034).
Figure 7—figure supplement 1
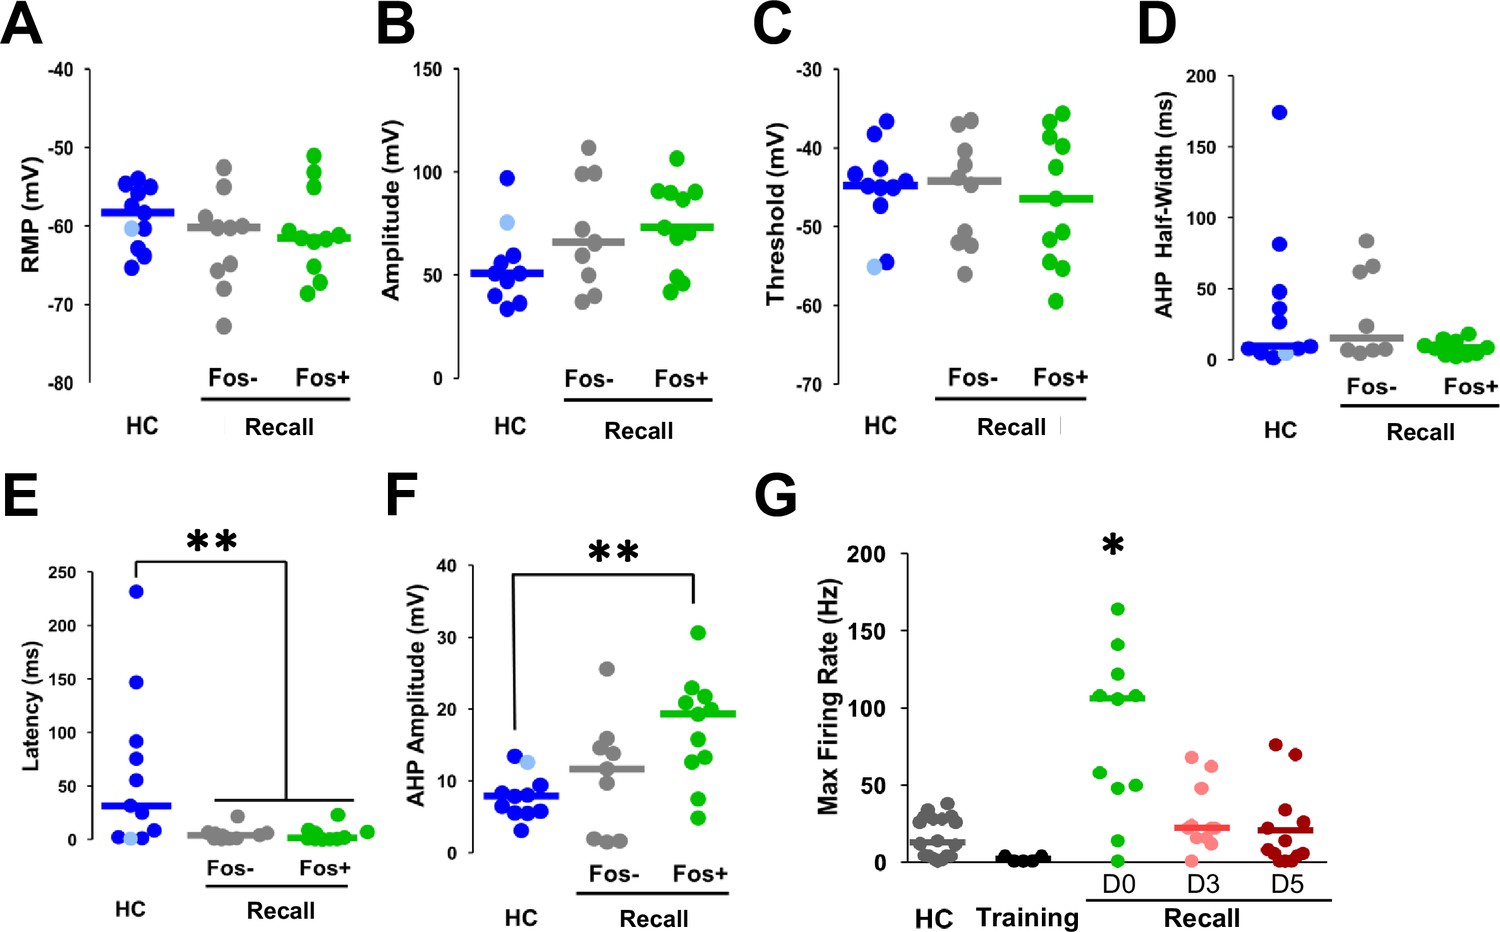
Latency and afterhyperpolarization (AHP) amplitudes significantly differed in recall-activated nucleus basalis and posterior substantia innominata (NBM/SIp) cholinergic neurons.
(A–F) Additional plots of population data on NBM/SIp cholinergic neurons presented as dot plot + median for the electrophysiological properties of post hoc identified cholinergic neurons from home cage (HC, n = 10–11 ChAT+ neurons from 10 to 11 mice) compared with those of Fos− and Fos+ cholinergic neurons following recall to tone alone (Fos−shGFP−: n = 10 ChAT+ neurons from 5 mice; Fos−shGFP+: n = 11 ChAT+ neurons from 6 mice). Kruskal–Wallis tests (A) resting membrane potential, p = 0.5272 (RMP); (B) action potential amplitude p = 0.1457; (C) threshold, p = 0.9635; (D) AHP half-width, p = 0.3235; (E) latency, p = 0.012 (Dunn’s Corrected p-values: HC vs. Fos−shGFP−: *p = 0.0163, HC vs. Fos−shGFP+: **p = 0.0062, Fos−shGFP− vs. Fos−shGFP+: p = 0.7394); and (F) AHP amplitude, p = 0.0174 (Dunn’s Corrected p-values: HC vs. Fos−shGFP−: p = 0.3702, HC vs. Fos−shGFP+: **p = 0.0041, Fos−shGFP− vs. Fos−shGFP+: p = 0.0952). (G) Population data presented as dot plot + median for max firing rate of post hoc identified cholinergic neurons from home cage, mice sac’d 2.5 hr following training, sac’d 2.5 hr post-recall (D0 – same as Figure 7F. Replotted for comparison here), and ADCD+ NBM neurons tagged during recall and identified 3 days post-recall (D3) and 5 days post-recall (D5) from Chat-IRES-Cre × Fos-tTA/shGFP mice injected with ADCD-mCherry with Dox off during recall. Kruskal–Wallis test, p = 0.0011 (D0 vs. all other groups *p < 0.05 – refer to stats table for details on all comparisons).
Figure 8 with 1 supplement
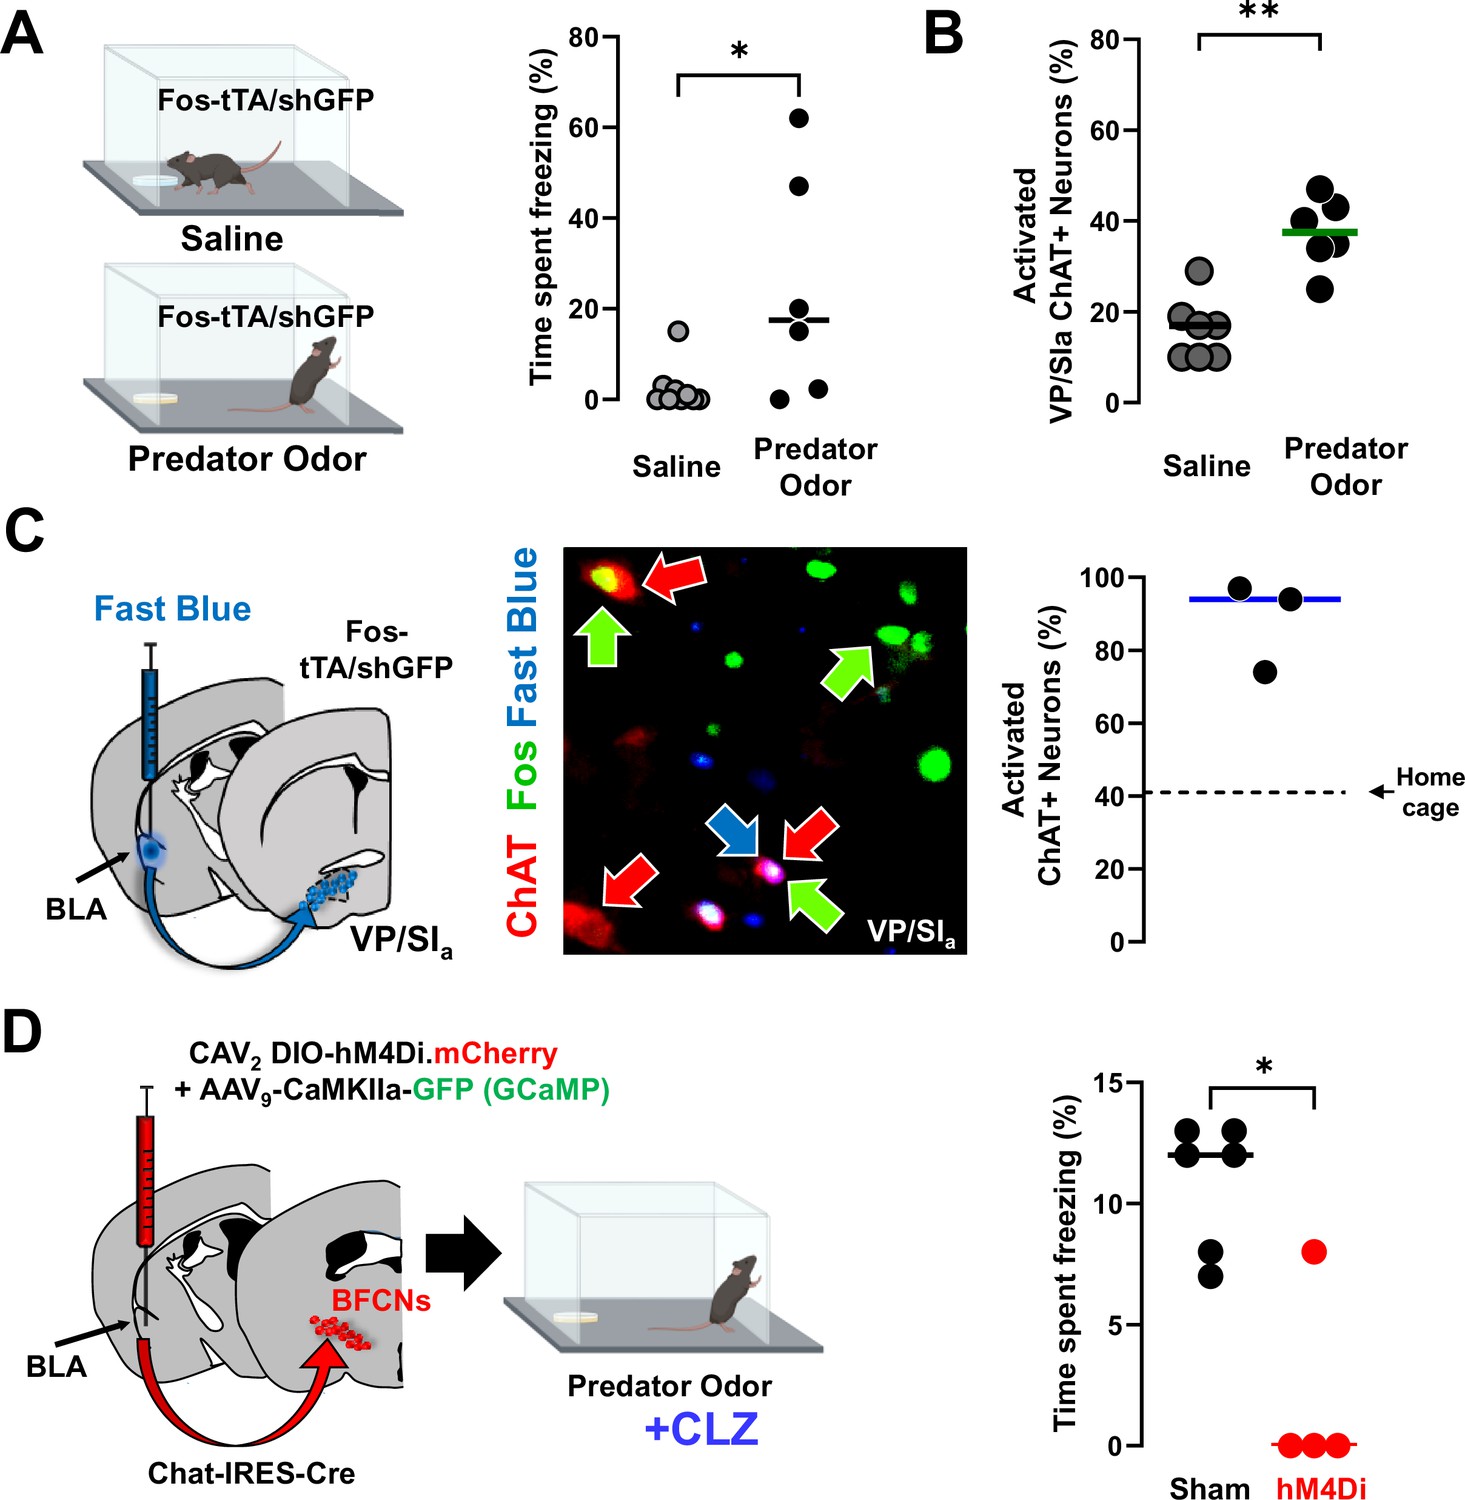
Distinct population of basolateral amygdala (BLA)-projecting cholinergic neurons contribute to innate threat processing (see Figure 8—figure supplement 1).
(A) Fos-tTA/Fos–shGFP mice were placed in chambers containing a gauze pad spotted with either saline or with mountain lion urine (predator odor). Defensive behaviors were monitored for 5 min. Mice froze significantly more in the presence of predator odor than saline (Mann–Whitney, *p = 0.028). (B) Basal forebrain sections from the ventral pallidum (VP/SIa) of Fos-tTA/shGFP mice were immunostained for ChAT and GFP 45 min following odor exposure. Predator odor-activated cholinergic neurons (GFP+/ChAT+) were quantified. Predator odor exposure increased the number of activated cholinergic neurons in the VP/SIa (Mann–Whitney: **p = 0.0023), n = 7 control and n = 6 odor exposed mice. (C) Fast Blue was injected into the BLA to retrogradely label BLA-projecting neurons 6 days prior to odor exposure. After exposure to predator odor sections from the basal forebrain were immunostained with antibodies recognizing ChAT and Fos and the numbers of activated cholinergic neurons were counted (ChAT+Fos+/total ChAT+). In the VP/SIa over 90% of BLA-projecting cholinergic neurons were activated (ChAT+ in red, Fos+ in green, Fast Blue in blue, n = 3 mice). Dotted line indicates % of Fos+ cholinergic neurons in the home cage group in this experiment. (D) Chat-IRES-Cre mice injected in the BLA with a control virus (AAV9-camk2a-GFP) alone (sham) or in combination with CAV2-DIO-hM4Di were exposed to predator odor following injection with clozapine (CLZ). Freezing behavior was measured during a 5-min exposure (scatter plot, bar indicates mean; sham – black, hM4Di – red). Silencing BLA-projecting cholinergic neurons significantly blunted the freezing response (Mann–Whitney: *p = 0.019; sham: n = 6; hM4Di: n = 4 mice).
© 2024, BioRender Inc. Figure 8 was created using BioRender, and is published under a CC BY-NC-ND license. Further reproductions must adhere to the terms of this license.
Figure 8—figure supplement 1
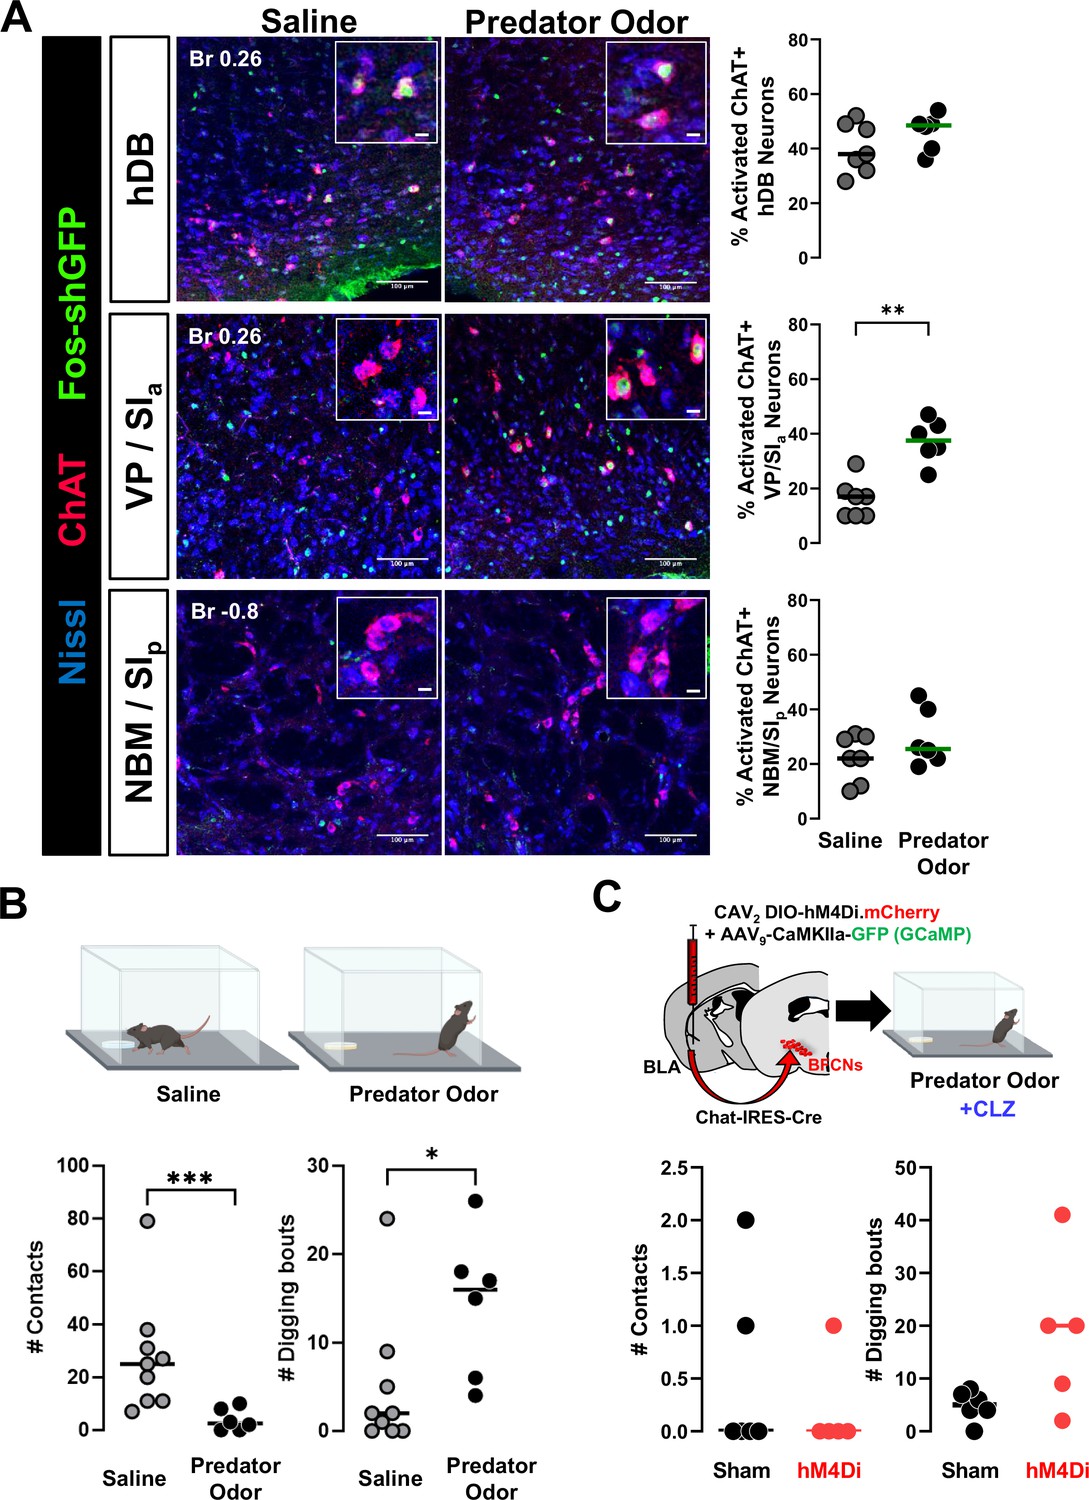
Predator odor exposure activates VP/SIa cholinergic neurons.
(A) Left: Fos-tTA/shGFP mice were exposed to predator odor or saline and sacrificed 2.5 hr later. Brain sections were processed for ChAT immunohistochemistry. Representative images of hDB, VP/SIa, and nucleus basalis and posterior substantia innominata (NBM/SIp) from saline exposed and predator odor exposed mice showing cholinergic neurons (red) expressing Fos-shGFP (green). Scale bar = 100 µm. Insets show magnified images of ChAT+Fos−shGFP+ neurons. Scale bar = 10 µm. Right: Quantification of % activated cholinergic neurons in the respective regions. Cholinergic neurons in the hDB (top, p = 0.2465) or NBM/SIp (bottom, p = 0.4441) were not significantly activated compared to saline controls. n = 7 control and n = 6 odor exposed mice. VP/SIa data (middle, **p=0.0023) from Figure 8B replotted for comparison. (B) Top: Schematic of behavior paradigm. Bottom: Number of contacts with odor pad (left) and number of digging bouts (right) during a 5-min saline or predator odor exposure (saline, gray: n = 9 mice and predator odor, black: n = 6 mice). Mice displayed defensive behaviors, including avoiding the odor pad and increased digging bouts in response to the predator odor. Mann–Whitney test: avoidance ***p = 0.001; digging: *p = 0.023. (C) Top: Schematic of targeting hM4Di to basolateral amygdala (BLA)-projecting cholinergic neurons and subsequent behavioral paradigm. Clozapine was administered to all mice 10 min prior to predator odor exposure. Bottom: Number of contacts with odor pad (left) and digging bouts (right) during a 5-min predator odor exposure in clozapine injected mice expressing hM4Di in BLA-projecting cholinergic neurons (sham n = 6 mice and hM4Di n = 5 mice). Silencing BLA-projecting cholinergic neurons did not affect avoidance behavior (# odor pad contacts) or digging. Mann–Whitney test: avoidance p = 0.8485; digging: p = 0.0714.
Author response image 1

Author response image 2

Author response image 3

Author response image 4

Tables
Appendix 1—key resources table
| Reagent type (species) or resource | Designation | Source or reference | Identifiers | Additional information |
|---|---|---|---|---|
| Strain, strain background (Mus musculus) | Chat-IRES-Cre | The Jackson Laboratory | B6;129S6-Chattm2(cre)Lowl/J | Stock number: 006410 |
| Strain, strain background (Mus musculus) | Fos-tTA, Fos−shGFP | The Jackson Laboratory | TetTag | Stock number: 018306 |
| Strain, strain background (Escherichia coli) | Stellar Competent Cells, HST08 | Takara | Cat#636766 | |
| Genetic reagent (AAV9) | AAV9-camk2a-GCaMP6f-WPRE-SV40 | Penn Vector Core | ||
| Genetic reagent (AAV9) | AAV9-DIO-eCFP | This paper, Vector Biolabs | Custom made | |
| Genetic reagent (AAV9) | AAV9-hSyn-GACh4.3 | Vigene Biosciences Inc | ||
| Genetic reagent (AAV8) | AAV8-DIO-hM4Di-mCherry | Addgene | Cat#44362 | |
| Genetic reagent (AAV9) | AAV9-TRE-DIO-oChIEF-mCherry-P2A-tTAH100Y.SV40 | This paper | plasmid DNA | See Methods and Figure 2—figure supplement 1, can be obtained from Talmage lab. |
| Genetic reagent (AAV9) | AAV9-TRE-DIO-hM4Di-mCherry | This paper | Cat#169415 | Deposited to Addgene, see methods and Figure 2—figure supplement 1, can be obtained from Talmage lab. |
| Genetic reagent (CAV2) | CAV2-DIO-hM4Di-mCherry | Dr. EJ Kremer, Institut de Génétique Moléculaire de Montpellier, France | ||
| Antibody | anti-ChAT (Goat polyclonal) | Millipore | Cat# AB144P; RRID:AB_2079751 | IHC (1:500) |
| Antibody | anti-GFP (Rabbit polyclonal) | Thermo Fisher Scientific | Cat#: A-11122; RRID:AB_221569 | IHC (1:1000) |
| Antibody | anti-GFP (Rabbit polyclonal) | Abcam | Cat#: ab13970; RRID:AB_300798 | IHC (1:500) |
| Antibody | anti-mCherry (Mouse monoclonal) | Takara | Cat#: 632543; RRID:AB_2307319 | IHC (1:500) |
| Antibody | anti-DsRed (Rabbit polyclonal) | Takara | Cat#: 632496; RRID:AB_10013483 | IHC (1:500) |
| Antibody | anti-c-Fos (Rabbit polyclonal) | Synaptic Systems | Cat#: 226003; RRID:AB_2231974 | IHC (1:500) |
| Antibody | anti-Rabbit IgG (H+L)-AlexaFluor 488 (Donkey polyclonal) | Thermo Fisher | Cat#: A32790; RRID:AB_2762833 | IHC (1:1000) |
| Antibody | anti-Rabbit IgG (H+L)-Rhodamine Red-X (Donkey polyclonal) | Jackson Immunoresearch | Cat#: 711-295-152; RRID:AB_2340613 | IHC (1:1000) |
| Antibody | anti-Goat IgG (H+L)- AlexaFluor 594 (Donkey polyclonal) | Thermo Fisher | Cat#: A-11058; RRID:AB_142540 | IHC (1:1000) |
| Antibody | anti-Chicken IgY-Cy2 (Donkey polyclonal) | Gift from Dr.Shaoyu Ge, Stony Brook University NY | IHC (1:1000) | |
| Chemical compound | NeuroTrace 435/455 Blue Fluorescent Nissl Stain | Thermo Fisher | Cat#: N21479 | IHC (1:500) |
| Recombinant DNA reagent | pAAV-hSyn-DIO-hM4D(Gi)-mCherry (plasmid) | Addgene | Cat#44362 | |
| Recombinant DNA reagent | pV2SGE (plasmid) | This paper | Gift from Dr.Shaoyu Ge, Stony Brook University NY | Used in the construction of reagent #25 |
| Recombinant DNA reagent | pAAV-TRE-DIO-oChIEF-mCherry-P2A-tTAH100Y.SV40 (plasmid) | This paper | Deposited to Addgene | Addgene Cat# 169414 |
| Recombinant DNA reagent | pAAV-TRE-DIO-hM4Di-mCherry (plasmid) | This paper | Deposited to Addgene | Addgene Cat# 169415 |
| Sequence-based reagent | chat_F | IDT | PCR primers | TCTGGCAACTTCGTCGGA |
| Sequence-based reagent | chat_R | IDT | PCR primers | CTCCTGGGCTGTTACGCAC |
| Sequence-based reagent | pV2.1 – Gene Block 7xTetO-LoxP-Lox2272-tTAH100Y.SV40 | IDT | Gene block, custom | |
| Sequence-based reagent | pV2.2 – Gene Block oChIEF-LoxP-Lox2272 | IDT | Gene block, custom | |
| Commercial assay or kit | In-Fusion HD Cloning Plus | Takara/Clontech | Cat#: 638920 | |
| Commercial assay or kit | High-Capacity cDNA Reverse Transcription Kit | Applied Biosystems | Cat#: 4368814 | |
| Peptide, recombinant protein | T4 DNA Ligase | NEB | Cat#M0202S | |
| Peptide, recombinant protein | BglII | NEB | Cat#R0144S | |
| Peptide, recombinant protein | AscI | NEB | Cat#R0558S | |
| Peptide, recombinant protein | BamHI-HF | NEB | Cat#R3136S | |
| Peptide, recombinant protein | PmlI | NEB | Cat#R0532S | |
| Peptide, recombinant protein | Phusion High-Fidelity DNA Polymerase | NEB | Cat#M0530S | |
| Chemical compound, drug | Clozapine | Sigma-Aldrich | Cat#C6305-25MG | |
| Chemical compound, drug | Fast Blue | Polysciences Inc | Cat#17740-1 | |
| Other | Mt.Lion Urine | Maine outdoor solutions LLC | Obtained from https://predatorpeestore.com/. | |
| Software, algorithm | Prism | GraphPad Software Inc | RRID:SCR_002798 | |
| Software, algorithm | Sigmaplot 12.5 | Systat Software Inc | RRID:SCR_003210 | |
| Software, algorithm | OriginPro 9.1 | Origin Lab Corporation | RRID:SCR_014212 | |
| Software, algorithm | Fiji is just imagej | Fiji | RRID:SCR_002285 | |
| Software, algorithm | FreezeFrame v3 | Actimetrics | RRID:SCR_014429 | |
| Software, algorithm | MATLAB | Mathworks | RRID:SCR_001622 | |
| Software, algorithm | Pre-processing analysis MATLAB Script for FiberPhotometry | Doric | ||
| Software, algorithm | ACh sensor analysis MATLAB script | Crouse, Richard B., et al. Elife 9 (2020): e57335 |
Author response table 1
| Max Firing Rate | 0.0032 |
|---|---|
| HC vs. Fos- | 0.3206 |
| HC vs. Fos+ | 0.003 |
| Fos- vs. Fos+ | 0.0034 |
Additional files
-
Supplementary file 1
Statistical reporting table.
This file contains exact sample sizes for each group, group median, 95% confidence interval of the median, actual confidence interval, statistical test used, p-values, and test statistic for each of the reported plots in the manuscript.
- https://cdn.elifesciences.org/articles/86581/elife-86581-supp1-v2.xlsx
-
MDAR checklist
- https://cdn.elifesciences.org/articles/86581/elife-86581-mdarchecklist1-v2.pdf
Download links
A two-part list of links to download the article, or parts of the article, in various formats.
Downloads (link to download the article as PDF)
Open citations (links to open the citations from this article in various online reference manager services)
Cite this article (links to download the citations from this article in formats compatible with various reference manager tools)
Functionally refined encoding of threat memory by distinct populations of basal forebrain cholinergic projection neurons
eLife 13:e86581.
https://doi.org/10.7554/eLife.86581


