Longitudinal map of transcriptome changes in the Lyme pathogen Borrelia burgdorferi during tick-borne transmission
- Department of Biochemistry & Biophysics, University of California, San Francisco, United States
- Department of Pharmaceutical Chemistry and Cardiovascular Research Institute, University of California, San Francisco, United States
- Division of Biological Sciences, University of Montana, United States
Figures
Figure 1 with 2 supplements
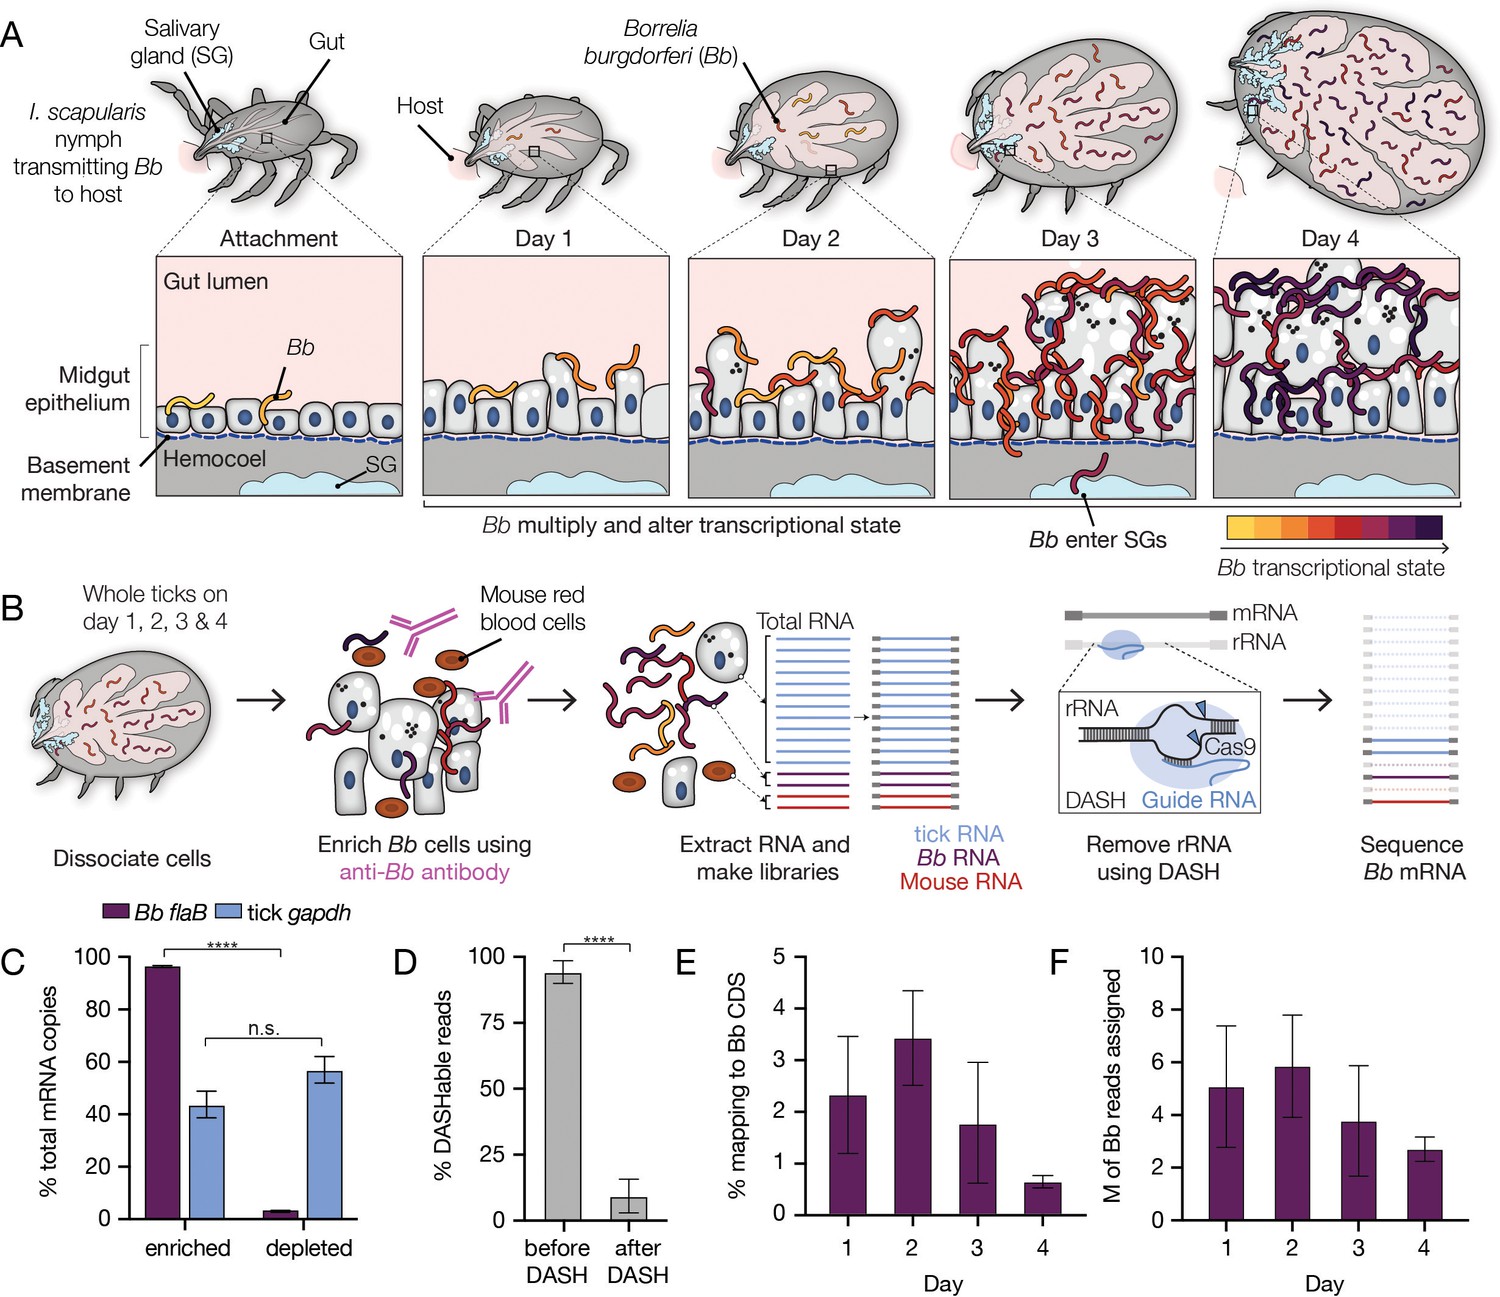
A two-step enrichment process facilitates robust transcriptional profiling of Bb during the tick bloodmeal.
(A) Schematic of Bb during nymphal I. scapularis feeding. Bb in the nymphal tick midgut respond to the nutrient-rich bloodmeal by multiplying and changing their transcriptional state (Ouyang et al., 2012; de Silva and Fikrig, 1995). At the same time, the tick gut undergoes numerous changes to digest the bloodmeal (Caimano et al., 2015; Sonenshine and Anderson, 2014). After two to three days of feeding, a small number of Bb leave the midgut and enter the salivary glands (blue), while the majority are left behind in the gut after engorgement (Dunham-Ems et al., 2009). (B) Schematic of Bb enrichment process from feeding ticks. Whole ticks are dissociated, αBb antibodies are added to lysates, and antibodies and Bb are captured magnetically. RNA is extracted and RNA-seq libraries are prepared. DASH is then used to remove rRNA before sequencing. This process increases Bb reads in the resulting sequencing data. (C) RT-qPCR results showing the percentage of Bb flaB and I. scapularis gapdh RNA in the enriched versus depleted fractions after the enrichment process. Data come from 4 replicates each from day 2, day 3, and day 4, mean +/-SE. ****p-value <0.0001, paired t test. Nearly all Bb flaB RNA was found in the enriched fraction. (D) The percentage of reads mapping to rRNA before and after DASH. n=4. Data are shown as mean +/-SD. ****p-value <0.0001, paired t test. rRNA reads are drastically reduced after DASH. (E) The percentage of reads in RNA-seq libraries mapping to Bb. Bb mRNA reads make up a larger proportion of libraries than without enrichment. n=4. Data are shown as mean +/-SD, see Figure 1—source data 1. (F) The number of reads in millions (M) mapped to Bb for each day. n=4. Data are shown as mean +/-SD. An average of 4.3 million reads per sample mapped to Bb genes, covering 92% of annotated genes with at least 10 reads.
-
Figure 1—source data 1
Overview of mapping statistics from 16 Bb sequencing samples.
- https://cdn.elifesciences.org/articles/86636/elife-86636-fig1-data1-v1.xlsx
Figure 1—figure supplement 1
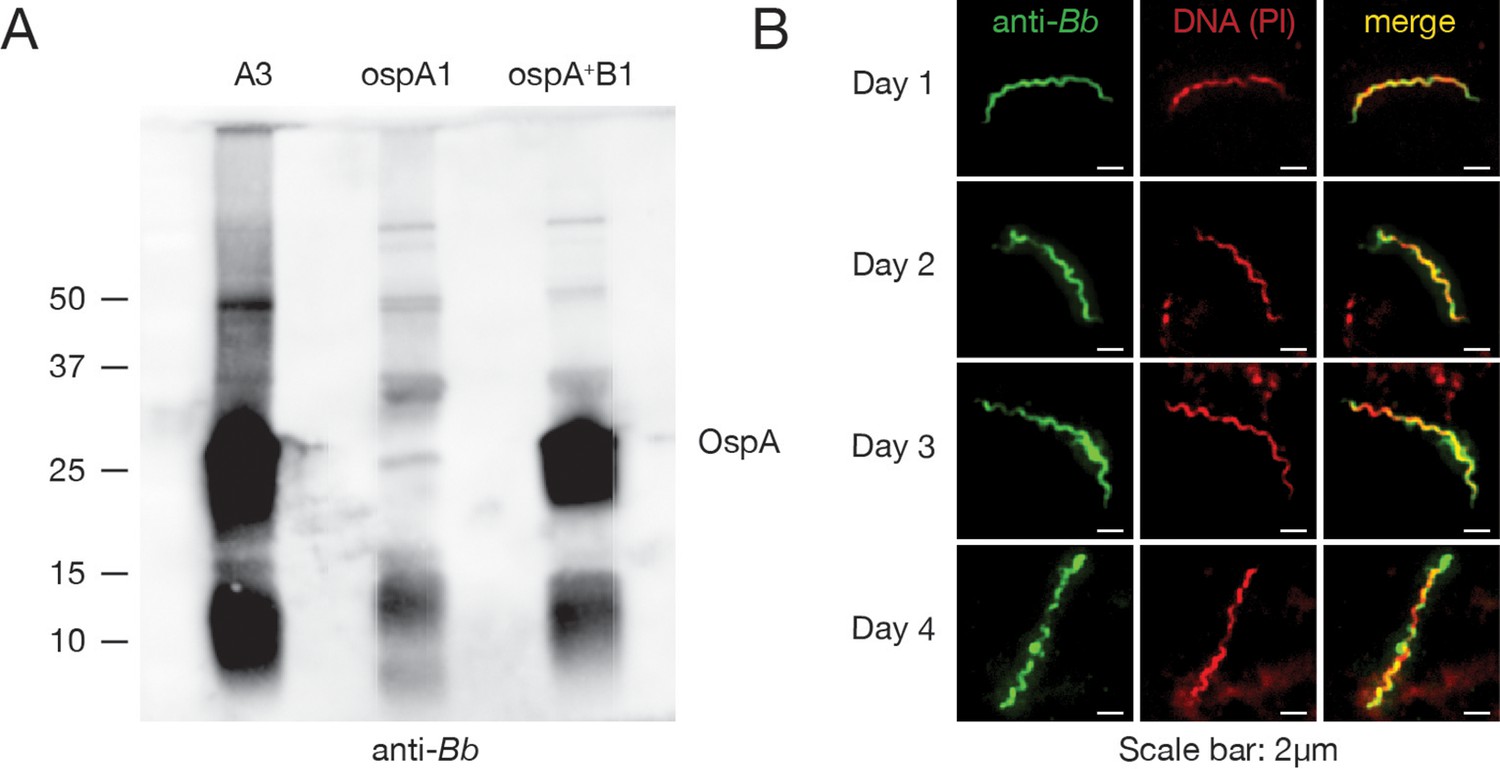
αBb antibody recognizes OspA and binds Bb in the tick throughout the bloodmeal.
(A) Western blot with αBb on lysate from cultured Bb: wildtype (A3, left), a mutant lacking ospA (ospA1), and the mutant with ospA restored (ospA +B1) (Battisti et al., 2008). Molecular weight markers are shown on left (kD), and OspA size is noted on right. αBb recognizes OspA among other proteins. (B) Immunofluorescence microscopy with αBb (green, left) and propidium iodide (PI) (DNA, red, center) on each day of feeding (merge is yellow, right). αBb antibody recognizes Bb in the tick across the bloodmeal.
-
Figure 1—figure supplement 1—source data 1
Full unedited original western blot of αBb on lysate from cultured Bb.
- https://cdn.elifesciences.org/articles/86636/elife-86636-fig1-figsupp1-data1-v1.pdf
-
Figure 1—figure supplement 1—source data 2
Labeled uncropped western blot of αBb on lysate from cultured Bb: wildtype (A3), a mutant lacking ospA (ospA1), and the mutant with ospA restored, ospB restored, and ospC restored. Molecular weight markers are shown on left (kD), and OspA size is noted on right.
OspB and OspC restored lanes are not included in the figure for simplicity.
- https://cdn.elifesciences.org/articles/86636/elife-86636-fig1-figsupp1-data2-v1.pdf
Figure 1—figure supplement 2

Enrichment process does not induce large scale gene expression changes in in vitro cultured Bb.
Log2 fold changes versus mean normalized number of read counts comparing cultured Bb input and samples after enrichment with αBb. n=3. Red dots, p-value <0.05, Wald tests, see Figure 1—figure supplement 2—source data 1. The gene expression changes induced during processing are much smaller than those observed between days of feeding.
-
Figure 1—figure supplement 2—source data 1
Differential expression analysis results between in vitro cultured Bb before and after Bb enrichment.
- https://cdn.elifesciences.org/articles/86636/elife-86636-fig1-figsupp2-data1-v1.xlsx
Figure 2 with 2 supplements

Global ex vivo profiling of Bb reveals extent and kinetics of transcriptional changes.
(A) Principal component analysis of normalized read counts from samples from across feeding, see Figure 2—source data 1. PC1 correlates strongly with day of feeding. (B) Schematic depicting how data was analyzed, as pairwise comparisons between the first day after attachment and all other days. (C–E) Volcano plots of differentially expressed genes comparing day 2 versus day 1 (C), day 3 versus day 1 (D), and day 4 versus day 1 (E). The total number of upregulated genes is shown in the top right and the number of downregulated genes is shown in the top left. Yellow dots are genes that first change expression between day 1 and day 2, red dots are genes that first change expression between day 1 and day 3, and purple dots are genes that first change expression between day 1 and day 4. Two genes with log2 fold changes >4 are shown at x=4, and five genes with -log10(padj)>60 are shown at y=60. Only genes with p-value <0.05 from Wald tests and at least a twofold change are highlighted, see Figure 2—source data 2. n=4. By day 4 of feeding, 153 genes are upregulated and 33 genes are downregulated from day 1 baseline levels.
-
Figure 2—source data 1
DESeq2 normalized counts for all genes across all samples.
- https://cdn.elifesciences.org/articles/86636/elife-86636-fig2-data1-v1.xlsx
-
Figure 2—source data 2
Transcriptome-wide differential expression analysis results from Bb across tick feeding timepoints.
- https://cdn.elifesciences.org/articles/86636/elife-86636-fig2-data2-v1.xlsx
Figure 2—figure supplement 1

Ex vivo RNA-seq corroborates transcriptional programs in the tick.
(A) Tukey style boxplot of Transcripts Per Million (TPM) on each day for rpoS. Black dots represent replicates. n=4. ****p-value <0.00001, Wald test. rpoS expression increases over the course of feeding. (B) Volcano plot of DE genes comparing day 4 to day 1, with RpoS-upregulated genes (blue). Genes upregulated by RpoS in ticks increase during feeding. (C) Volcano plot of DE genes comparing day 4 to day 1, with Rrp1-upregulated (blue) and downregulated (pink) genes. Rrp1-regulated genes correlate well with genes up and downregulated during feeding. (D) Volcano plot of DE genes comparing day 4 to day 1, with RelBbu-upregulated (blue) and downregulated (pink) genes. About half of RelBbu genes change in the expected direction over feeding.
Figure 2—figure supplement 2
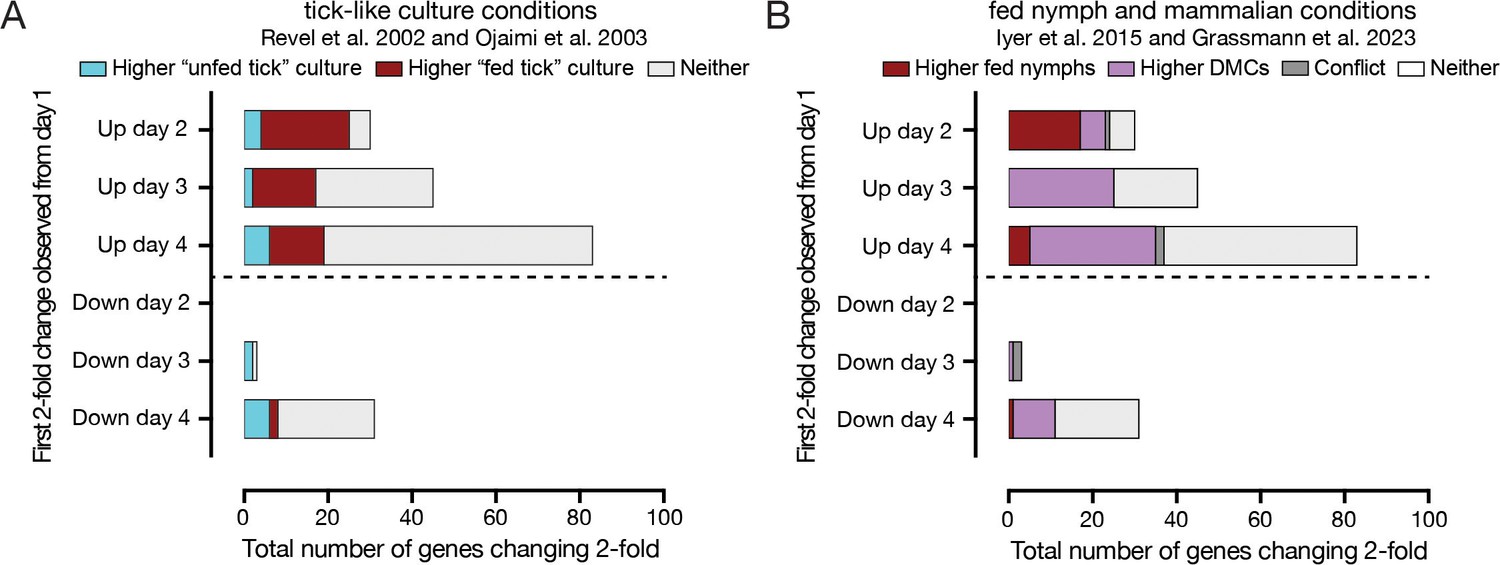
Genes changing over tick feeding overlap with genes that change expression in previously probed tick feeding contexts.
(A) The overlap of twofold changed genes with genes that changed expression in Bb cultures grown in conditions mimicking feeding ticks. Genes are grouped based on the first day that they changed twofold from day 1. ‘Fed tick’ culture conditions were 37 °C, pH 6.8 in Revel et al., 2002 and 35 °C, pH 7.4 in Ojaimi et al., 2003 and genes elevated in these conditions in one or both studies are highlighted in red. ‘Unfed tick’ culture conditions were 23 °C, pH 7.5 in Revel et al., 2002 and 23 °C, pH 7.4 in Ojaimi et al., 2003 and genes elevated in these conditions in one or both studies are highlighted in teal. Genes that were not elevated in either condition in those studies are in gray. Particularly for genes that increase on day 2, there is a large overlap with genes elevated in ‘fed tick’ culture conditions in previous studies. (B) The overlap of twofold changed genes with genes that changed expression between fed nymphs and dialysis membrane chambers (DMCs) mimicking mammalian conditions. Genes are grouped based on the first day that they changed twofold from day 1. Bb expression in fed nymphs versus in DMCs was compared by Iyer et al., 2015 using bacterial RNA amplification and microarray, while Grassmann et al., 2023 used TBDCapSeq. Genes elevated in fed nymphs in one or both studies are highlighted in red, while genes elevated in DMCs in one or both studies are highlighted in purple. Genes that were elevated in conflicting conditions between the two studies are in dark gray, and genes not elevated in either condition are in light gray. For genes that increase on day 2, there is a large overlap with genes elevated in fed nymphs, while genes that increase first on days 3 and 4 have a larger overlap with genes elevated in DMCs.
Figure 3
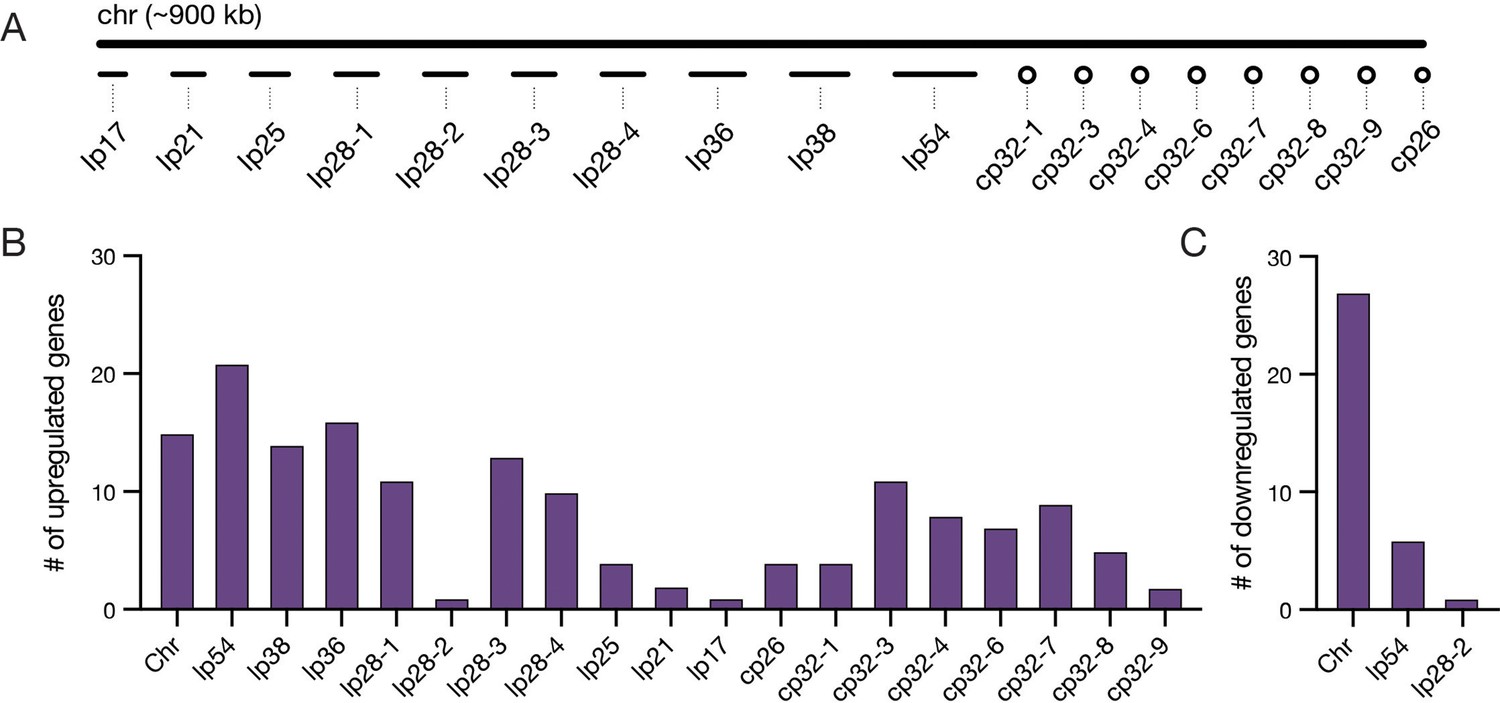
Bb genes upregulated during feeding are found predominantly on plasmids.
(A) Schematic of the chromosome and plasmids in the Bb B31-S9 genome. Plasmid names denote whether the plasmid is linear (lp) or circular (cp) and the length of plasmids in kilobases (kb). For example, lp17 is a 17 kb linear plasmid. Genome is shown approximately to scale. (B–C) The number of genes from each chromosome or plasmid that increased (B) or decreased (C) expression twofold during feeding, see Figure 3—source data 1 for gene information. Upregulated genes are distributed across plasmids, while most downregulated genes are found on the chromosome and lp54.
-
Figure 3—source data 1
Twofold differentially expressed Bb genes from across tick feeding timepoints.
- https://cdn.elifesciences.org/articles/86636/elife-86636-fig3-data1-v1.xlsx
Figure 4
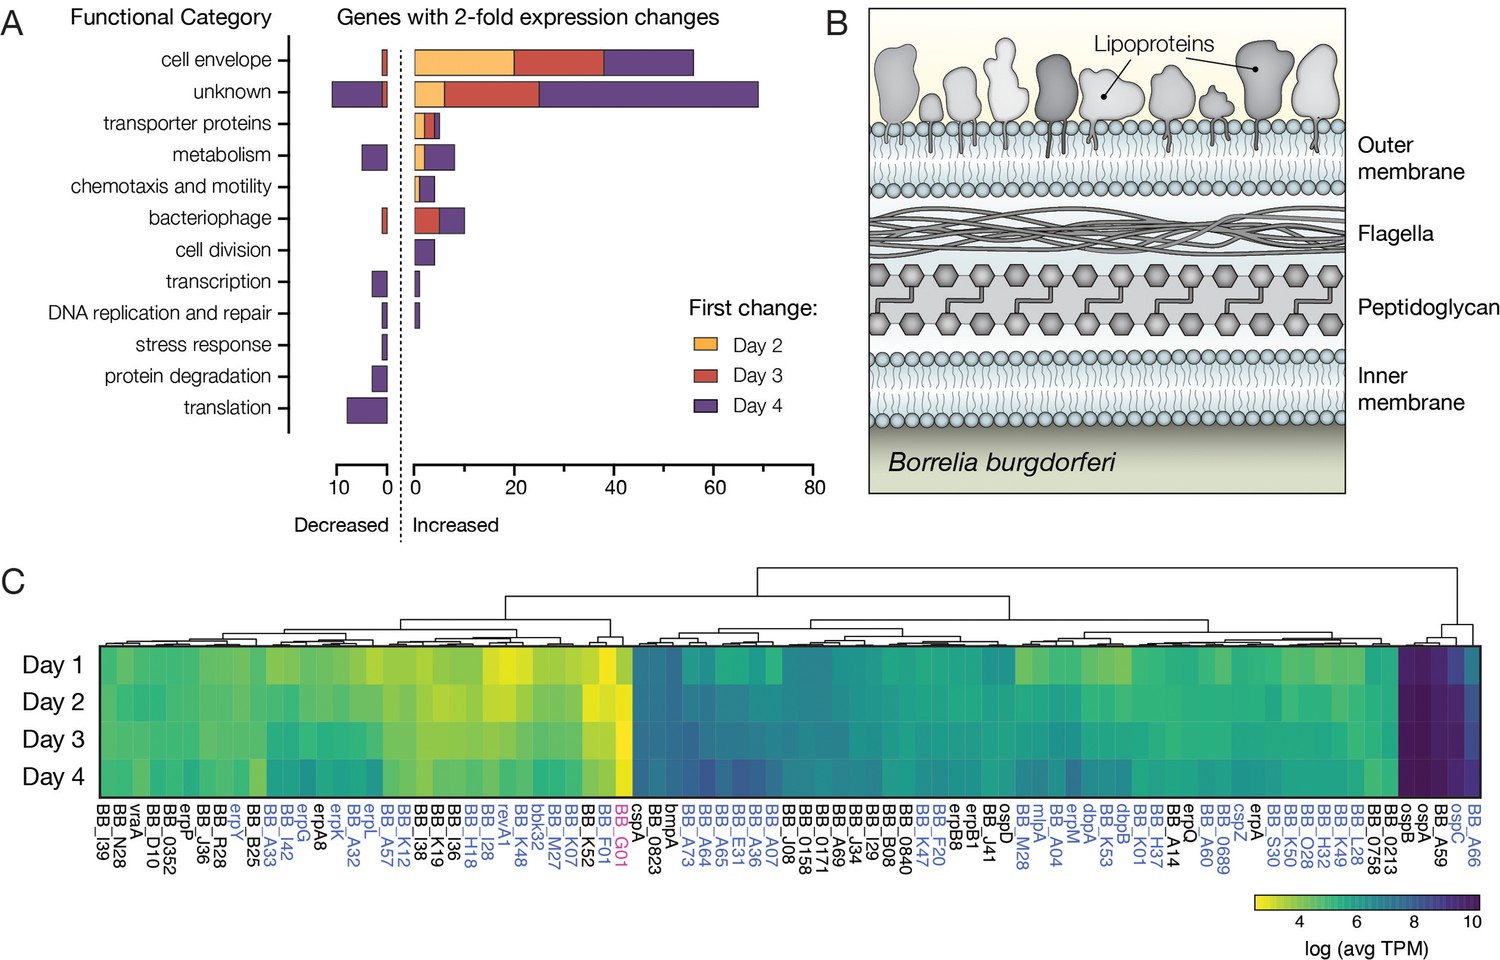
Bb genes encoding outer surface proteins are highly prevalent among upregulated genes.
(A) The number of Bb genes that change over the course of tick feeding sorted into functional categories. Genes that first change 2 days after attachment are shown in yellow, 3 days after attachment in red, and 4 days after attachment in purple. A majority of upregulated genes fall into cell envelope and unknown categories. (B) Schematic of the outer membrane of Bb showing outer surface lipoproteins. Lipoproteins can also reside in the periplasmic space. (C) Heat map of expression levels of all genes encoding outer surface lipoproteins as average Transcripts Per Million (TPM) across the 4 days of tick feeding, see Figure 4—source data 1. Gene names highlighted in blue were twofold upregulated and genes in pink twofold downregulated over feeding (see Figure 2). A majority of genes encoding outer surface proteins increased in expression throughout feeding, while having different magnitudes of expression.
-
Figure 4—source data 1
Transcripts per million (TPM) for all Bb genes across feeding timepoints.
- https://cdn.elifesciences.org/articles/86636/elife-86636-fig4-data1-v1.xlsx
Figure 5
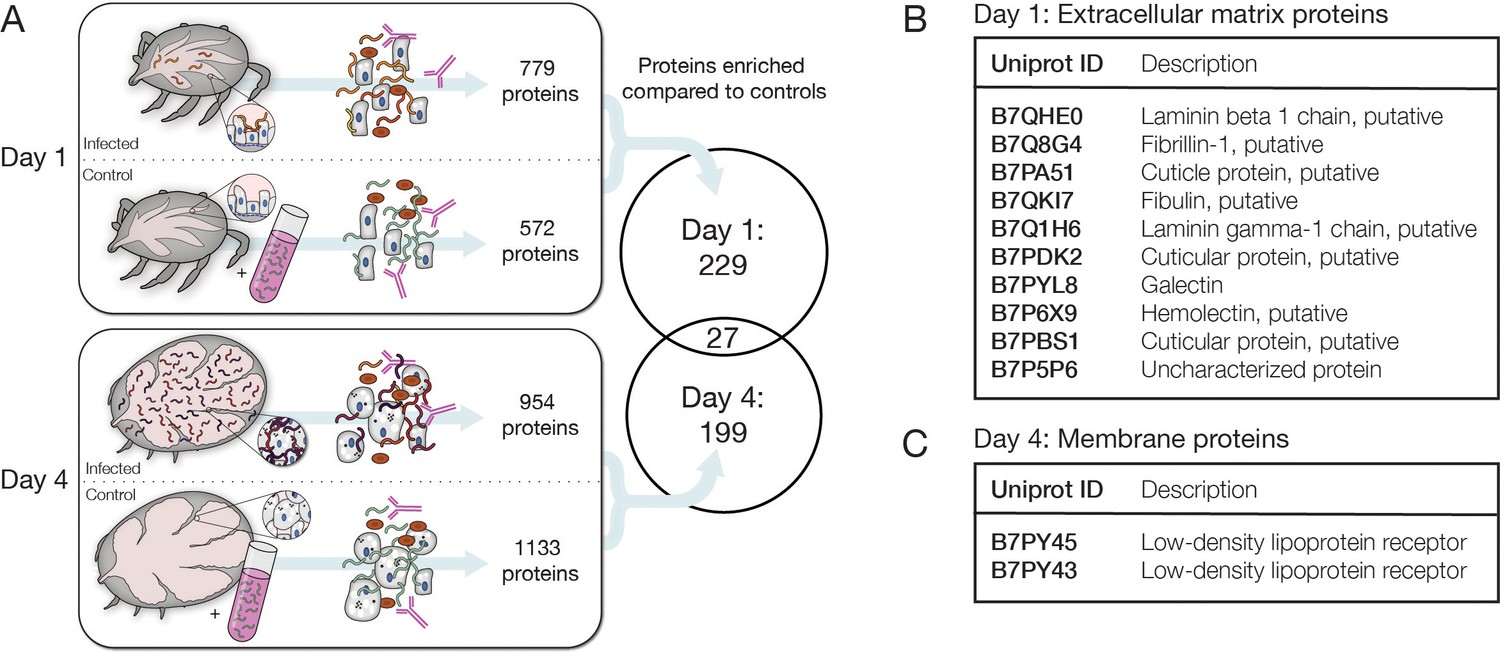
Identification of candidate tick interaction partners of Bb cells ex vivo.
(A) Schematic of experiment to determine candidate tick proteins interacting with Bb over the course of feeding. Ticks were collected 1 day and 4 days after placement on mice. Uninfected ticks at the same time points were mixed with cultured Bb as controls. Bb was enriched with αBb antibody as in RNA-seq experiments and then subjected to mass spectrometry to identify tick proteins present in the samples. Venn diagram depicts the proteins enriched in day 1 and day 4 samples over controls in at least two of three replicates, see Figure 5—source data 1 for all proteins. Tick proteins that are enriched with Bb vary greatly over the course of feeding. (B) Tick proteins uniquely identified one day after placement that are annotated as extracellular matrix (ECM) proteins, see Figure 5—source data 2. (C) Tick proteins uniquely identified four days after attachment that are annotated as low-density lipoprotein receptors, see Figure 5—source data 3. ECM and membrane proteins may be good candidates for Bb-interacting proteins.
-
Figure 5—source data 1
Mass spectrometry analysis for Bb-enriched samples.
Sheet 1, all proteins; sheet 2, proteins enriched on day 1 only; sheet 3, proteins enriched on day 4 only; sheet 4, proteins enriched on day 1 and day 4.
- https://cdn.elifesciences.org/articles/86636/elife-86636-fig5-data1-v1.xlsx
-
Figure 5—source data 2
Annotation and GO term enrichment for tick proteins enriched on feeding day 1.
- https://cdn.elifesciences.org/articles/86636/elife-86636-fig5-data2-v1.xlsx
-
Figure 5—source data 3
Annotation and GO term enrichment for tick proteins enriched on feeding day 4.
- https://cdn.elifesciences.org/articles/86636/elife-86636-fig5-data3-v1.xlsx
Tables
Key resources table
| Reagent type (species) or resource | Designation | Source or reference | Identifiers | Additional information |
|---|---|---|---|---|
| Strain (Borrelia burgdorferi) | B31-S9 | Sourced from Dr. Patricia Rosa | Streptomycin resistant strain | |
| Strain (Ixodes scapularis) | Ixodes scapularis nymphal ticks | Sourced from Tick Lab at Oklahoma State University (OSU) (RNA-seq) and BEI Resources (mass spec) | BEI Cat# NR-44115 | Ticks were sourced as larvae; fed on mice and allowed to molt to nymphs in lab |
| Strain (Mus musculus) | C3H/HeJ | Jackson Laboratories | Strain#:00659 | Tick hosts were 4–6 week old female mice |
| Strain (Borrelia burgdorferi) | B31-A3 | Sourced from Dr. Patricia Rosa | Used for anti-Bb western only | |
| Strain (Borrelia burgdorferi) | ospA1 | Sourced from Dr. Patricia Rosa; Battisti et al., 2008 | ospA mutant; Used for anti-Bb western only | |
| Strain (Borrelia burgdorferi) | ospA+B1 | Sourced from Dr. Patricia Rosa; Battisti et al., 2008 | ospA restored; Used for anti-Bb western only | |
| Antibody | anti-Borrelia burgdorferi (Rabbit polyclonal) | Thermo Fisher Scientific | Invitrogen: PA1-73004; RRID: AB_1016668 | 10 mg added to immunomagnetic enrichment; IF(1:100), WB (1:10,000) |
| Antibody | anti-Rabbit HRP secondary (goat polyclonal) | Advansta | Advansta: R-05072–500; RRID: AB_10719218 | WB (1:5000) |
| Antibody | Anti-Rabbit IgG (H+L) Alexa 488 (goat polyclonal) | Thermo Fisher Scientific | Invitrogen: A-11008; RRID: AB_143165 | IF (1:100) |
| Commercial assay or kit | Dynabeads Protein G | Thermo Fisher Scientific | Invitrogen 10003D | |
| Commercial assay or kit | Zymo Direct-zol RNA Microprep Kit | Zymo Research | R2062 | With on column DNase |
| Commercial assay or kit | NEBNext Ultra II Directional RNA Library Prep Kit for Illumina | New England Biolabs | E7760L | |
| Commercial assay or kit | NEBNext Multiplex Oligos for Illumina Dual Index | New England Biolabs | E7600S | |
| Commercial assay or kit | Kapa HiFi Real-Time Library Amplification Kit | Roche | Kapa KK2702 | |
| Commercial assay or kit | Cas9 | New England Biolabs | M0386S | |
| Commercial assay or kit | Taqman Universal PCR Master Mix | Thermo Fisher Scientific | Applied Biosystems 4304437 | |
| Commercial assay or kit | PowerUp SYBR Green Master Mix | Thermo Fisher Scientific | Applied Biosystems A25741 | |
| Sequence-based reagent | crRNAs targeting tick, mouse, Bb rRNA | Dynerman et al.; Ring et al., 2022 | See Supplementary file 1 | |
| Sequence-based reagent | flaB F | Jewett et al., 2007 | qPCR primers | 5’- TCTTTTCTCTGGTGAGGGAGCT |
| Sequence-based reagent | flaB R | Jewett et al., 2007 | qPCR primers | 5’-TCCTTCCTGTTGAACACCCTCT |
| Sequence-based reagent | flaB probe | Jewett et al., 2007 | qPCR probe | /56-FAM/AAACTGCTCAGGCTGCACCGGTTC/36-TAMSp |
| Sequence-based reagent | gapdh F | This paper | qPCR primer | 5’-TTCATTGGAGACACCCACAG |
| Sequence-based reagent | gapdh R | This paper | qPCR primer | 5’-CGTTGTCGTACCACGAGATAA |
| Chemical compound | Propidium iodide | Thermo Fisher Scientific | Invitrogen P3566 | |
| Chemical compound | TRIzol | Thermo Fisher Scientific | Invitrogen 15596018 | |
| Software, algorithm | DASHit | Dynerman et al., 2020 | http://dashit.czbiohub.org/ | |
| Software, algorithm | Salmon | Patro et al., 2017 | RRID:SCR_017036 | |
| Software, algorithm | STAR | Dobin et al., 2013 | RRID:SCR_004463 | |
| Software, algorithm | Bowtie2 | Langmead and Salzberg, 2012 | RRID:SCR_016368 | |
| Software, algorithm | DESeq2 | Love et al., 2014 | RRID:SCR_015687 | |
| Software, algorithm | GraphPad Prism v9.5.1 | GraphPad Software | RRID:SCR_002798 | |
| Software, algorithm | PEAKS Online Xpro 1.6 | Bioinformatics Solutions Inc. | RRID:SCR_022841 | |
| Other | BSK II | Rosa Lab Recipe | Media used to grow Bb; https://www.niaid.nih.gov/sites/default/files/lzp_recipes.pdf |
Additional files
-
Supplementary file 1
crRNAs targeting tick, mouse, and Bb rRNA sequences used in DASH.
- https://cdn.elifesciences.org/articles/86636/elife-86636-supp1-v1.xlsx
-
MDAR checklist
- https://cdn.elifesciences.org/articles/86636/elife-86636-supp2-v1.docx
Download links
A two-part list of links to download the article, or parts of the article, in various formats.
Downloads (link to download the article as PDF)
Open citations (links to open the citations from this article in various online reference manager services)
Cite this article (links to download the citations from this article in formats compatible with various reference manager tools)
Longitudinal map of transcriptome changes in the Lyme pathogen Borrelia burgdorferi during tick-borne transmission
eLife 12:RP86636.
https://doi.org/10.7554/eLife.86636.3


