Energetics of the microsporidian polar tube invasion machinery
- Department of Bioengineering, Stanford University, United States
- Department of Cell Biology, New York University School of Medicine, United States
- Department of Microbiology, New York University School of Medicine, United States
- Woods Institute for the Environment, Stanford University, United States
Figures
Figure 1
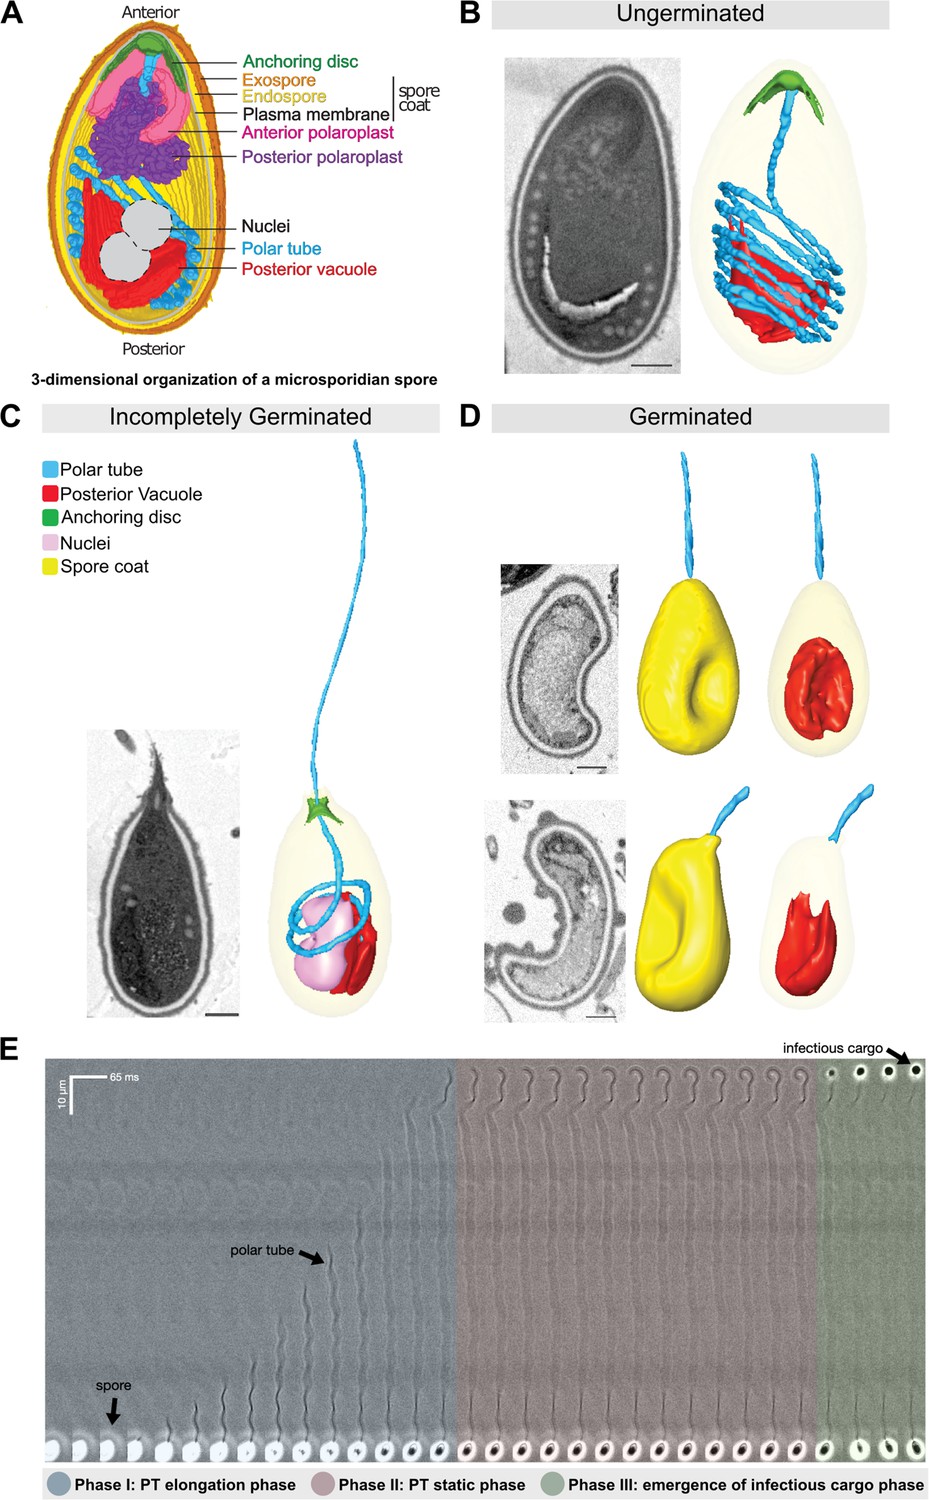
Morphology of germinating A.algerae spores.
(A) Overall organization of organelles in an A. algerae spore. The spore coat consists of 3 layers: a proteinaceous exospore (orange), a chitin-containing endospore (yellow), and a plasma membrane. Within the spore, the polar tube (PT) (blue), which is the infection organelle, surrounds other organelles like a rib cage. The PT is anchored to the apical end of the spore via a structure called the anchoring disc (green). At the apical end, the PT is linear, and then forms a series of coils, which end at the posterior end of the spore. The PT interacts closely with other spore organelles, including the posterior vacuole (red), and a membranous organelle called the polaroplast (purple). The organization of the spore shown here comes from SBF-SEM data (bright colors) and TEM images (nuclei positioning, and plasma membrane, grey). (B–D) Examples of slices from SBF-SEM imaging and the corresponding 3D reconstructions for ungerminated (B), incompletely germinated (C) and germinated (D) A. algerae spores. Colored according to the color key shown in (C). All scale bars are 500 nm. (E) Kymograph of the PT ejection process in A. algerae. The PT ejection process can be divided into 3 phases: PT elongation phase (blue), PT static phase (pink), and emergence of infectious cargo phase (green). This kymograph was generated from data deposited in Jaroenlak et al., 2020.
Figure 2 with 1 supplement
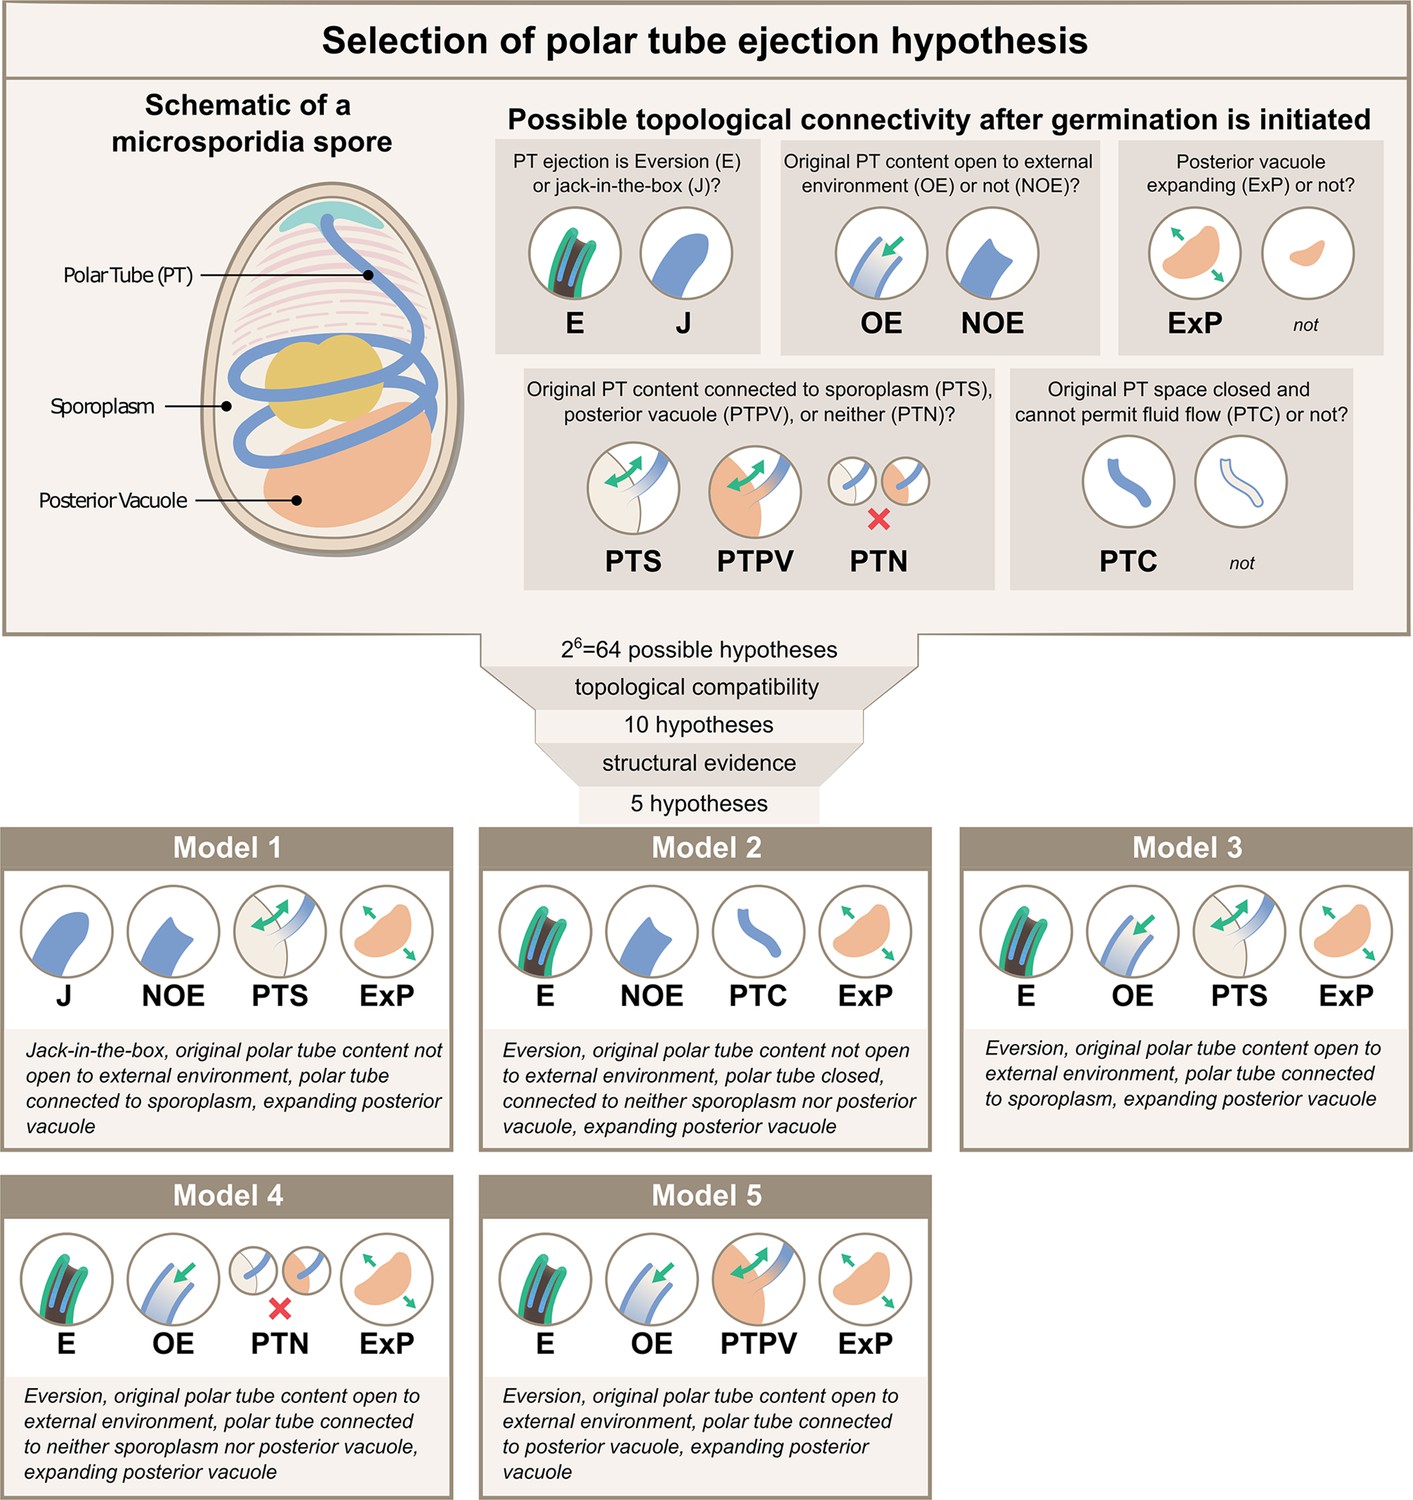
Possible hypotheses for the topological connectivity and morphology of spore organelles.
The selection process of the hypotheses for the energetics calculation is shown. We considered 6 critical topological questions regarding the connections between different spaces in the spore that is relevant to the energetics calculation and developed a standard nomenclature to describe the hypotheses. The combinatorics of the 6 questions gave us 64 hypotheses. By evaluating the topological compatibility of these combinations, we are left with 10 hypotheses, and we further narrow this down to 5 hypotheses based on the fact that the posterior vacuole expands during the germination process (see Figure 2—figure supplement 1). The list of all the hypotheses is summarized in Supplementary file 1, and a detailed calculation of each hypothesis is described in Figure 3—figure supplements 1–3.
Figure 2—figure supplement 1
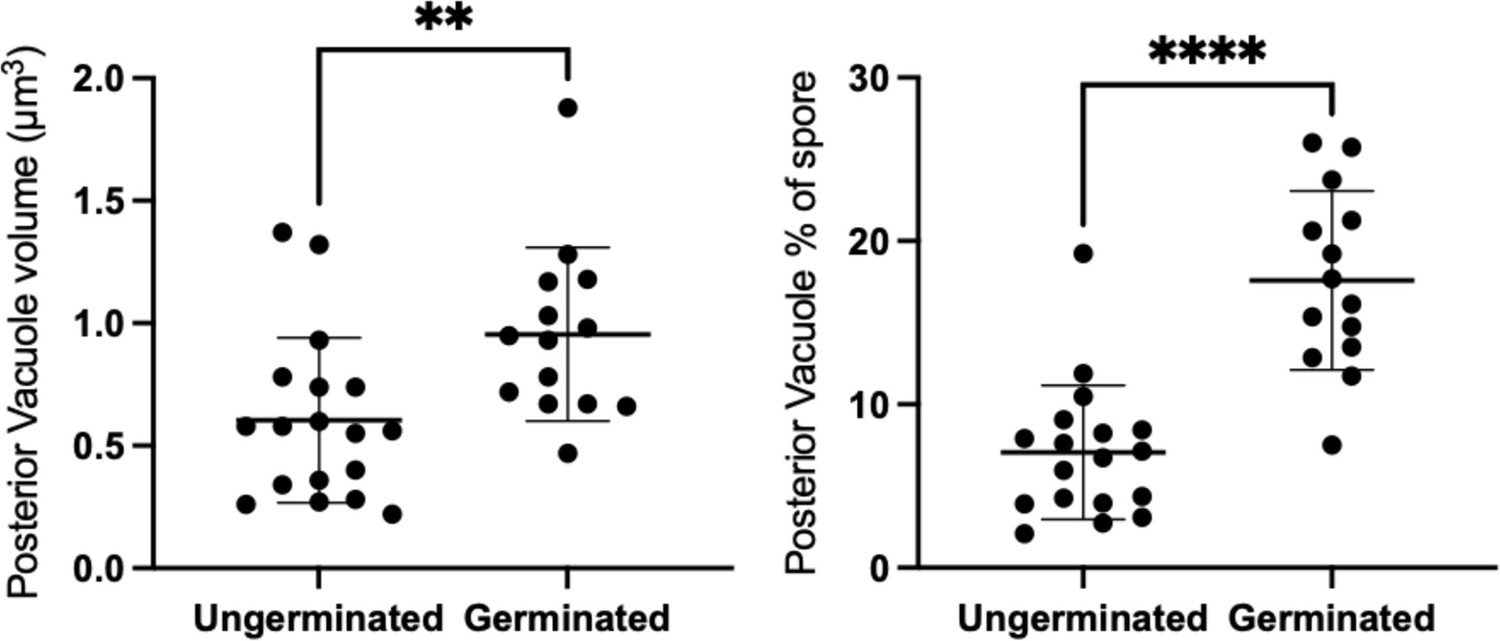
Volume of posterior vacuole in ungerminated and germinated spores.
The volume of the vacuole was measured from SBF-SEM 3D reconstructions and is shown both as absolute measurements (left) and as a percentage of total spore volume (right). Posterior vacuoles in germinated spores, (mean=0.955 μm3, std=0.355 μm3, n=14) are significantly larger in volume than posterior vacuoles in ungerminated spores (mean=0.604 μm3, std=0.337 μm3, n=18) (independent t-test, p=0.0260). Similarly, the volume fraction of posterior vacuole to the spore volume in germinated spores (mean=17.58%, std=5.48%, n=14) is also significantly larger than the volume fraction in ungerminated spores (mean=7.062%, std=4.107%, n=18) (independent t-test, p<0.0001).
Figure 3 with 6 supplements
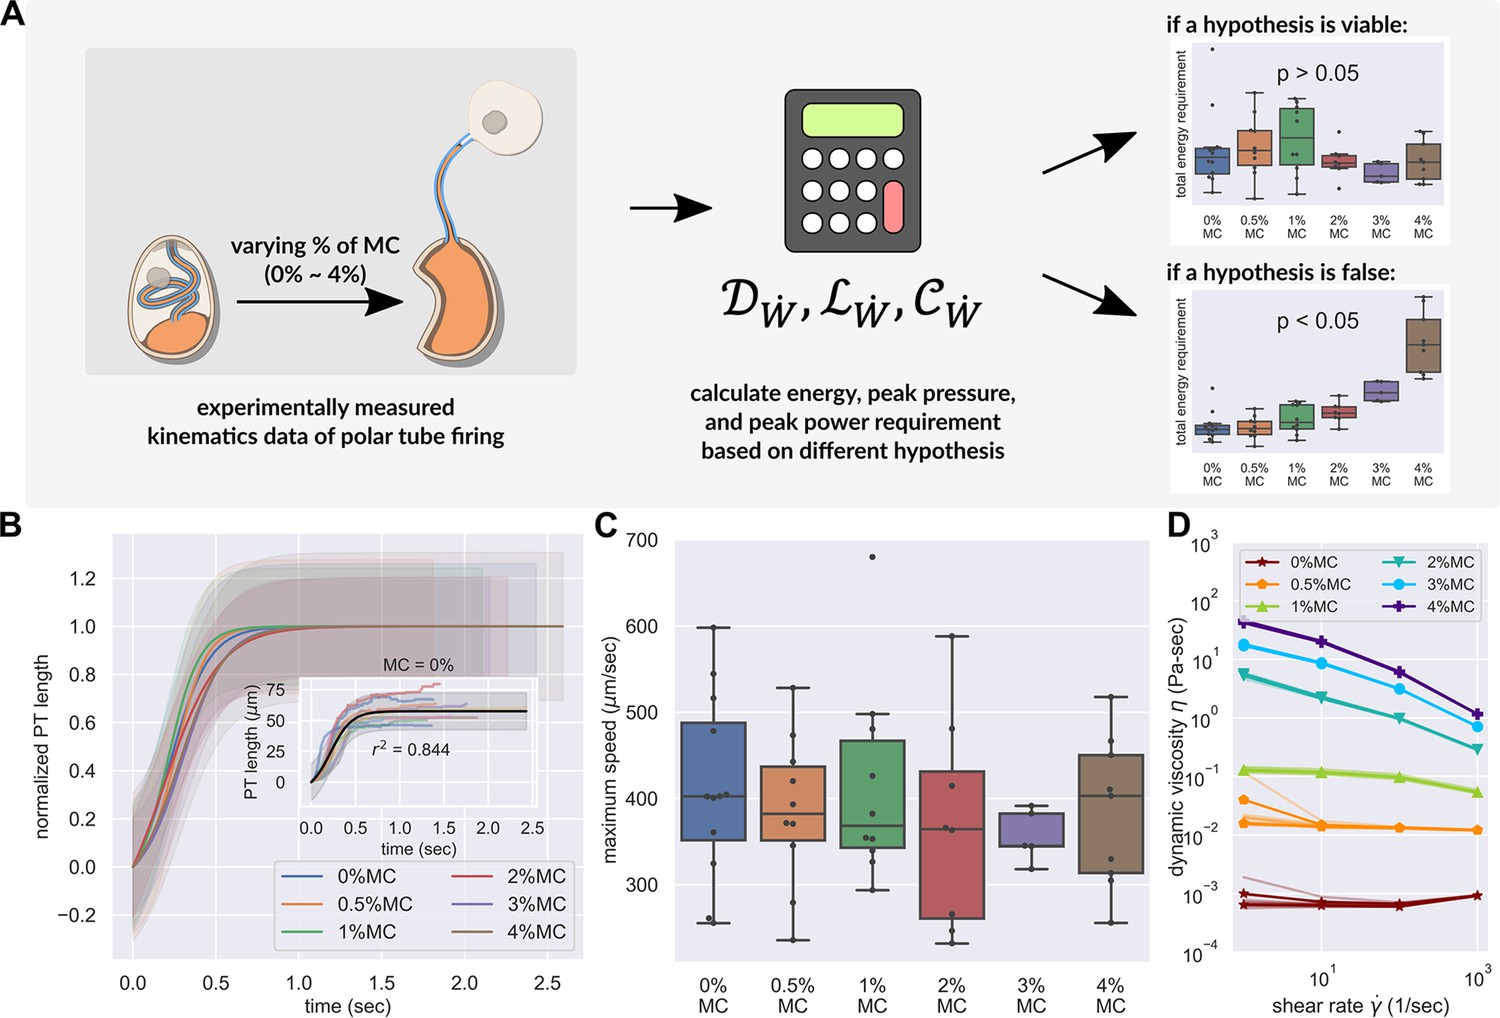
PT firing kinematics in the presence of varying external viscosity.
(A) Schematic outlining the protocol for hypothesis testing. We experimentally measured the PT firing kinematics of A. algerae spores in buffers with varying viscosity, by varying the methylcellulose (MC) concentrations up to 4% (Videos 4 and 5). We next calculated the required total energy, peak pressure and peak power for each experimentally measured data according to our physical framework proposed in Figure 3—figure supplements 1–3, and we see if the required energy changes with respect to changes in surrounding viscosity. We assume that changing surrounding viscosity should not change the energy sources of the spores. Thus if the calculated energy requirement changes significantly with respect to changes in surrounding viscosity (p<0.05), the hypothesis is inconsistent with experimental observations. (B) Experimental measurement of PT ejection kinematics of A. algerae spores in different concentrations of methylcellulose. The kinematics was fit to a sigmoid function and then normalized by . The additional term in the sigmoid function is to ensure the curve passes the origin. (0%: n=12; 0.5%: n=10; 1%: n=10; 2%: n=8; 3%: n=5; 4%: n=9) The inset shows the original data in MC0%. The changes in MC concentration does not cause obvious changes in overall kinematics of PT firing. The complete set of original data can be found in Figure 3—figure supplement 5. (C) The dependence of maximum PT ejection velocity on MC concentration in germination buffer. Increasing MC concentration up to 4% does not change the maximum PT ejection velocity. (p=0.848, Kruskal–Wallis test) (D) Viscosity measurements of germination buffer with various concentrations of methylcellulose, corresponding to the concentrations used in PT extrusion experiments. As the PT ejection process is a high shear rate phenomenon (∼3000 1 /s), we used the measurement at shear rate s-1. The maximum tested shear rate was 1000 s-1 as that reaches the operation limit of the shear rheometer. (n=5 for 0%, 0.5%, 1%. n=3 for 2%, 3%, 4%.).
Figure 3—figure supplement 1
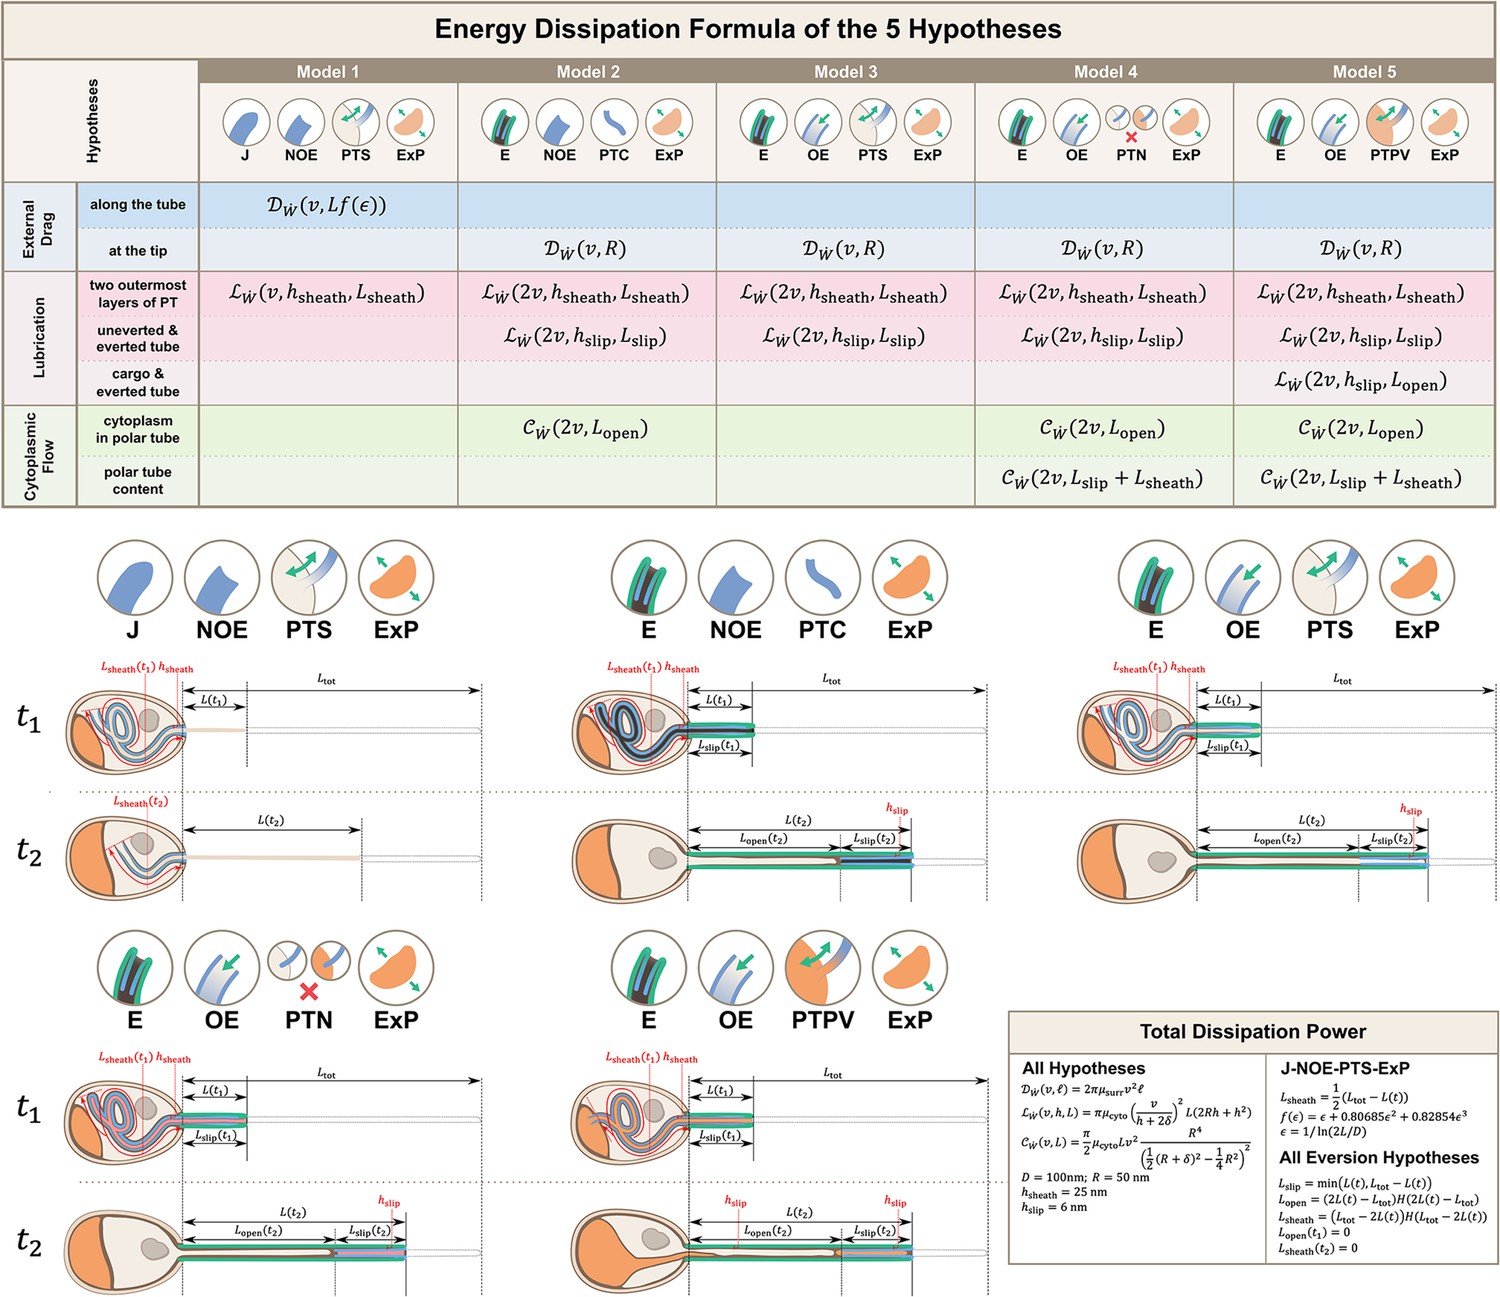
Calculations for energy dissipation of the PT firing process.
We calculated the energy dissipation of the PT firing process by considering the power contribution from external drag, lubrication between various structures, and cytoplasmic flow. The table in the top row shows the detailed breakdown of energy contribution for the five hypotheses listed in Figure 2. We calculate the instantaneous power from experimental data, and integrate it with respect to time to obtain the energy. The detailed formula used for each terms are listed in the lower right corner. The bottom two rows of the figure shows the schematic diagram for calculating the different lengths in each hypothesis. indicates some time point when the PT fires less than 50%, and indicates another time point when PT fires more than 50%. The blue region indicates the uneverted region, while the green region indicates the portion that has everted. Symbols: : cytoplasmic viscosity; : viscosity of the surrounding media; : PT tip velocity; : PT length; : total length of ejected PT; : overlapping length of the two outermost layers of PT; : overlapping length of everted and uneverted PT; : length of the PT that does not contain uneverted PT material; : PT diameter; : PT radius; : shape factor in slender body theory, defined as : slip length; : lubrication thickness between the two outermost layers of PT; : lubrication thickness between everted and uneverted tube, or the cargo and everted tube; : Heaviside step function.
Figure 3—figure supplement 2
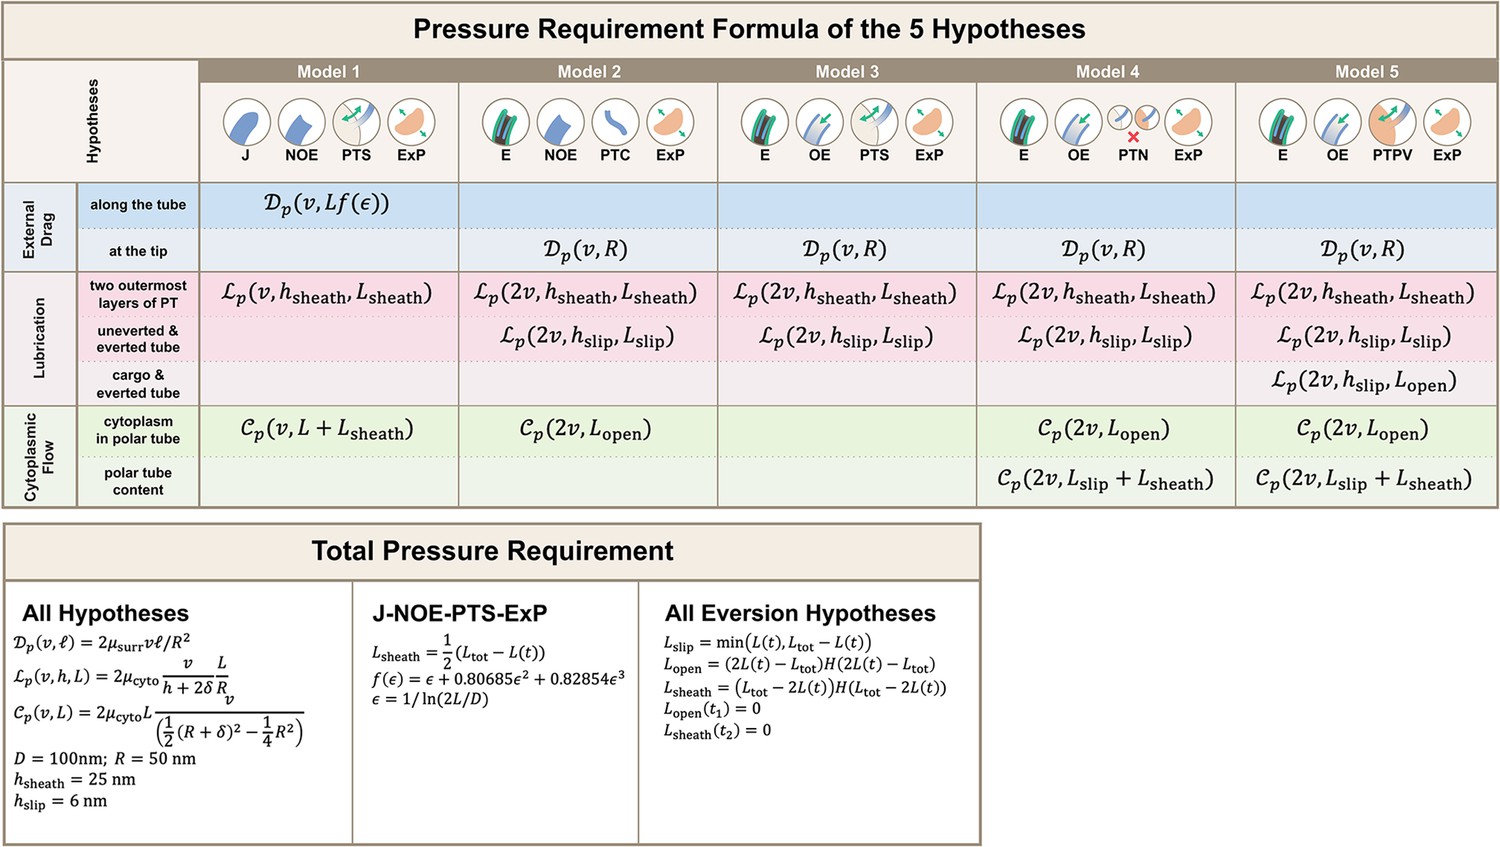
Calculations for the required pressure differences of the polar tube (PT) firing process.
Calculations were made by considering the contribution from external drag, lubrication between various structures, and cytoplasmic flow. Detailed breakdown of contributions for the five hypotheses listed in Figure 2 are shown, and the formula used for calculating different segment lengths based on observed PT length for each hypothesis is listed in the bottom. Symbols: : cytoplasmic viscosity; : viscosity of the surrounding media; : PT tip velocity; : PT length; : total length of ejected PT; : overlapping length of the two outermost layers of PT; : overlapping length of everted and uneverted PT; : length of the PT that does not contain uneverted PT material; : PT diameter; : PT radius; : shape factor in slender body theory, defined as : slip length; : lubrication thickness between the two outermost layers of PT; : lubrication thickness between everted and uneverted tube, or the cargo and everted tube; : Heaviside step function.
Figure 3—figure supplement 3
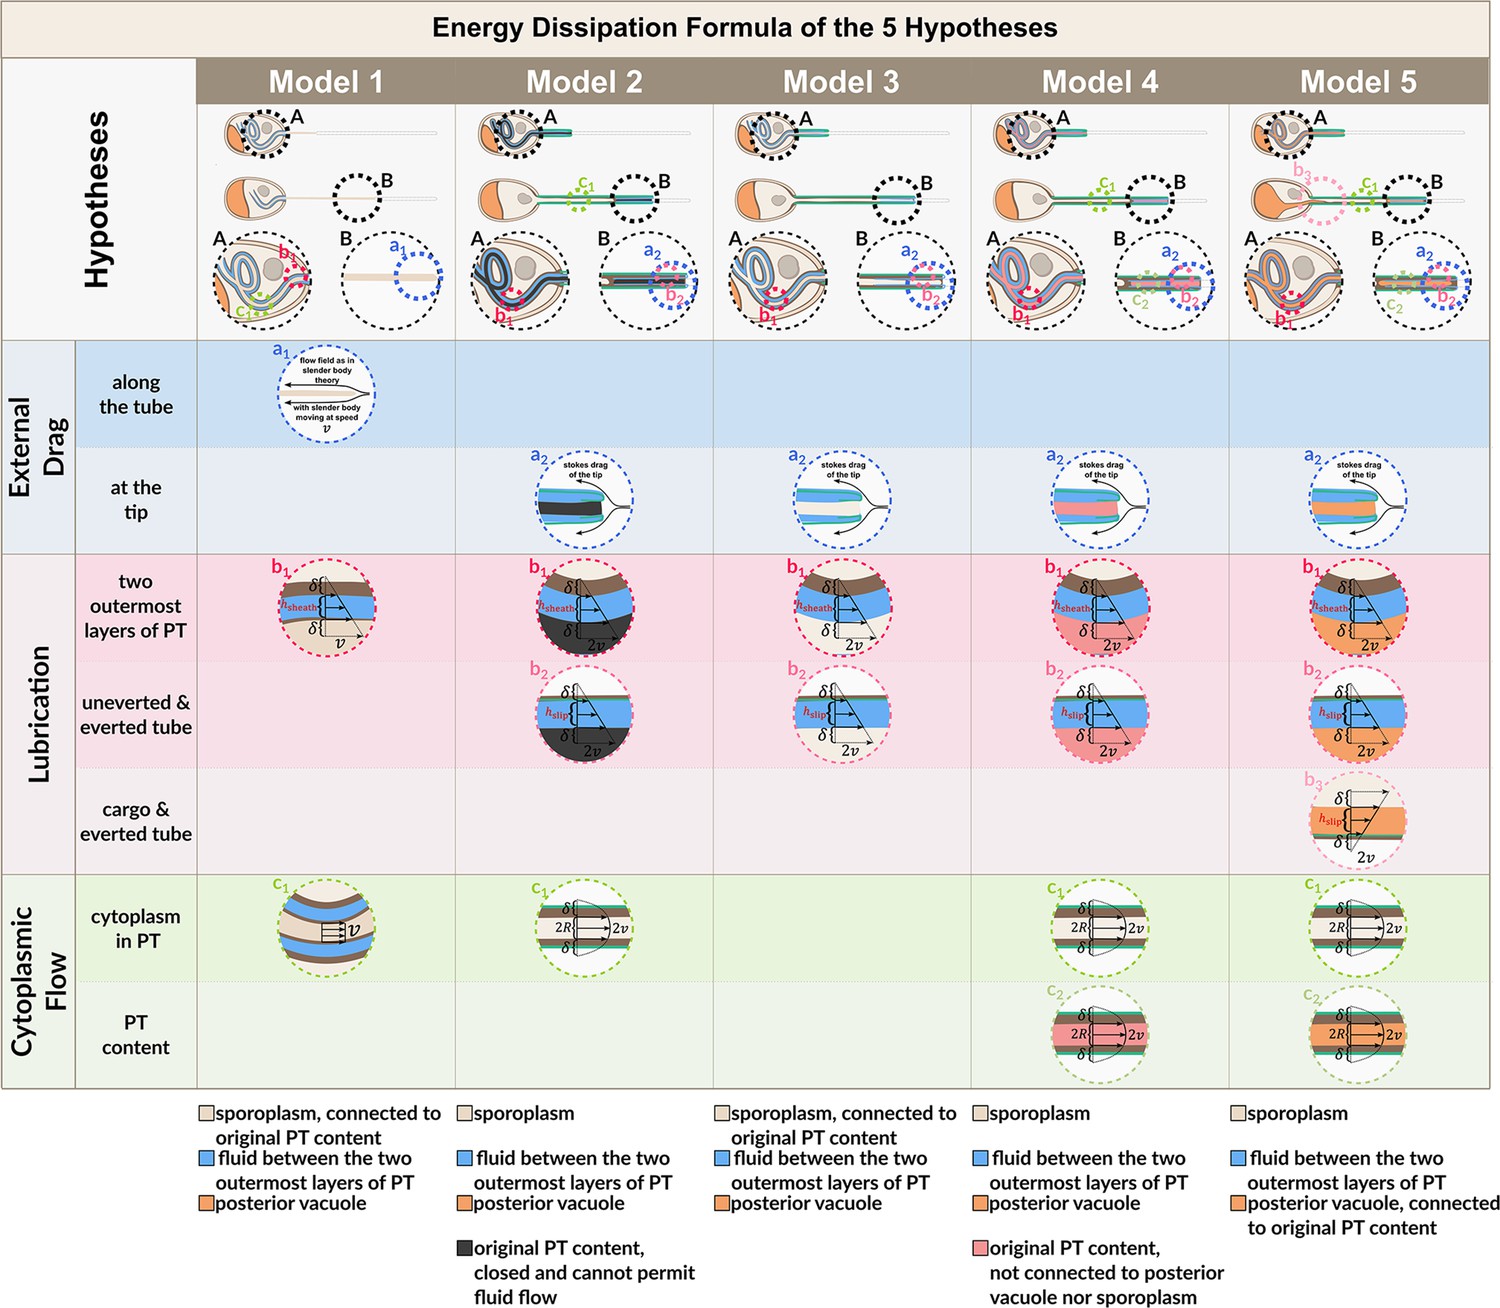
Flow fields used for energy dissipation calculation in Figure 3—figure supplement 1 and Figure 3—figure supplement 2.
Model schematics as listed in the bottom of Figure 3—figure supplement 1 at and are shown, with serial magnifications to show the flow field. Dashed circles of the same color indicate the magnification of the same specific region of interest. See Appendix Section A.9 for detailed explanation of each term. Symbols: : PT tip velocity; : PT diameter; : PT radius; : slip length; : lubrication thickness between the two outermost layers of PT; : lubrication thickness between everted and uneverted tube, or the cargo and everted tube.
Figure 3—figure supplement 4
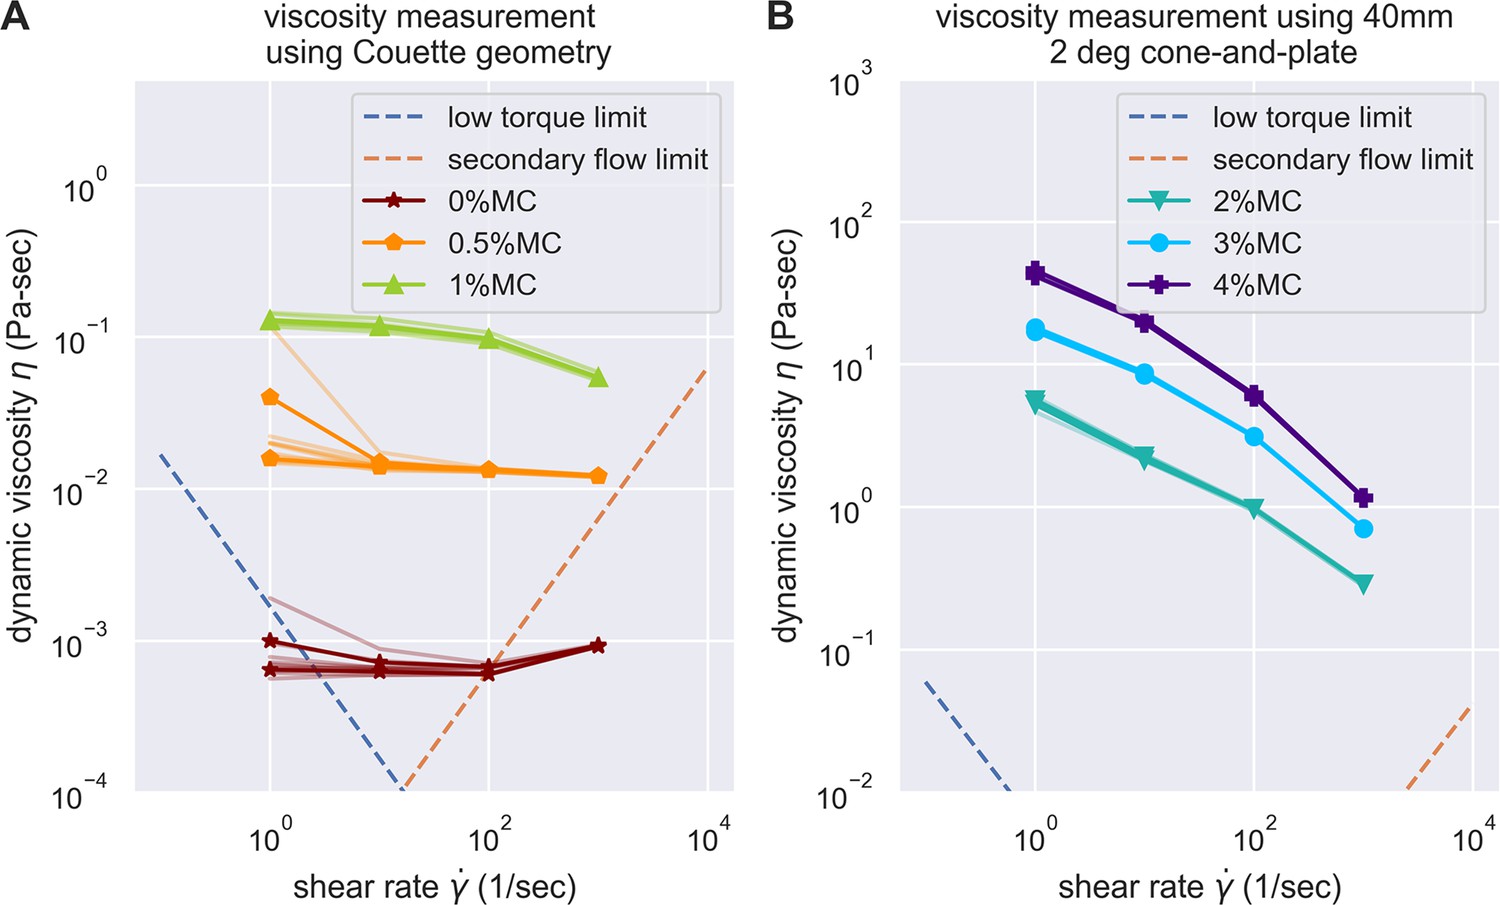
Evaluation of the experimental challenges of shear rheology in the measurement of buffer viscosity.
Low torque limit and secondary flow limit was considered, according to the suggestion of Ewoldt et al., 2015. The data acquired were all above the experimental limit of shear rheometer, except for the buffer with 0% methylcellulose at the highest and lowest shear rate. However, as buffer with 0% methylcellulose is expected to be Newtonian, we can easily substitute it with measurements on other shear rate.
Figure 3—figure supplement 5

Experimental measurement of PT ejection kinematics of A.algerae spores in different concentrations of methylcellulose.
The kinematics was fit to a sigmoid function. The additional term in the sigmoid function is to ensure the curve passes the origin. (0%: n=12; 0.5%: n=10; 1%: n=10; 2%: n=8; 3%: n=5; 4%: n=9).
Figure 3—figure supplement 6
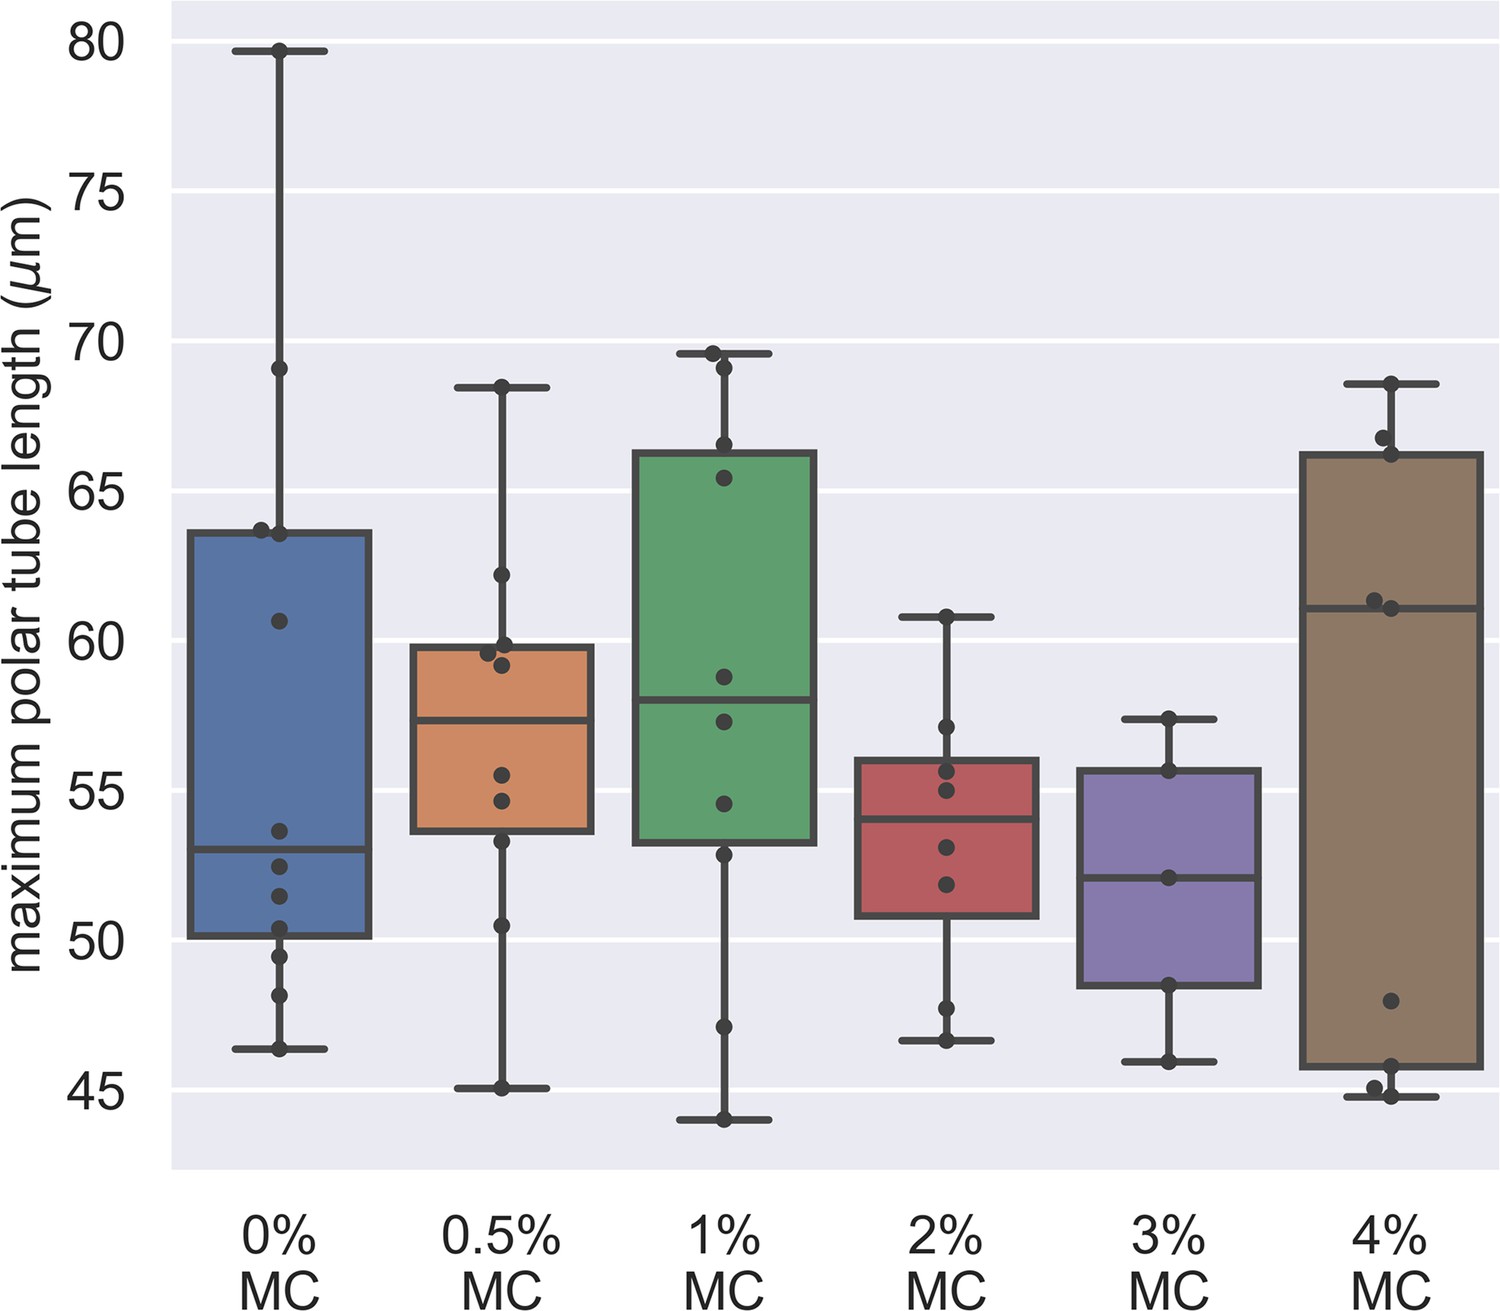
Dependence of maximum PT length on the methylcellulose concentration in germination buffer.
The x-axis shows the different concentration of methylcellulose we used for our experiments, and the y-axis shows the maximum PT length of each germination event. The maximum PT length does not depend on the concentration of methylcellulose in the germination buffer. (p=0.743, Kruskal–Wallis test).
Figure 4 with 1 supplement
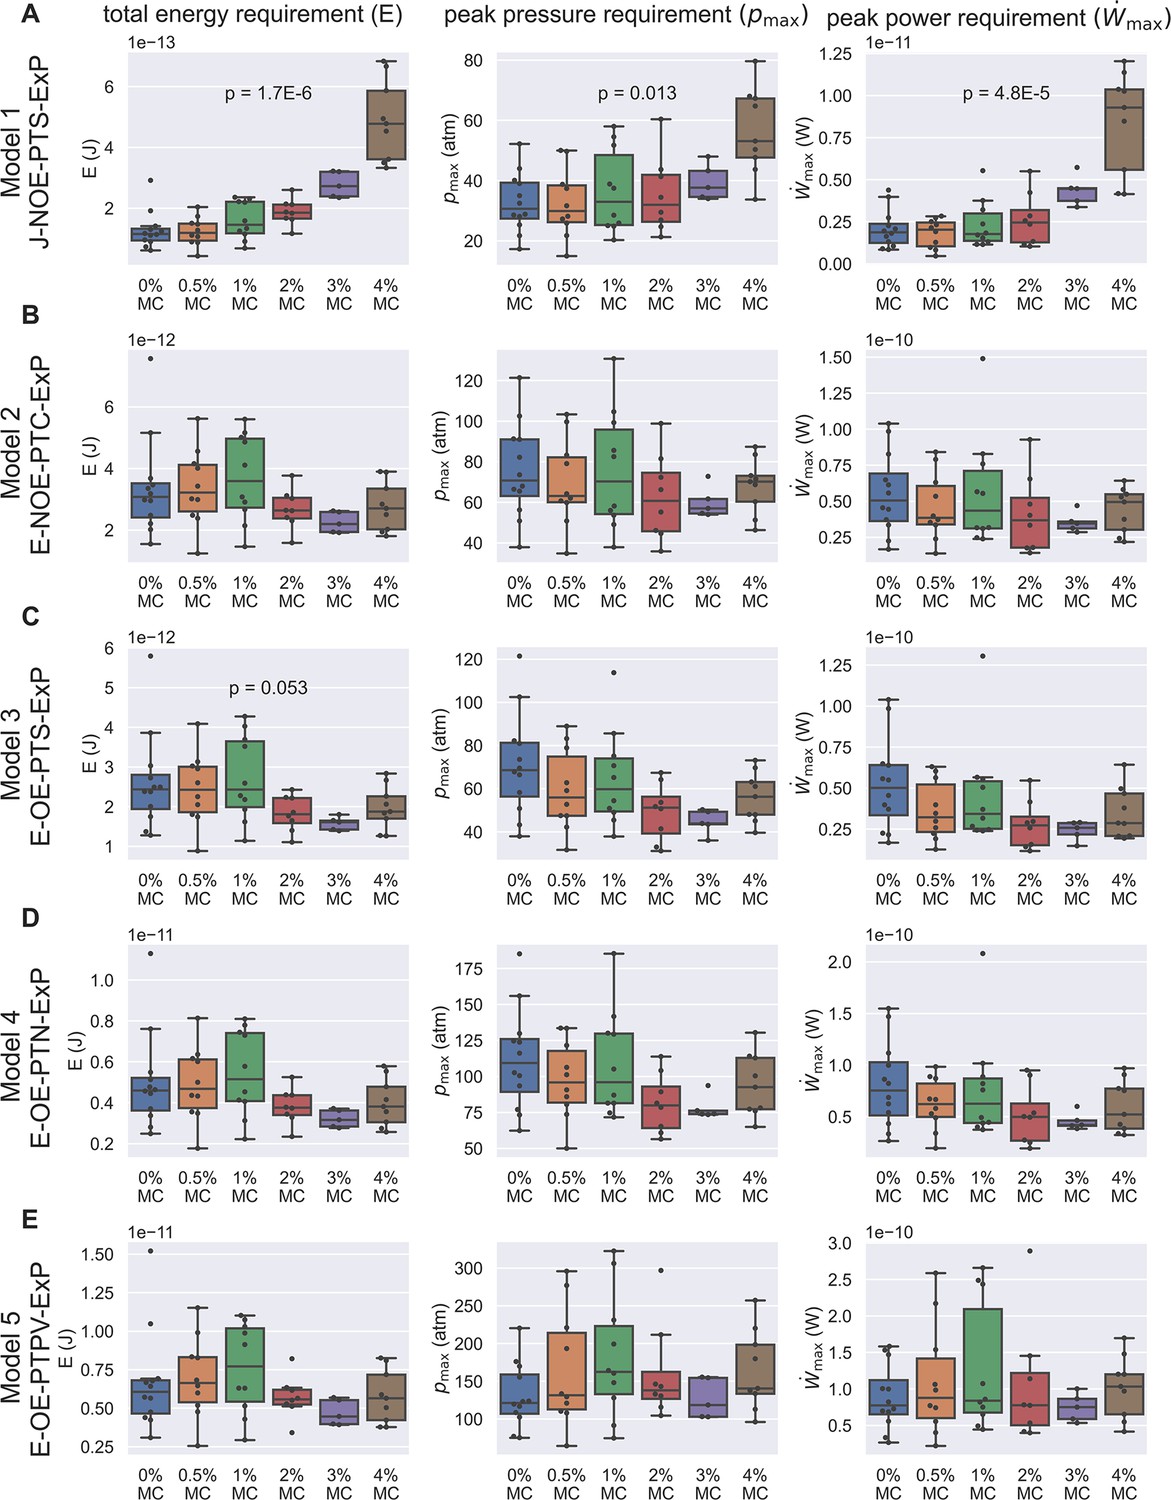
Energetic analysis to identify hypotheses that are consistent with experimental results of PT extrusion kinematics in varying external viscosities.
Each row (A–E) shows calculations based on the five different hypotheses, and the three columns show the calculation for total energy requirement (left column), peak pressure difference requirement (middle column), and peak power requirement (right column) for each PT firing event shown in Figure 3—figure supplement 5. Kruskal–Wallis test was used, and only the p-values which are significant or near-significant are shown. Only the p-values calculated for total energy requirement were used for ranking. The p-values for peak pressure difference requirement and peak power requirement are just for reference. The data shown here is calculated assuming a cytoplasmic viscosity of 0.05 Pa-s, and a zero boundary slip. The effect of ambiguity in cytoplasmic viscosity and slip length of the boundaries are discussed in Supplementary files 4 and 5. Under these assumptions, Model 1 and Model 3 are the two hypotheses that are least likely to be true. Also note that for the other three hypotheses (Model 2, Model 4, and Model 5), the total energy requirement is roughly 10-11 J, the peak pressure difference requirement is roughly 60–300 atm, and the peak power requirement is roughly 10-10 W.
Figure 4—figure supplement 1

Energy breakdown of different hypotheses.
(A) Energy breakdown of Models 1, 3, and 4 assuming a cytoplasmic viscosity of 0.05 Pa-sec and a 0 slip length at all boundaries. Under this condition, Model 1 and Model 3 are rejected. In Model 1, the scaling of external drag with respect to surrounding viscosity was too strong to explain the observed PT firing kinematics. In Model 3, the energy contribution mostly comes from lubrication alone, but the variation is too large to explain the experimentally observed kinematics. On the contrary, in Model 4, the external drag did not scale unfavorably with respect to changes in surrounding viscosity, and the variations in energy dissipation from lubrication and cytoplasmic flow balance out each other and thus does not contradict the experimental data. (B) Energy breakdown of Models 2, 3, and 5 assuming a cytoplasmic viscosity of 0.001 Pa-sec and a slip length of 15 nm at all boundaries. Under this condition, Model 1, Model 2, and Model 3 are rejected. In both Model 2 and Model 3, under a lower cytoplasmic viscosity and larger slip boundary length, the scaling effect of external drag with respect to surrounding viscosity starts to manifest. As these two models did not account enough energy terms to balance out the changes in external drag, they contradict with our experiment data. Model 4 and Model 5, on the other hand, account for more energy terms and thus mask out the effect of increased external drag, and are consistent with experiment data. The comprehensive -values of different cytoplasmic viscosity and different slip length was shown in Supplementary files 4 and 5.
Figure 5 with 1 supplement
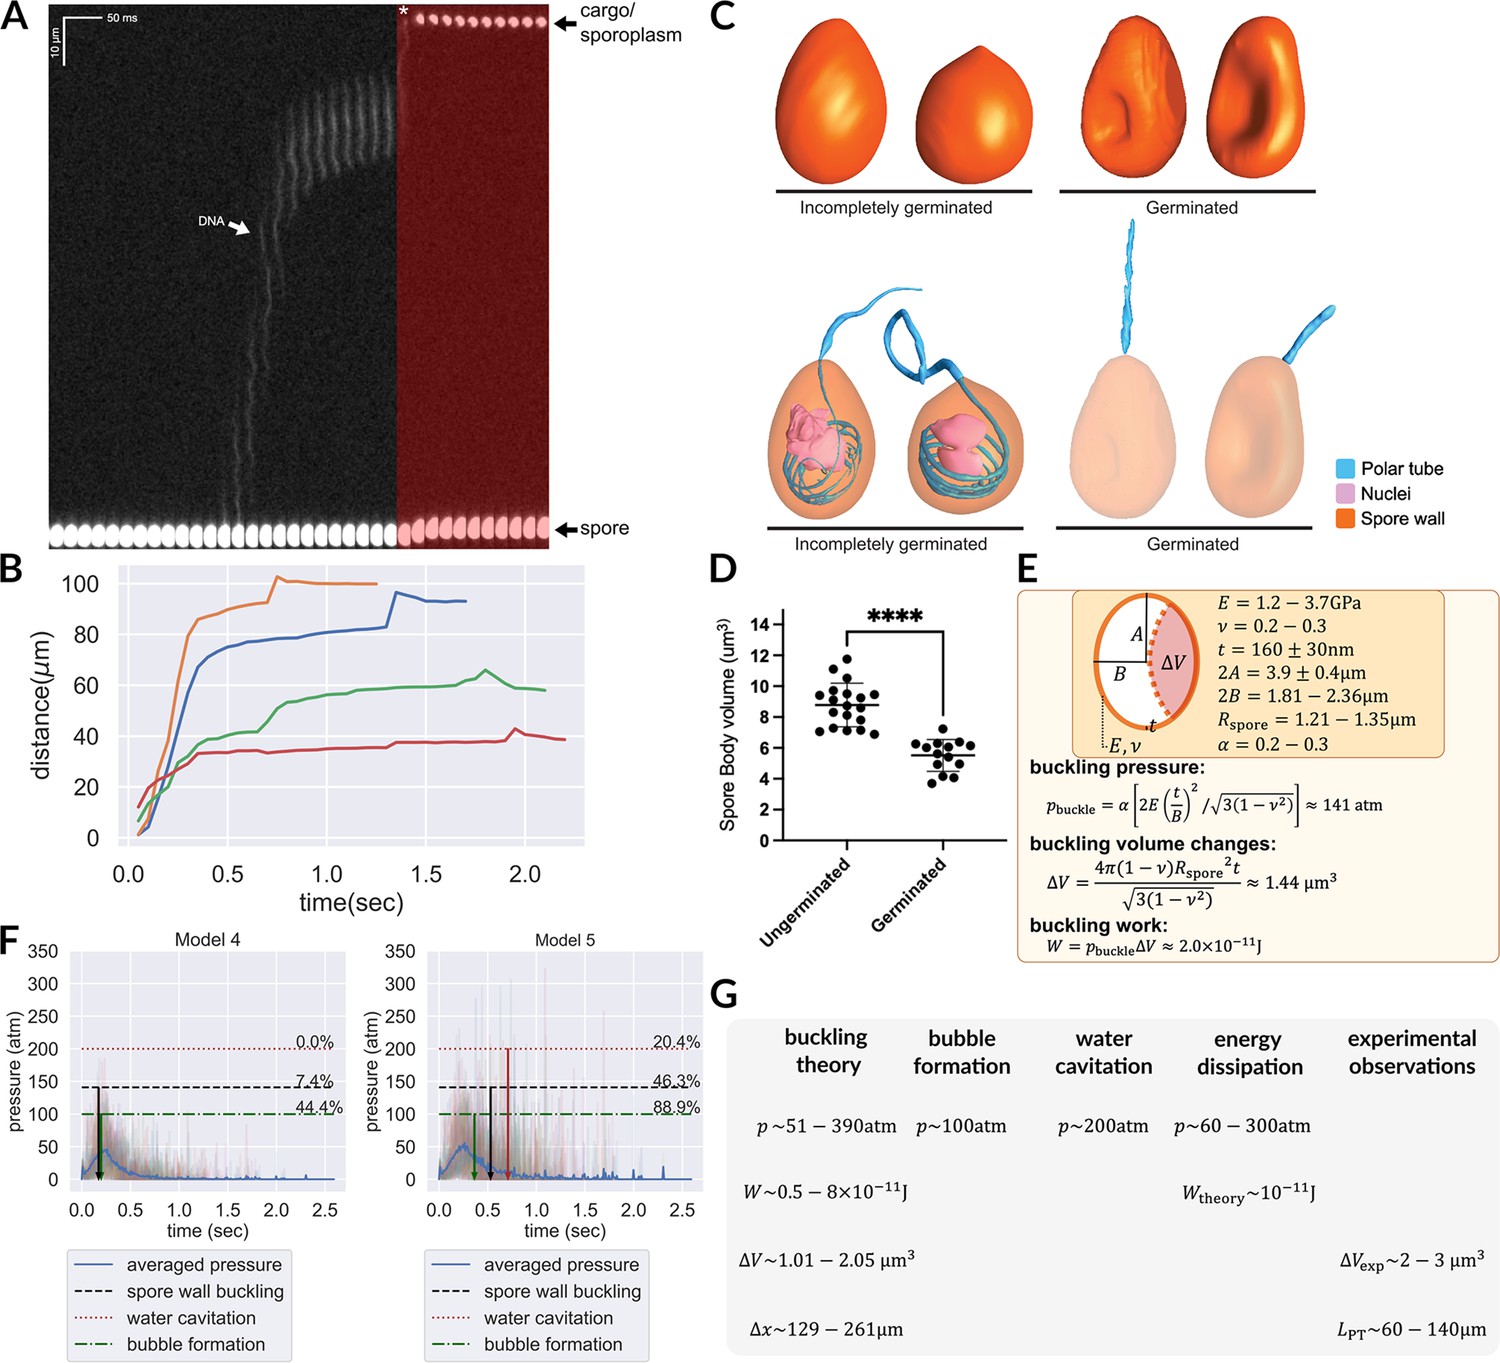
Hypotheses that can potentially explain the two-stage translocation of the cargo.
(A) Kymograph of nuclear transport inside the PT. Nuclei were stained with NucBlue prior to germination, and imaged using fluorescence microscopy. Previously deposited data from Jaroenlak et al., 2020 were used in this figure. A two-stage process is observed for nuclear translocation, with a long pause in the middle. The second stage of nuclear movement is overlaid with red, and the asterisk indicates the beginning of the second stage movement, in which the nuclei are expelled out of the PT. (B) Quantification of the nuclear position relative to spore coat over time (n=4). (C) 3D reconstructions of incompletely germinated and germinated spores from SBF-SEM data. 100% of spores in which the nuclei have been expelled are buckled (Supplementary file 6). The translocation of nuclei at the final stage can be explained by spore buckling. (D) Volumes of ungerminated and germinated spores calculated from SBF-SEM 3D reconstructions. Ungerminated: mean=8.78 μm3, std=1.41 μm3, n=19; Germinated: mean=5.52 μm3, std=1.03 μm3, n=14; p<0.0001. (E) Schematic model of an A. algerae spore used for calculating the spore wall buckling pressure, the relevant parameters used in the calculation and the formulae. Using the theory of elastic shell buckling (see text for detail), we showed that the pressure built up during the PT firing process is enough to buckle the spore wall, and the predicted buckling volume is enough to push cytoplasmic content in PT forward by 129–261 μm. (F) The predicted time series of pressure from Model 4 and Model 5 (n=54), overlaid with the critical pressure of spore wall buckling, water cavitation pressure and bubble nucleation. All three phenomena can cause volume displacement at the later stage of the germination process, and provide a driving force to push the cargo/nuclei forward. Model 5 is more compatible with experimental data than Model 4. The downward arrows indicate the mean time when the negative pressure first reaches the critical pressure. (detailed numbers mentioned in the main text.) (G) Theoretical predictions and experimental measurements from orthogonal approaches are compiled and are in agreement with each other. We obtained the prediction based on spore wall buckling theory and hydrodynamic energy dissipation theory, and we compiled the experimental observations from the SBF-SEM data. Symbols: : spore radius; : volume changes of spore after buckling; : spore wall thickness; : Young’s modulus of the spore wall; : Poisson ratio of the spore wall; : work; : predicted fluid displacement distance; : full length of the ejected PT.
Figure 5—figure supplement 1
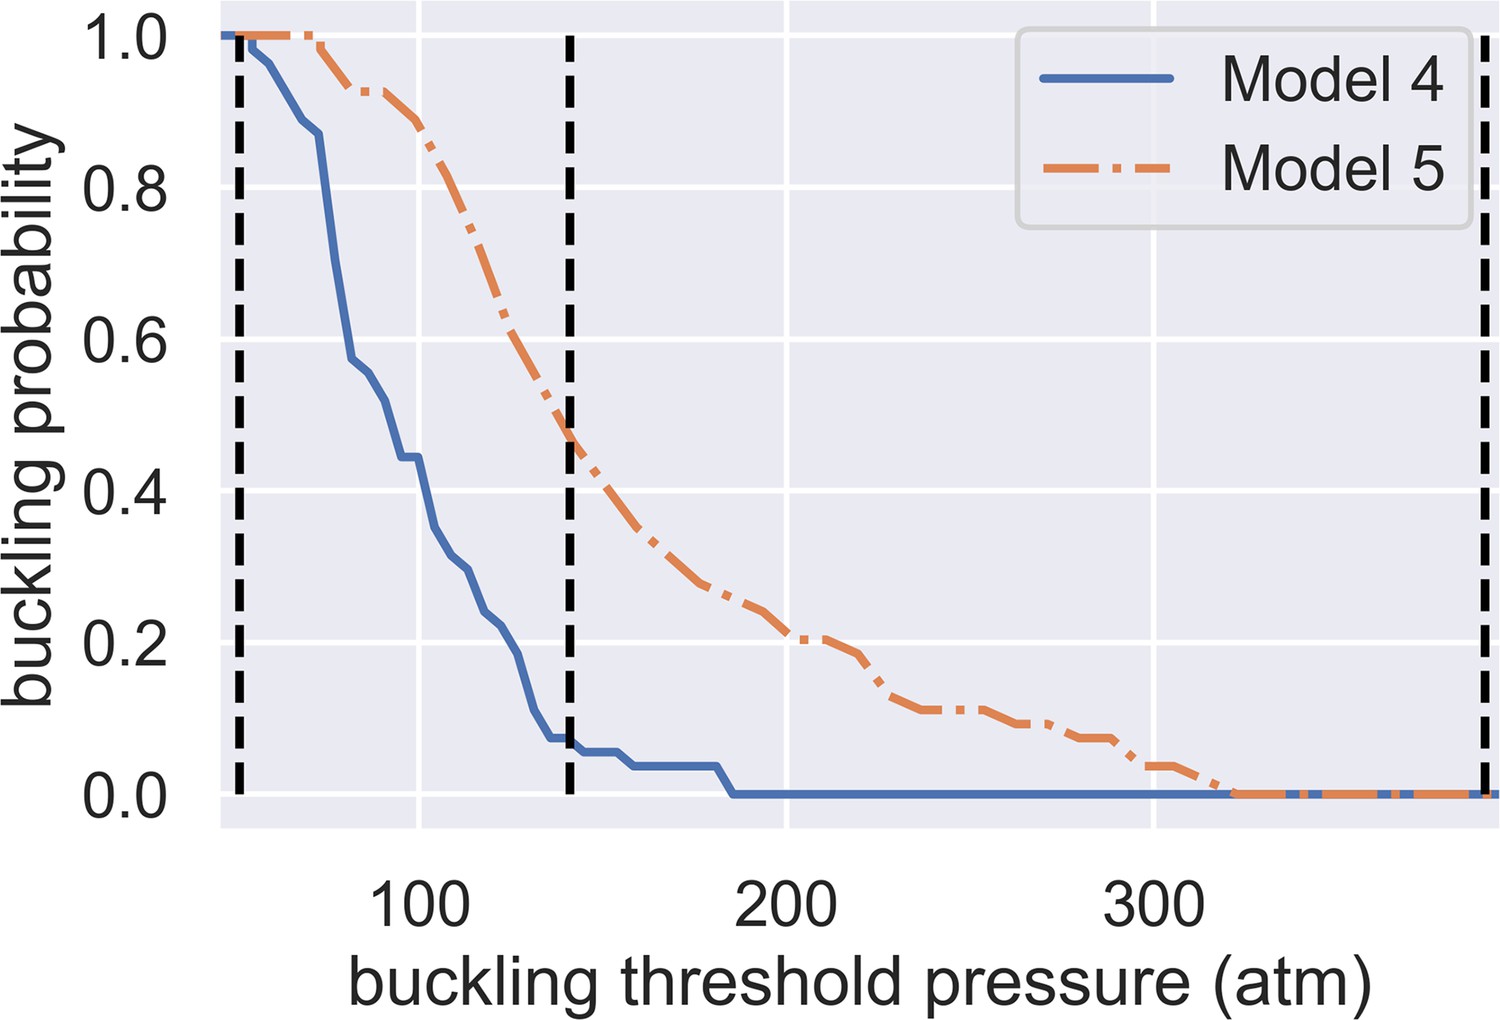
Dependence of spore buckling probability on the threshold pressure of spore wall buckling.
The x-axis shows the buckling threshold we choose while the y-axis shows the predicted probability of buckling. The two curves are predictions from Model 4 and Model 5. The three vertical dashed lines show the minimum (51 atm), geometric averaged (141 atm), and maximum (390 atm) predicted buckling threshold.
Figure 6
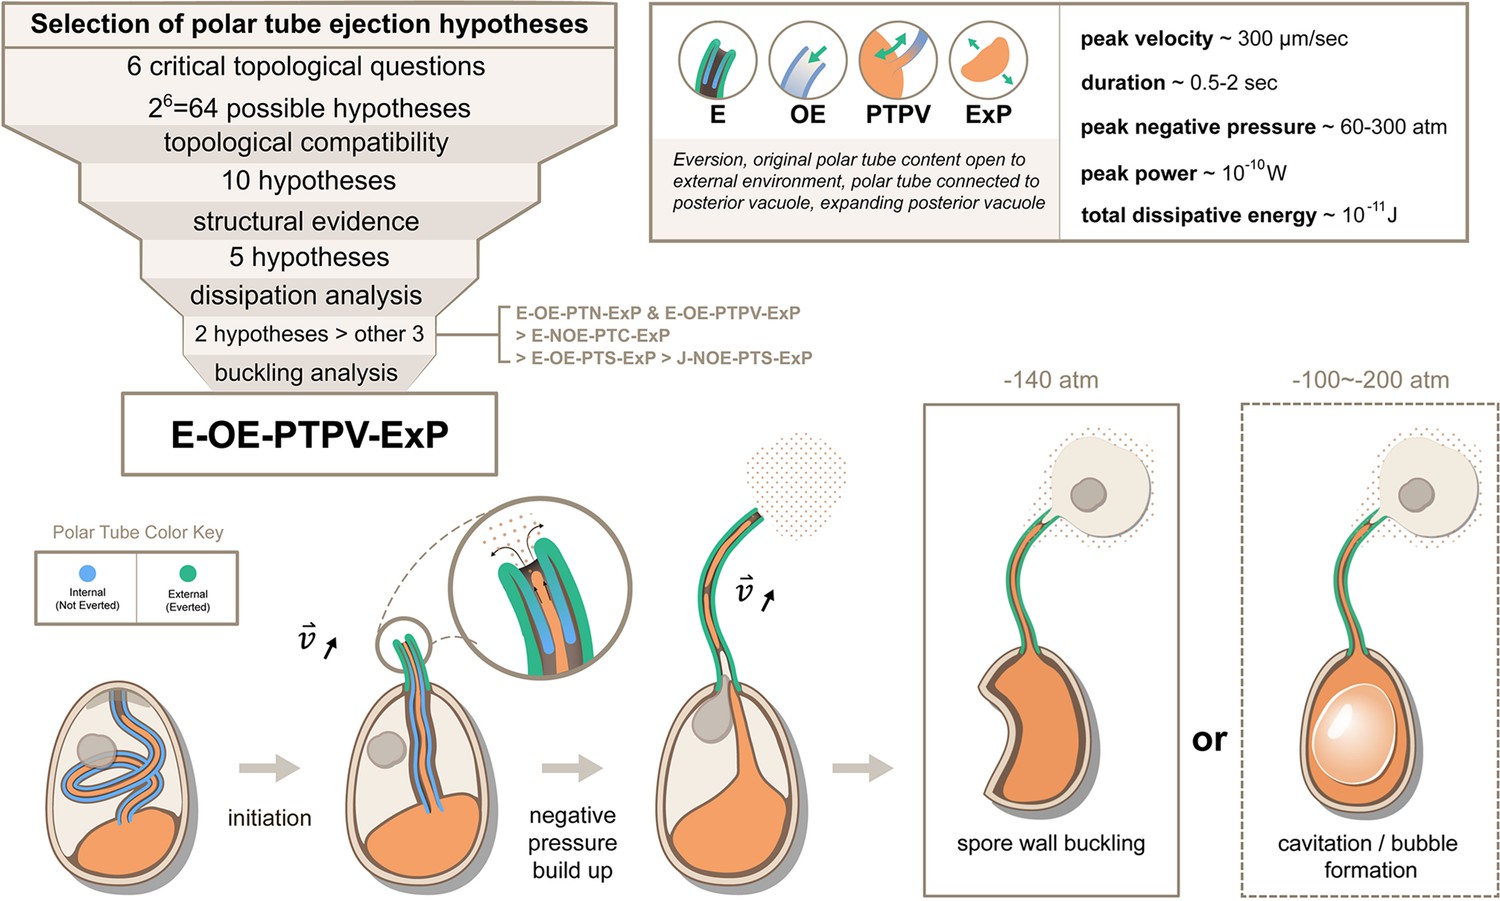
Summary and a model for the most likely hypothesis of the PT firing mechanism.
We evaluated 64 possible topological connectivities, eliminated those that are incompatible with our knowledge of the process, and further explored 10 viable hypotheses. We retained the five hypotheses that assume an expanding posterior vacuole during the germination process, which are consistent with the SBF-SEM data. The hydrodynamic energy dissipation analysis allows us to rank 2 hypotheses over the other 3, and our analysis on the pressure requirement for spore wall buckling suggests Model 5 (E-OE-PTPV-ExP, ‘Eversion, with PT tip open to external environment, and PT connected to posterior vacuole, with expanding posterior vacuole’) is the most preferred hypothesis. The schematic shows our understanding of the process based on Model 5. After initiation of germination, the PT extrudes via an eversion-based mechanism. Vacuole contents may be connected to the original PT contents. The eversion brings the end of the PT away from the posterior vacuole, which allows the infectious cargo to later enter the PT through fluid entrainment. Tube eversion causes negative pressure to build up within the spore. Eventually this negative pressure either initiates buckling of the spore wall or causes bubble formation in the spore to push the nucleus outward. Key numbers related to the process and the predictions from E-OE-PTPV-ExP hypothesis are summarized in the text box.
Videos
Video 1
3D reconstruction of ungerminated A. algerae spore from SBF-SEM data.
Representative 3D reconstruction of an ungerminated A. algerae spore. At the beginning of the video, slices through the spore are shown. Each color represents an individual organelle: exospore (orange), endospore (yellow), PT (blue), posterior vacuole (red), and anchoring disc (green).
Video 2
3D reconstruction of an incompletely germinated A. algerae spore from SBF-SEM.
Representative 3D reconstruction of an incompletely germinated A. algerae spore. At the beginning of the video, slices through the spore are shown. Each color represents an individual organelle: exospore (orange), endospore (yellow), PT (blue), posterior vacuole (red), nuclei (pink) and anchoring disc (green).
Video 3
3D reconstruction of a germinated A. algerae spore from SBF-SEM.
Representative 3D reconstruction of a germinated A. algerae spore. At the beginning of the video, slices through the spore are shown. Each color represents an individual organelle: exospore (orange), endospore (yellow), PT (blue), and posterior vacuole (red). Note buckling of the spore body after cargo has been expelled.
Video 4
Live-cell imaging of A. algerae PT germination in 0%MC.
Video 5
Live-cell imaging of A. algerae PT germination in 4%MC.
Additional files
-
Supplementary file 1
Selection of potential hypotheses.
- https://cdn.elifesciences.org/articles/86638/elife-86638-supp1-v2.xlsx
-
Supplementary file 2
Summary of hypotheses.
- https://cdn.elifesciences.org/articles/86638/elife-86638-supp2-v2.xlsx
-
Supplementary file 3
Methylcellulose does not change the germination rate of A. algerae spores.
- https://cdn.elifesciences.org/articles/86638/elife-86638-supp3-v2.xlsx
-
Supplementary file 4
Sensitivity testing on cytoplasmic viscosity.
- https://cdn.elifesciences.org/articles/86638/elife-86638-supp4-v2.xlsx
-
Supplementary file 5
Sensitivity testing on boundary slip length ().
- https://cdn.elifesciences.org/articles/86638/elife-86638-supp5-v2.xlsx
-
Supplementary file 6
SBF-SEM observations on spore wall buckling.
- https://cdn.elifesciences.org/articles/86638/elife-86638-supp6-v2.xlsx
-
Supplementary file 7
Sensitivity testing on cytoplasmic viscosity and boundary slip length (), considering the 2-fold length changes in PT before and after germination.
- https://cdn.elifesciences.org/articles/86638/elife-86638-supp7-v2.xlsx
-
MDAR checklist
- https://cdn.elifesciences.org/articles/86638/elife-86638-mdarchecklist1-v2.docx
Download links
A two-part list of links to download the article, or parts of the article, in various formats.
Downloads (link to download the article as PDF)
Open citations (links to open the citations from this article in various online reference manager services)
Cite this article (links to download the citations from this article in formats compatible with various reference manager tools)
Energetics of the microsporidian polar tube invasion machinery
eLife 12:RP86638.
https://doi.org/10.7554/eLife.86638.3


