Gene expression plasticity followed by genetic change during colonization in a high-elevation environment
- Key Laboratory of Zoological Systematics and Evolution, Institute of Zoology, Chinese Academy of Sciences, China
- Faculty of Biodiversity and Conservation, Southwest Forestry University, China
- College of Life Sciences, University of Chinese Academy of Sciences, China
- Center for Excellence in Animal Evolution and Genetics, Chinese Academy of Sciences, China
Figures
Figure 1
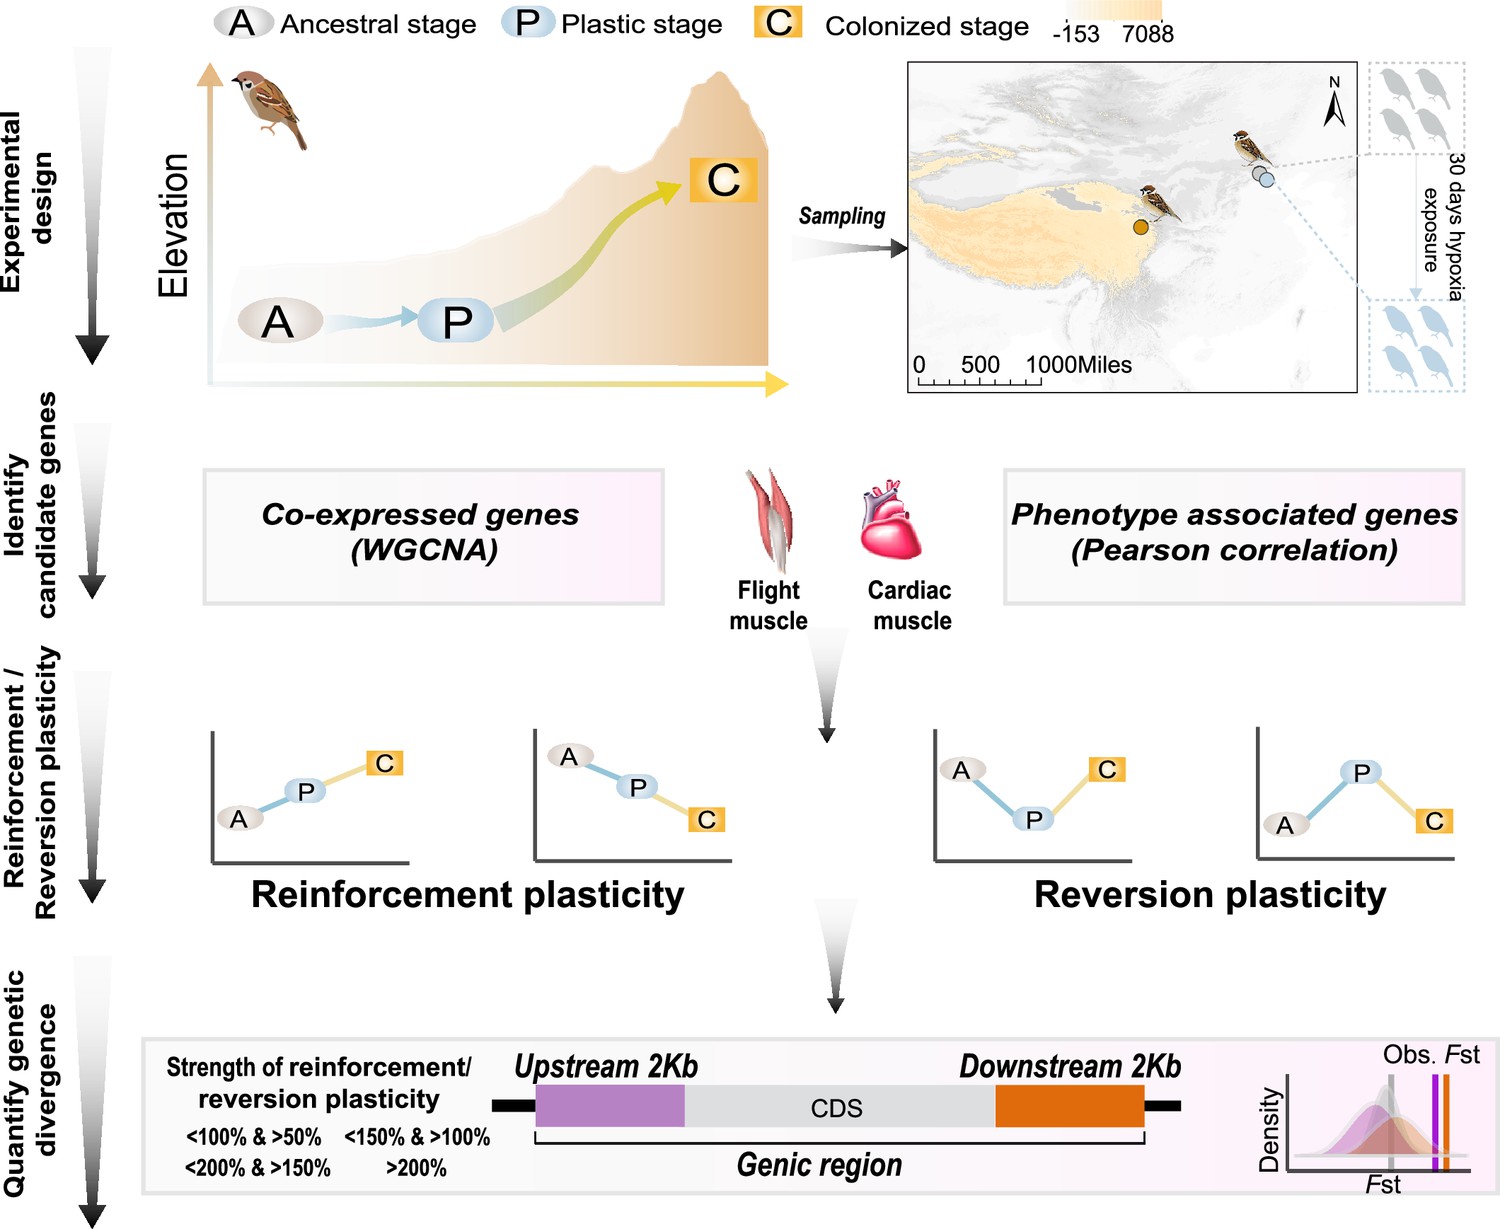
A schematic representation of quantifying gene expression plasticity and genetic change in relevant genes.
Experimental design, transcriptomic data of the flight, and cardiac muscle were collected from tree sparrows obtained in their original lowland habitat (ancestral stage), experimental exposure to the hypoxic condition (plastic stage), and colonization to a high-elevation environment (colonized stage). Identify candidate genes, co-expressed genes that display correlation with hypoxia tolerance were identified by a weighted gene correlation network analysis (WGCNA) and muscle phenotype-associated genes were identified by correlating gene expression levels and each of the muscle phenotypes. Reinforcement/reversion plasticity, the genes with reinforcement or reversion plasticity were defined by comparing expression changes between the ancestral and plastic stages (plastic change), and between plastic and colonized stages (evolved change). The strength of reinforcement/reversion plasticity is measured by a range of thresholds, i.e., <100% and >50%, <150% and >100%,<200% and >150%, and >200%. Quantify genetic divergence, genetic divergence (i.e. FST) between lowland and highland populations was estimated for the genic region, 2 kb upstream and downstream regions of the candidate genes. The empirical FST values were compared with permuted FST distributions generated from 100 random samplings from the genetic background. A threshold of p<0.05 was used to determine statistical significance.
Figure 2 with 3 supplements
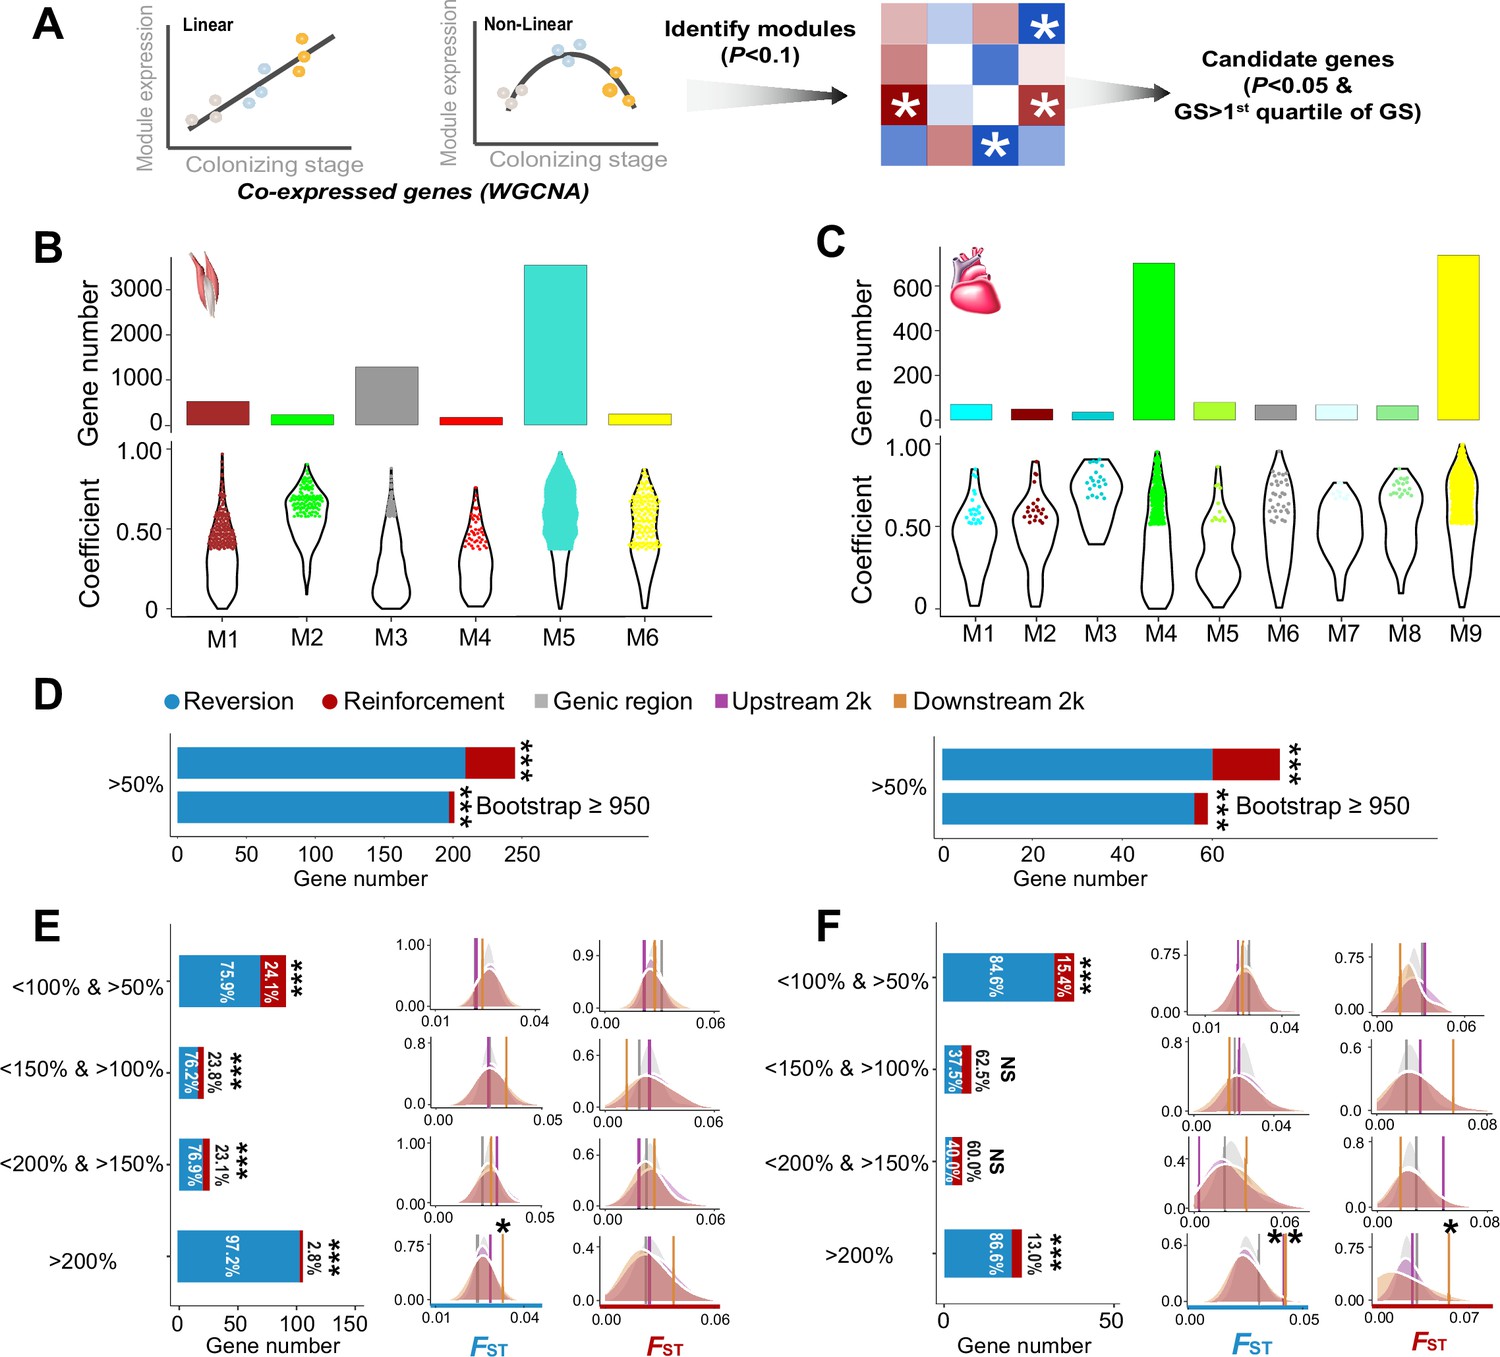
The weighted gene correlation network analysis (WGCNA) identified co-expressed genes and reinforcement and reversion of expression plasticity.
(A) Pearson linear correlation is used to identify genes with expression reinforcement and nonlinear regression to identify genes with expression reversion. Regulatory modules were identified as branches of the resulting cluster tree via the dynamic tree-cutting method and highly correlated modules (p<0.1) were merged. We used ‘GS>first quartile of GS’ and ‘p<0.05’ to identify important genes within modules (hub genes). (B) and (C) Six and nine modules, respectively, were identified to be associated with different stages for the flight and cardiac muscles (p<0.01). Within each module, colored dots show the genes with the expression levels significantly associated with the stages (gene significance function>first quartile and p<0.05). (D) Frequencies of genes with reinforcement and reversion plasticity (>50%) and their subsets that acquire strong support in the parametric bootstrap analyses (≥950/1000). (E) and (F) Left, genes with expression plasticity being reinforced (red) or reversed (blue) at the colonized stage identified for the flight (E) and cardiac muscles (F), respectively. There are more genes showing reversion plasticity than those showing reinforcement plasticity. Two-tailed binomial test, NS, nonsignificant; ***p<0.001. Right, the FST values (vertical lines) significantly increase in the 2 kb upstream and/or downstream regions of the genes having the magnitude of reinforcement/reversion plasticity >200%. Vertical lines, the empirical FST values; shades, permutated FST distributions generated from 100 random samplings. NS, non-significant, *p<0.05; **p<0.01.
-
Figure 2—source data 1
Raw data for Figure 2B–F.
- https://cdn.elifesciences.org/articles/86687/elife-86687-fig2-data1-v1.xlsx
Figure 2—figure supplement 1
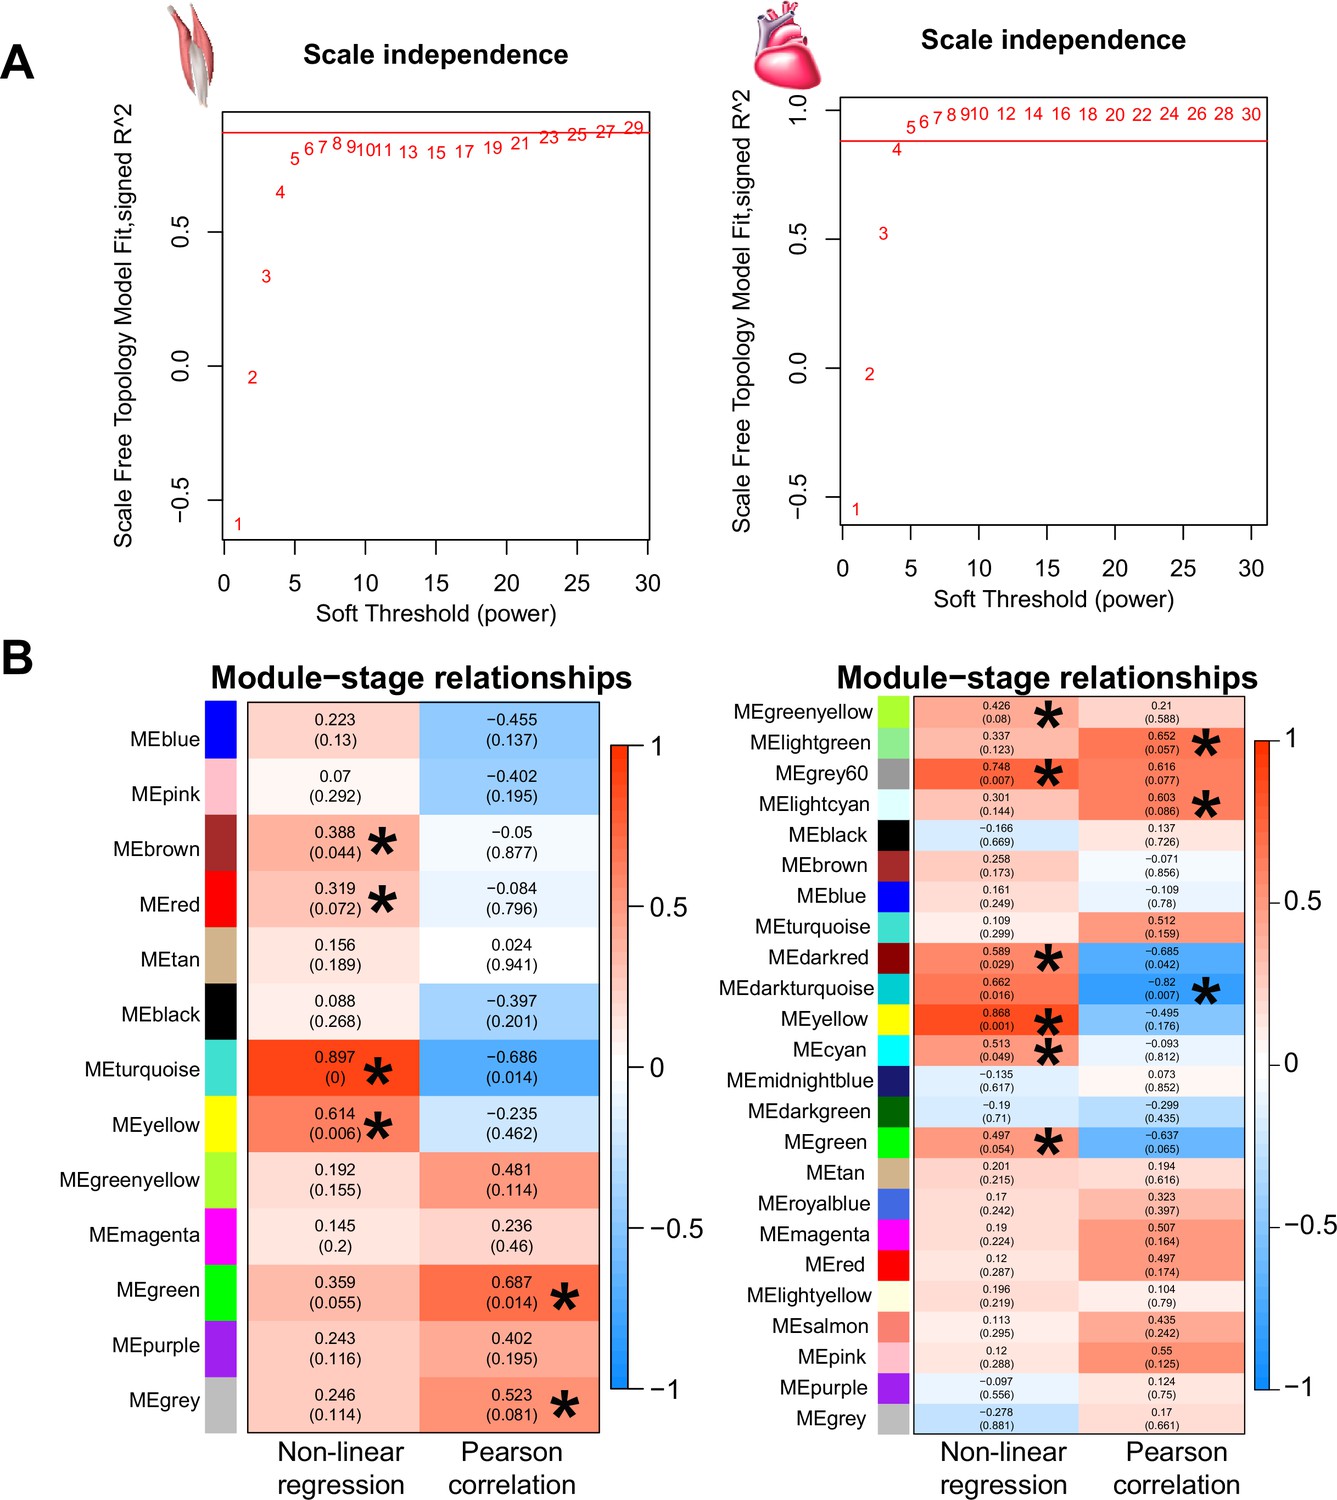
Weighted gene correlation network analysis (WGCNA) identified co-expressed genes with gene expression change association with the three stages (i.e. ancestral stage, plastic stage, and colonized stage).
(A-B) The soft thresholds of the scale independence used for WGCNA analyses were 23 and 4 for flight and cardiac muscles. (C-D) WGCNA identified six and nine highly correlated modules for the flight muscle (left) and cardiac muscle (right) transcriptomes using a threshold of p<0.1.
Figure 2—figure supplement 2
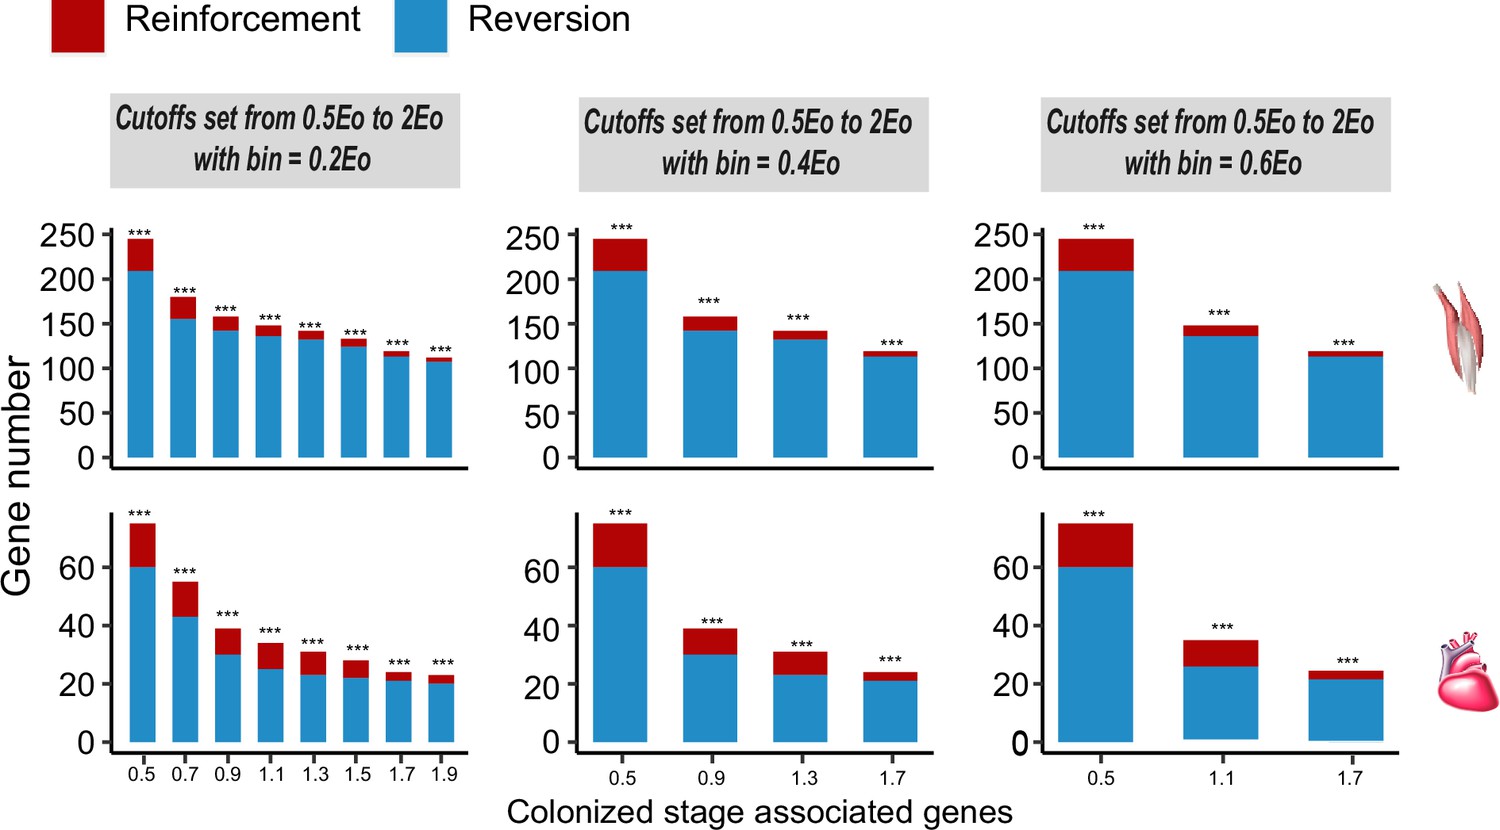
Frequencies of genes with reinforcement and reversion plasticity in the flight and cardiac muscles.
Three different bins are set along the spectrum of the reinforcement/reversion plasticity, i.e., 20%, 40%, and 60%. All comparisons show that there are more genes showing reversion plasticity than those showing reinforcement plasticity. Upper, flight muscle; lower, cardiac muscle. Two-tailed binomial test, ***p<0.001.
Figure 2—figure supplement 3
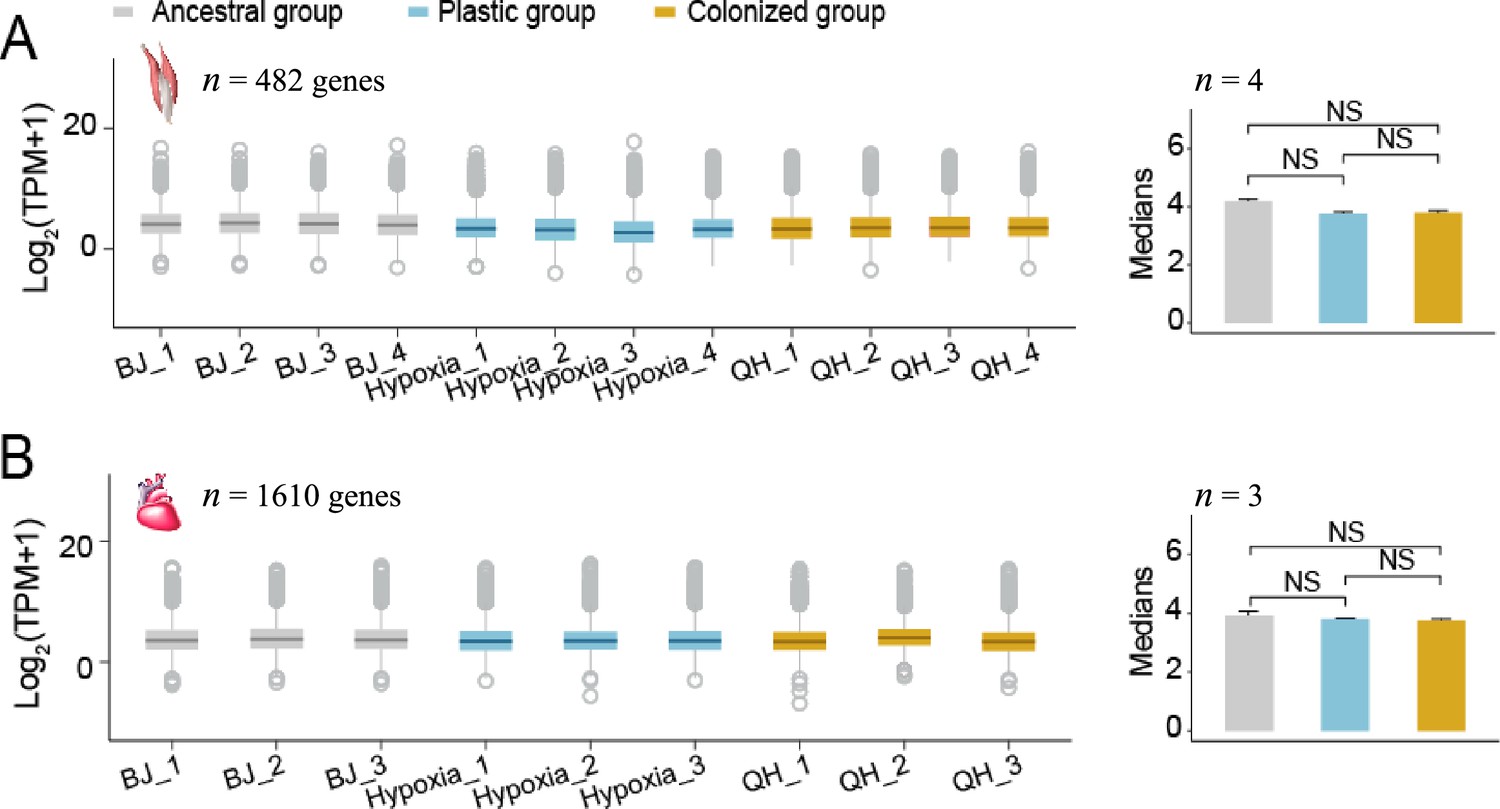
The median expression levels of the conserved genes (i.e. coefficient of variance ≤0.3 and average transcript per million (TPM) ≥1 for each sample) did not differ among the lowland, hypoxia-exposed lowland and highland tree sparrows (Wilcoxon signed-rank test, p<0.05).
Figure 3 with 2 supplements
Genes with expression levels associated with muscle phenotypes and adaptive and maladaptive plasticity.
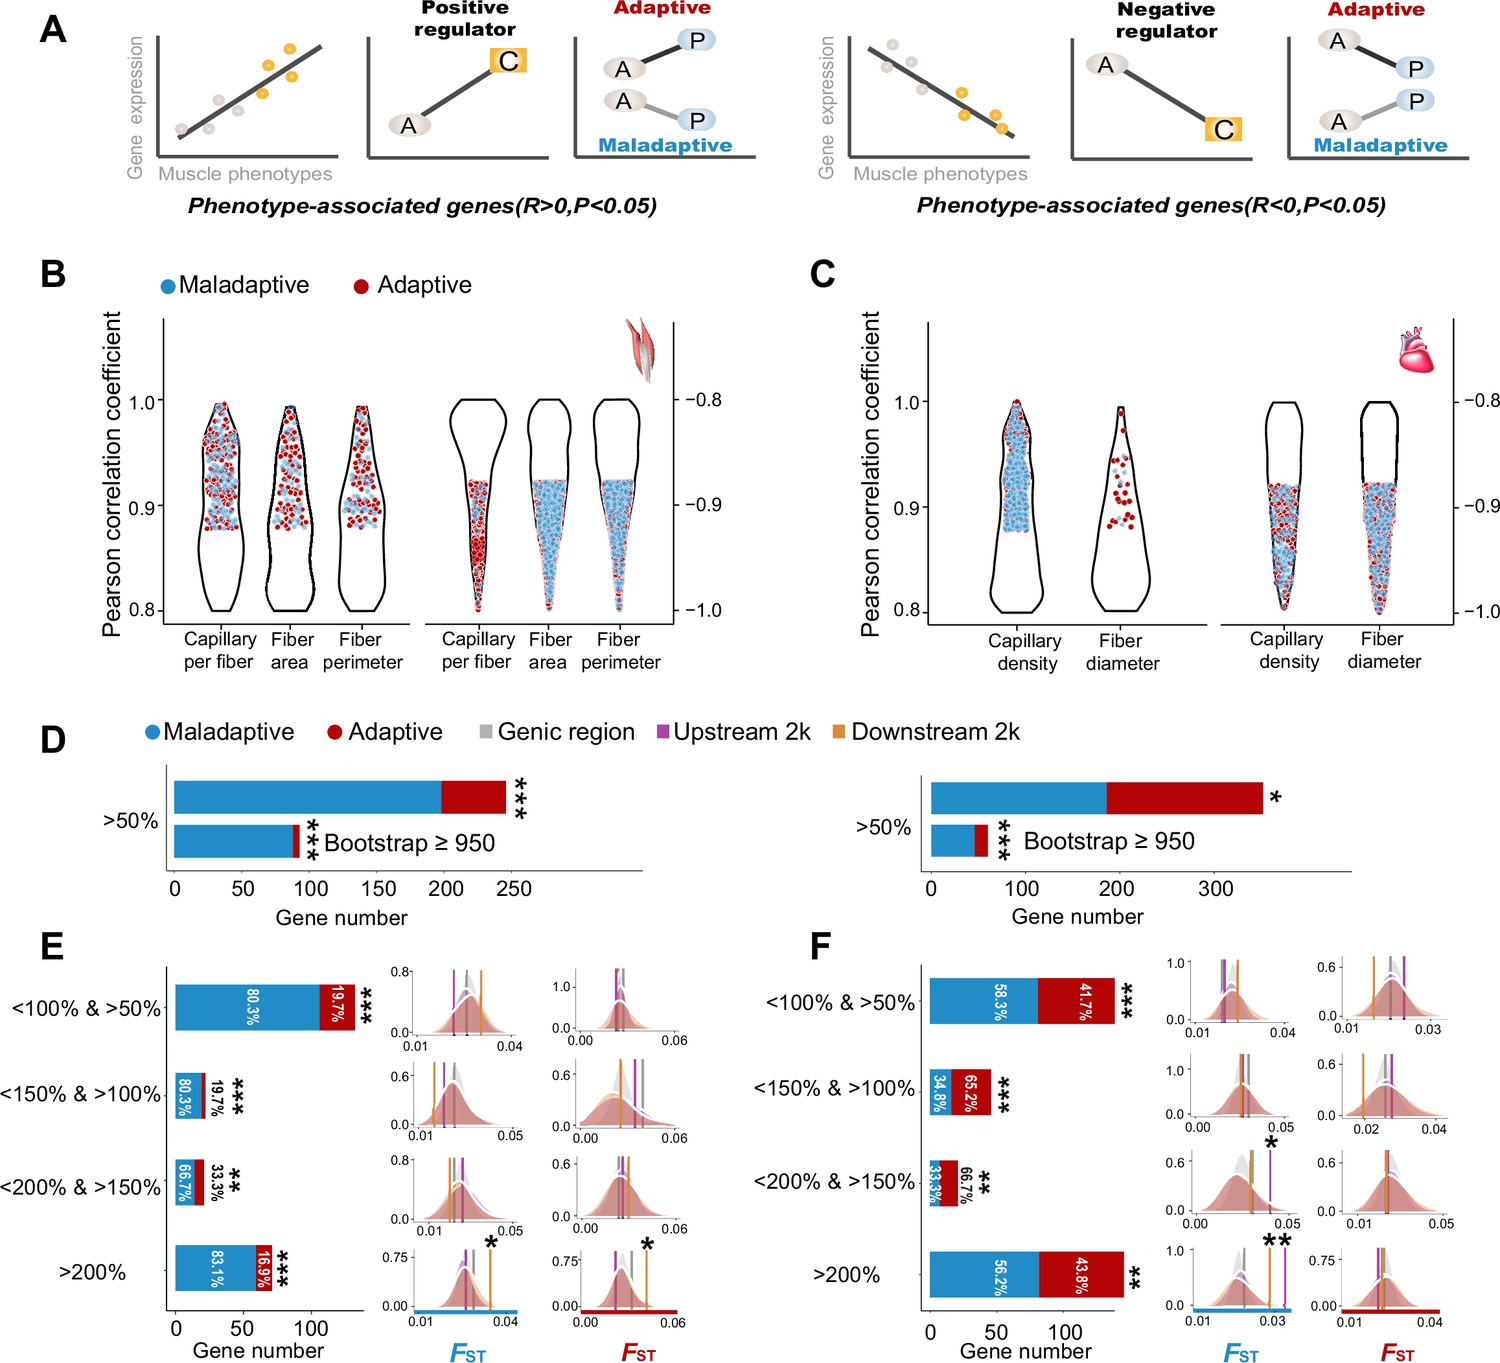
(A) Gene expression profiles were correlated with muscle phenotypes. The direction of gene expression plasticity at the plastic stage matched the expectation for positive regulator (increased expression) and negative regulators (decreased expression) in the colonized tree sparrows was considered to indicate adaptive plasticity. Conversely, those that opposed this expectation were considered to be maladaptive, i.e., the direction of gene expression plasticity at the plastic stage showed decreased expression for the positive regulators and increased expression for negative regulators. A, ancestral stage; P, plastic stage; C, colonized stage. (B) and (C) Gene expression profiles were correlated with three flight muscle phenotypes (B, capillary per fiber, fiber area, and perimeter) and two cardiac muscle phenotype (C, capillary density, and fiber diameter). Red dots show genes with adaptive gene expression plasticity and blue dots show genes with maladaptive gene expression plasticity. (D) Frequencies of genes with adaptive and maladaptive plasticity (>50%) and their subsets that acquire strong support in the parametric bootstrap analyses (≥950/1000). (E) and (F) Left, candidate genes are classified into four categories with different magnitudes of adaptive or maladaptive plasticity. More genes show maladaptive plasticity than those that show adaptive plasticity. Two-tailed binomial test, **p<0.01; ***p<0.001. Right, the empirical FST values significantly increased in the 2 k upstream and/or downstream regions of the genes having adaptive/maladaptive plasticity <200% and >150% (cardiac muscle) and >200% (flight and cardiac muscles). (E) Flight muscle, (F) Cardiac muscle. Vertical lines, the empirical FST values; shades, permutated FST distributions generated from 100 times sampling. *p<0.05; **p<0.01.
-
Figure 3—source data 1
Raw data for Figure 3B–F.
- https://cdn.elifesciences.org/articles/86687/elife-86687-fig3-data1-v1.xlsx
Figure 3—figure supplement 1
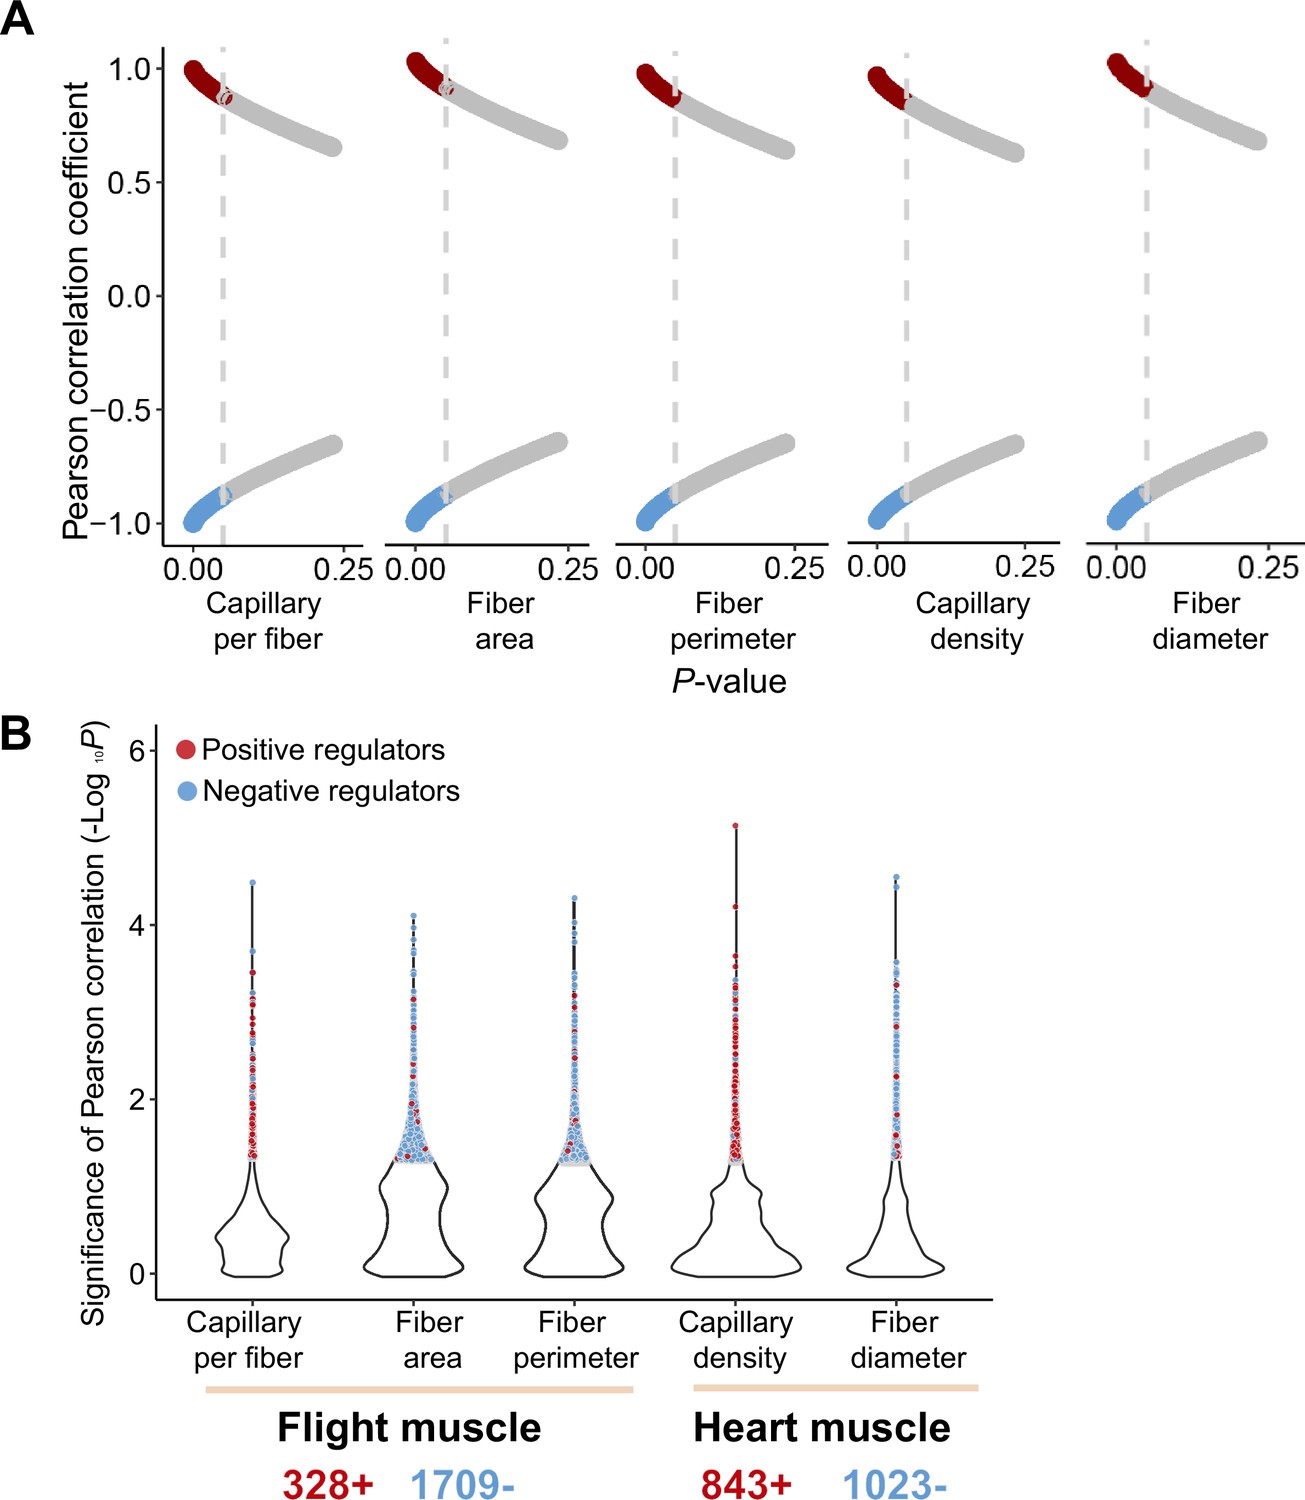
Pearson correlation between gene expression and muscle phenotypic values of the ancestral and colonized individuals.
(A) Red or blue dots showed the genes with their expression changes that are positively or negatively correlated with muscle phenotypes, respectively. A threshold of p<0.05 (vertical gray line) is used to determine statistical significance. (B) 2037 and 1866 muscle phenotype-associated genes are identified in the flight and cardiac muscle transcriptomes, respectively, which included 328 and 843 genes that are positively correlated with flight and cardiac muscle phenotypes, and 1709 and 1023 negatively correlated with flight and cardiac muscle phenotypes.
Figure 3—figure supplement 2
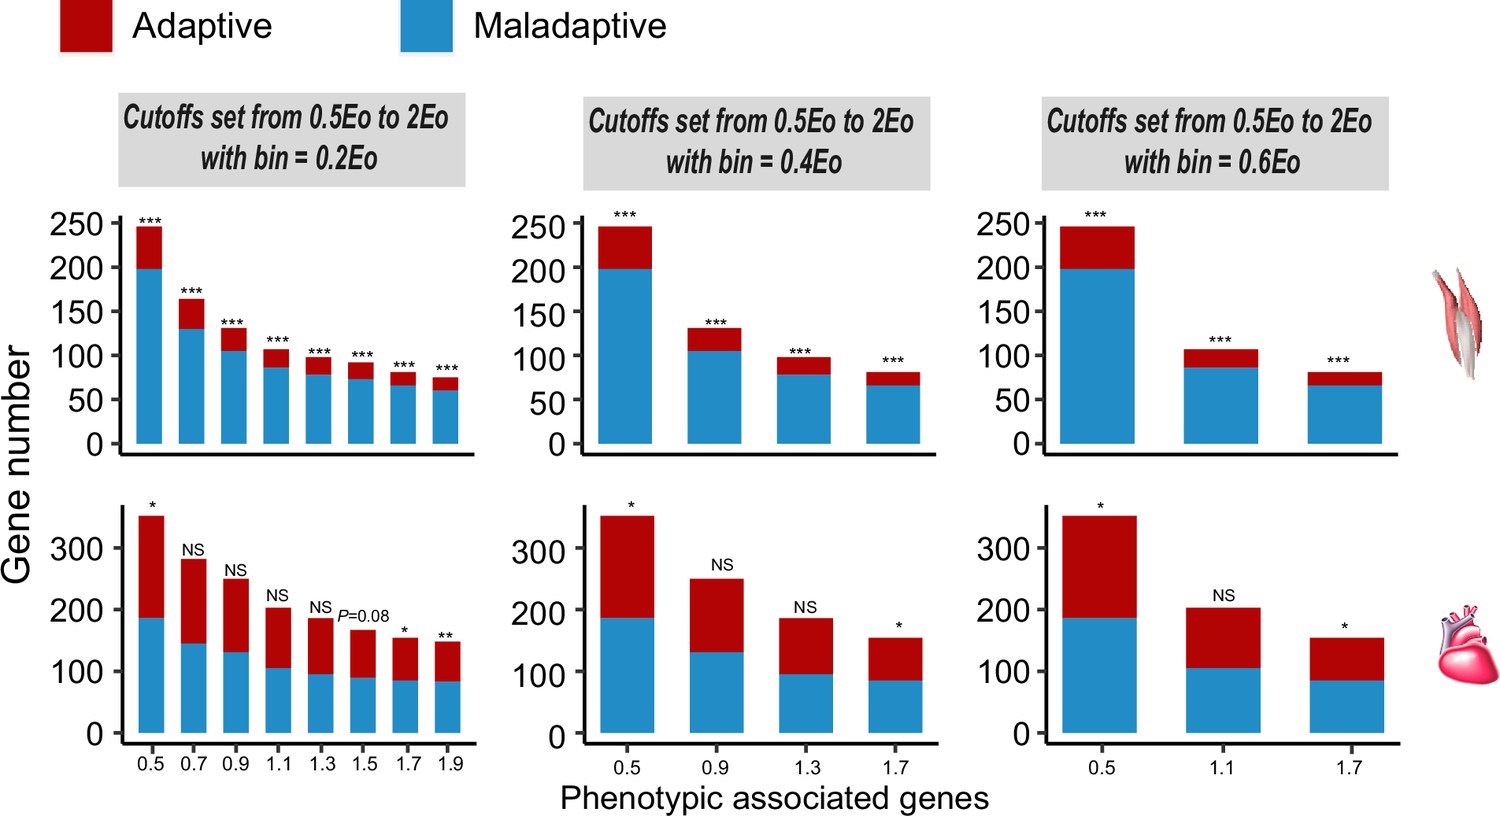
Frequencies of genes with adaptive and maladaptive plasticity in the flight and cardiac muscles.
Three different bins are set along the spectrum of the maladaptive/adaptive plasticity, i.e., 20%, 40%, and 60%. All comparisons show that there are more genes showing maladaptive plasticity than those showing adaptive plasticity for the flight muscle, while more than 50% of comparisons supported an excess of genes with maladaptive plasticity for the cardiac muscle. Two-tailed binomial test, NS, non significant; *p<0.05; **p<0.01; ***p<0.001.
Additional files
-
Supplementary file 1
Sampling of transcriptomic data used in this study.
All birds collected were adults and at pre-breeding season. Sex was unknown.
- https://cdn.elifesciences.org/articles/86687/elife-86687-supp1-v1.xlsx
-
Supplementary file 2
Statistics of reads mapping and coverage of 11 highland and 12 lowland tree sparrows (Qu et al., 2020).
All birds collected were adults and sex is unknown.
- https://cdn.elifesciences.org/articles/86687/elife-86687-supp2-v1.xlsx
-
MDAR checklist
- https://cdn.elifesciences.org/articles/86687/elife-86687-mdarchecklist1-v1.docx
Download links
A two-part list of links to download the article, or parts of the article, in various formats.
Downloads (link to download the article as PDF)
Open citations (links to open the citations from this article in various online reference manager services)
Cite this article (links to download the citations from this article in formats compatible with various reference manager tools)
Gene expression plasticity followed by genetic change during colonization in a high-elevation environment
eLife 12:RP86687.
https://doi.org/10.7554/eLife.86687.3


