Single molecule analysis of CENP-A chromatin by high-speed atomic force microscopy
- National Cancer Institute, Center for Cancer Research, Laboratory Receptor Biology and Gene Expression, United States
- National Heart, Lung, and Blood Institute, Laboratory of Single Molecule Biophysics, United States
- Department of Chemistry, Shiv Nadar University, India
Figures
Figure 1 with 2 supplements
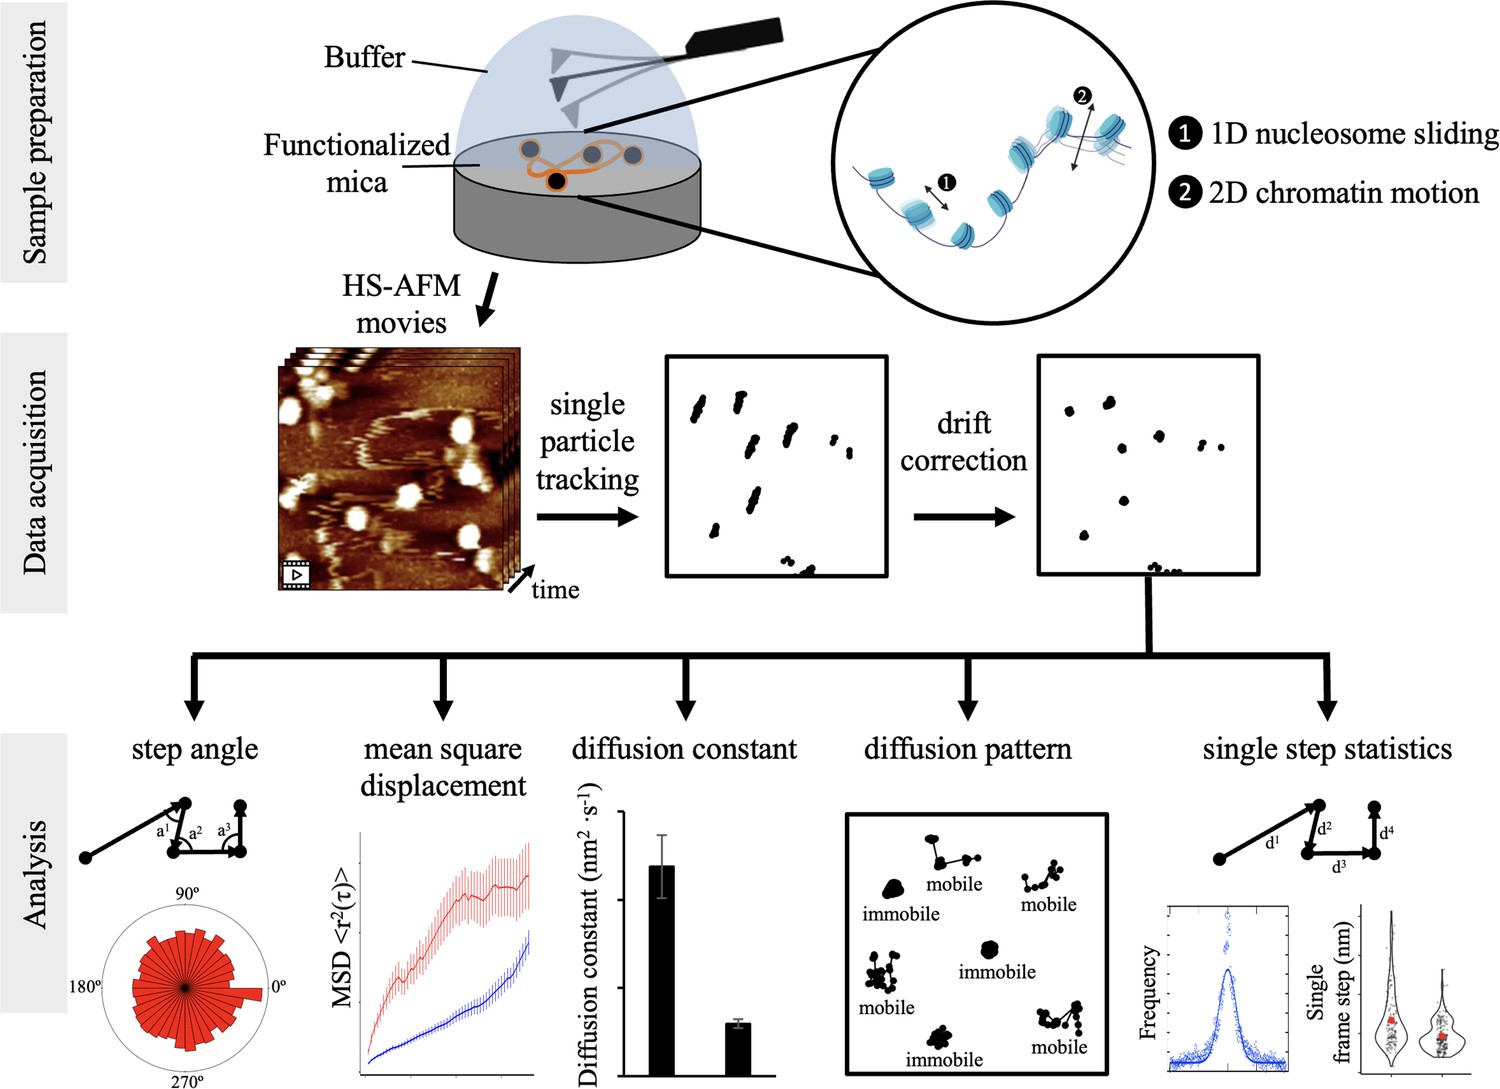
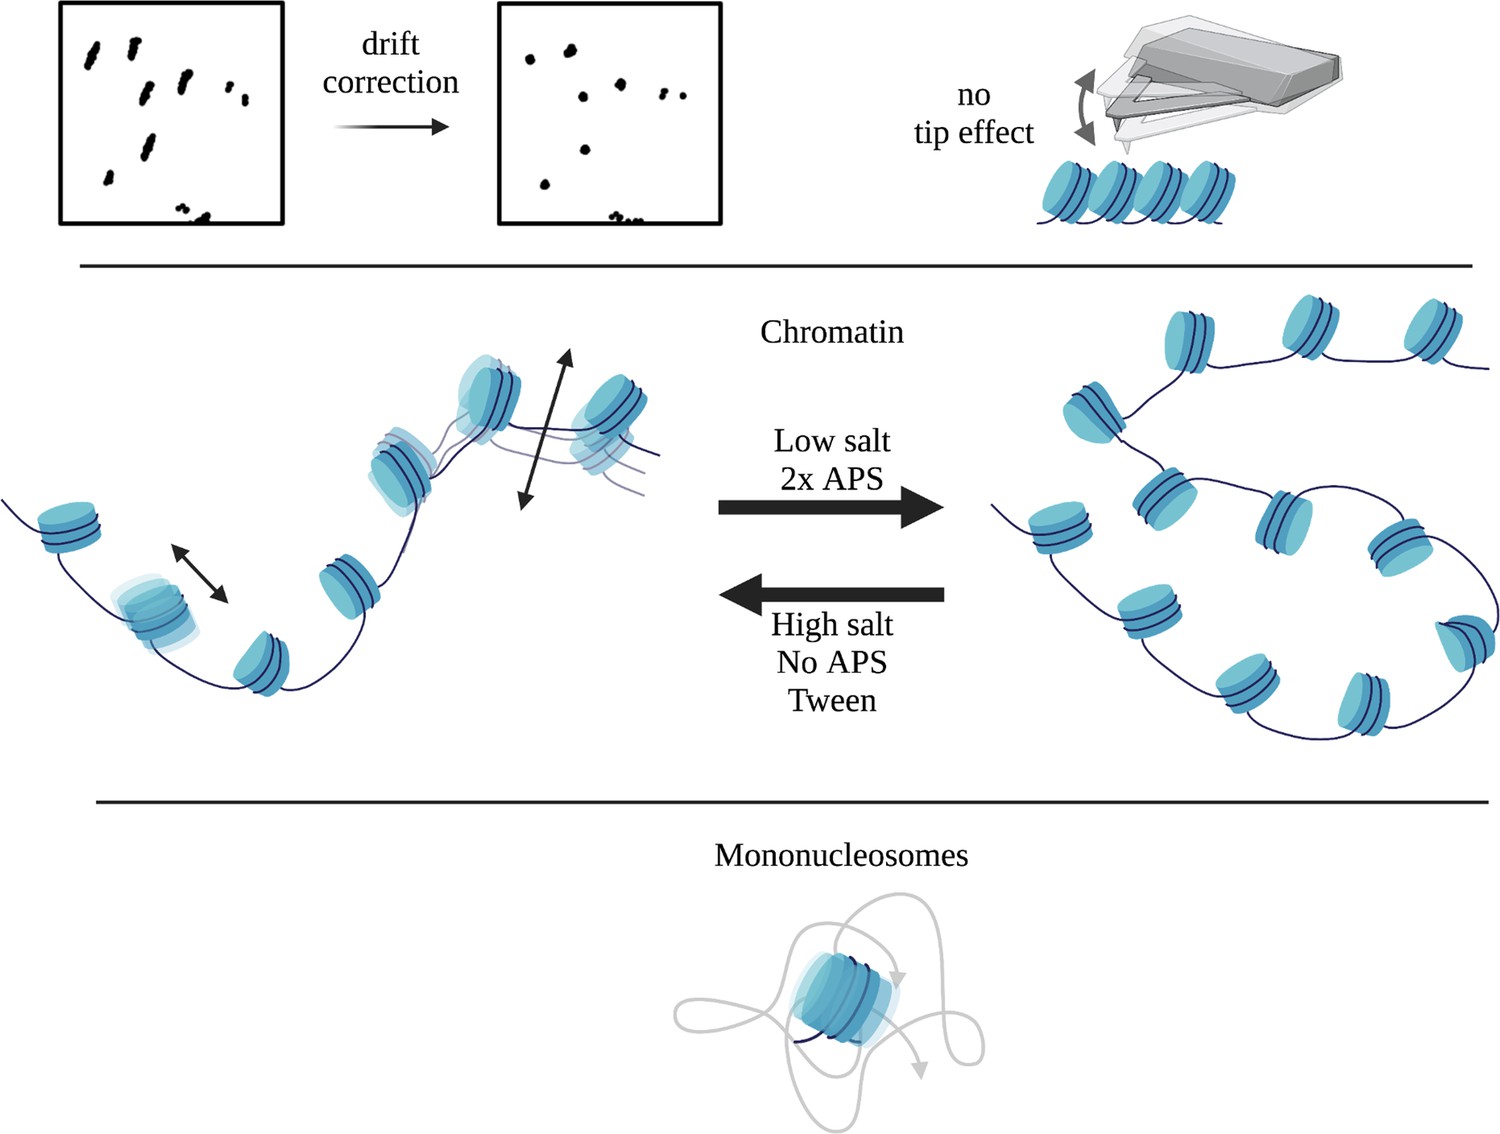
Schematic of experimental configurations for HS-AFM nucleosome measurements and analysis of extracted single particle trajectories Sample preparation: CENP-A nucleosomes were in vitro reconstituted and imaged by HS-AFM in fluid.
By HS-AFM, we can track nucleosome motion, corresponding to both nucleosomes sliding along the DNA and chromatin fiber moving. Data acquisition: HS-AFM videos were obtained at a framerate of 0.5 Hz (2 s per frame) for a minimum of 20 s and up to 120 s. Using MATLAB, we extracted nucleosome trajectories, which were subsequently corrected for drift. Analysis: trajectories were analyzed to extract several mobility and diffusion-related parameters to determine both potential tip-scanning artifacts and to characterize nucleosome dynamics.
Figure 1—figure supplement 1
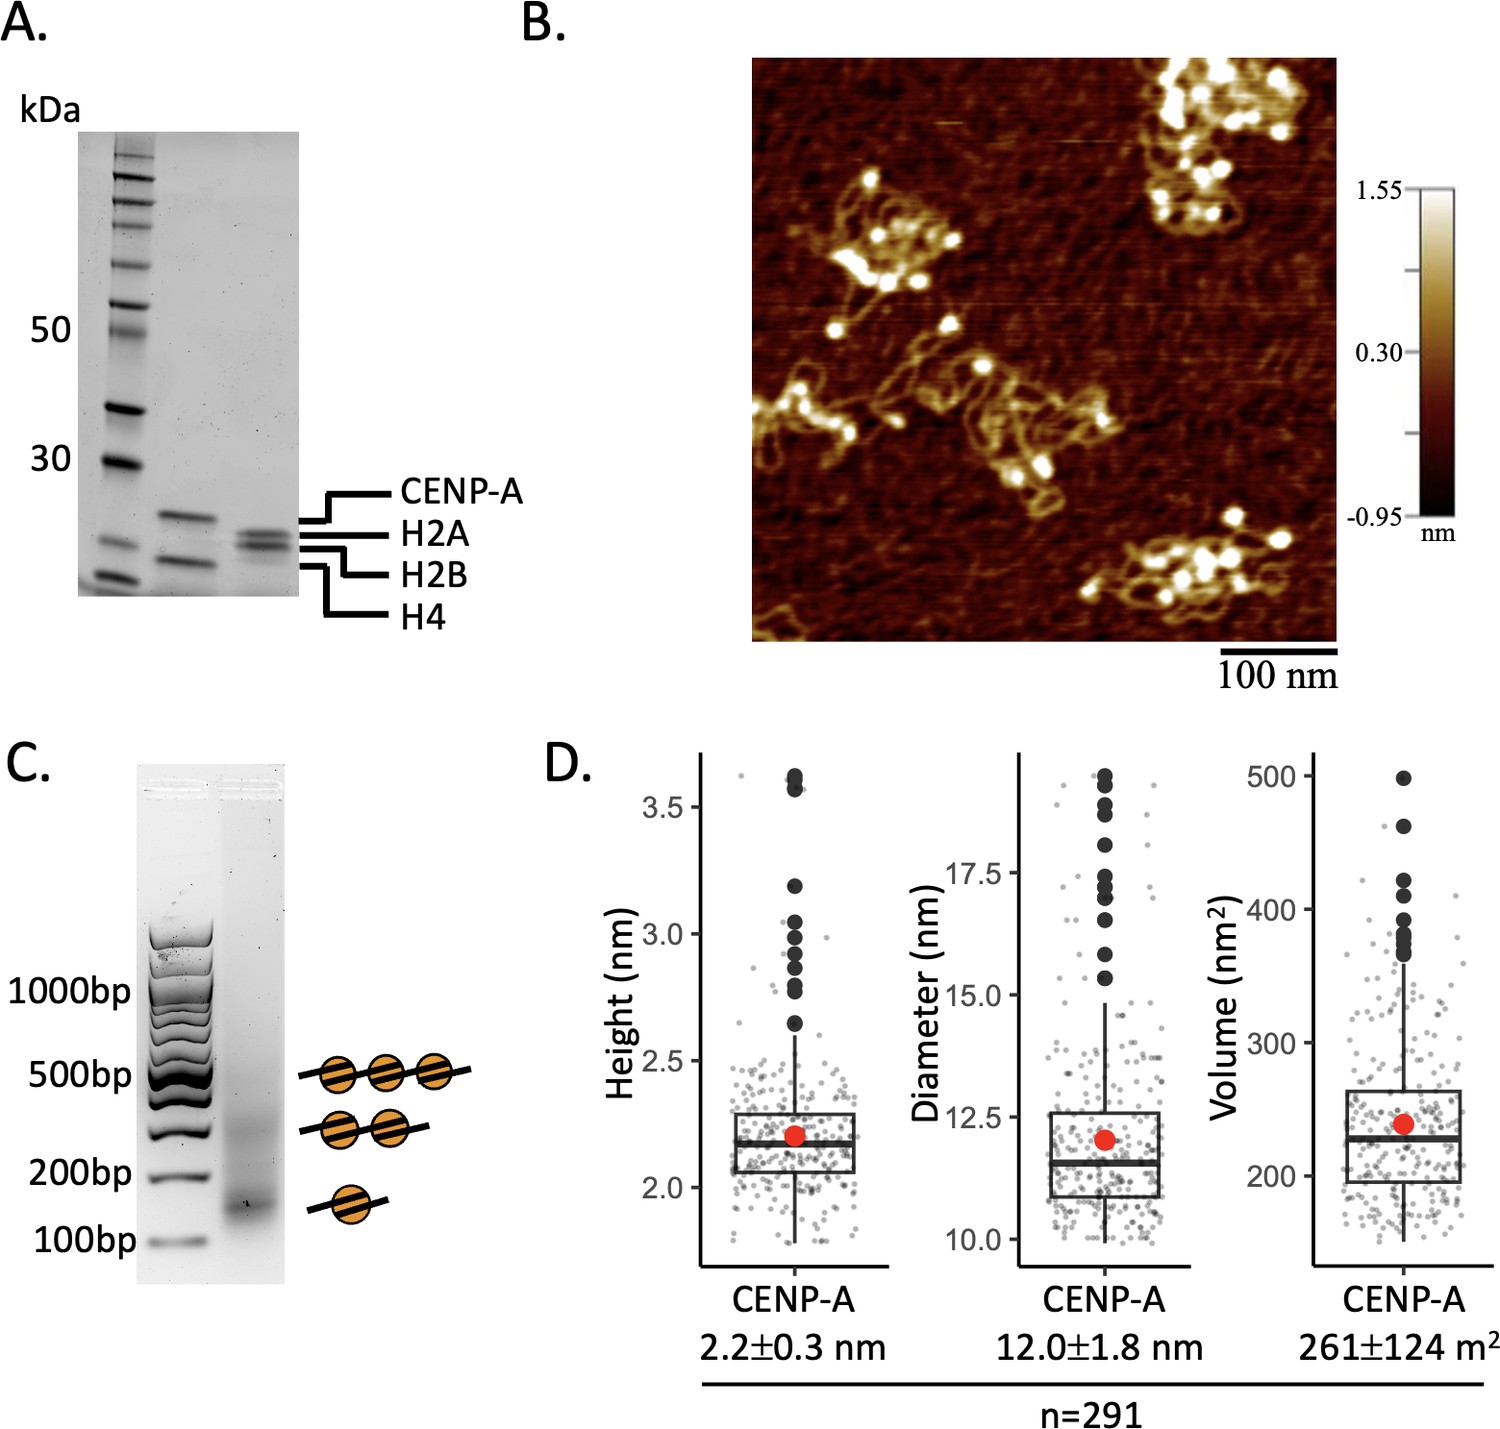
Confirmation of in vitro reconstitution of CENP-A chromatin.
(A) Purified histone protein was quantified from SDS-PAGE blots for calculating the correct in vitro reconstitution ratios. (B) Representative in air AFM image of in vitro reconstituted CENP-A chromatin. (C) Agarose gel of MNase digested in vitro reconstituted CENP-A chromatin showing mono-, di-, and trinucleosome arrays confirming chromatin formation. (D) Quantification of AFM measurements of in vitro reconstituted CENP-A nucleosomes.
-
Figure 1—figure supplement 1—source data 1
Complete gels for Figure 1—figure supplement 1A (12% SDS-PAGE) and 1 C (1% agarose gel).
- https://cdn.elifesciences.org/articles/86709/elife-86709-fig1-figsupp1-data1-v1.zip
-
Figure 1—figure supplement 1—source data 2
Nucleosome statistics for each nucleosome for nucleosome diameter (nm), nucleosome height (nm), and nucleosome volume (nm3).
- https://cdn.elifesciences.org/articles/86709/elife-86709-fig1-figsupp1-data2-v1.zip
Figure 1—figure supplement 2
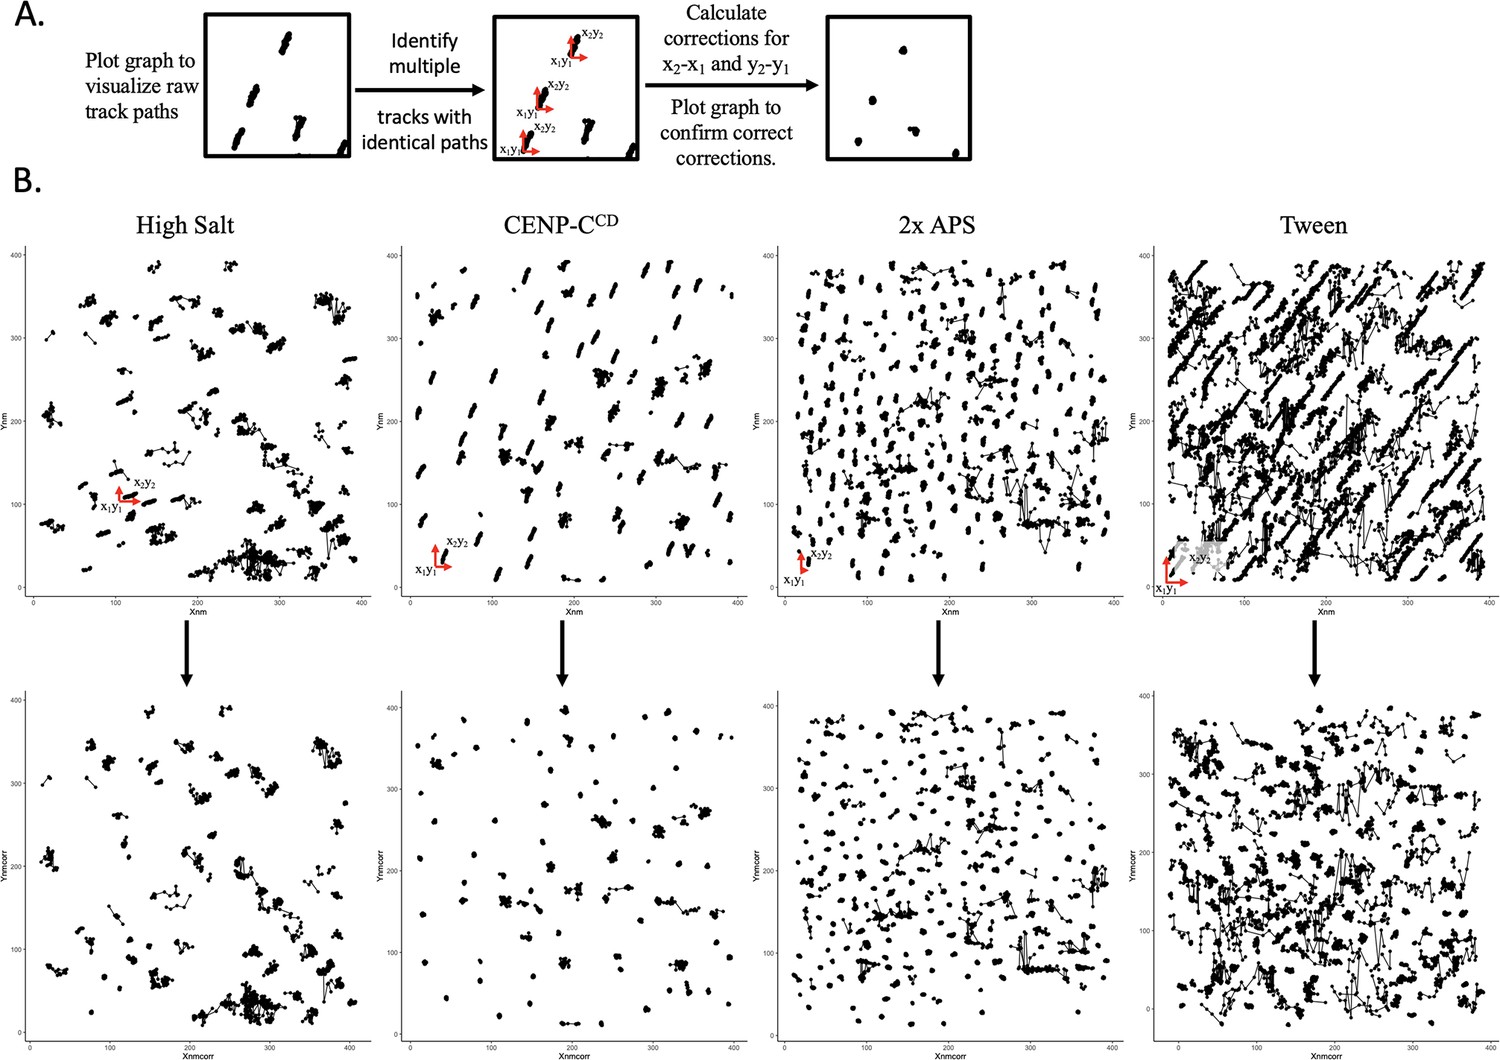
Drift correction of HS-AFM videos.
(A) First, raw trajectories were visualized. Some particles that do not appear to move were used to determine drift correction. The direction of these immobile particles must be identical. Next, the drift for the x and y steps were calculated and the raw trajectories were drift corrected. Finally, following drift correction, the trajectories were again visualized to confirm that drift correction removed the observed drift. (B) Four examples of HS-AFM videos with observed drift before and after drift correction.
Figure 2 with 8 supplements
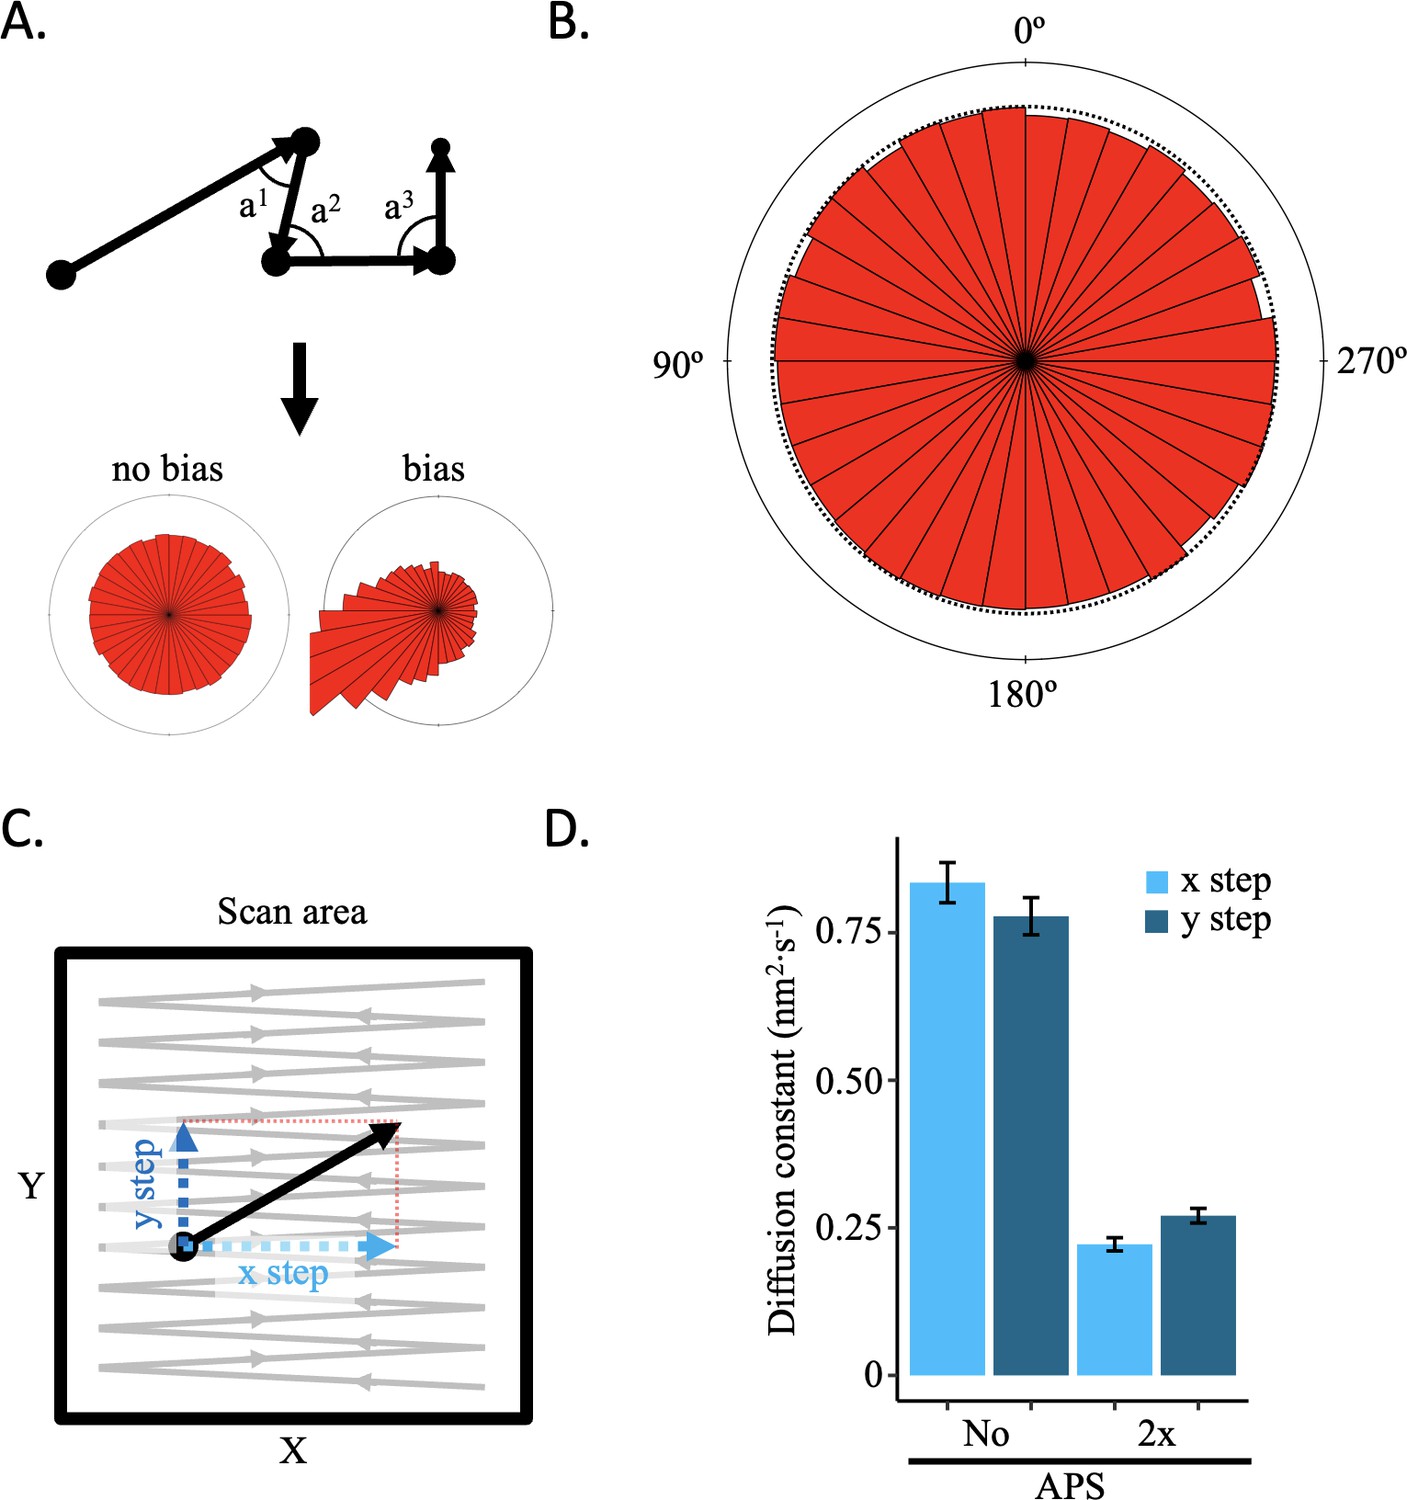
No AFM tip-motion effect was observed.
If the AFM tip were to displace the sample during scanning, it should result in a motion bias in the direction of scanning that can be detected. (A) Schematic representation of how angle between successive steps within a trajectory is determined and representative angle distribution graphs for no bias or bias. (B) All angles for successive steps of all trajectories of five control conditions (low salt, high salt, no APS, 2 x APS, and Tween-20) show no sign of bias (Figure 2—figure supplement 1A). (C) Every step has an x and y coordinate. By obtaining the diffusion constant for each axis separately, motion bias between the x and y axis can be discerned, which is an indication of bias introduced by the AFM tip. (D) The diffusion constants for the x and y axis for CENP-A nucleosomes in low or high salt conditions show differences between imaging conditions, but not within each condition (Figure 2—figure supplement 1B). The error bars represent the standard error.
-
Figure 2—source data 1
Trajectory statistics for all tracked nucleosomes.
X and Y coordinates, distance between two steps, accumulated distance per trajectory, and angle between two steps are reported.
- https://cdn.elifesciences.org/articles/86709/elife-86709-fig2-data1-v1.zip
-
Figure 2—source data 2
Basic statistics for all tracked nucleosomes.
This includes diffusion constant (nm2·s–1), MSD slope (nm2), average MSD slope (nm2), average step size (nm), maximum R-step (nm), and R-step range (nm).
- https://cdn.elifesciences.org/articles/86709/elife-86709-fig2-data2-v1.zip
Figure 2—figure supplement 1
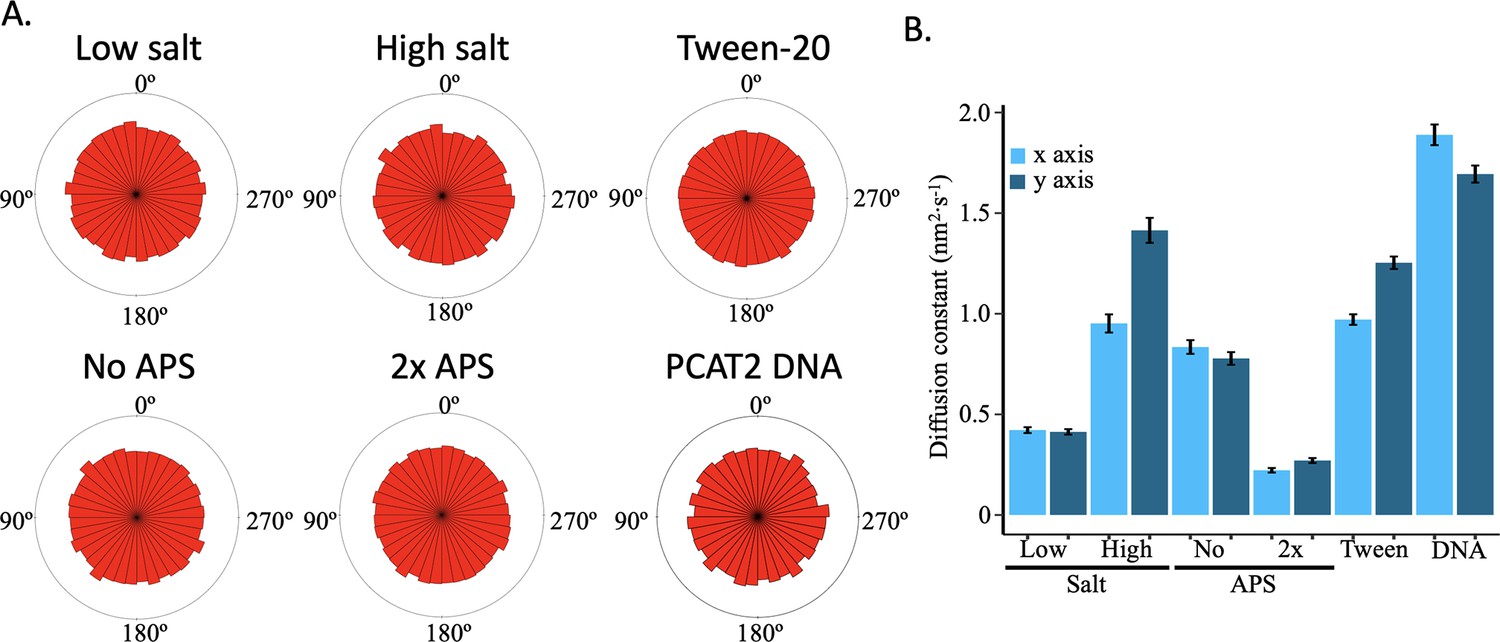
No AFM tip-motion effect observed across control conditions.
(A) The distribution of angles between successive nucleosome positions for each control condition. (B) Diffusion constants estimated from the x- and y-axis displacement distributions for each individual control condition. The data is obtained from two independent technical replicates per condition. The error bars represent standard error of the mean. The data represent at least two independent technical replicates.
-
Figure 2—figure supplement 1—source data 1
Trajectory statistics for all tracked nucleosomes.
X and Y coordinates, distance between two steps, accumulated distance per trajectory, and angle between two steps are reported.
- https://cdn.elifesciences.org/articles/86709/elife-86709-fig2-figsupp1-data1-v1.zip
Figure 2—figure supplement 2
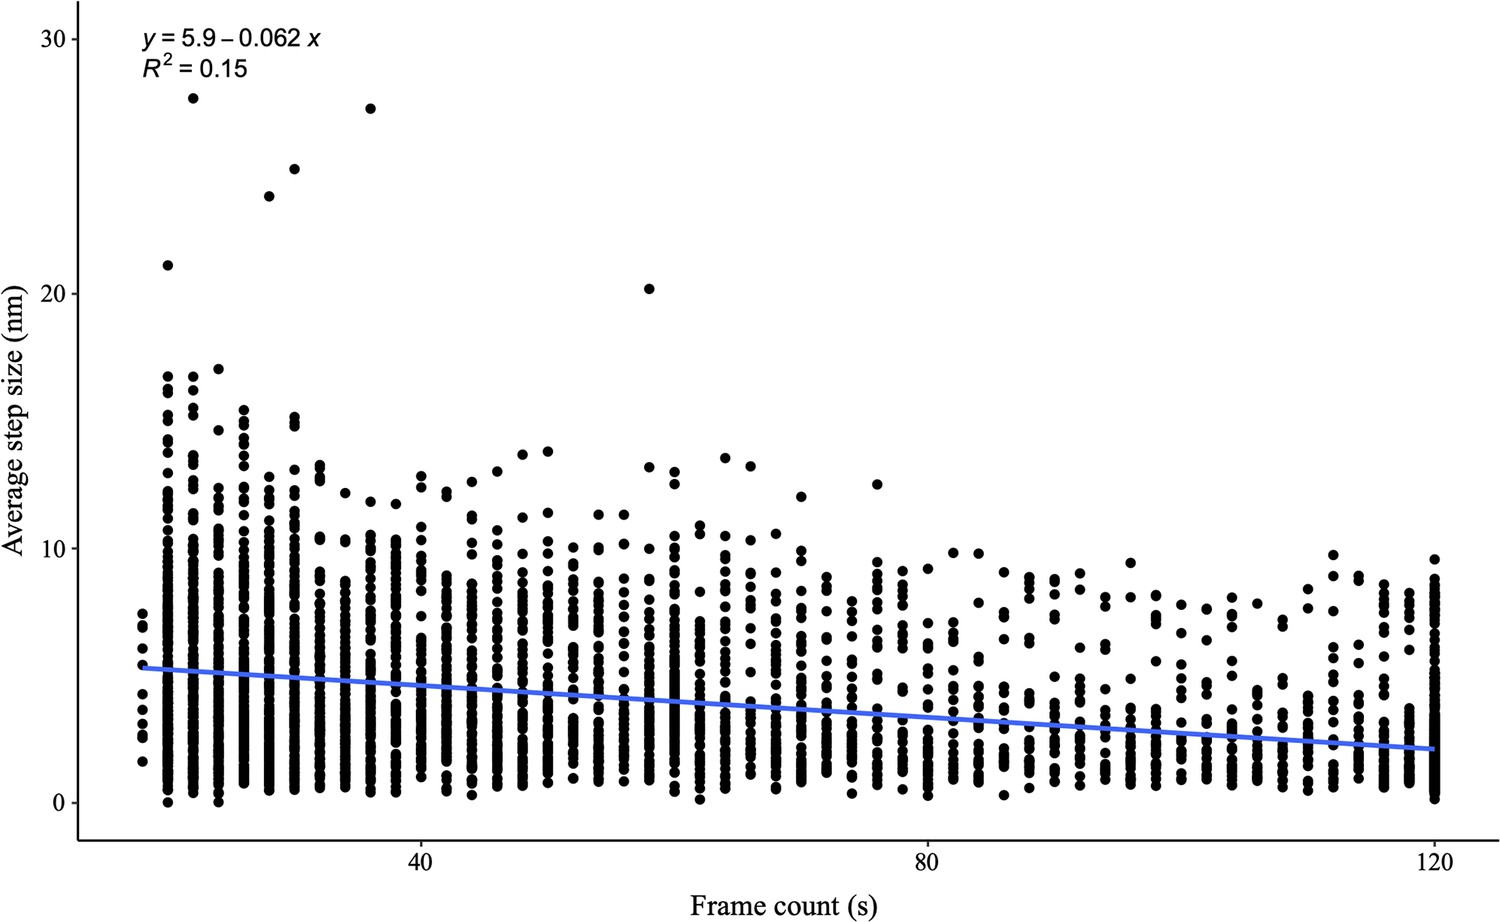
The scatter plot of average step size over each frame of the videos shows no bias by the AFM tip, as the R2 linear regression is 0.15.
The data is obtained from at least two independent technical replicates per condition.
-
Figure 2—figure supplement 2—source data 1
Trajectory statistics for all tracked nucleosomes.
X and Y coordinates, distance between two steps, accumulated distance per trajectory, and angle between two steps are reported.
- https://cdn.elifesciences.org/articles/86709/elife-86709-fig2-figsupp2-data1-v1.zip
-
Figure 2—figure supplement 2—source data 2
Basic statistics for all tracked nucleosomes.
This includes diffusion constant (nm2·s–1), MSD slope (nm2), average MSD slope (nm2), average step size (nm), maximum R-step (nm), and R-step range (nm).
- https://cdn.elifesciences.org/articles/86709/elife-86709-fig2-figsupp2-data2-v1.zip
Figure 2—video 1
HS-AFM video of in vitro reconstituted CENP-A chromatin in 5 mM NaCl containing buffer (low salt; speed =2 x).
Figure 2—video 2
HS-AFM video of in vitro reconstituted CENP-A chromatin in 150 mM NaCl containing buffer (high salt; speed =2 x).
Figure 2—video 3
HS-AFM video of in vitro reconstituted CENP-A chromatin imaged without functionalized mica (no APS; speed =2 x).
Figure 2—video 4
HS-AFM video of in vitro reconstituted CENP-A chromatin imaged with double the amount of APS to functionalize mica (2 x APS; speed =2 x).
Figure 2—video 5
HS-AFM video of in vitro reconstituted CENP-A chromatin imaged with physiological buffer +0.01% Tween (Tween; speed =2 x).
Figure 2—video 6
HS-AFM video of in vitro reconstituted CENP-A chromatin on PCAT2 plasmid imaged with physiological buffer (DNA; speed =2 x).
Figure 3 with 17 supplements

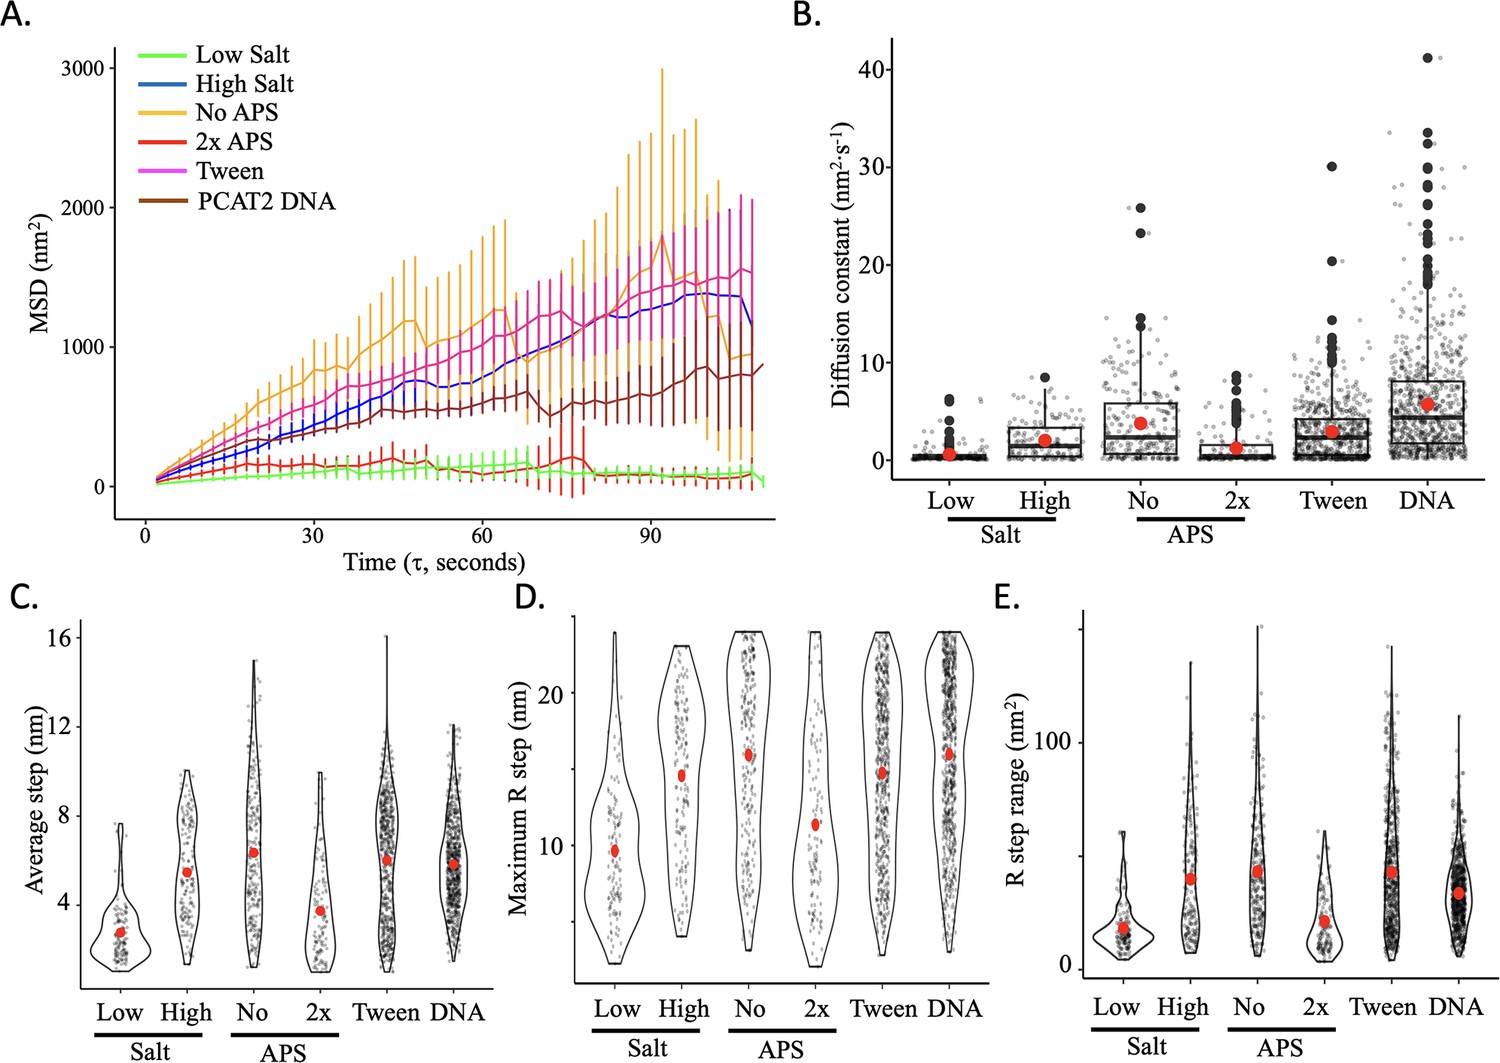
Salt and APS concentration predictably impacts CENP-A nucleosome mobility in vitro.
(A) The average mean square displacement is shown with standard error as a function of the time interval for CENP-A nucleosome arrays in the following buffers: low salt (green; 5 mM NaCl), high salt (blue, 150 mM NaCl), no APS (yellow), twofold APS (red), 0.01% Tween-20 (pink), and PCAT2 DNA (brown). (B) The diffusion constants obtained from the MSD curves. The error bars represent the standard error. (C) Schematic representation of mobile or immobile (or paused) single particle trajectories. (D) The single step x-axis displacement of CENP-A nucleosomes in low salt conditions. The blue line represents a single Gaussian fit whereas the red line represents a double Gaussian fit. The latter provided a better fit to all the data for both the x- and y-step distributions for all conditions (see Figure 3—figure supplement 5). (E) The fraction of single steps corresponding to D1 (narrower) Gaussian distribution or D2 (wider) Gaussian distributions from the double Gaussian fitting. The D1 Gaussian distribution corresponds to a smaller diffusion constant and may represent immobile or paused nucleosomes, whereas D2 corresponds to a larger diffusion constant representing mobile nucleosomes. The data were obtained from two independent technical replicates per condition.
-
Figure 3—source data 1
Trajectory statistics for all tracked nucleosomes.
X and Y coordinates, distance between two steps, accumulated distance per trajectory, and angle between two steps are reported.
- https://cdn.elifesciences.org/articles/86709/elife-86709-fig3-data1-v1.zip
-
Figure 3—source data 2
Basic statistics for all tracked nucleosomes.
This includes diffusion constant (nm2·s–1), MSD slope (nm2), average MSD slope (nm2), average step size (nm), maximum R-step (nm), and R-step range (nm).
- https://cdn.elifesciences.org/articles/86709/elife-86709-fig3-data2-v1.zip
Figure 3—figure supplement 1
Impact of salt and APS concentration on step size statistics.
(A) The average mean square displacement (MSD) is shown with standard error as a function of the time interval for all control conditions (low salt = green; high salt = blue; no APS = yellow; 2 x APS = red; 0.01% Tween = pink). (B) The diffusion constants obtained from the MSD curves, with an individual data point for each trajectory. (C) The average single frame step-size for each individual tracked nucleosome (grey points). (D) The maximum R-step for each individually tracked nucleosome per control condition. (E) The R-step range for each individually tracked nucleosome per control condition. Red dots represent the overall mean. The line and bar graphs represent two independent technical replicates per condition. The error bars represent standard error of the mean.
-
Figure 3—figure supplement 1—source data 1
Trajectory statistics for all tracked nucleosomes.
X and Y coordinates, distance between two steps, accumulated distance per trajectory, and angle between two steps are reported.
- https://cdn.elifesciences.org/articles/86709/elife-86709-fig3-figsupp1-data1-v1.zip
-
Figure 3—figure supplement 1—source data 2
Basic statistics for all tracked nucleosomes.
This includes diffusion constant (nm2·s–1), MSD slope (nm2), average MSD slope (nm2), average step size (nm), maximum R-step (nm), and R-step range (nm).
- https://cdn.elifesciences.org/articles/86709/elife-86709-fig3-figsupp1-data2-v1.zip
Figure 3—figure supplement 2
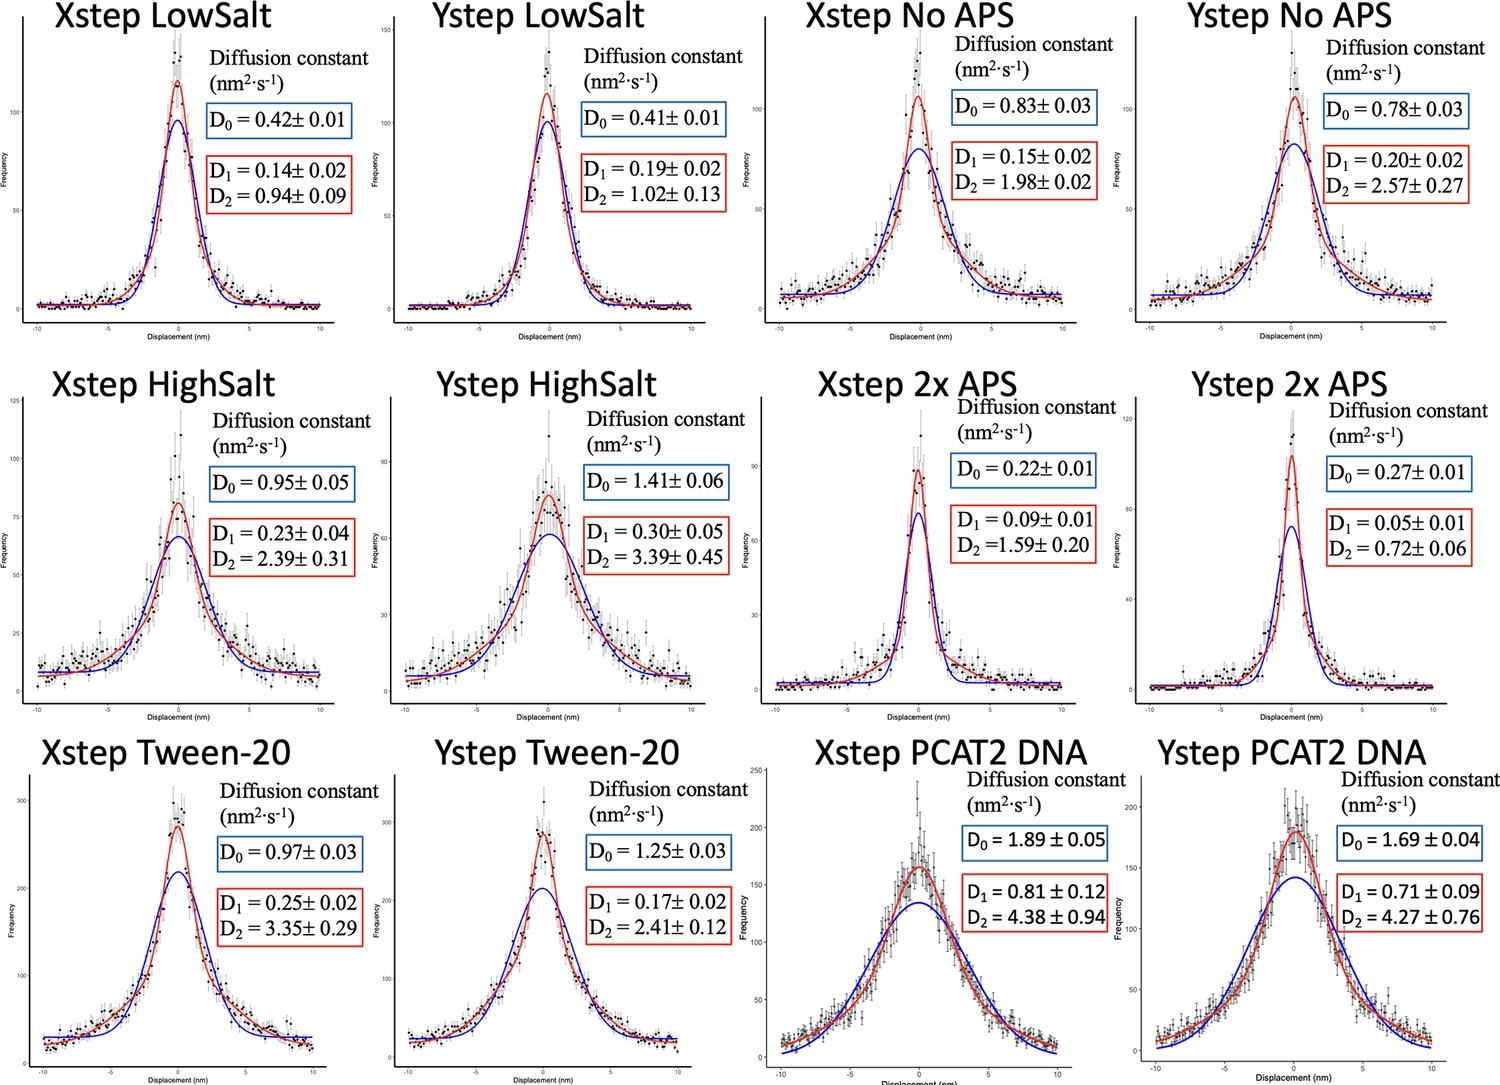
Single (blue line) and double (red line) (sum of two) Gaussian fitting of the x and y step displacement distributions for each of the control conditions.
The double Gaussian distribution best fitted the x and y step displacement for all samples. The diffusion constants derived from the D0, D1, and D2 Gaussian fit are shown, The D2 (larger standard deviation, higher diffusion constant) Gaussian is more prevalent for all conditions except 2 x APS. The data was obtained from two independent technical replicates per condition.
-
Figure 3—figure supplement 2—source data 1
Trajectory statistics for all tracked nucleosomes.
X and Y coordinates, distance between two steps, accumulated distance per trajectory, and angle between two steps are reported.
- https://cdn.elifesciences.org/articles/86709/elife-86709-fig3-figsupp2-data1-v1.zip
-
Figure 3—figure supplement 2—source data 2
Basic statistics for all tracked nucleosomes.
This includes diffusion constant (nm2·s–1), MSD slope (nm2), average MSD slope (nm2), average step size (nm), maximum R-step (nm), and R-step range (nm).
- https://cdn.elifesciences.org/articles/86709/elife-86709-fig3-figsupp2-data2-v1.zip
Figure 3—figure supplement 3
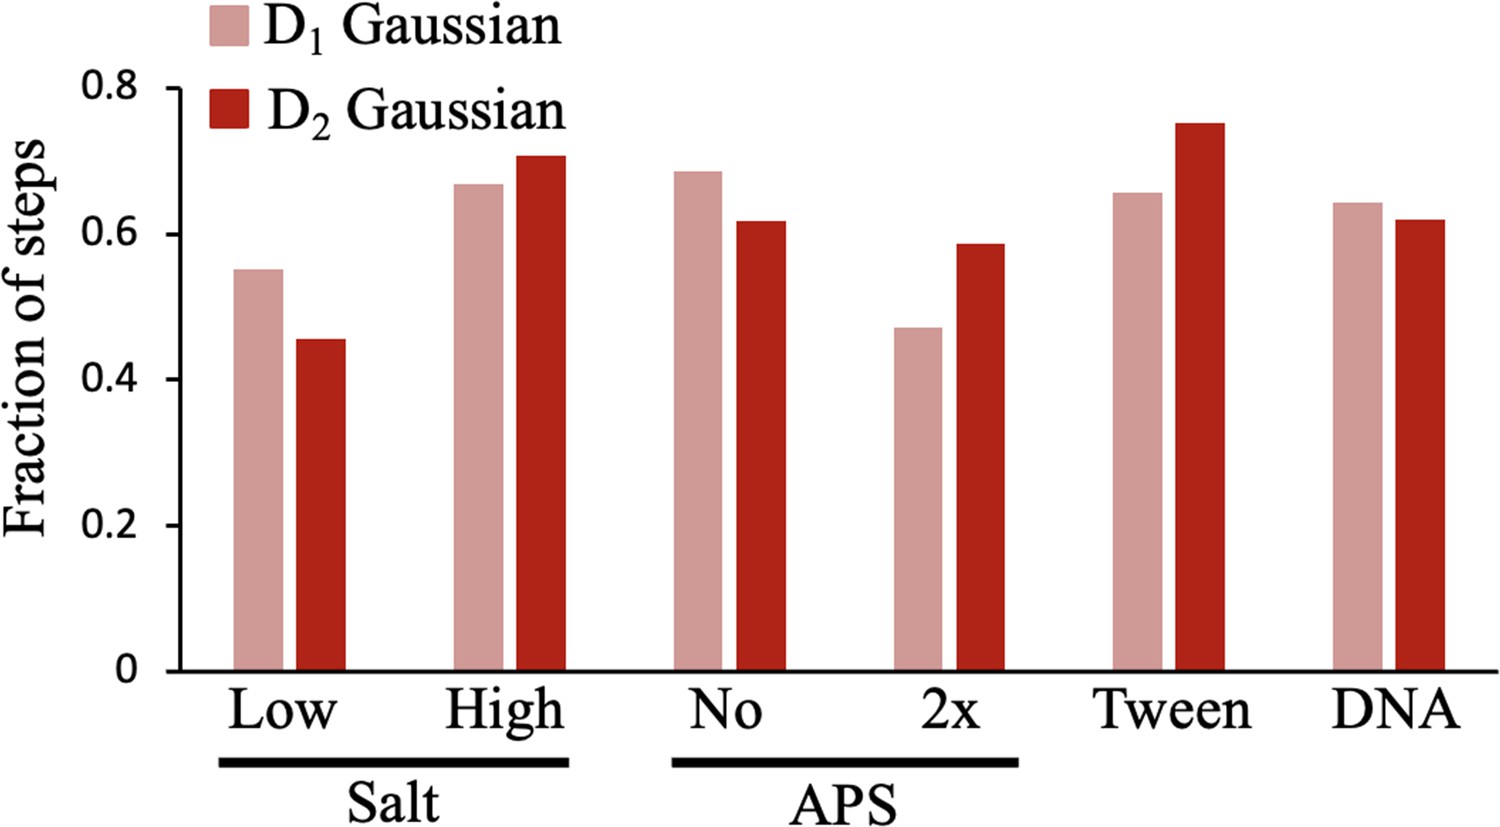
The relative fraction of the D1 and D2 Gaussian fit are shown, where the D2 (larger standard deviation, higher diffusion constant) Gaussian is most prevalent for all conditions except 2 x APS, Tween-20, and high salt.
The data represent at least two independent technical replicates.
Figure 3—figure supplement 4
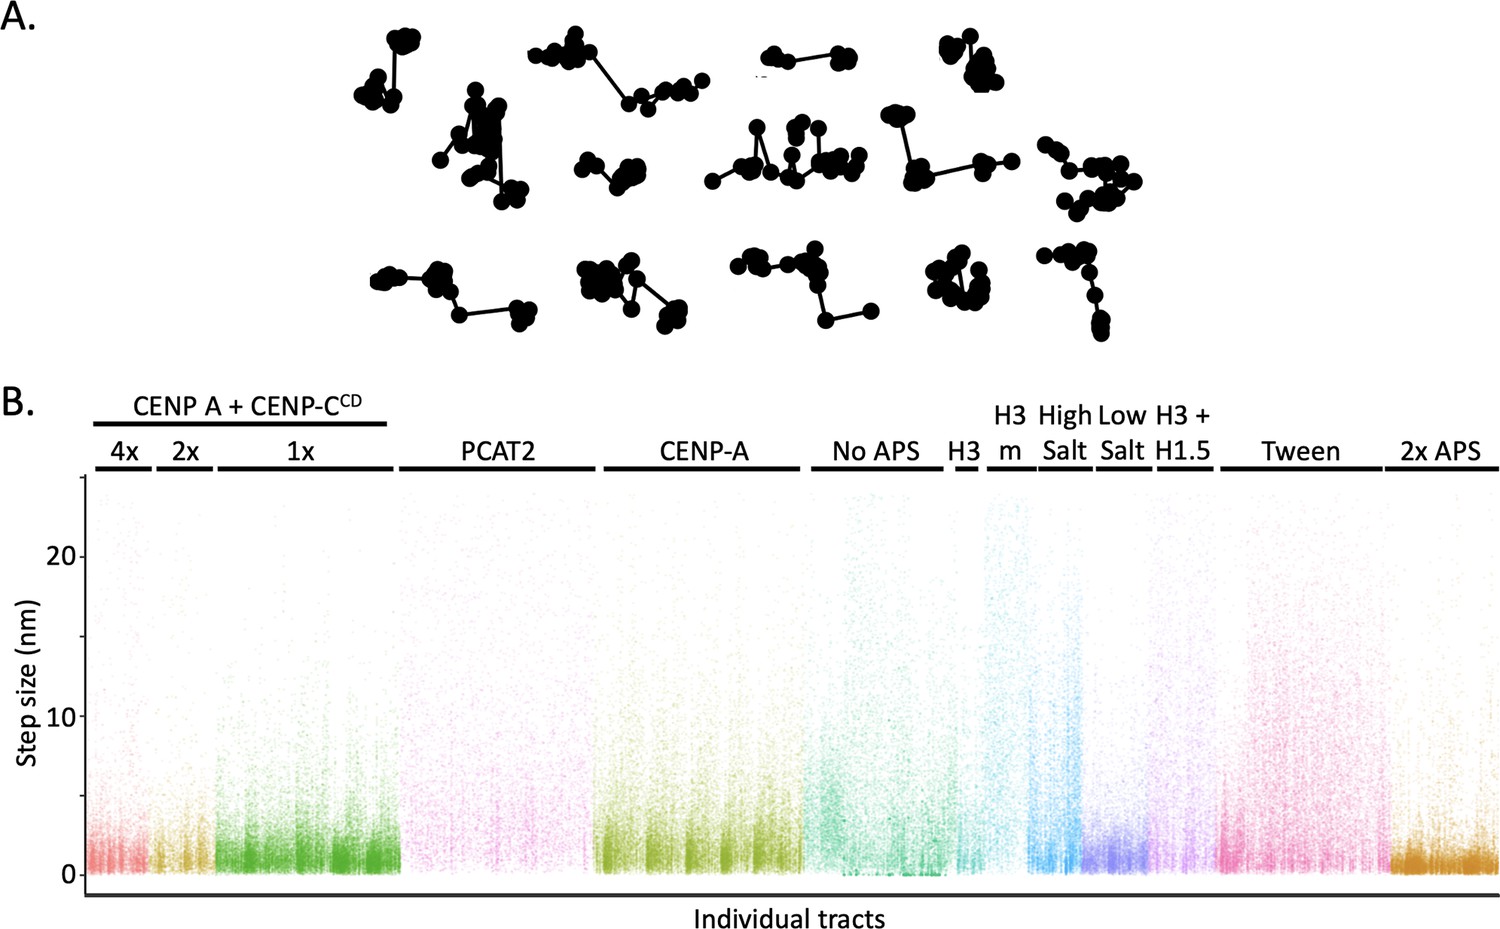
Individual tracts show switching between D1 and D2 diffusion states.
(A) A collage of individual tracts that display transitions from D1 to D2 diffusion states and vica versa. (B) Individual R-steps for each individual tract are displayed, showing how common for individual tracts to have both large R-step sizes (D2) and short R-step sizes (D1). The data represent at least two independent technical replicates.
-
Figure 3—figure supplement 4—source data 1
Trajectory statistics for all tracked nucleosomes.
X and Y coordinates, distance between two steps, accumulated distance per trajectory, and angle between two steps are reported.
- https://cdn.elifesciences.org/articles/86709/elife-86709-fig3-figsupp4-data1-v1.zip
Figure 3—figure supplement 5
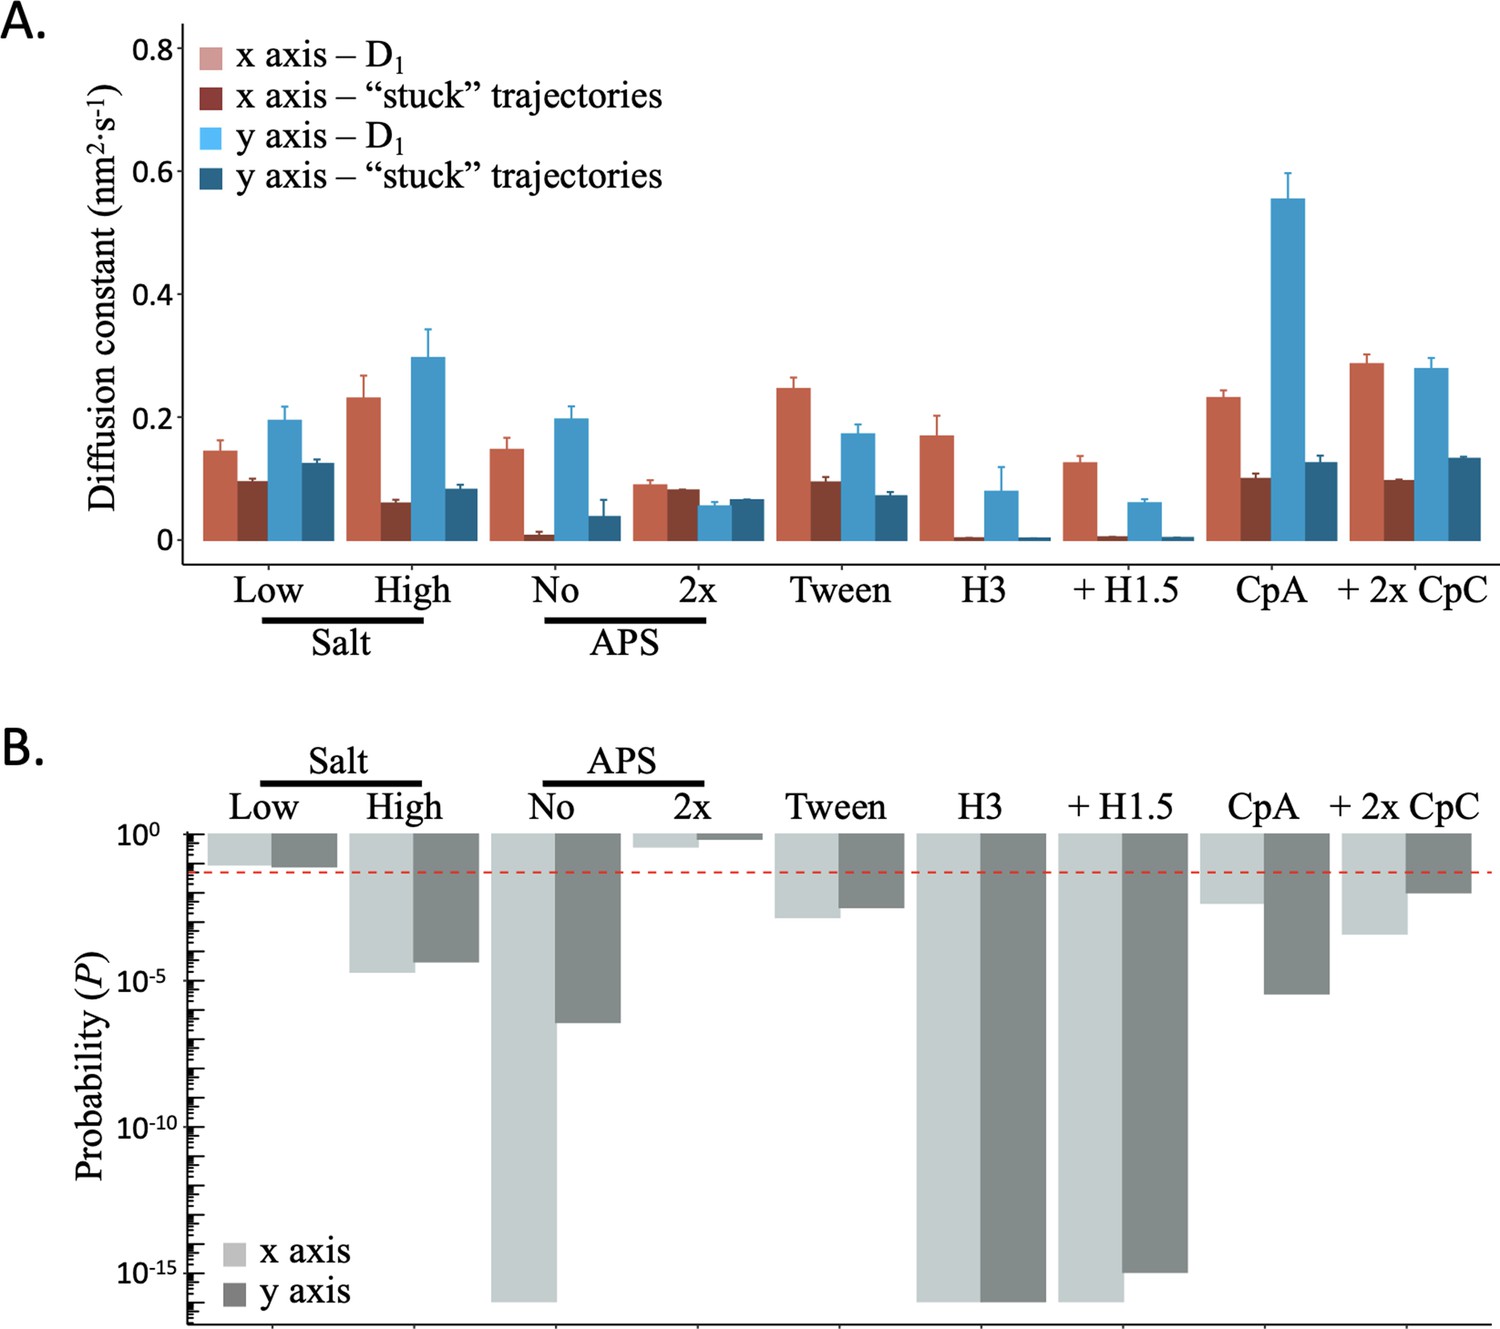
Lower D1 diffusion state and rejected “stuck” particles have different diffusion constants.
(A) The relative diffusion constants for the x- and y-axis of “stuck” particles are compared to that of the D1 diffusion constants for 9 of the 13 tested conditions. (B) To assess whether they significantly differed or not, we performed the F-test and found that only the 2 x APS and Low Salt conditions did not significantly differ. For all other conditions, we found significant differences (dashed red line marks p=0.05), lending no support for the hypothesis that the lower D1 diffusion constant represents ‘stuck’ nucleosomes. The data represent at least two independent technical replicates.
-
Figure 3—figure supplement 5—source data 1
Basic statistics for the rejected ‘stuck’ trajectories, represented in Figure 3—figure supplement 5.
- https://cdn.elifesciences.org/articles/86709/elife-86709-fig3-figsupp5-data1-v1.zip
Figure 3—figure supplement 6
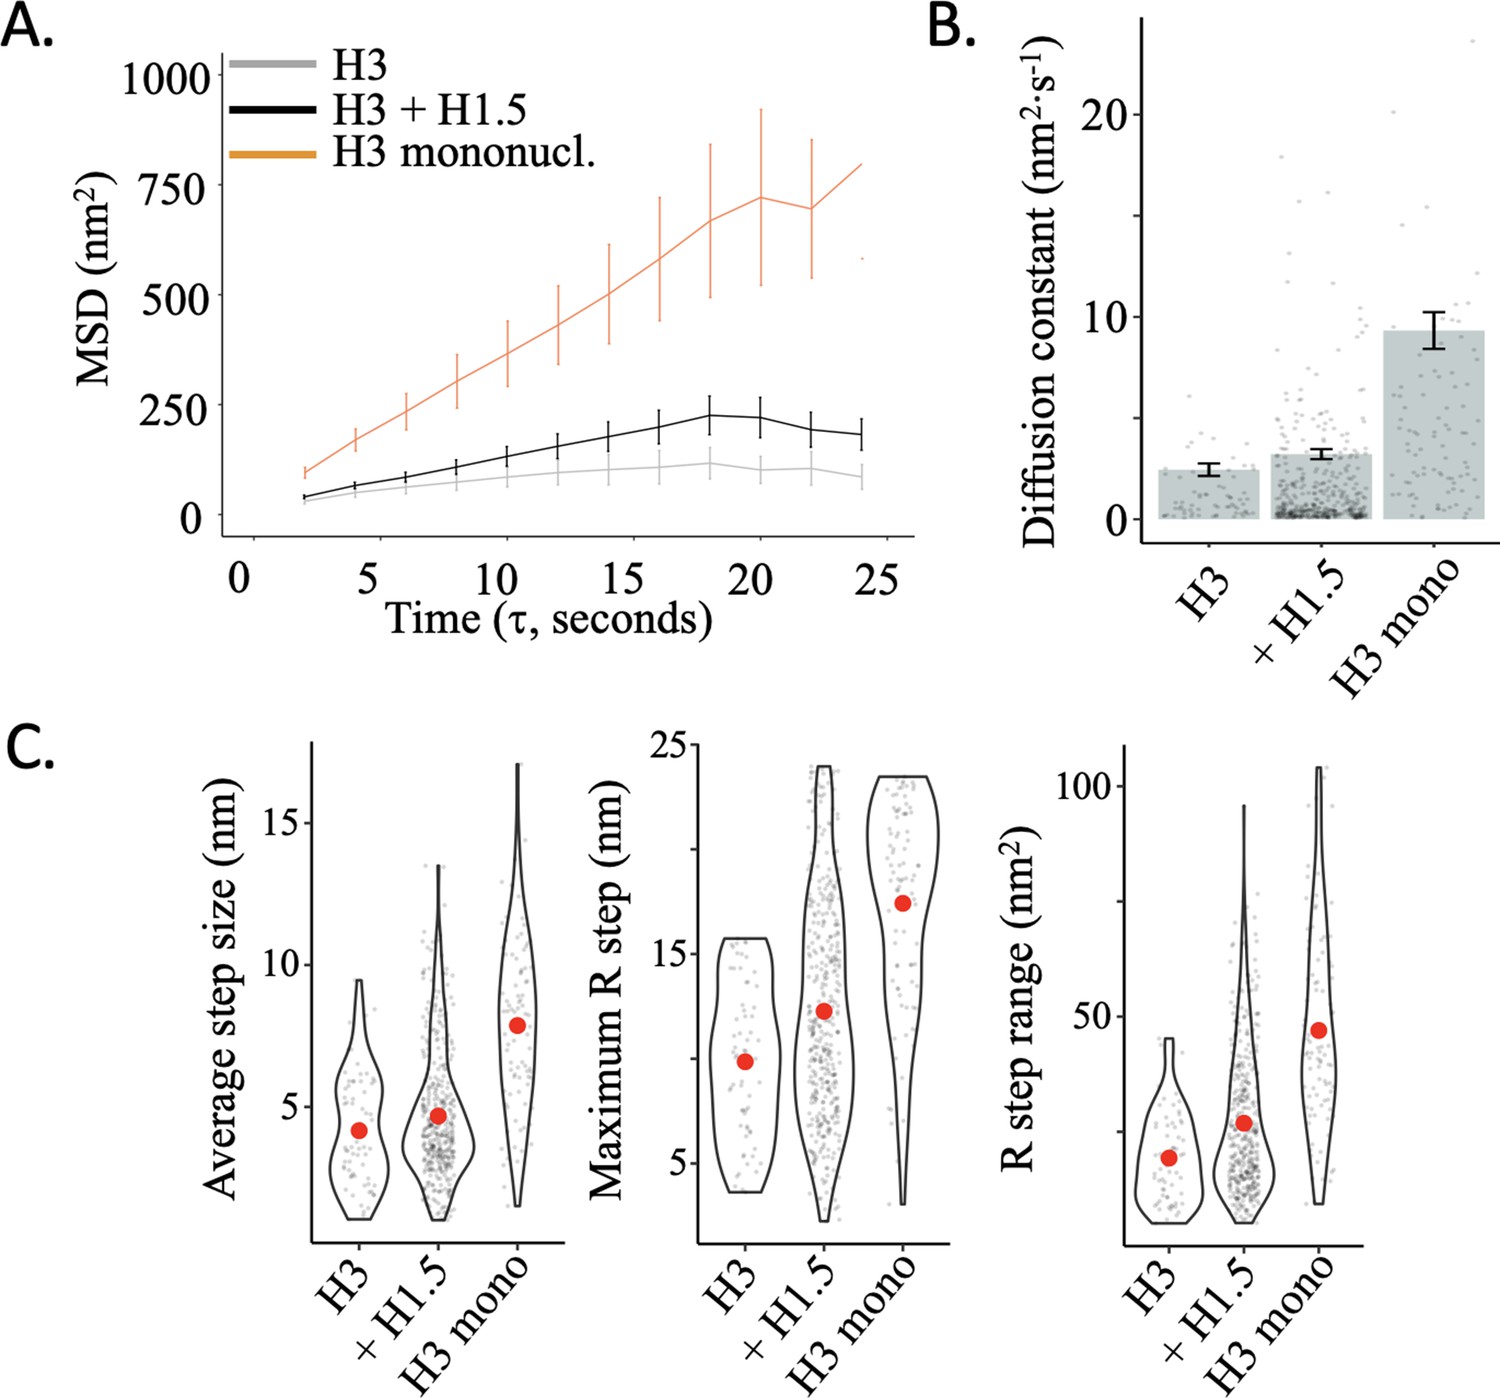
Diffusion constant of H3 mononucleosomes higher than H3 nucleosomes within an array.
(A) The average (MSD) is shown with standard error as a function of the time interval for H3 chromatin (grey) alone or with linker histone H1.5 (black) (videos from Melters and Dalal, 2021 JMB) and H3 mononucleosomes (orange). (B) Diffusion constants obtained from the MSD curves, with individual data points for each trajectory. The error bars represent standard error of the mean. (C) The average single frame R-step size for each individual tracked nucleosome. The maximum R-step for each individually tracked nucleosome. The R-step range for each individually tracked nucleosome. Red dots represent the overall mean. The line and bar graphs represent at least two independent technical replicates.
-
Figure 3—figure supplement 6—source data 1
Trajectory statistics for all tracked nucleosomes.
X and Y coordinates, distance between two steps, accumulated distance per trajectory, and angle between two steps are reported.
- https://cdn.elifesciences.org/articles/86709/elife-86709-fig3-figsupp6-data1-v1.zip
Figure 3—figure supplement 7
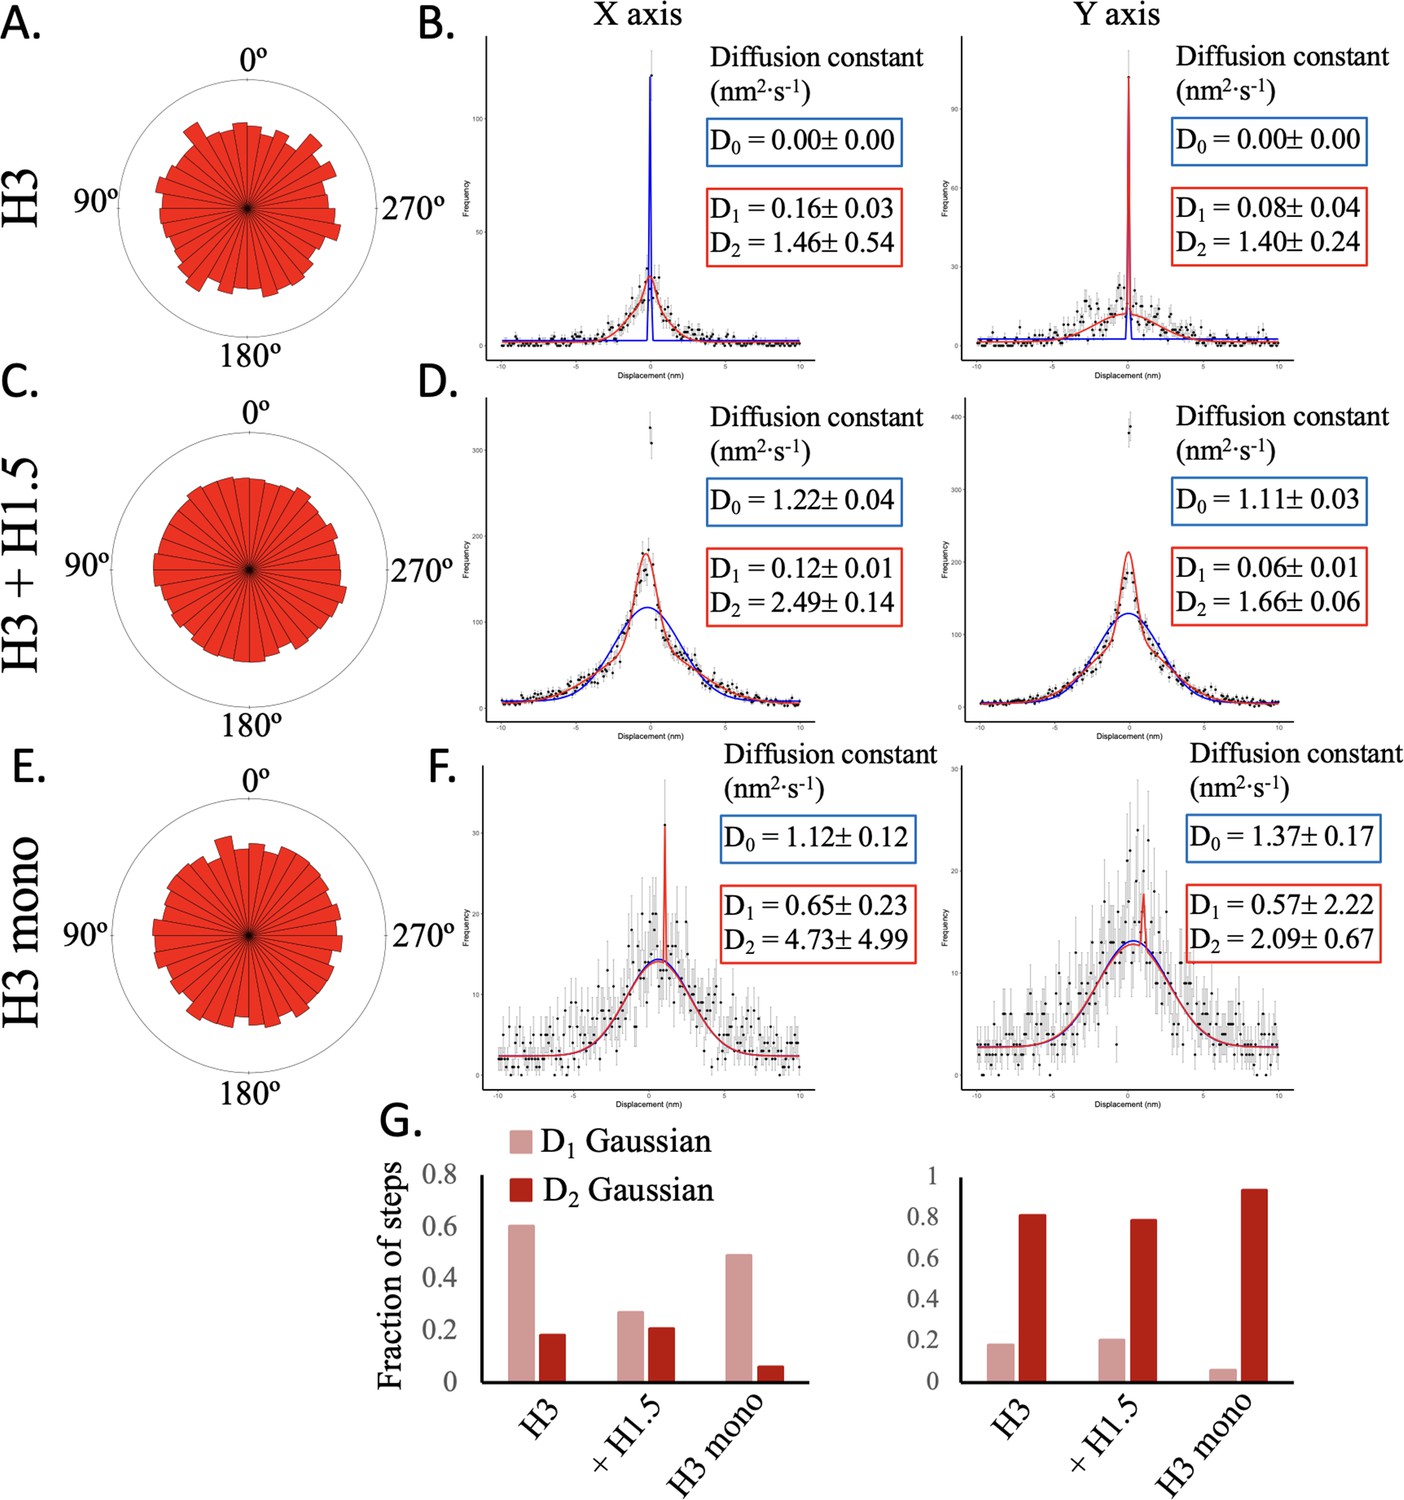
Single step distribution fit by single Gaussian for H3 mononucleosomes.
(A) The distribution of the angle between successive steps for H3 chromatin. (B) The single (blue line) and double (red line) Gaussian fitting of the x and y step displacements for H3 chromatin are shown. The double Gaussian distribution provided the best fit to the x step displacement but not the y step displacement distributions. The sharp peak represents stuck or immobile particles. (C) The distribution of the angle between successive steps for H3 chromatin. (D) The single and double Gaussian fitting of the x and y step displacement for H3 chromatin with H1.5 (added at 0.2 ratio H1 to H3 nucleosome) are shown. The double Gaussian distribution best fitted the x and y step displacement distributions. (E) The distribution of the angle between successive steps for H3 chromatin. (F) The single and double Gaussian fitting of the x and y step displacement for H3 mononucleosomes are shown. The single Gaussian outperformed the double Gaussian fitting. The sharp peak off center is indicative of an artifact. (G) Fraction of D1 and D2 Gaussian fitting for all three samples. The left graph shows the fractions for the x step displacement analysis and the right graph for the y step displacement analysis. The data represent at least two independent technical replicates.
-
Figure 3—figure supplement 7—source data 1
Basic statistics for all tracked nucleosomes.
This includes diffusion constant (nm2 ·s-1), MSD slope (nm2 ), average MSD slope (nm2), average step size (nm), maximum R-step (nm), and R-step range (nm).
- https://cdn.elifesciences.org/articles/86709/elife-86709-fig3-figsupp7-data1-v1.zip
Figure 3—figure supplement 8
Schematic summary of the controls for HS-AFM quantitative single particle analysis.
Videos were corrected for drift. No tip-induced artifacts were observed. Low salt and 2 x APS resulted in less mobile chromatin, whereas high salt, no APS, and Tween-20 conditions resulted in more mobile chromatin. H3 mononucleosomes were mobile without the constraints of being part of a polymer, where the single step displacement distribution fits well with a single Gaussian fitting. This implies that mononucleosomes move as particles independent of 1-D nucleosome sliding.
Figure 3—video 1
HS-AFM video of in vitro reconstituted CENP-A chromatin in 5 mM NaCl containing buffer (low salt; speed =2 x).
Figure 3—video 2
HS-AFM video of in vitro reconstituted CENP-A chromatin in 150 mM NaCl containing buffer (high salt; speed =2 x).
Figure 3—video 3
HS-AFM video of in vitro reconstituted CENP-A chromatin imaged without functionalized mica (no APS; speed =2 x).
Figure 3—video 4
HS-AFM video of in vitro reconstituted CENP-A chromatin imaged with double the amount of APS to functionalize mica (2 x APS; speed =2 x).
Figure 3—video 5
HS-AFM video of in vitro reconstituted CENP-A chromatin imaged with physiological buffer +0.01% Tween (Tween; speed =2 x).
Figure 3—video 6
HS-AFM video of in vitro reconstituted CENP-A chromatin on PCAT2 plasmid imaged with physiological buffer (DNA; speed =2 x).
Figure 3—video 7
HS-AFM video of in vitro reconstituted H3 chromatin (speed =2 x).
Figure 3—video 8
HS-AFM video of in vitro reconstituted H3 chromatin with H1.5, where H1.5 is added at a 0.2 molar ratio to H3 nucleosomes (speed =2 x).
Figure 3—video 9
HS-AFM video of in vitro reconstituted H3 mononucleosomes (speed =2 x).
Figure 4 with 7 supplements

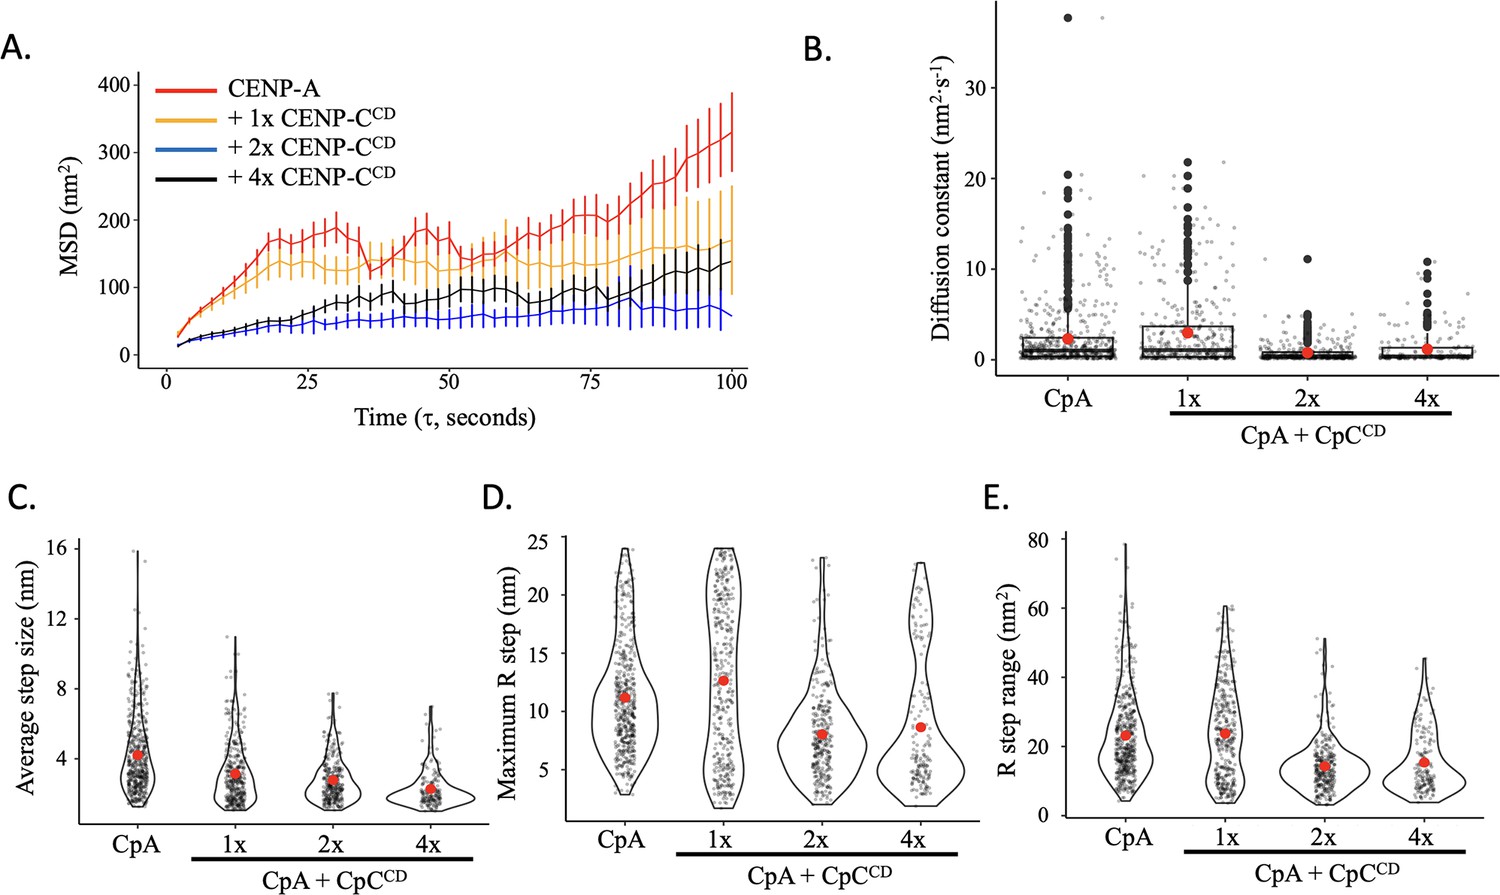
CENP-CCD restrict CENP-A nucleosome mobility in vitro (A) Schematic representation of human CENP-C (943 amino acids: CENP-C, NCBI Gene ID: 1060).
The central domain of CENP-C (CENP-CCD), which directly binds to CENP-A nucleosomes, was added at a ratio of 1, 2, or 4 fragments per CENP-A nucleosome (1 x, 2 x, or 4 x CENP-CCD, respectively). (B) CENP-A nucleosome arrays were tracked in fluid for up to 120 s by HS-AFM at 1 frame every 2 s. A representative still frame is shown as well as the trajectories over time. (C) CENP-A nucleosome arrays were tracked in the presence of 1 x, 2 x, or 4 x CENP-CCD. A representative still frame is shown as well as the trajectories over time. (D) The average mean square displacement is shown with standard error as a function of the time interval. CENP-A nucleosomes alone are in red. CENP-A nucleosomes with 1 x CENP-CCD is in yellow, 2 x CENP-CCD is in blue, and 4 x CENP-CCD is in black. (E) The diffusion constants obtained from the MSD curves. The line and bar graphs represent three independent technical replicates. The error bars represent the standard error.
-
Figure 4—source data 1
Trajectory statistics for all tracked nucleosomes.
X and Y coordinates, distance between two steps, accumulated distance per trajectory, and angle between two steps are reported.
- https://cdn.elifesciences.org/articles/86709/elife-86709-fig4-data1-v1.zip
-
Figure 4—source data 2
Basic statistics for all tracked nucleosomes.
This includes diffusion constant (nm2·s–1), MSD slope (nm2), average MSD slope (nm2), average step size (nm), maximum R-step (nm), and R-step range (nm).
- https://cdn.elifesciences.org/articles/86709/elife-86709-fig4-data2-v1.zip
Figure 4—figure supplement 1
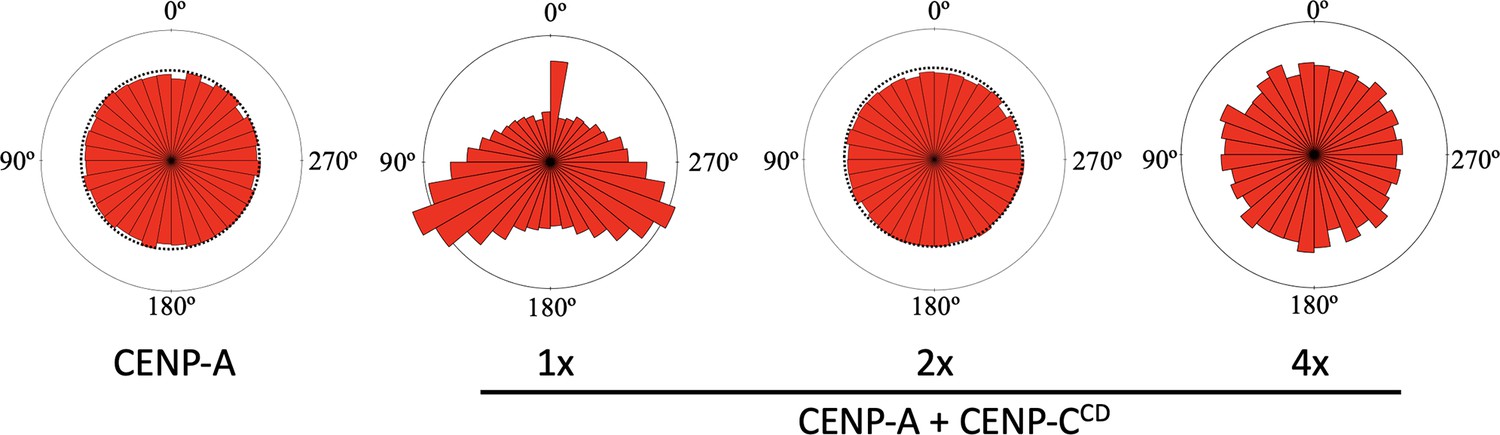
The distribution of the angle between successive nucleosome positions for CENP-A chromatin alone or in the presence of 1 x, 2 x, or 4 x CENP-CCD.
Only for the 1 x CENP-CCD condition, we observed minor bias in angles. For all other tested conditions, we found random angle distributions. The data represent at least three independent technical replicates for each condition.
Figure 4—figure supplement 2
CENP-CCD restricts step size of CENP-A nucleosomes.
(A) The average mean square displacement (MSD) is shown with standard error as a function of the time interval for all CENP-A chromatin (red) and CENP-A chromatin with CENP-CCD (blue, 2.2 molar excess to CENP-A nucleosomes). (B) The diffusion constants obtained from the MSD curves, with individual data points for each trajectory shown as grey points. Error bars represent standard error of the mean. (C) The average single frame R-step-size for each individual tracked nucleosome (grey points). (D) The maximum R-step for each individually tracked nucleosome. (E) The R-step range for each individually tracked nucleosome. Red dots represent the overall mean. The line and bar graphs represent at least three independent technical replicates.
-
Figure 4—figure supplement 2—source data 1
Trajectory statistics for all tracked nucleosomes.
X and Y coordinates, distance between two steps, accumulated distance per trajectory, and angle between two steps are reported.
- https://cdn.elifesciences.org/articles/86709/elife-86709-fig4-figsupp2-data1-v1.zip
-
Figure 4—figure supplement 2—source data 2
Basic statistics for all tracked nucleosomes.
This includes diffusion constant (nm2 ·s-1), MSD slope (nm2 ), average MSD slope (nm2), average step size (nm), maximum R-step (nm), and R- step range (nm).
- https://cdn.elifesciences.org/articles/86709/elife-86709-fig4-figsupp2-data2-v1.zip
Figure 4—figure supplement 3
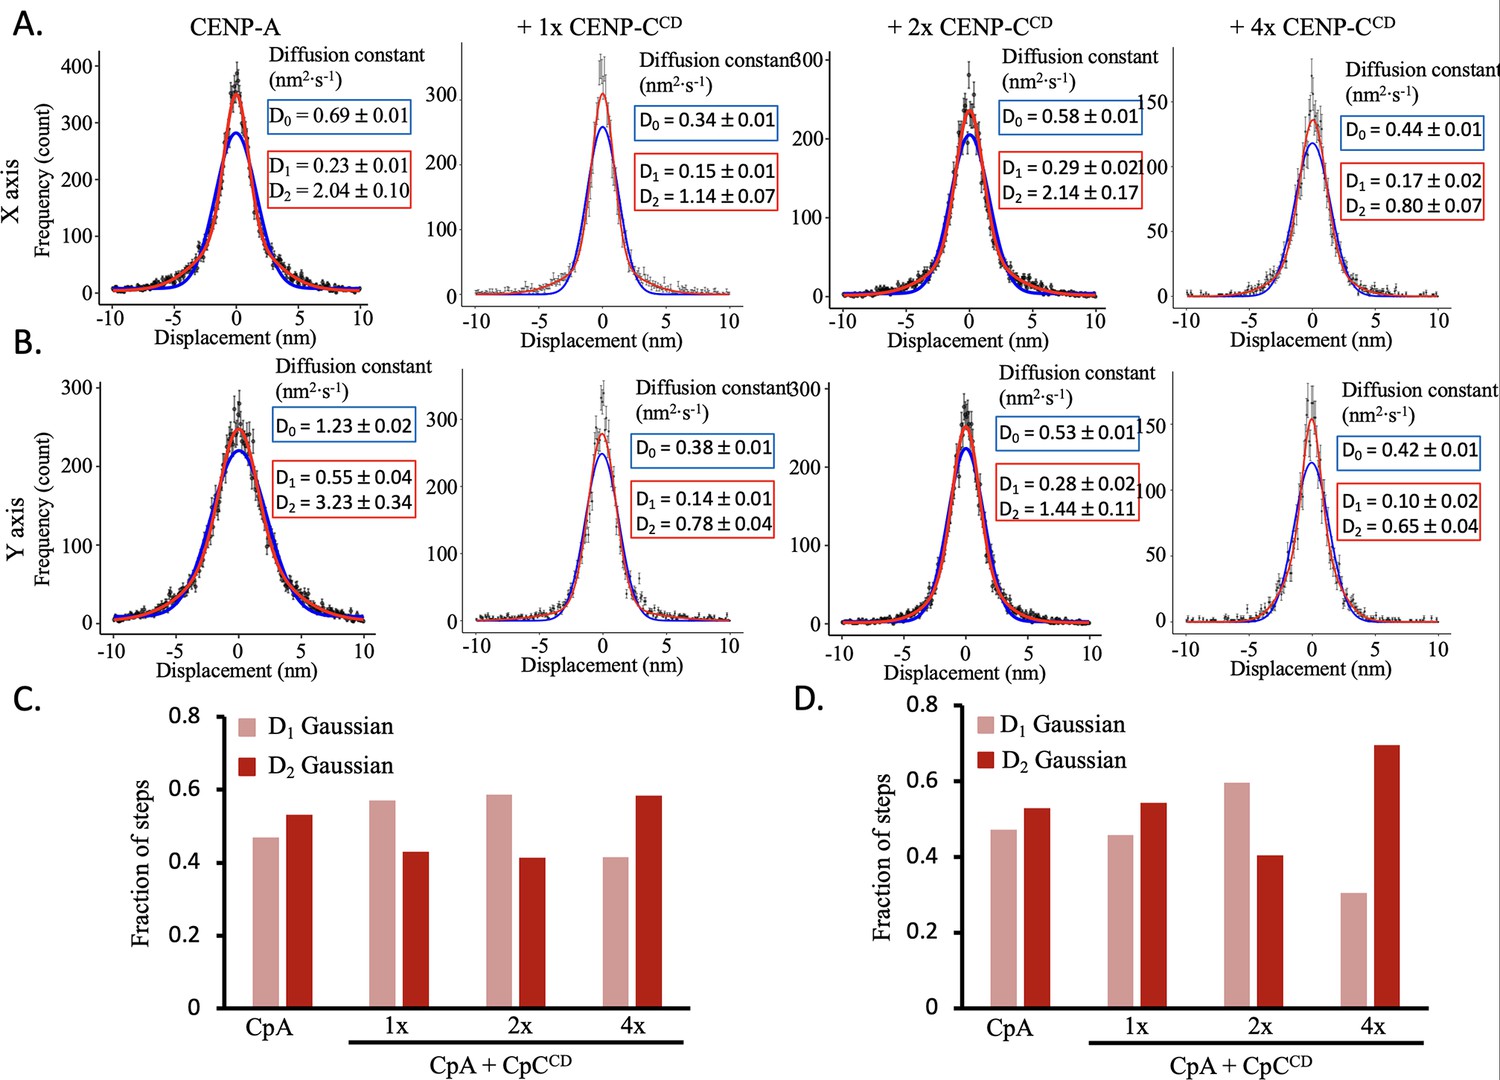
CENP-CCD does not impact double Gaussian of single step distribution of CENP-A nucleosomes.
(A) The single (blue line) and double (red line) Gaussian fitting of the x step displacements for CENP-A chromatin +/-CENP CCD. (B) The single (blue line) and double (red line) Gaussian fitting of the y step displacements for CENP-A chromatin +/-CENP CCD. (C) The double Gaussian distribution best fit the x step displacement for both samples. The fraction of D1 and D2 Gaussians are shown, where the D2 Gaussian is most prevalent in most conditions except 1 x and 2 x CENP-CCD. (D) The double Gaussian distribution best fit the y step displacement for both samples. The fraction of D1 and D2 Gaussians are shown, where the D2 Gaussian is most prevalent in most conditions except 2 x APS. The data represent at least three independent technical replicates.
-
Figure 4—figure supplement 3—source data 1
Trajectory statistics for all tracked nucleosomes.
X and Y coordinates, distance between two steps, accumulated distance per trajectory, and angle between two steps are reported.
- https://cdn.elifesciences.org/articles/86709/elife-86709-fig4-figsupp3-data1-v1.zip
-
Figure 4—figure supplement 3—source data 2
Basic statistics for all tracked nucleosomes.
This includes diffusion constant (nm2·s–1), MSD slope (nm2), average MSD slope (nm2), average step size (nm), maximum R-step (nm), and R-step range (nm).
- https://cdn.elifesciences.org/articles/86709/elife-86709-fig4-figsupp3-data2-v1.zip
Figure 4—video 1
HS-AFM video of in vitro reconstituted CENP-A chromatin (speed =2 x).
Figure 4—video 2
HS-AFM video of in vitro reconstituted CENP-A chromatin with CENP-CCD where CENP-CCD is added at a 1 x molar ratio to CENP-A nucleosomes (speed =2 x).
Figure 4—video 3
HS-AFM video of in vitro reconstituted CENP-A chromatin with CENP-CCD where CENP-CCD is added at a 2 x molar ratio to CENP-A nucleosomes (speed =2 x).
Figure 4—video 4
HS-AFM video of in vitro reconstituted CENP-A chromatin with CENP-CCD where CENP-CCD is added at a 4 x molar ratio to CENP-A nucleosomes (speed =2 x).
Figure 5 with 1 supplement

CENP-C overexpression suppressed α-satellite expression and centromeric RNAP2 occupancy.
(A) Quantification of RNAP2 levels pulled down with either CENP-C or sequential ACA nChIP. (B) Quantification of CENP-A levels that pulled down with either CENP-C or sequential ACA nChIP. (C) Quantification of consensus α-satellite transcription in mock-transfected (WT) and CENP-C overexpression (CENP-COE) (two-sided t-test; significance was determined at p<0.05). The bar graphs represent three independent technical replicates, and the error bars represent standard deviations.
-
Figure 5—source data 1
Quantification of RT-PCR of α-satellite transcripts for Figure 5C.
- https://cdn.elifesciences.org/articles/86709/elife-86709-fig5-data1-v1.zip
Figure 5—figure supplement 1
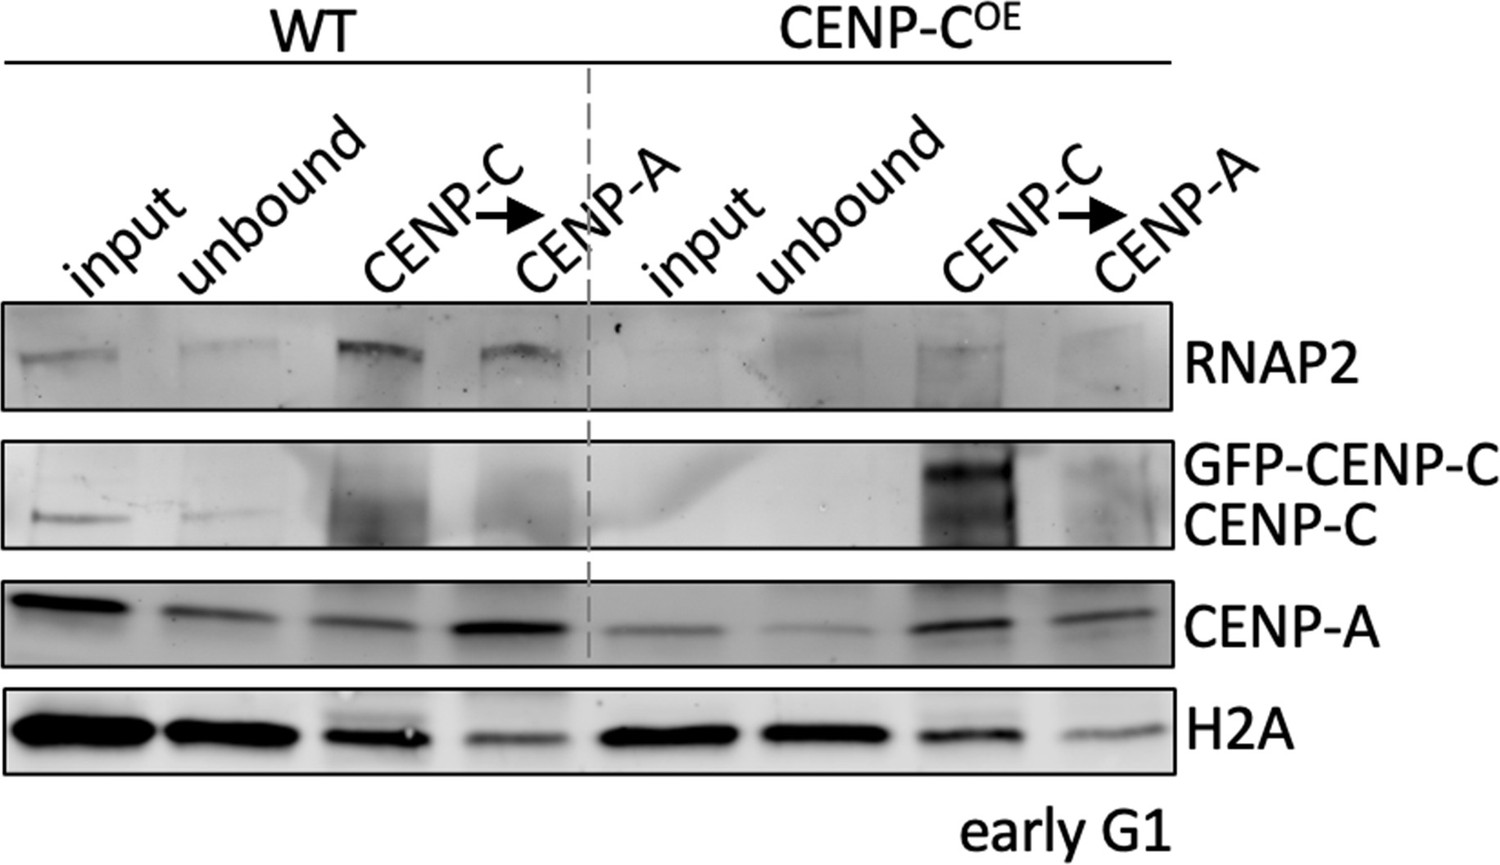
Representative western blot quantifying RNAP2 and CENP-A levels.
HeLa cells were transfected with an empty vector (WT) or overexpressing CENP-C (CENP-COE) and synchronized to early G1, when centromeric transcription is at its highest, similar to what we reported earlier (Melters et al., 2019 PNAS). We probed for RNAP2, CENP-C, and CENP-A. The western blot is a representative blot of three independent technical replicates with representative original blots shown below.
-
Figure 5—figure supplement 1—source data 1
Entire western blot as shown in Figure 5 – figure supplement 1.
- https://cdn.elifesciences.org/articles/86709/elife-86709-fig5-figsupp1-data1-v1.zip
-
Figure 5—figure supplement 1—source data 2
Quantification of ChIP-western blot for Figures 5A, B.
- https://cdn.elifesciences.org/articles/86709/elife-86709-fig5-figsupp1-data2-v1.zip
Figure 6 with 1 supplement

New CENP-A loading impaired upon CENP-C overexpression.
(A) Schematic of experimental design. (B) Colocalized immunofluorescent signals for CENP-A and TMR-Star are collected and the intensity of both foci is measured as well as the background neighboring the foci to determine the ratio of the TMR-star signal over total CENP-A signal. (C) De novo CENP-A incorporation was assessed by quench pulse-chase immunofluorescence. After old CENP-A was quenched with TMR-block, newly loaded CENP-A was stained with TMR-Star and foci intensity was measured over total CENP-A foci intensity. Inset is a ×2 magnification of the dotted box in each respective image. (D) Quantification of de novo CENP-A loading by measuring the ratio of TMR-Star signal over total CENP-A signal (one-way ANOVA; significance was determined at p<0.05, n=number of cells analyzed). The box plots represent three independent technical replicates.
Figure 6—figure supplement 1

Quantification of de novo CENP-A loading by measuring the ratio of TMR-Star signal over total CENP-A signal as shown in Figure 6C with individual data points.
The box plots represent three independent technical replicates.
-
Figure 6—figure supplement 1—source data 1
Quantification of de novo CENP-A loading by measuring background corrected foci intensity for WT and CENP-C overexpressed cells.
- https://cdn.elifesciences.org/articles/86709/elife-86709-fig6-figsupp1-data1-v1.zip
Figure 7

Clutch model for CENP-C restricted motion of CENP-A chromatin.
Under wildtype conditions, we propose that CENP-A chromatin not bound by CENP-C (yellow box) forms a chromatin clutch and is readily accessible to the transcriptional machinery, because of the intrinsic material properties of CENP-A nucleosomes. In contrast, when CENP-C or CENP-C complexes bind CENP-A nucleosomes, a unique clutch of CENP-A chromatin is formed restricting sliding of CENP-A nucleosomes. This coincides with CENP-CCD altering the material properties, and quenching the mobility, of CENP-A chromatin. Less mobile CENP-A nucleosomes restrict progression of the transcriptional machinery and subsequent loading of new CENP-A molecules.
Author response image 1
Author response image 2

An example of a failed in vitro reconstitution imaged by conventional in air AFM, where only a few nucleosomes (red arrow) are formed.
CENP-A/H4 tetramers (green arrow) can be easily distinguished from H2A/H2B dimers (pink arrows). In all cases, a nucleosome is much larger in diameter and height than either CENP-A/H4 tetramer or H2A/H2B dimers.
Author response image 3

A side-by-side comparison of the same region that was imaged at two different resolutions and consequently, speeds.
The left image was scanned at the maximum resolution of 744 x 1024 lines & points at 1 frame per 4 seconds. The right image was scanned at 512 x 256 lines & points at 1 frame per second.
Tables
Table 1
Quantifications of HS-AFM videos.
Either CENP-A or H3 nucleosomes were in vitro reconstituted on plasmid DNA and imaged in fluid in the presence or absence of either 2.2-fold excess CENP-CCD or 0.2-fold excess of H1.5. n, number of nucleosome trajectories tracked. For each condition, at least three independent replicates were performed.
| Sample | n | Number of steps | Average Diffusion constant (nm2/s) | Average step size (nm) | Maximum R-step (nm) | R-step range (nm2) |
|---|---|---|---|---|---|---|
| CENP-A nucleosomes | 498 | 13,989 | 2.3±0.2 | 4.2±0.1 | 11.2±0.2 | 23.2±0.6 |
| +1 x CENP-CCD | 368 | 7790 | 2.1±0.1 | 3.1±0.2 | 12.6±0.4 | 23.7±0.7 |
| +2 x CENP-CCD | 310 | 9063 | 0.78±0.06 | 2.8±0.1 | 8.0±0.2 | 14.3±0.4 |
| +4 x CENP-CCD | 166 | 7034 | 0.61±0.05 | 2.3±0.2 | 8.6±0.4 | 15.4±0.7 |
| CENP-A controls | ||||||
| Low salt | 124 | 3783 | 1.2±0.2 | 2.8±0.1 | 9.6±0.4 | 18.3±0.9 |
| High salt | 161 | 4887 | 4.1±0.3 | 5.5±0.2 | 14.6±0.4 | 40±2 |
| No APS | 244 | 5186 | 7.5±0.5 | 6.0±2.0 | 15.9±0.4 | 43±2 |
| 2 x APS | 120 | 2520 | 2.5±0.3 | 3.8±0.2 | 11.4±0.5 | 21±1 |
| Tween-20 | 587 | 16,126 | 5.9±0.2 | 6.0±0.1 | 14.7±0.2 | 43±1 |
| PCAT2 DNA | 710 | 15,497 | 5.7±0.4 | 5.8±0.2 | 16.0±0.2 | 33.7±0.6 |
| H3 controls | ||||||
| H3 nucleosomes | 66 | 1109 | 2.5±0.3 | 4.2±0.2 | 9.9±0.5 | 19±1 |
| +H1.5 | 391 | 8492 | 3.2±0.3 | 4.7±0.1 | 12.3±0.3 | 26.9±0.8 |
| H3 mononucleosome | 90 | 1344 | 9.3±0.9 | 7.9±0.3 | 17.4±0.5 | 47±2 |
Key resources table
| Reagent type (species) or resource | Designation | Source or reference | Identifiers | Additional information |
|---|---|---|---|---|
| Cell line (Homo sapiens) | HeLa (cervical carcinoma, Adult) | ATCC | CCL-2 | |
| Antibody | Anti-CENP-A (Mouse monoclonal) | Abcam | Cat. #: ab13939, RRID: AB_300766 | IF(1:1000) |
| Antibody | Anti-CENP-A (rabbit monoclonal) | Abcam | Cat. #: ab45694 | WB (1:3000) |
| Antibody | Anti-CENP-C (guinea pig polyclonal) | MBL International | Cat. #: PD030, RRID: AB_10693556 | nChIP (5 µL), WB (1:1000) |
| Antibody | Anti-CENP-C (rabbit polyclonal) | Santa Cruz | Cat. #: sc-22789 | WB (1:500) |
| Antibody | Anti-H2A (rabbit polyclonal) | Abcam | Cat. #: ab18255, RRID: AB_470265 | WB (1:1000) |
| Antibody | Anti-CENP-A (rabit polyclonal) | This paper | nChIP (3 µL per test) | |
| Antibody | ACA serum (human, polyclonal) | BBI Solutions | SG140-2 | nChIP (5 µL per test) |
| Recombinant DNA reagent | GFP-CENP-C (plasmid) | Gift from Stephan Diekmann | pGFP-CENP-C (KAN) | |
| Recombinant DNA reagent | SNAP-CENP-A (plasmid) | This paper | SNAP version of pCh-C-CENP-A (AMP) | |
| Recombinant DNA reagent | PCAT2 (plasmid) | Arunkumar et al., 2022 | ||
| Recombinant DNA reagent | 4 x α-satellite (plasmid) | Quénet and Dalal, 2014 | ||
| Sequence-based reagent | Centromeric α-satellite_F | Quénet and Dalal, 2014 | PCR primers | CATCACAAAGAAGTTTCTGAGAATGCTTC |
| Sequence-based reagent | Centromeric α-satellite_R | Quénet and Dalal, 2014 | PCR primers | TGCATTCAACTCACAGAGTTGAACCTTCC |
| Sequence-based reagent | GAPDH_F | Quénet and Dalal, 2014 | PCR primers | GCGGTTCCGCACATCCCGGTAT |
| Sequence-based reagent | GAPDH_R | Quénet and Dalal, 2014 | PCR primers | CCCCACGTCGCAGCTTGCCTA |
| Peptide, recombinant protein | CENP-A/H4 tetramer | EpiCypher | Cat. #: 16–010 | |
| Peptide, recombinant protein | H2A/H2B dimer | EpiCypher | Cat. #: 15–0311 | |
| Peptide, recombinant protein | H3/H4 tetramer | EpiCypher | Cat. #: 16–0008 | |
| Commercial assay or kit | TMR-Block | New England Biolabs | Cat. #: S9106S | |
| Commercial assay or kit | TMR-Star | New England Biolabs | Cat. #: S9105S | |
| Commercial assay or kit | NeonTM Transfection System 100 µL kit | ThermoFisher Scientific | Cat. #: MPK10025 | |
| Software, algorithm | R | https://www.r-project.org/ | RRID:SCR_002865 | |
| Software, algorithm | Gwyddion | http://gwyddion.net/ | RRID: SCR_015583 | |
| Software, algorithm | NIH ImageJ | https://imagej.net/software/fiji/ | RRID: SCR_003070 | |
| Software, algorithm | ggplot2 | https://cran.r-project.org/web/packages/ggplot2/index.html | RRID: SCR_014601 | |
| Software, algorithm | CRaQ | http://facilities.igc.gulbenkian.pt/microscopy/microscopy-macros.php | ||
| Software, algorithm | Adobe Photostop | https://www.adobe.com/products/photoshop.html | RRID: SCR_014199 | |
| Software, algorithm | MATLAB | https://www.mathworks.com/products/matlab.html | RRID: SCR_001622 | |
| Software, algorithm | MatLabTrack | https://sourceforge.net/projects/single-molecule-tracking/ | ||
| Other | Vectashield with DAPI | Vector Laboratories | H-1200 | Stain nuclei |
Additional files
Download links
A two-part list of links to download the article, or parts of the article, in various formats.
Downloads (link to download the article as PDF)
Open citations (links to open the citations from this article in various online reference manager services)
Cite this article (links to download the citations from this article in formats compatible with various reference manager tools)
Single molecule analysis of CENP-A chromatin by high-speed atomic force microscopy
eLife 12:e86709.
https://doi.org/10.7554/eLife.86709


