Autoinhibited kinesin-1 adopts a hierarchical folding pattern
- Department of Biophysics, University of Michigan, United States
- Life Sciences Institute, University of Michigan, United States
- Department of Cell & Developmental Biology, University of Michigan, United States
- Department of Pathology, University of Michigan, United States
- Department of Computational Medicine and Bioinformatics, University of Michigan, United States
- Department of Biological Chemistry, University of Michigan, United States
Figures
Figure 1 with 3 supplements
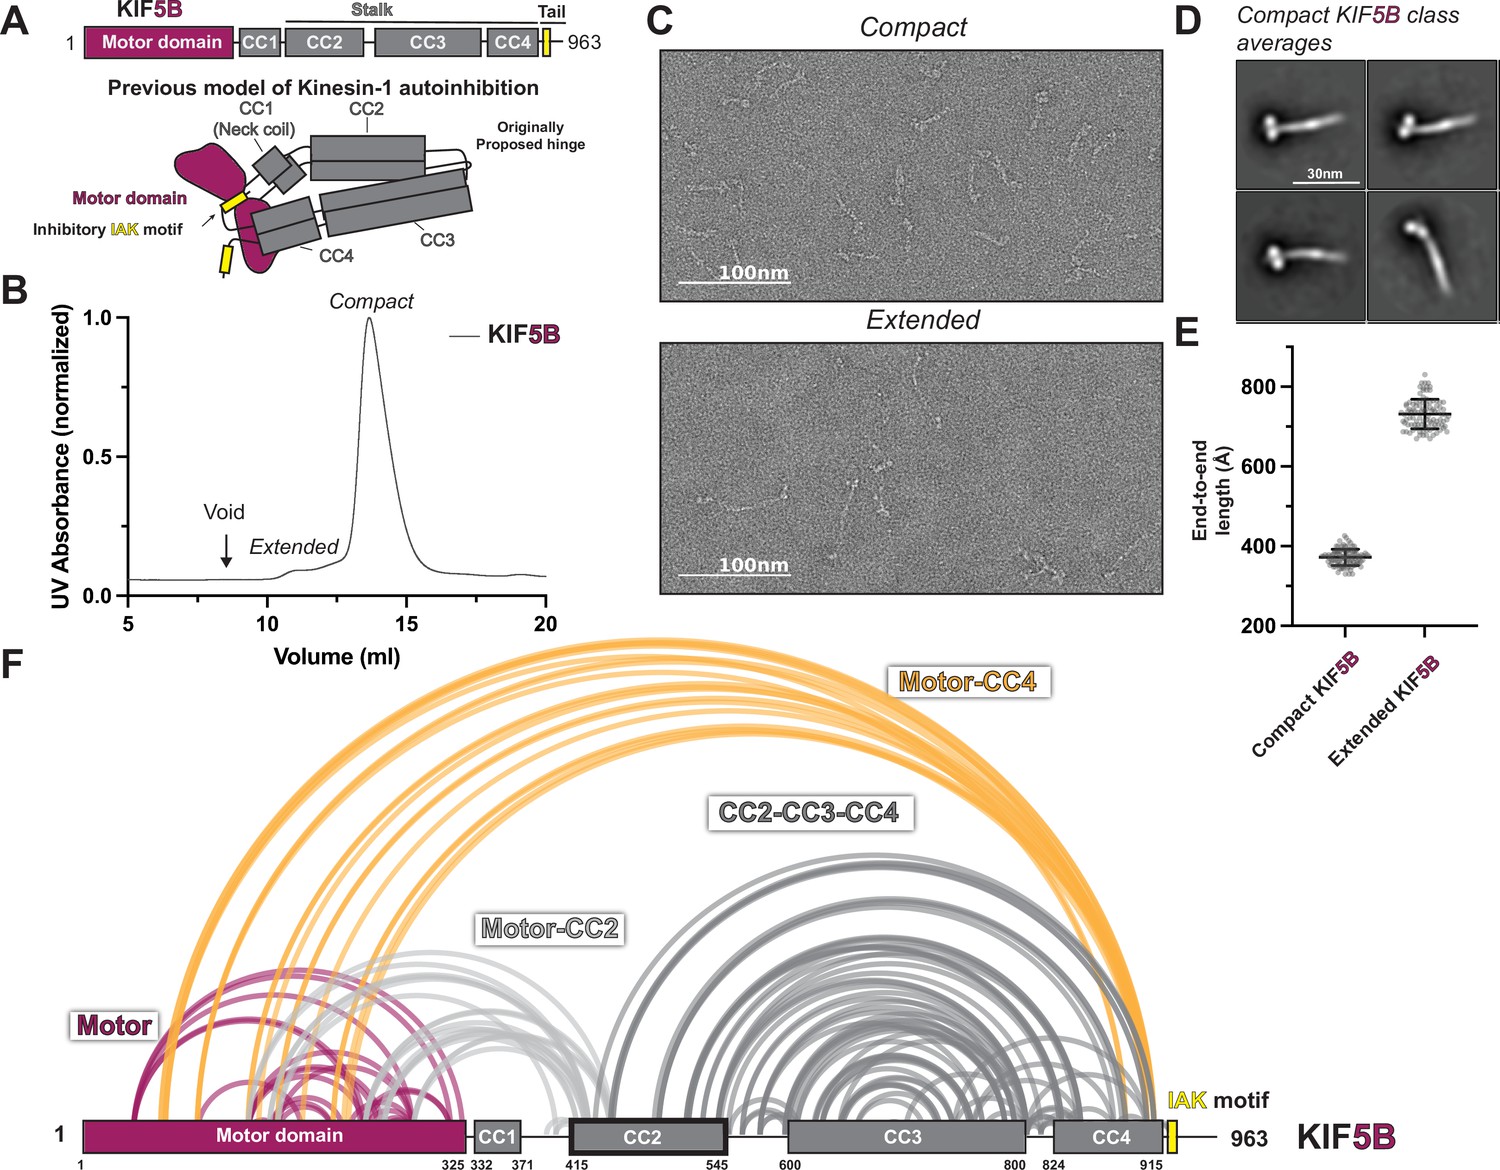
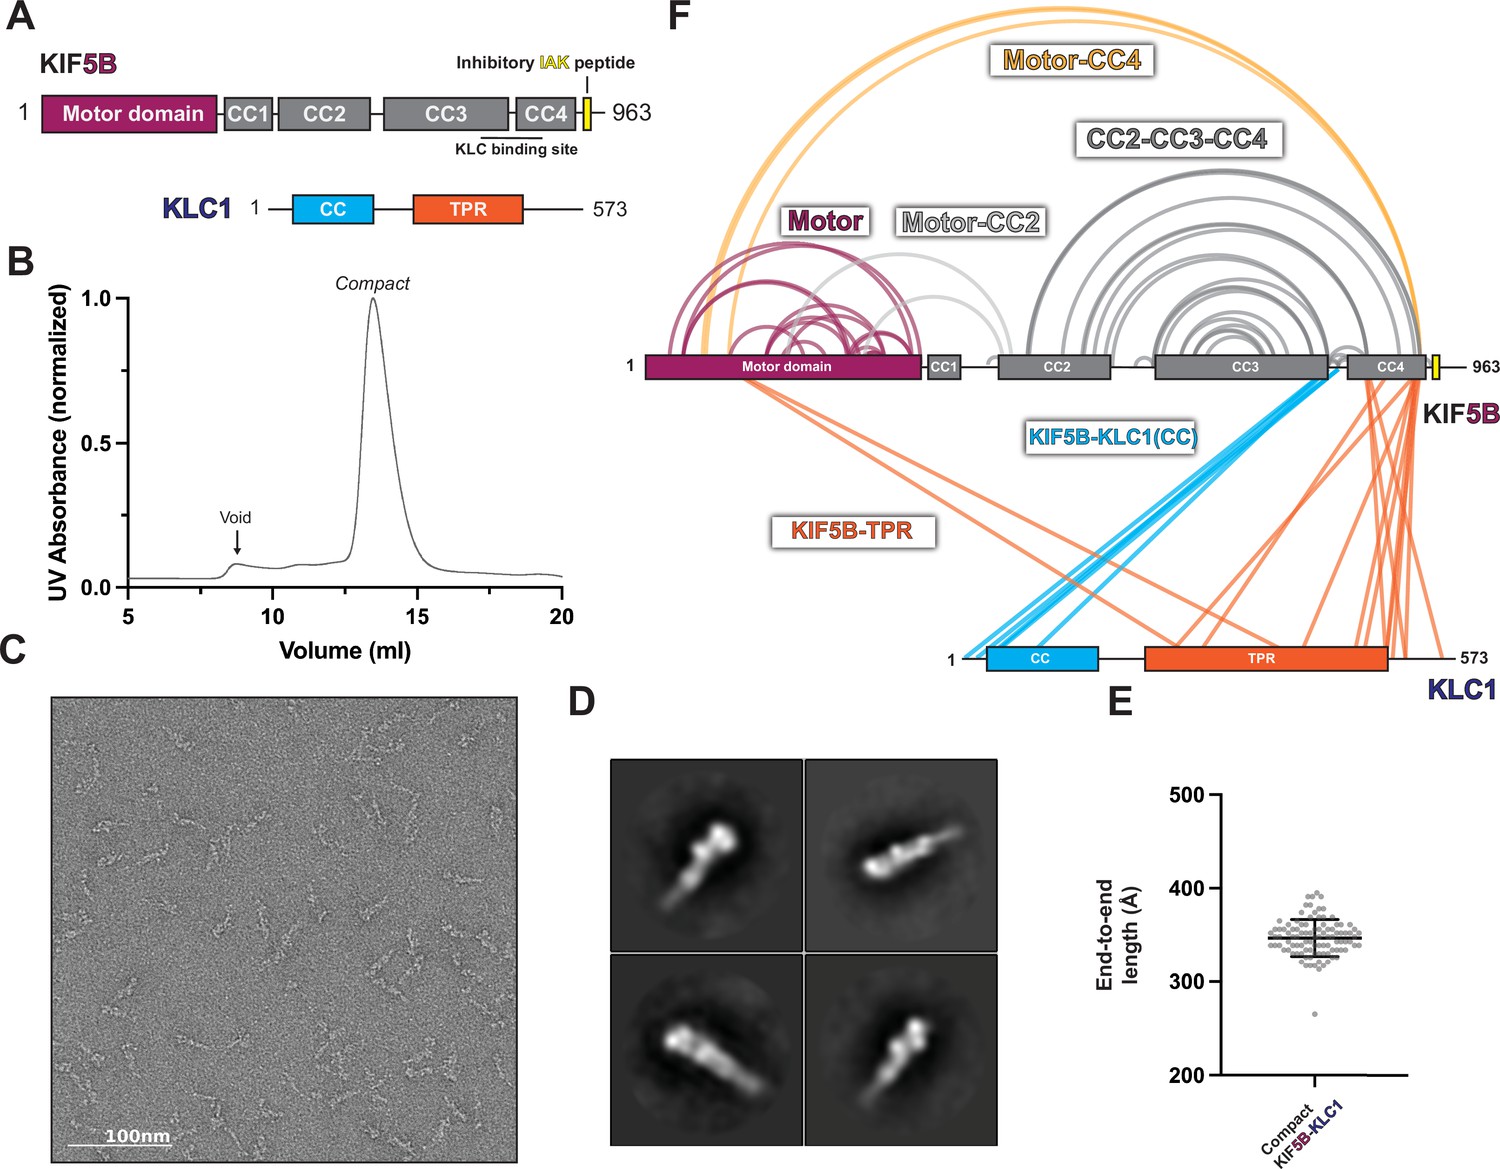
KIF5B adopts a hierarchical folding pattern.
(A) Overview of the KIF5B domain diagram and the previous model of kinesin-1 autoinhibition. (B) Size-exclusion chromatography profile of KIF5B. (C) Negative staining electron microscopy (EM) analysis of KIF5B in two conformations. (D) Class averages of KIF5B in compact state. (E) End-to-end measurements of KIF5B in two states (N = 100). (F) Crosslinked lysine pairs in KIF5B were mapped onto the domain diagram and divided into four groups.
-
Figure 1—source data 1
XL-MS data for KIF5B.
- https://cdn.elifesciences.org/articles/86776/elife-86776-fig1-data1-v1.zip
-
Figure 1—source data 2
XL-MS data for KIF5C.
- https://cdn.elifesciences.org/articles/86776/elife-86776-fig1-data2-v1.zip
Figure 1—figure supplement 1
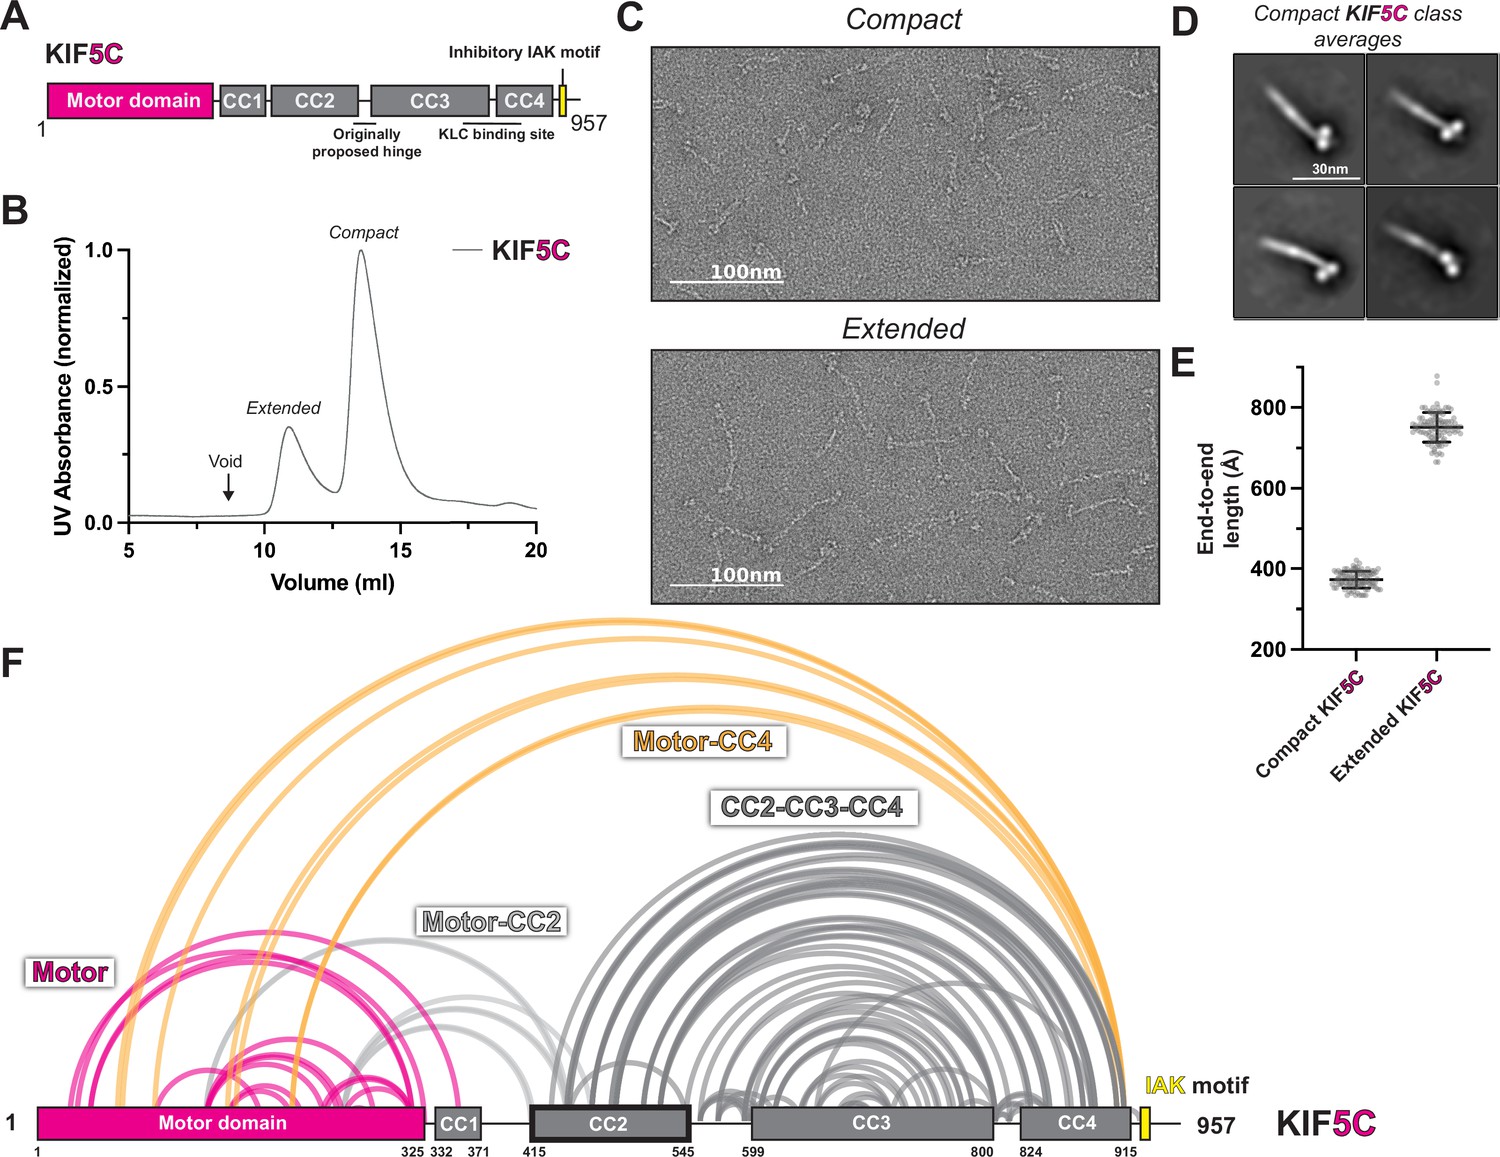
KIF5C adopts a hierarchical folding pattern.
(A) The domain diagram of KIF5C. (B) The size-exclusion chromatography profile of KIF5C. (C) The example micrographs from KIF5C negative staining electron microscopy (EM). (D) Class averages of compact KIF5C. (E) End-to-end length measurements of KIF5C in two states (N = 100). (F) Crosslinked lysine pairs in KIF5C were mapped onto the domain diagram and divided into four groups.
Figure 1—figure supplement 2
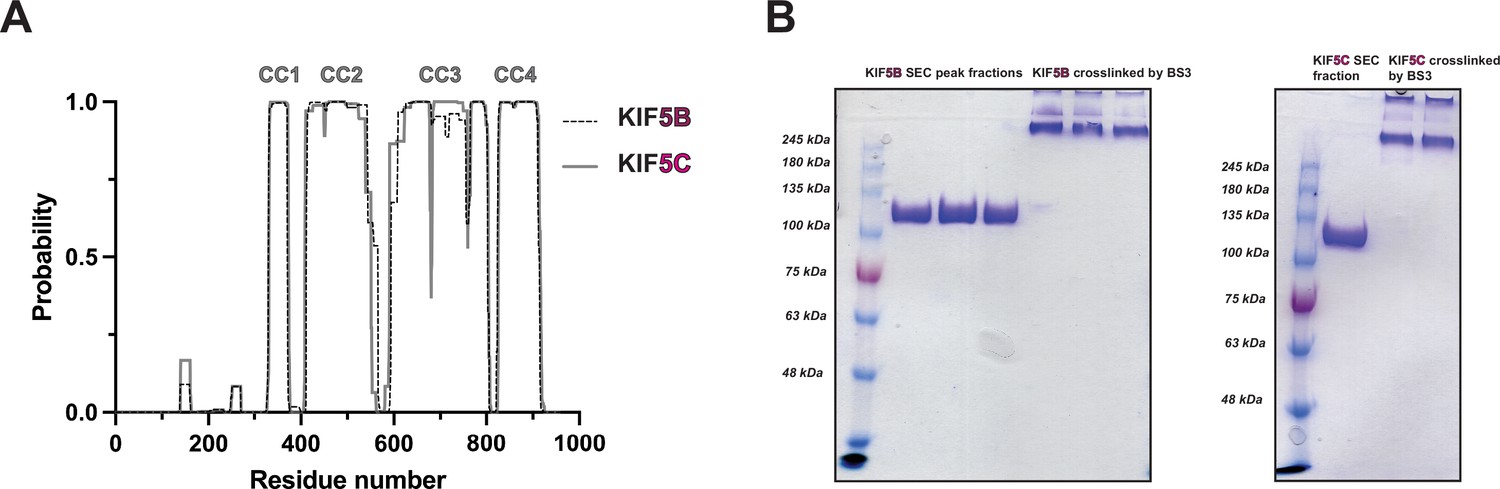
Structural analysis and purification of KIF5B and KIF5C.
(A) Coiled-coil prediction results from Marcoil (Delorenzi and Speed, 2002) on MPI Bioinformatics Toolkit (Gabler et al., 2020; Zimmermann et al., 2018). (B) SDS-PAGE analysis of crosslinked KIF5B and KIF5C samples.
Figure 1—figure supplement 3
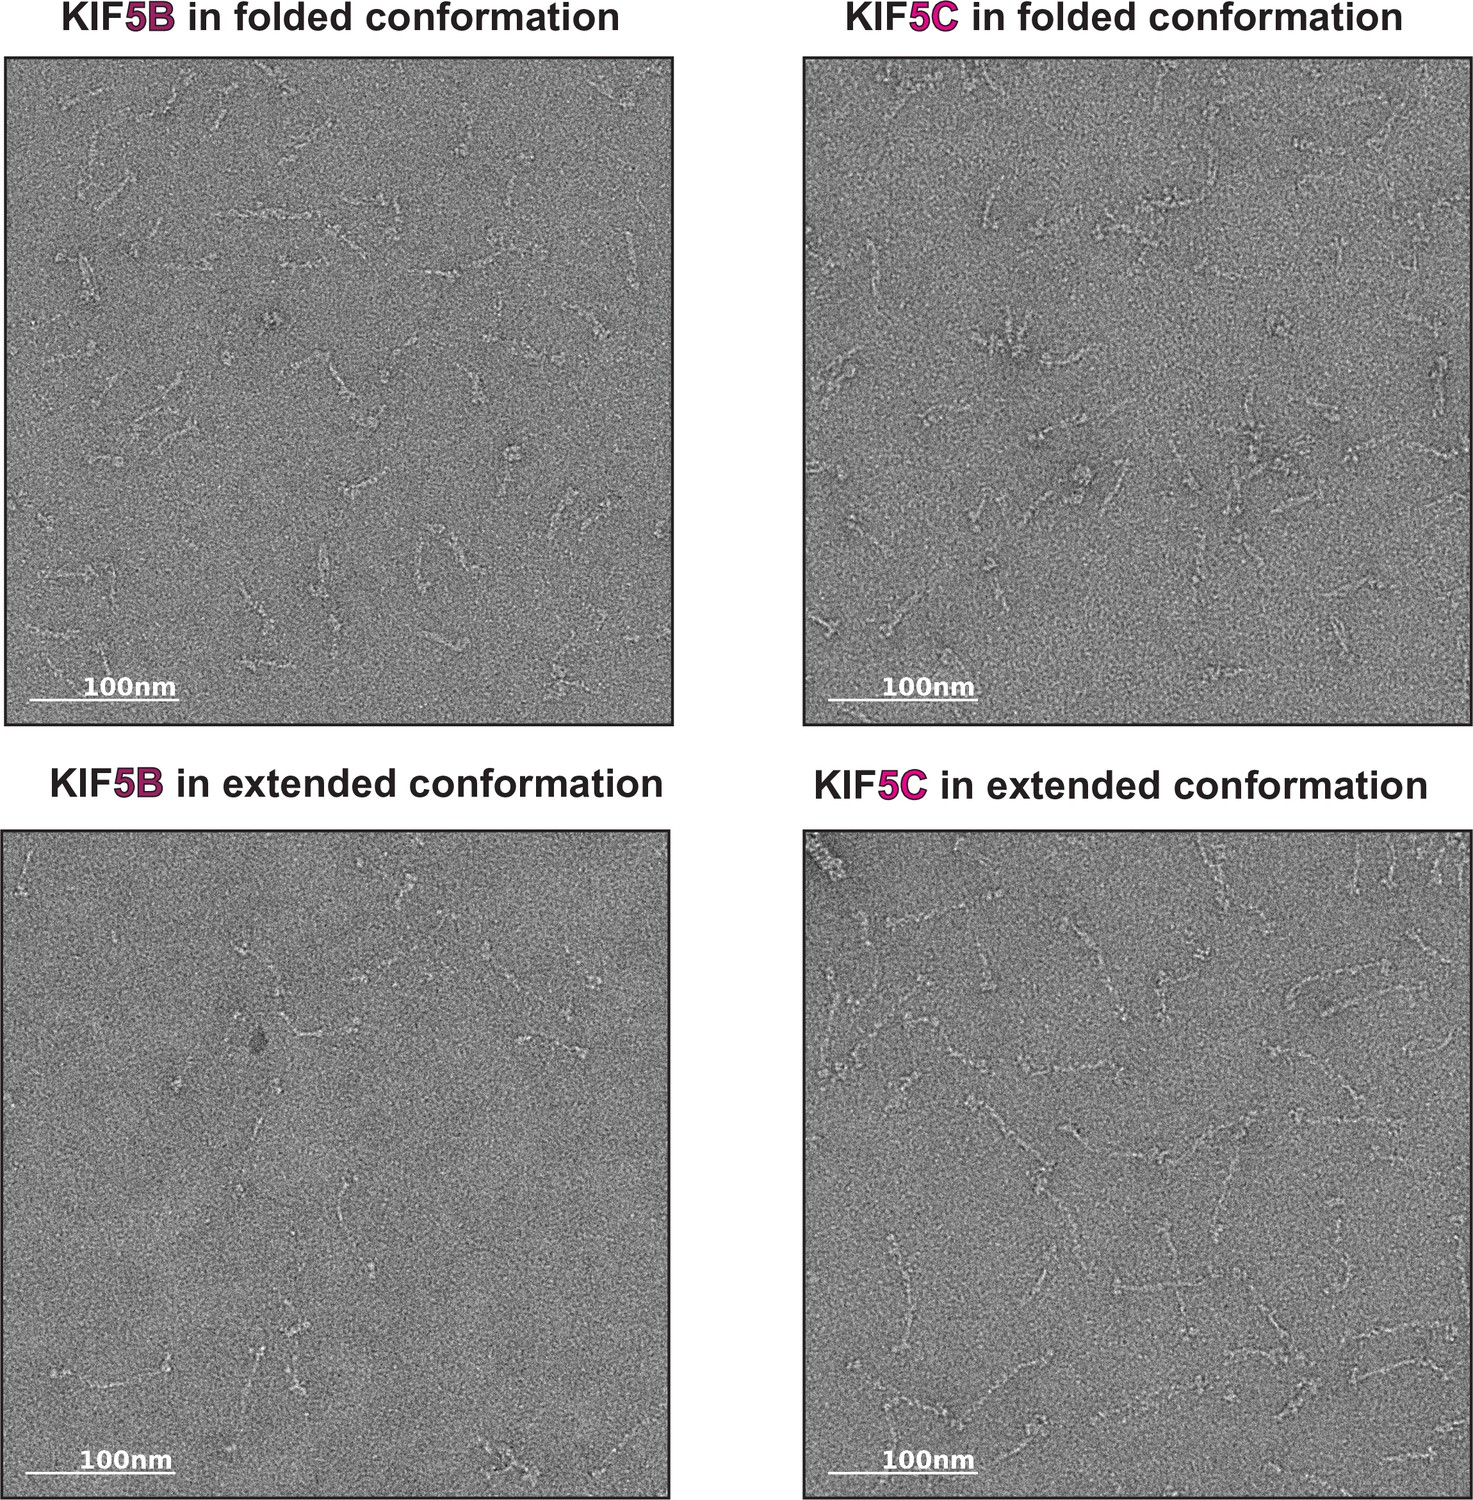
Negative stain electron microscopy (EM) of KIF5B and KIF5C.
Representative micrographs of KIF5B and KIF5C in extended and compact states.
Figure 2 with 3 supplements

Integrative modeling reveals the molecular architecture of autoinhibited KIF5B.
(A) The proposed model of autoinhibited KIF5B in cartoon diagram. The dashed lines indicates the crosslinked pairs. (B) A model of autoinhibited KIF5B via the integrative modeling. The gray density is the 3D reconstruction from the negative staining electron microscopy (EM). Three eye icons showed the viewing directions in (C). (C) Three groups of crosslinked pairs were mapped onto the KIF5B model.
Figure 2—figure supplement 1
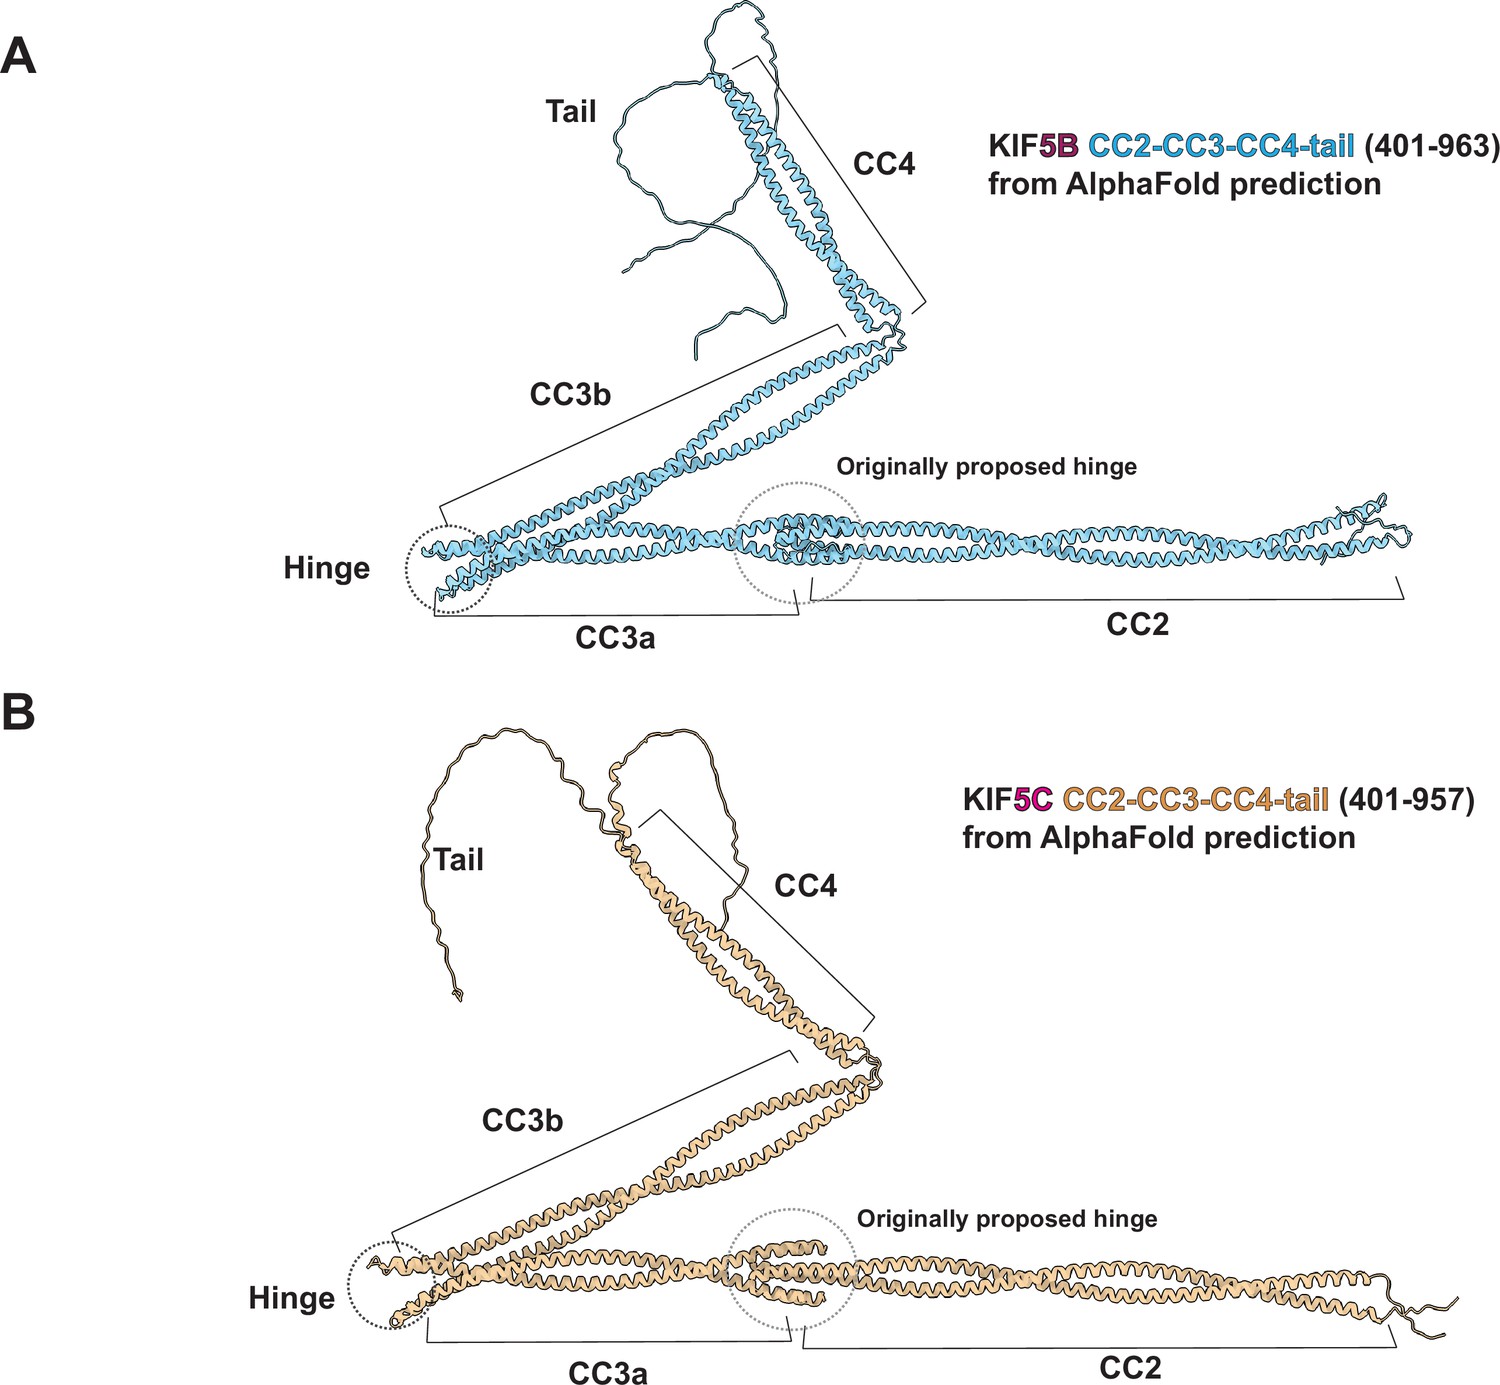
The AlphaFold predicted structures of KIF5B and KIF5C stalk and tail.
(A) The predicted structure of KIF5B(401–963). (B) The predicted structure of KIF5C(401–957). The coiled-coil prediction results and location of the originally proposed hinge were mapped onto the structures. The newly identified hinge sits in between the CC3a and CC3b.
Figure 2—figure supplement 2
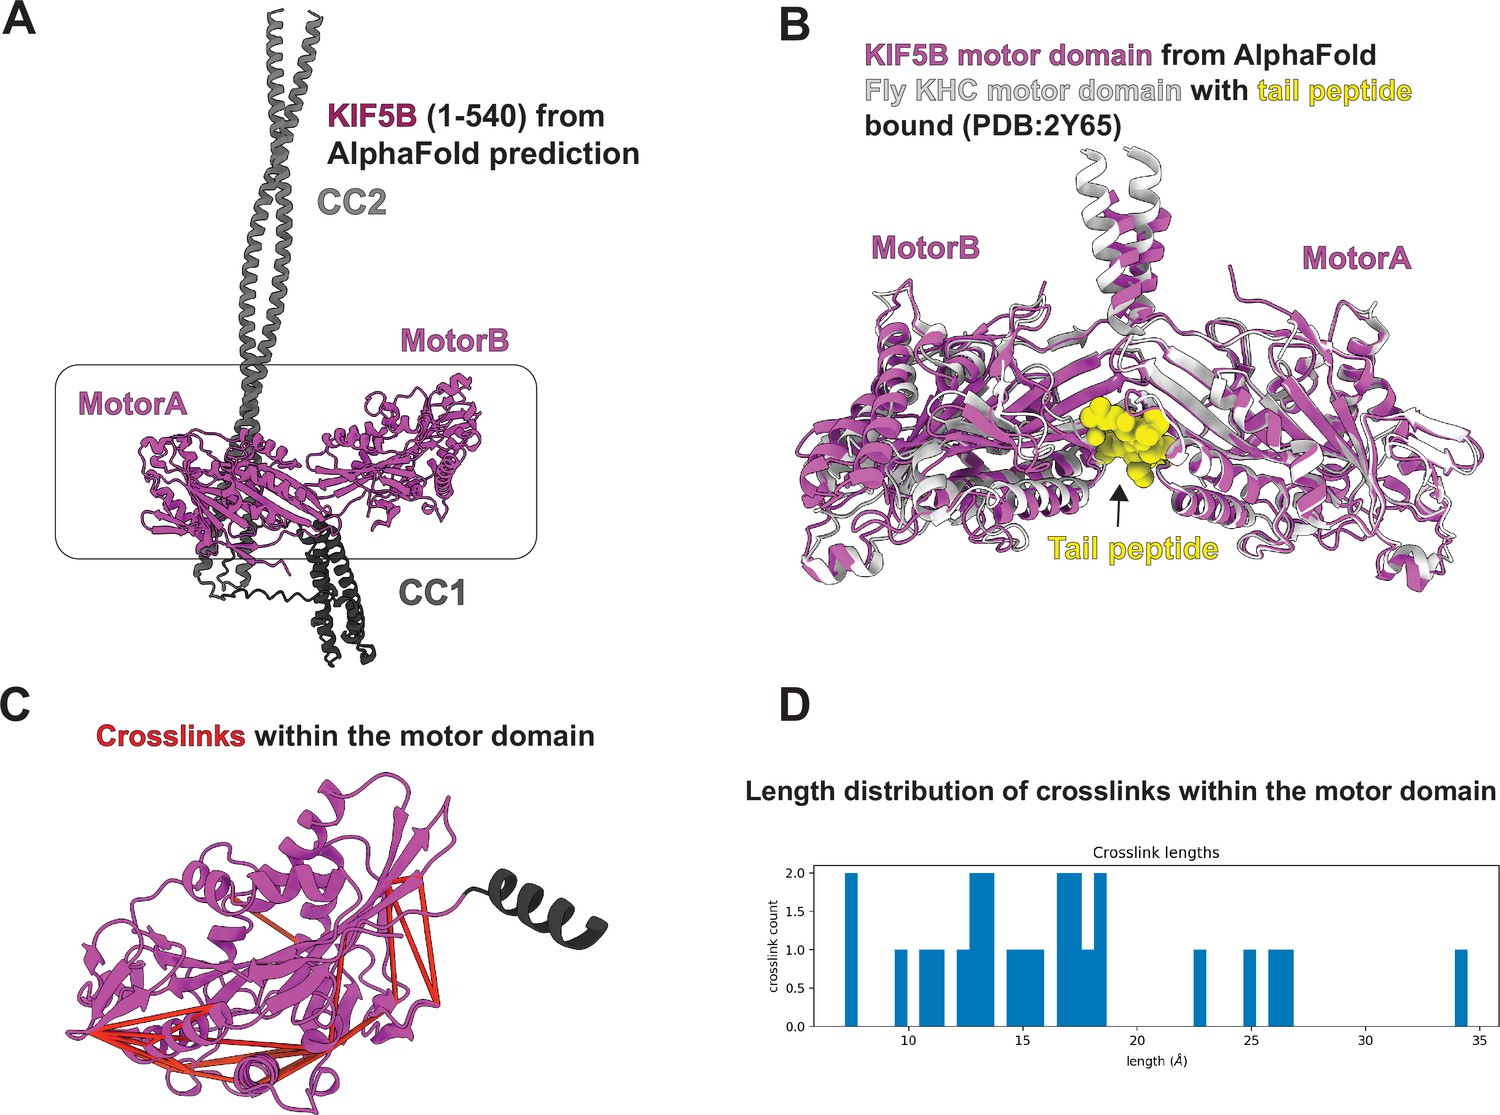
Predicted KIF5B motor domain resembles the tail peptide-bound state.
(A) The predicted structure of KIF5B(1–540) containing motor domain, CC1 and CC2. (B) Superposition of predicted KIF5B motor domain structure (purple) with tail peptide bound fly kinesin heavy chain (KHC) motor domain structure (light gray) (PDB:2Y65). (C) Intra-motor domain crosslinks were mapped to the predicted motor domain structure. (D) The length distribution of crosslinks within the motor domain.
Figure 2—figure supplement 3
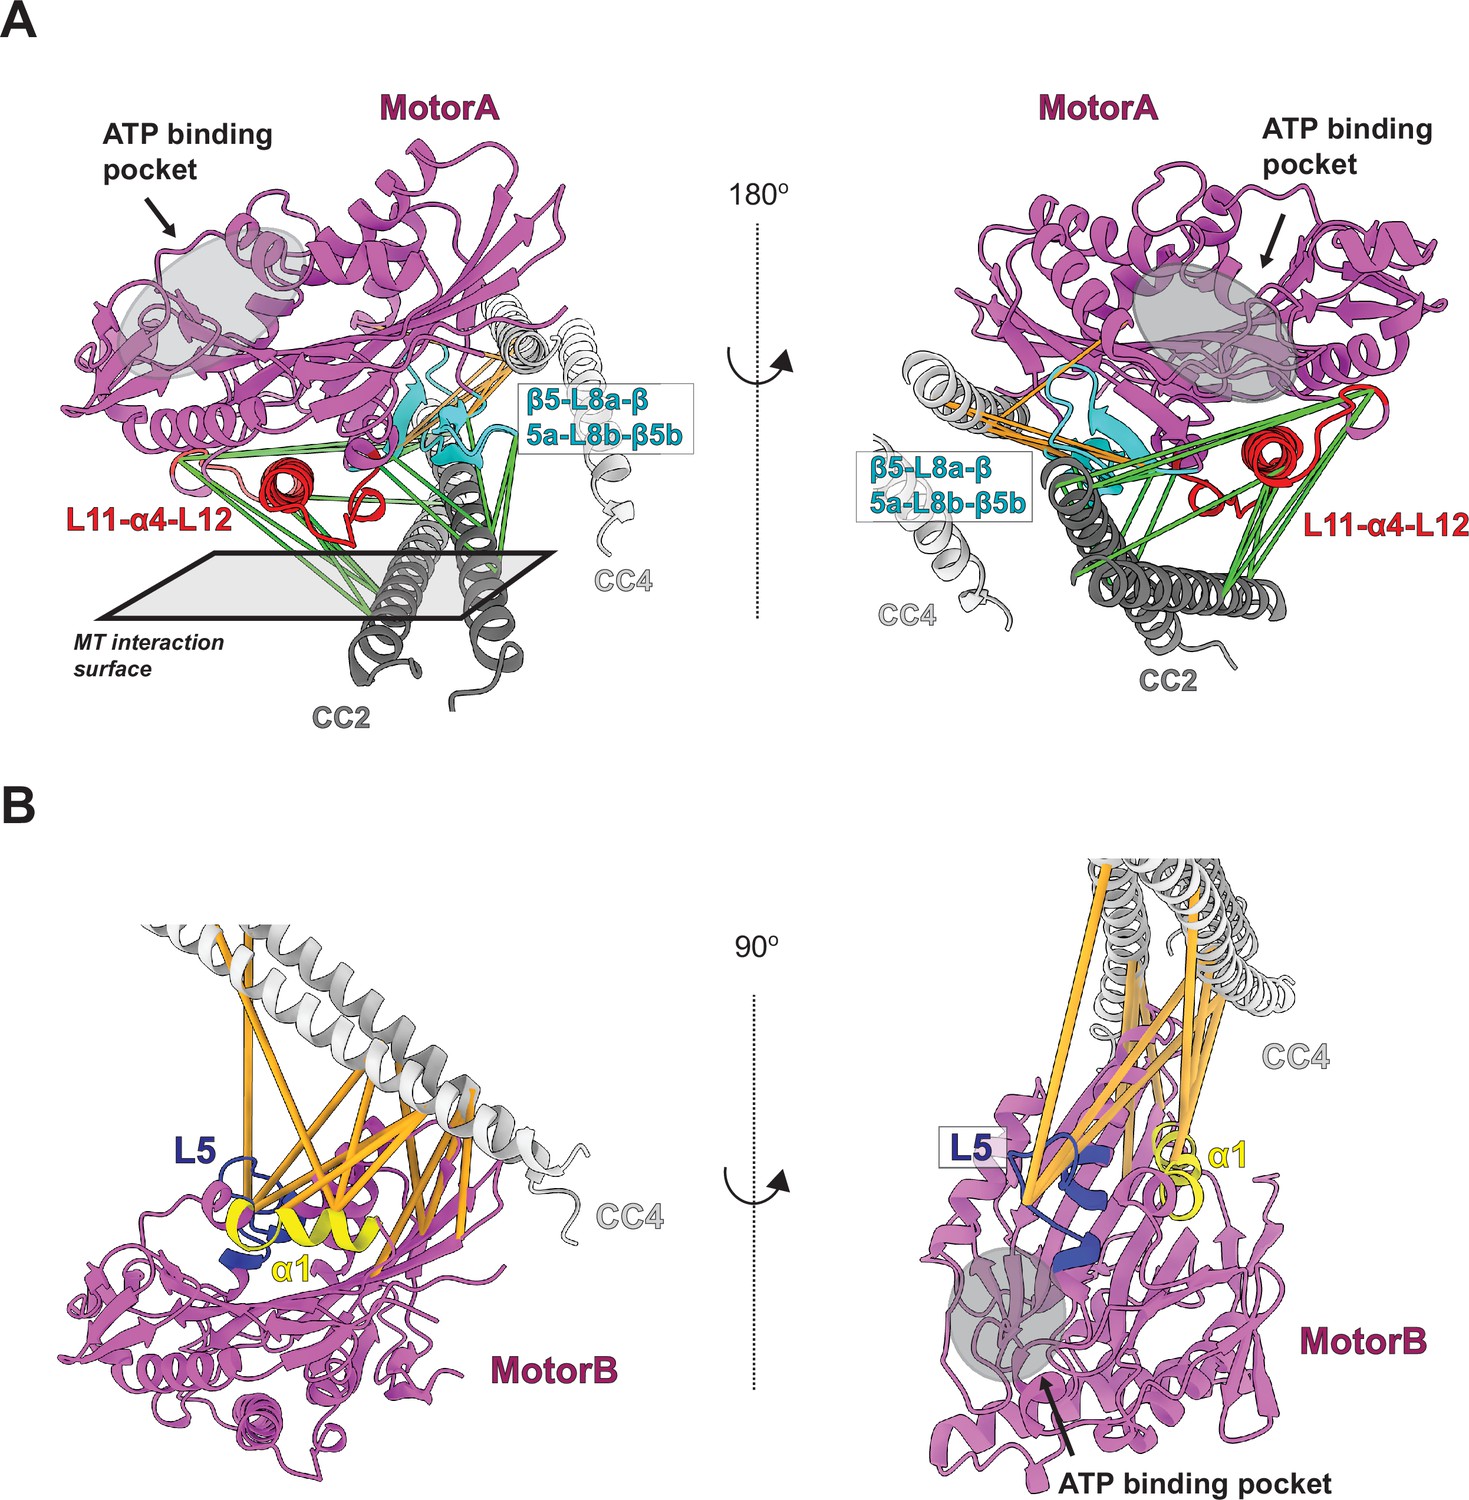
The stalk crosslinks to multiple points on the motor domain.
(A) The microtubules binding interface in motorA was crosslinked to the CC2 and CC4. The red-colored region is L11-α4-L12, mainly for interacting with α-tubulin. The cyan-colored region is β5-L8, which is responsible for interacting with β-tubulin. (B) Two elements (L5 and α1) in motorB were crosslinked to CC4.
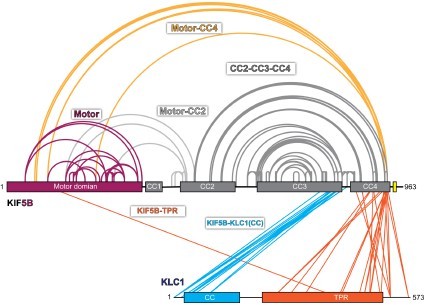
Figure 3 with 2 supplements
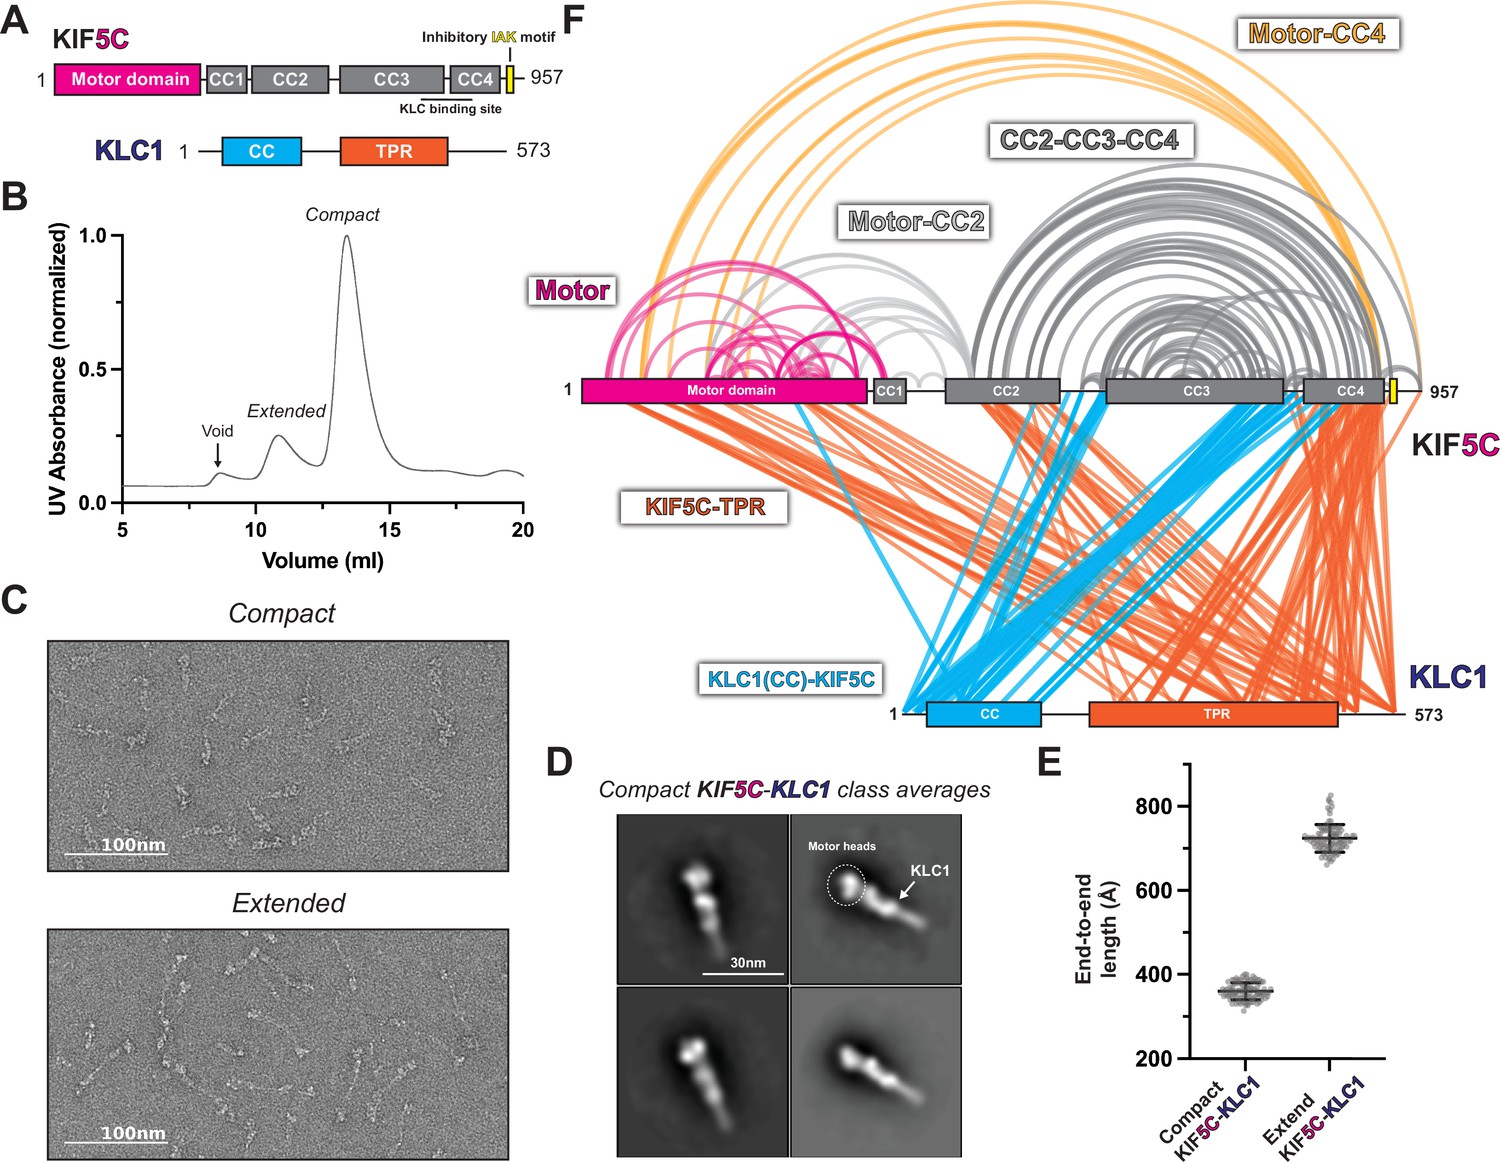
KLC1 makes extensive contacts with KIF5C within the inhibited state.
(A) Overview of KIF5C-KLC1 domain diagram. (B) Size-exclusion chromatography profile of KIF5C-KLC1. (C) Negative staining electron microscopy (EM) analysis of Kif5C-KLC1 in two states. (D) Class averages of KIF5C-KLC1 in compact conformation. (E) End-to-end length measurements of KIF5C-KLC1 in two states (N = 100). (F) Crosslinked lysine pairs in KIF5C-KLC1 were mapped onto the domain diagram.
-
Figure 3—source data 1
XL-MS data for KIF5C-KLC1.
- https://cdn.elifesciences.org/articles/86776/elife-86776-fig3-data1-v1.zip
-
Figure 3—source data 2
XL-MS data for KIF5B-KLC1.
- https://cdn.elifesciences.org/articles/86776/elife-86776-fig3-data2-v1.zip
Figure 3—figure supplement 1
KLC1 maintains the folding pattern of KIF5B.
(A) The domain diagram of KIF5B-KLC1. (B) The size-exclusion chromatography profile of KIF5B-KLC1. (C) The example negative staining electron microscopy (EM) micrograph of KIF5B-KLC1 in compact state. (D) Examples of 2D class averages of KIF5B-KLC1. (E) End-to-end length measurements of KIF5B-KLC1 in compact state (N = 100). (F) Crosslinked lysine pairs in KIF5B-KLC1, shown in the domain diagram.
Figure 3—figure supplement 2
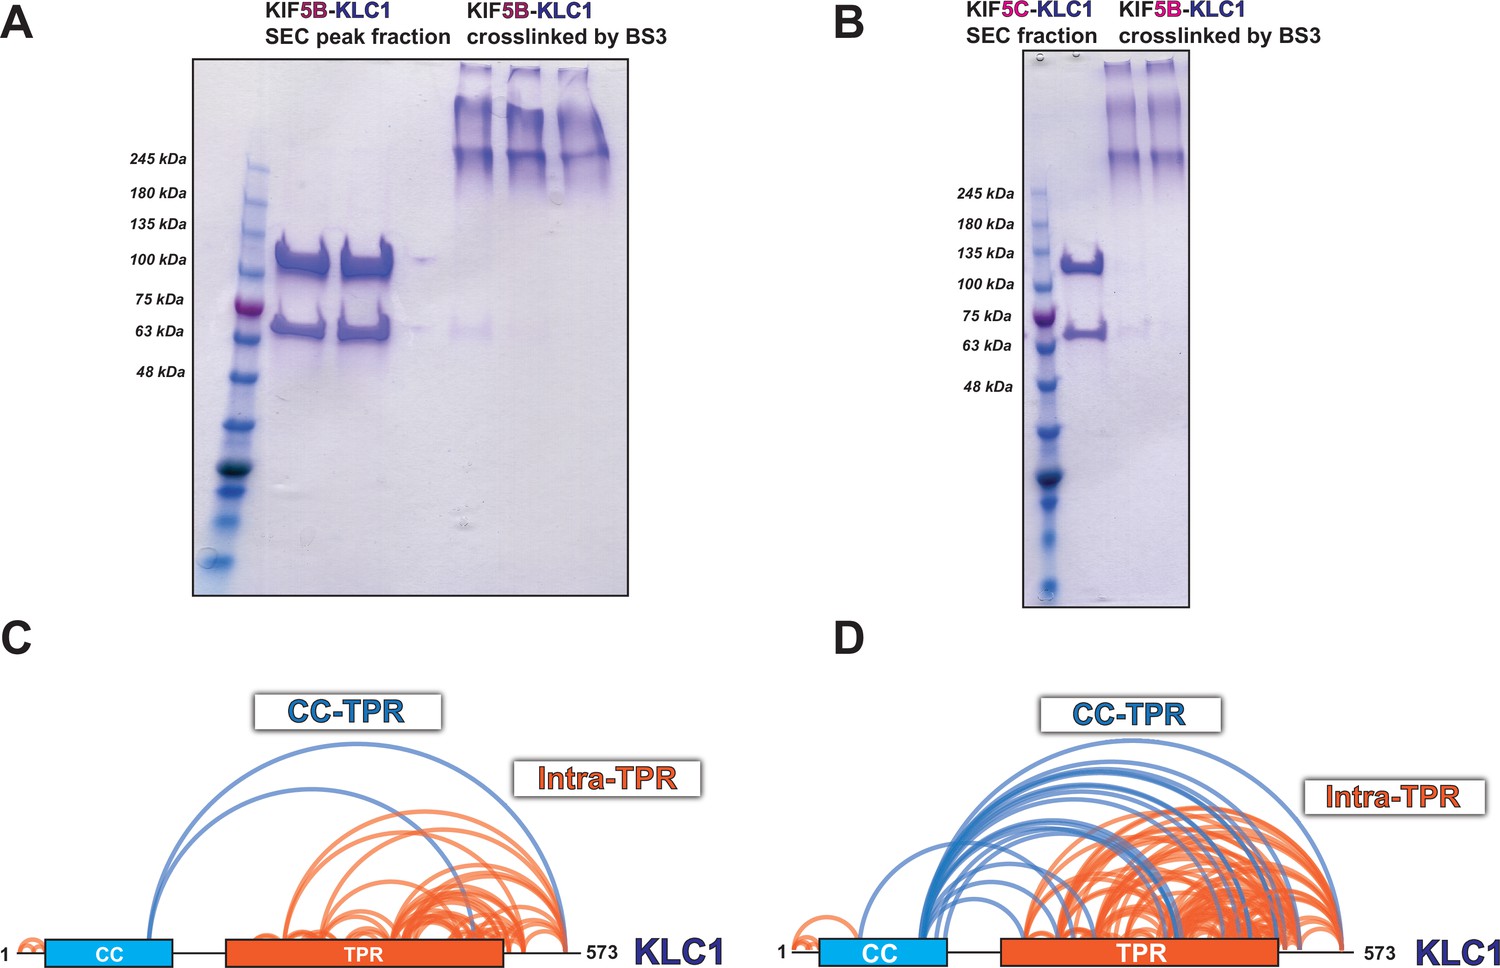
SDS-PAGE analysis of kinesin-1 heterotetramer (KIF5B-KLC1 and KIF5C-KLC1) and the intra-KLC1 crosslinks.
(A) SDS-PAGE analysis of KIF5B-KLC1. (B) SDS-PAGE analysis of KIF5C-KLC1. (C) Intra-KLC1 crosslinks from KIF5B-KLC1. (D) Intra-KLC1 crosslinks from KIF5C-KLC1.
Figure 4 with 1 supplement
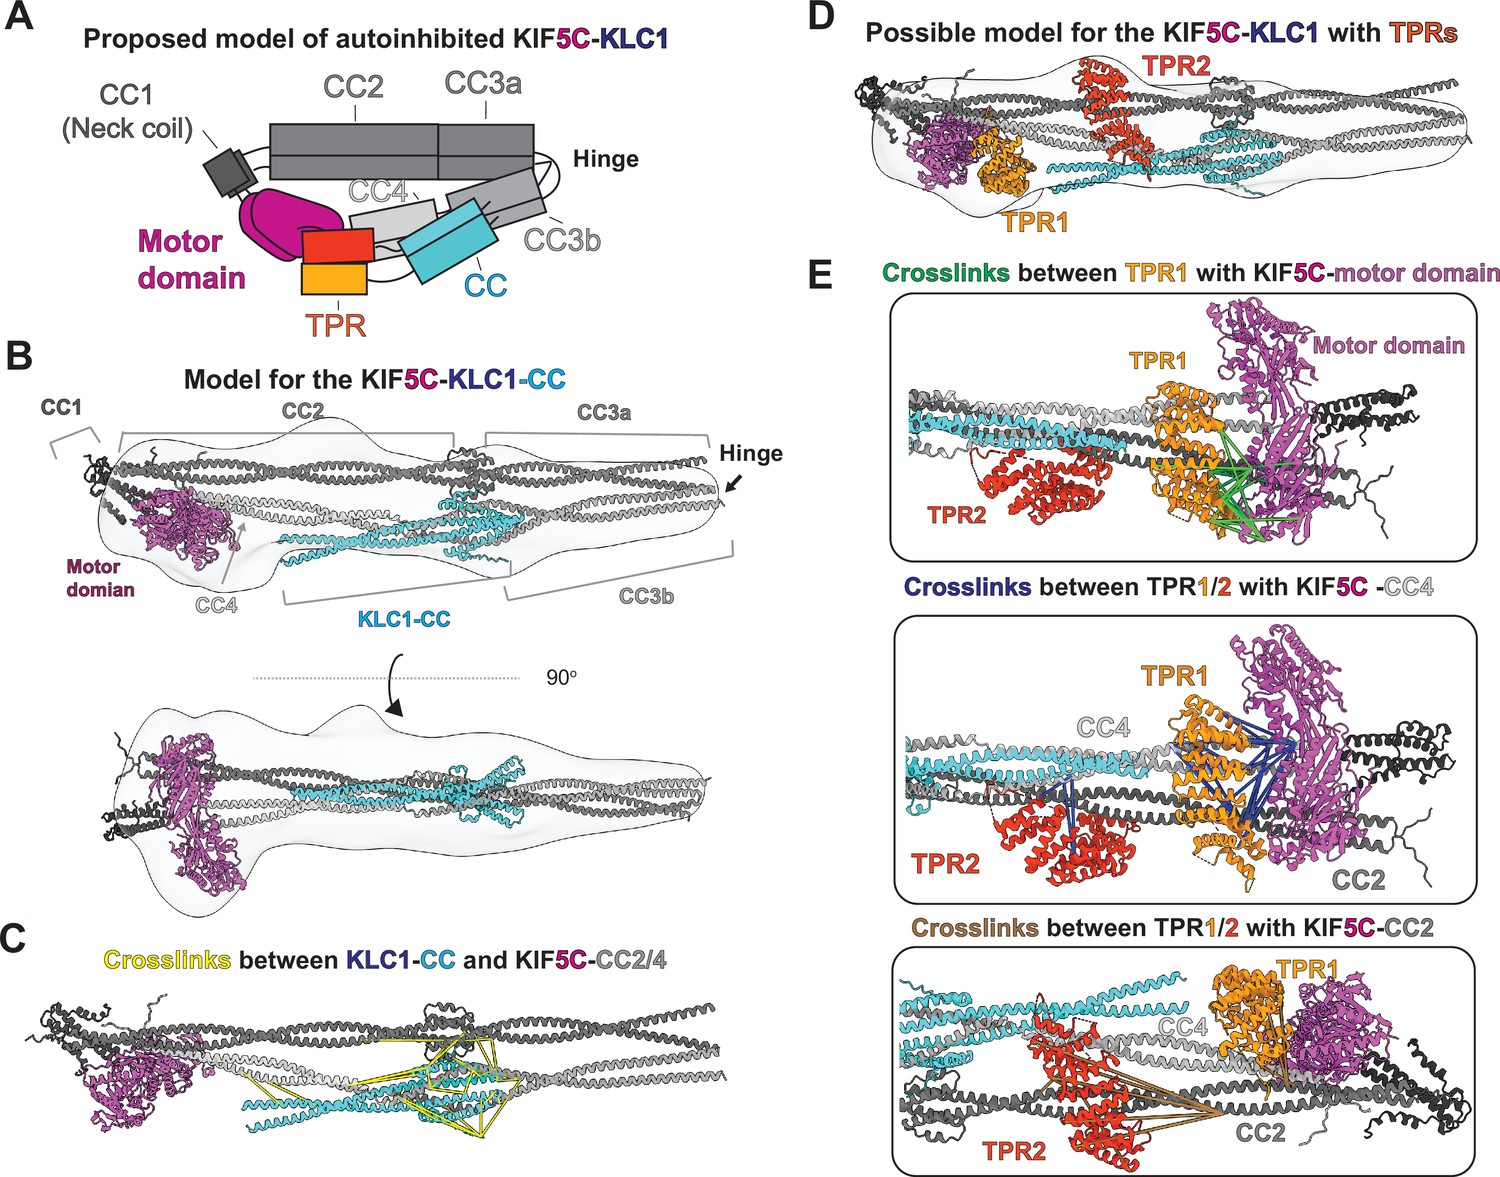
Integrative modeling reveals molecular architecture of autoinhibited KIF5C-KLC1.
(A) The proposed model of autoinhibited KIF5C-KLC1 in cartoon diagram. (B) A model of KIF5C-KLC1(CC) via integrative modeling. The gray density is the low-resolution map from negative staining electron microscopy (EM). (C) The crosslinked pairs between KLC1-CC and KIF5C stalk, shown in the structure model. (D) The locations for the TPR domains in the KIF5C-KLC1. (E) Crosslinked lysine pairs between TPR domains and KIF5C.
Figure 4—figure supplement 1
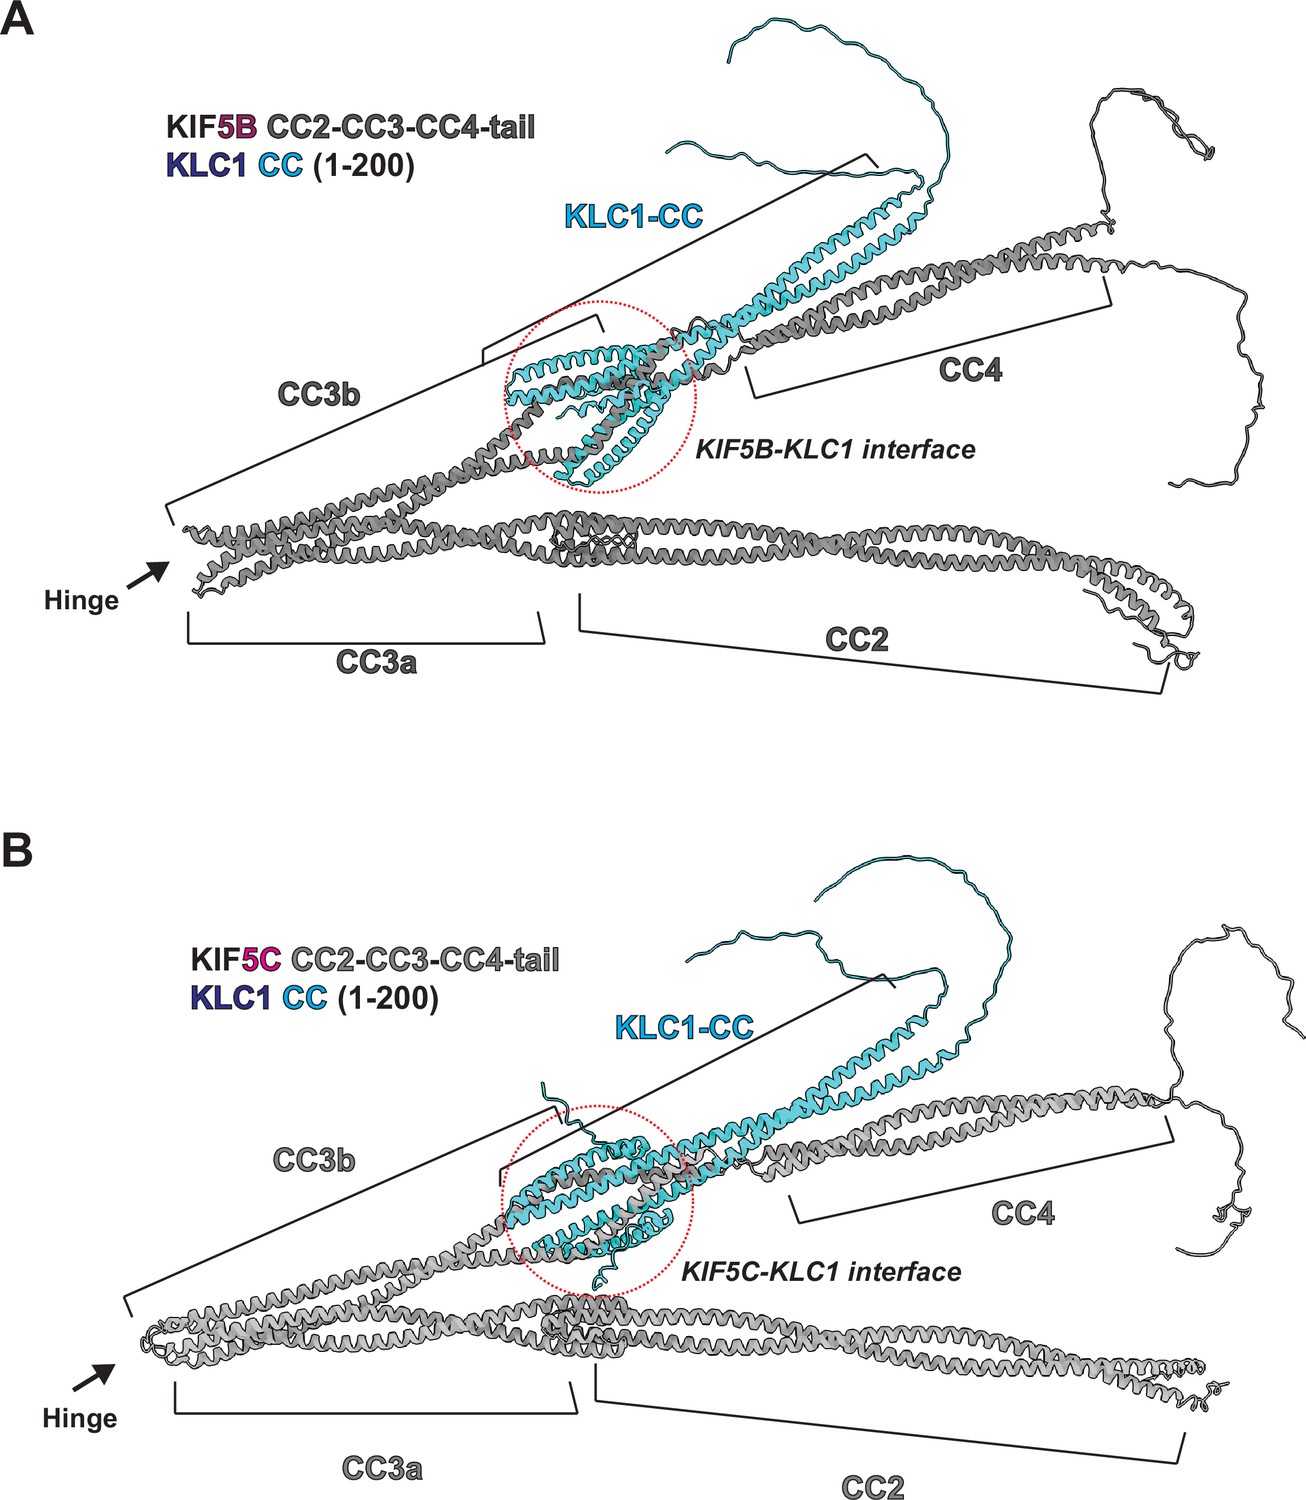
The AlphaFold predicted structure of KIF5B/C stalk and KLC1.
(A) The predicted structure of KIF5B(401–963) – KLC1(1–200). (B) The predicted structure of KIF5C(401–957) – KLC1(1–200). The coiled-coil prediction results and location of binding site between kinesin heavy chain and light chain were mapped onto the structure.
Figure 5 with 3 supplements

Disruption of the hierarchical folding activates KIF5B motility in vitro.
(A) The designed KIF5B mutations and truncations shown on the domain diagram. (B) Example kymographs of KIF5B with different truncations. And the corresponding landing rate. Landing rate (events/μm/s/μM): Lines show mean ± SEM: 1.07 ± 0.16 (WT), 14.92 ± 1.30 (1–909), 15.75 ± 0.70 (1–890), 26.87 ± 1.65 (1–565), 53.42 ± 3.47 (1–420). N = 2; n = 25, 20, 23, 15 and 14 MTs. One-way ANOVA followed by Dunnett’s test. ****p<0.0001. (C) Example kymographs of KIF5B with single mutation and the corresponding landing rate. Landing rate (events/μm/s/μM): Lines show mean ± SEM: 1.07 ± 0.16 (WT), 3.93 ± 0.32 (CC2), 4.93 ± 0.42 (hinge), 6.90 ± 0.78 (IAK), 0.67 ± 0.32 (linker). N = 2; n = 25, 25, 25, 20, and 9 MTs. One-way ANOVA followed by Dunnett’s test. *p<0.05, ***p<0.001, n.s., not significant. (D) Example kymographs of KIF5B with combined mutations and the corresponding landing rate. Landing rate (events/μm/s/μM): Lines show mean ± SEM: 1.07 ± 0.16 (WT), 6.44 ± 0.40 (CC2 + hinge), 7.66 ± 0.86 (CC2 + IAK), 9.65 ± 0.85 (hinge + IAK), 10.49 ± 0.57 (CC2 + hinge + IAK). N = 2; n = 25, 15, 12, 20, and 32 MTs. One-way ANOVA followed by Dunnett’s test. **p<0.01, ***p<0.001, ****p<0.0001.
-
Figure 5—source data 1
XL-MS data for KIF5B (1-565).
- https://cdn.elifesciences.org/articles/86776/elife-86776-fig5-data1-v1.zip
-
Figure 5—source data 2
XL-MS data for KIF5B_IAK_AAA.
- https://cdn.elifesciences.org/articles/86776/elife-86776-fig5-data2-v1.zip
Figure 5—figure supplement 1
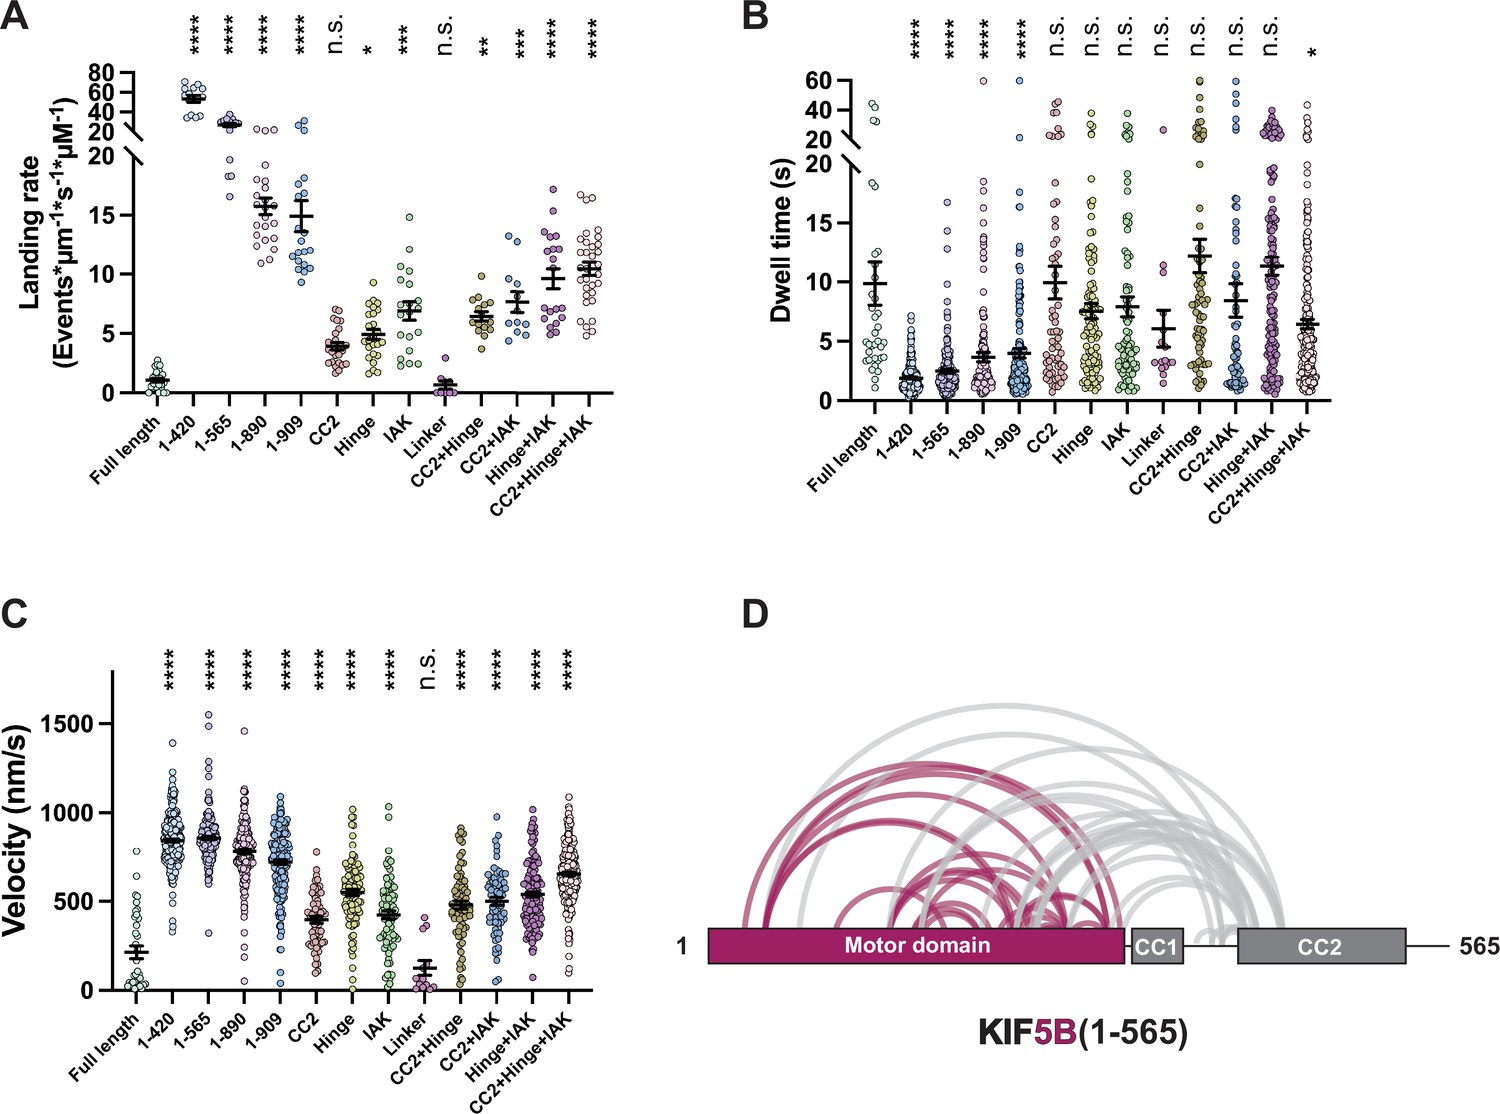
The landing rate, dwell time, and velocity distribution of all KIF5B variants and the crosslinking mass spectrometry (XL-MS) results of KIF5B(1–565).
(A) The landing rate distribution of KIF5B with different mutations and truncations. Landing rate (events/μm/s/μM): Lines show mean ± SEM: 1.07 ± 0.16 (full length), 53.42 ± 3.47 (1–420), 26.87 ± 1.65 (1–565), 15.75 ± 0.70 (1–890), 14.92 ± 1.30 (1–909), 3.93 ± 0.32 (CC2), 4.93 ± 0.42 (hinge), 6.90 ± 0.78 (IAK), 0.67 ± 0.32 (linker), 6.44 ± 0.40 (CC2 + hinge), 7.66 ± 0.86 (CC2 + IAK), 9.65 ± 0.85 (hinge + IAK), 10.49 ± 0.57 (CC2 + hinge + IAK). N = 2, n = 25, 14, 15, 23, 20, 25, 25, 20, 9, 15, 12, 20, and 32 MTs. One-way ANOVA followed by Dunnett’s test. *p<0.05, **p<0.01, ***p<0.001, ****p<0.0001, n.s., not significant. (B) The dwell time distribution of KIF5B with different mutations and truncations. Dwell time (s): lines show mean ± SEM: 9.88 ± 1.83 (full length), 1.91 ± 0.08 (1–420), 2.49 ± 0.16 (1–565), 3.67 ± 0.40 (1–890), 3.99 ± 0.41 (1–909), 9.93 ± 1.37 (CC2), 7.54 ± 0.64 (hinge), 7.91 ± 0.85 (IAK), 6.07 ± 1.55 (linker), 12.21 ± 1.42 (CC2 + hinge), 8.45 ± 1.42 (CC2 + IAK), 11.34 ± 0.76 (hinge + IAK), 6.46 ± 0.41 (CC2 + hinge + IAK). N = 2, n = 36, 253, 185, 182, 180, 61, 103, 83, 16, 75, 68, 143, and 223 events. One-way ANOVA followed by Dunnett’s test. *p<0.05, ****p<0.0001, n.s., not significant. (C) The velocity distribution of KIF5B with different mutations and truncations. Velocity (nm/s): line shown mean ± SEM: 241.2 ± 36.04 (full length), 844.5 ± 8.89 (1–420), 858.0 ± 9.72 (1–565), 781.3 ± 12.47 (1–890), 720.9 ± 13.75 (1–909), 396.7 ± 19.15 (CC2), 549.7 ± 17.94 (hinge), 424.1 ± 21.86 (IAK), 125.8 ± 40.93 (linker), 479.4 ± 22.83 (CC2 + hinge), 500.1 ± 22.4 (CC2 + IAK), 539.4 ± 15.24 (hinge + IAK), 654.7 ± 10.94 (CC2 + hinge + IAK). N = 2, n = 36, 253, 185, 182, 180, 61, 103, 83, 13, 75, 68, 143 and 223 events. One-way ANOVA followed by Dunnett’s test. ****p<0.0001, n.s., not significant. (D) The crosslinked pairs in KIF5B (1–565), suggesting that motor-CC2 folding is present in truncated kinesin and is independent of stalk folding.
Figure 5—figure supplement 2
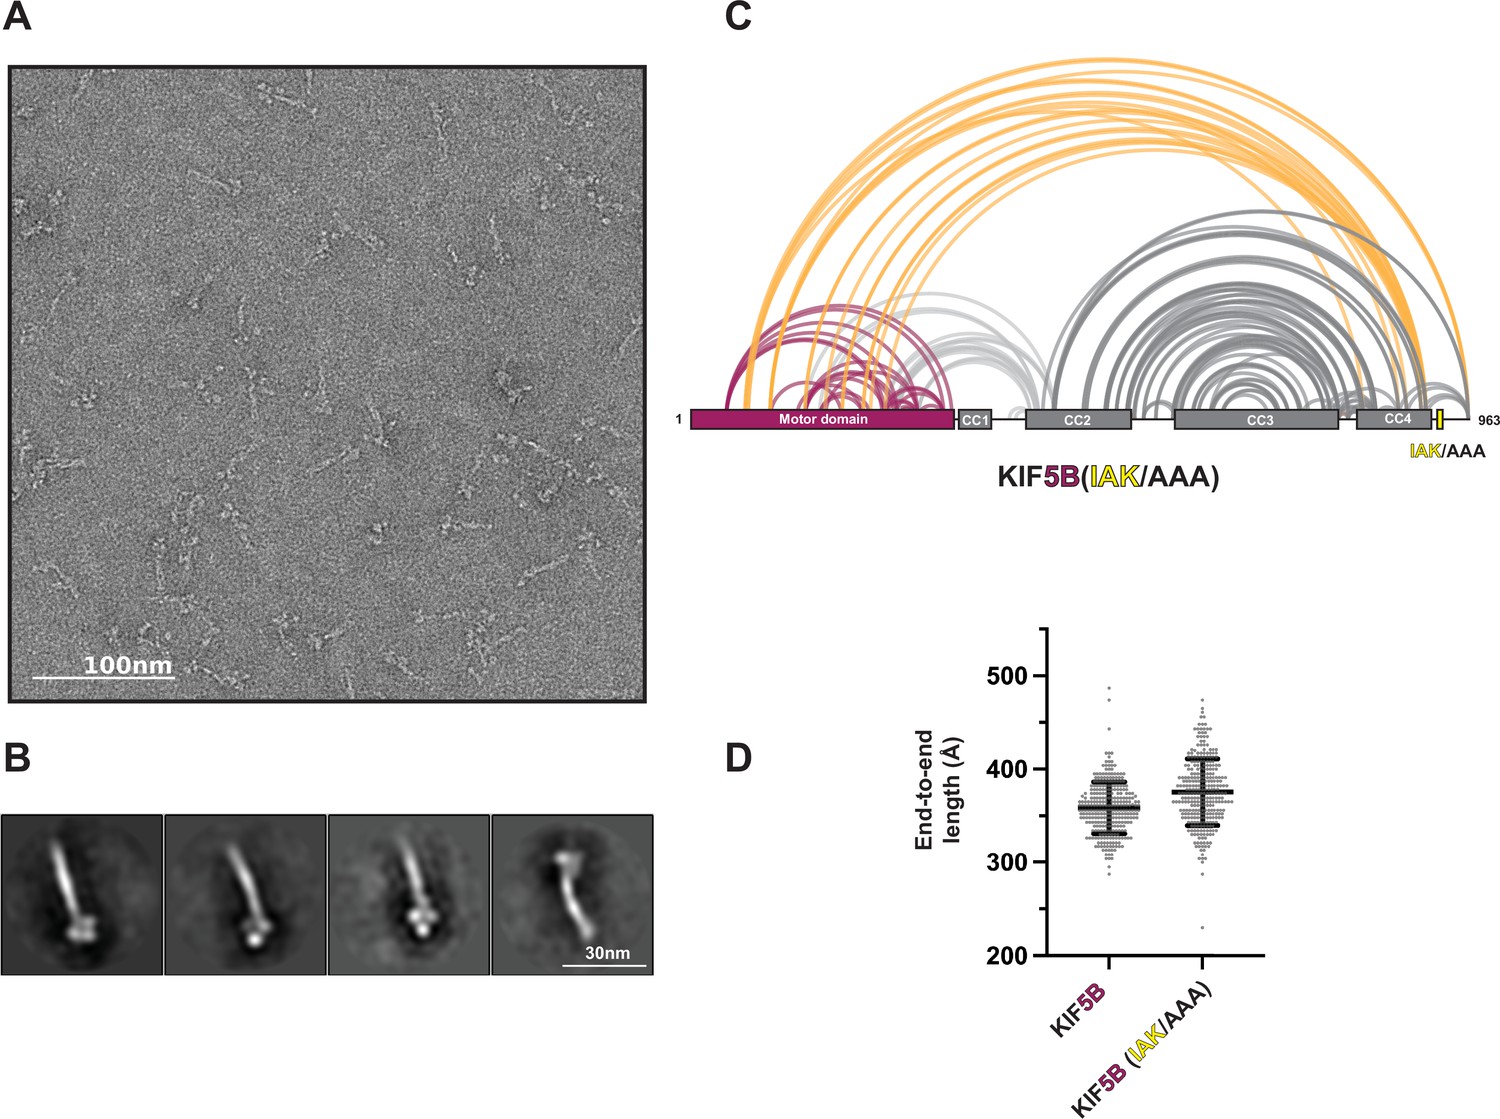
IAK mutation does not relieve KIF5B folding.
(A) Negative staining electron microscopy (EM) of crosslinked KIF5B(IAK/AAA). (B) The example class averages of KIF5B(IAK/AAA). (C) The crosslinked pairs in KIF5B(IAK/AAA) from crosslinking mass spectrometry (XL-MS). (D) End-to-end length measurement of KIF5B(WT) and KIF5B(IAK/AAA). (N = 300).
Figure 5—figure supplement 3
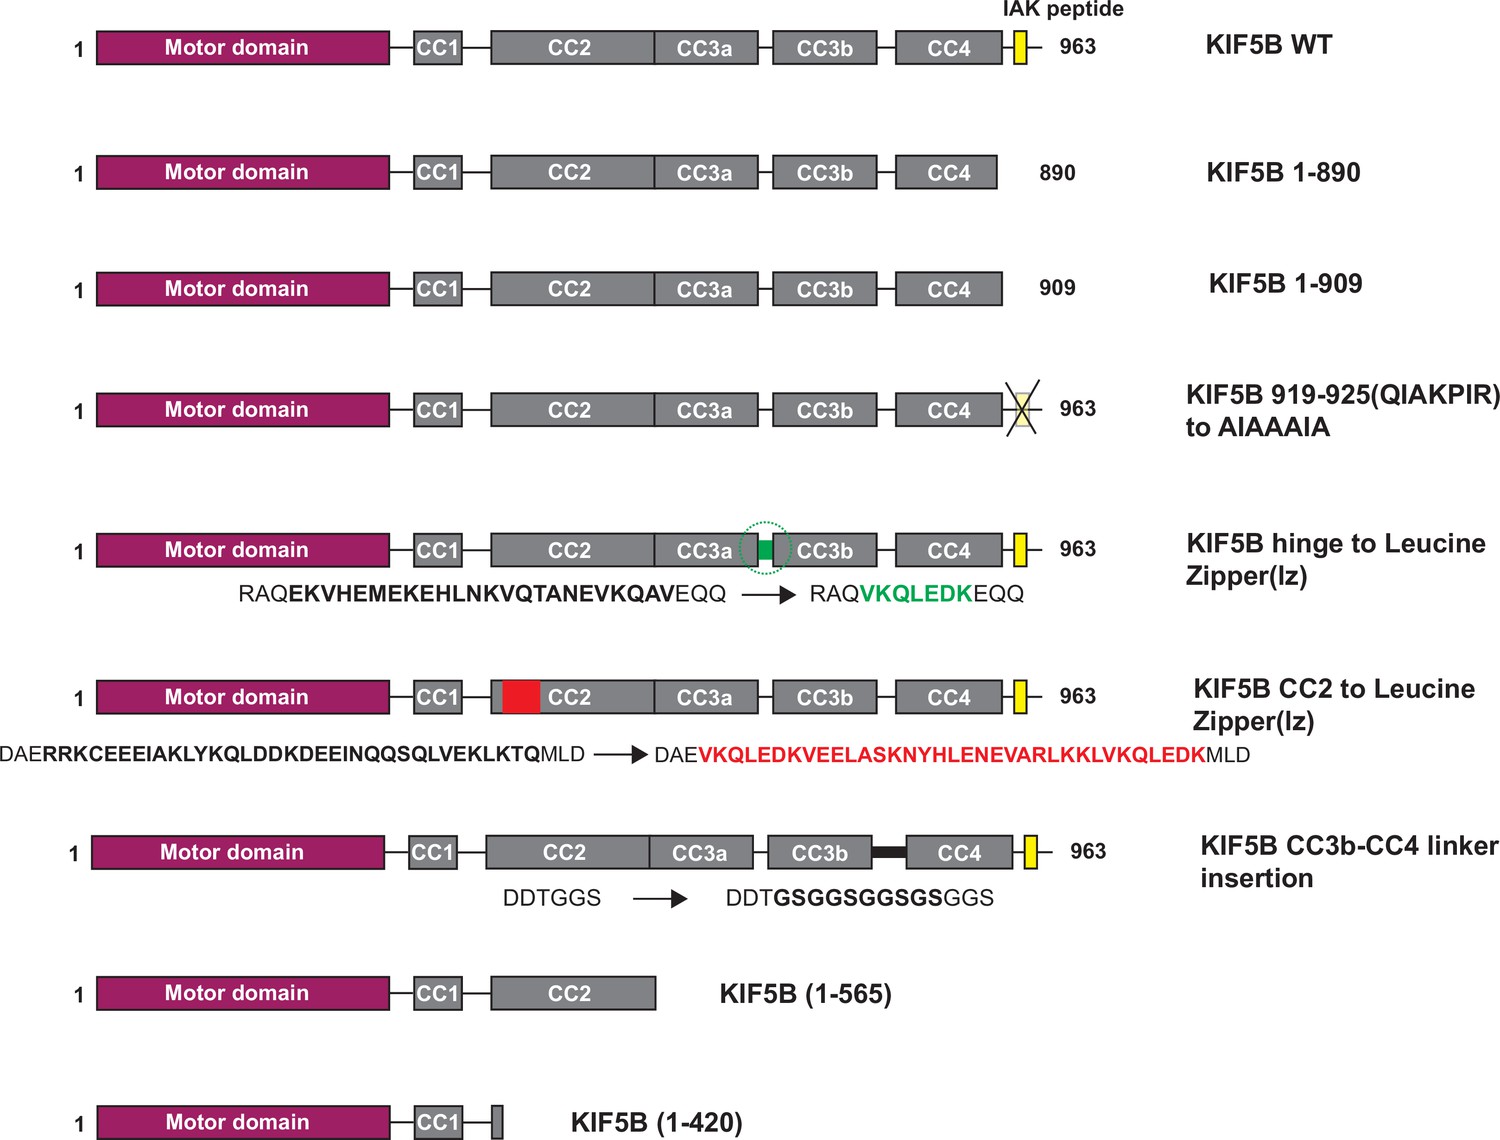
Description of KIF5B constructs used in the single-molecule motility assay.
Figure 6
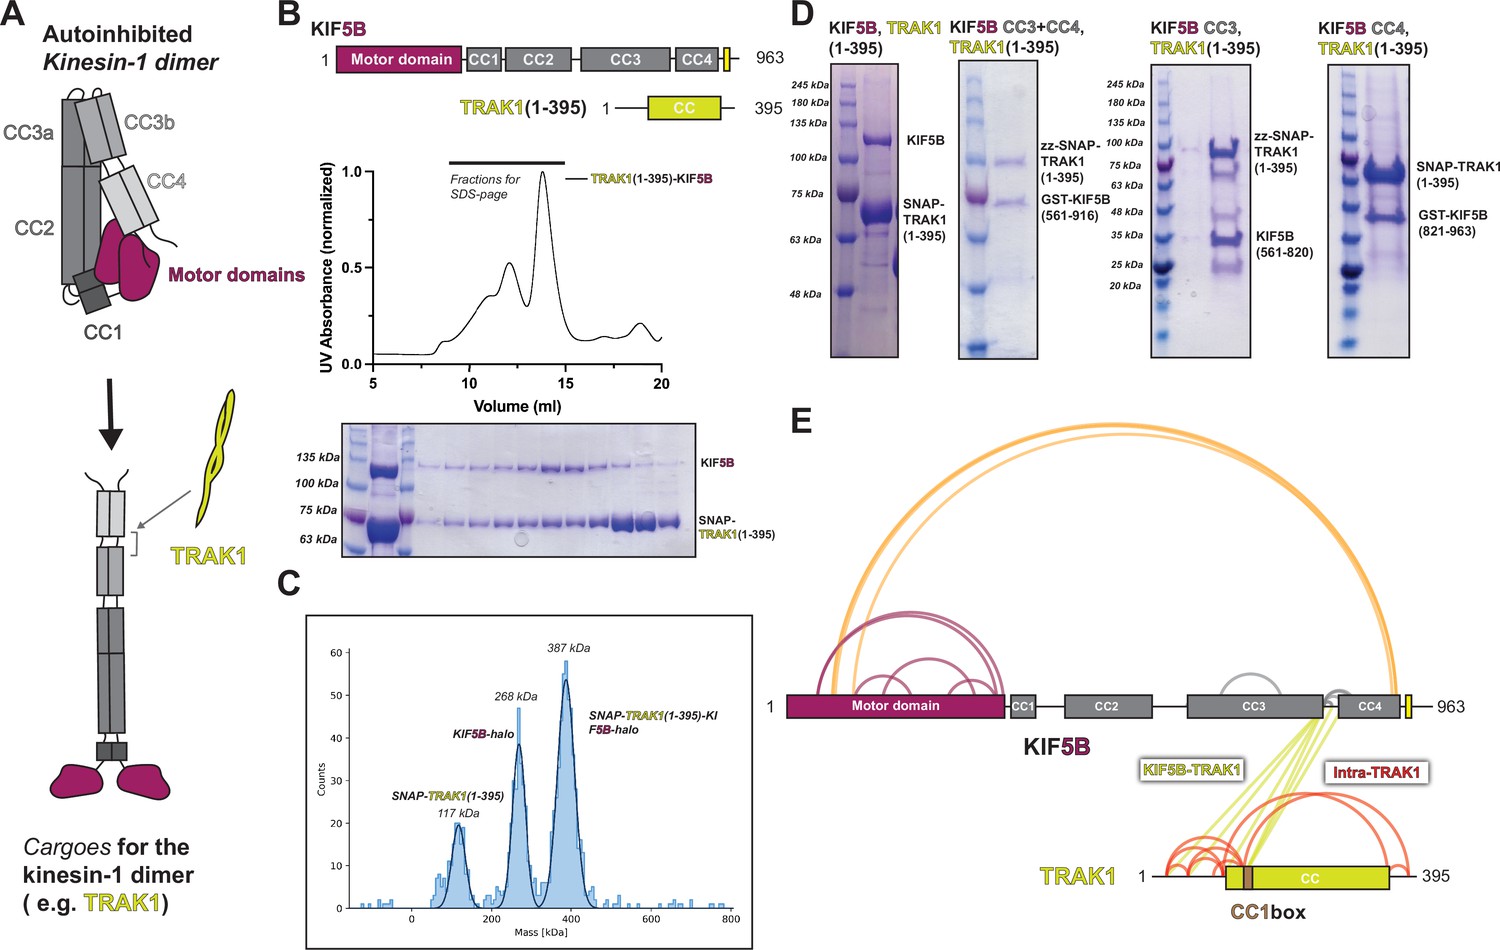
TRAK1 interacts with KIF5B with the same location as KLC1 and opens up KIF5B.
(A) Proposed model of TRAK1 opening up KIF5B. (B) The size-exclusion chromatography profile of TRAK1(1–395)-KIF5B complex and the corresponding SDS-PAGE analysis. (C) The in vitro pull-down assay between different KIF5B fragments and TRAK1(1–395). (D) The mass photometry result for the TRAK1(1–395)-KIF5B complex. (E) The crosslinking mass spectrometry (XL-MS) results of TRAK1(1–395)-KIF5B.
-
Figure 6—source data 1
XL-MS data for TRAK1-KIF5B.
- https://cdn.elifesciences.org/articles/86776/elife-86776-fig6-data1-v1.zip
Figure 7
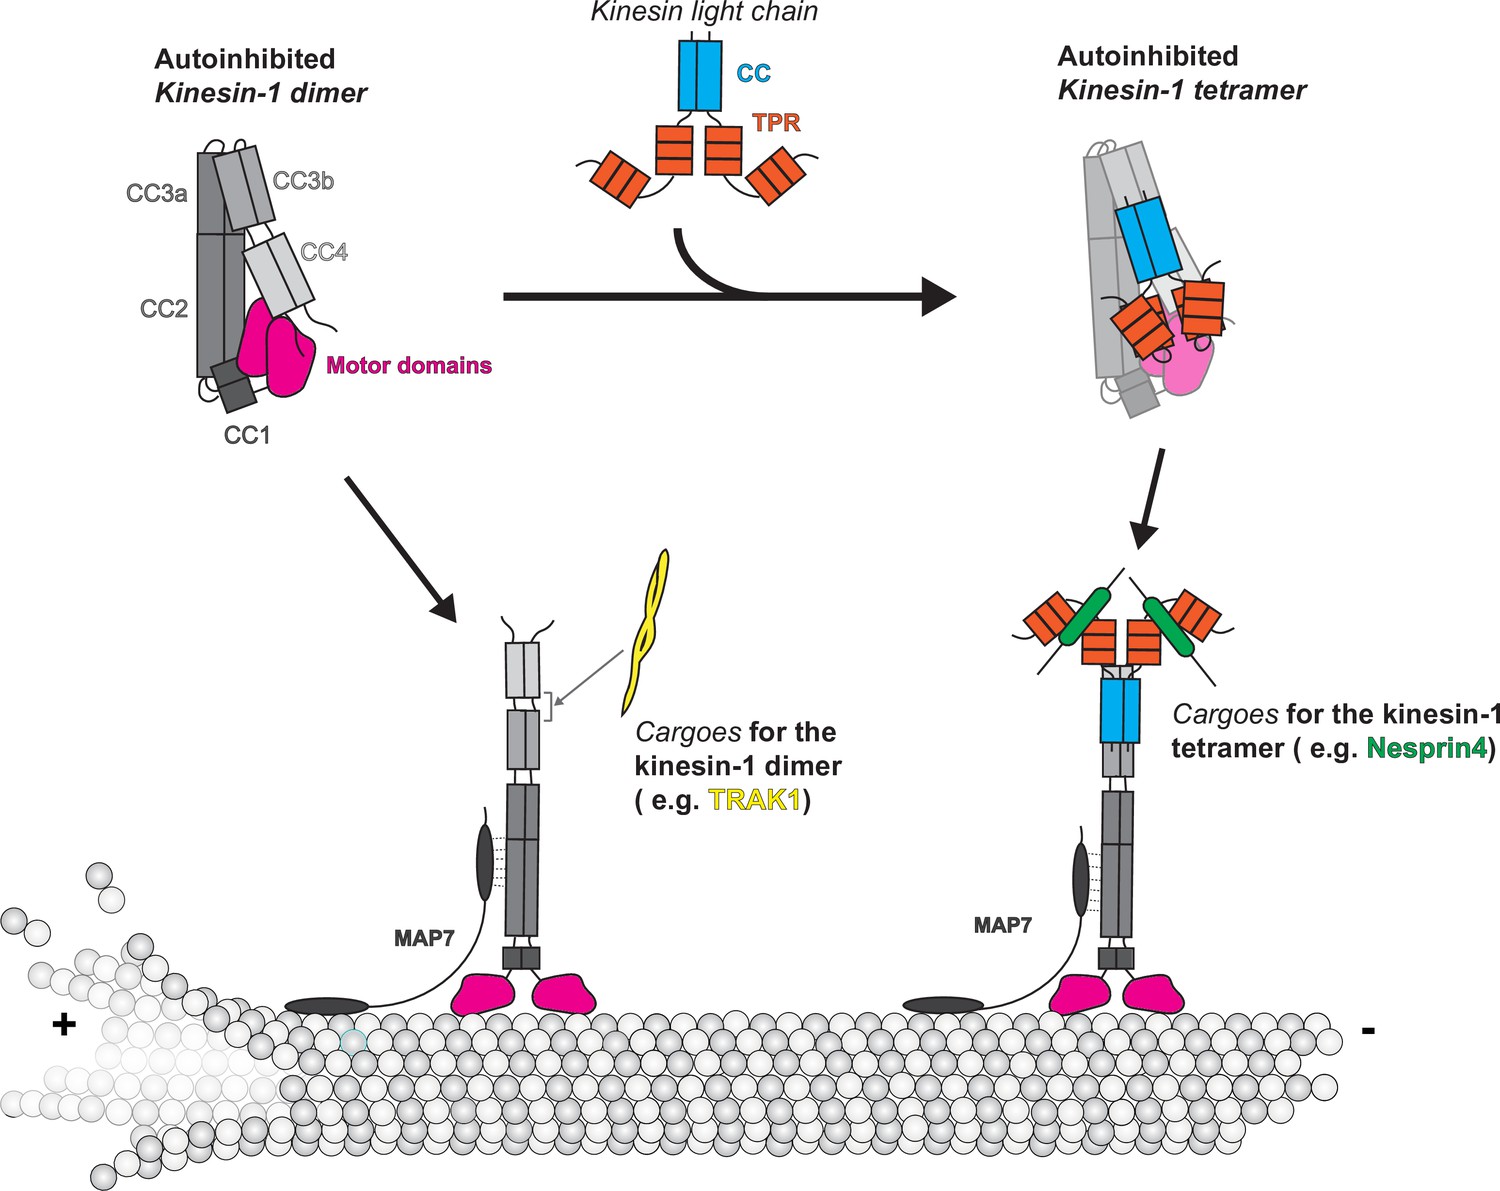
Model of kinesin autoinhibition and activation.
Author response image 1
Crosslinked lysine pairs in KIF5B-KLC1 were mapped onto the domain diagram.
Author response image 2

Crosslinked lysine pairs in KIF5C-KLC1 were mapped onto the domain diagram.
Additional files
Download links
A two-part list of links to download the article, or parts of the article, in various formats.
Downloads (link to download the article as PDF)
Open citations (links to open the citations from this article in various online reference manager services)
Cite this article (links to download the citations from this article in formats compatible with various reference manager tools)
Autoinhibited kinesin-1 adopts a hierarchical folding pattern
eLife 12:RP86776.
https://doi.org/10.7554/eLife.86776.3


