The differentiation and integration of the hippocampal dorsoventral axis are controlled by two nuclear receptor genes
- Precise Genome Engineering Center, School of Life Sciences, Guangzhou University, China
- Guangzhou Laboratory/Bioland Laboratory, China
- CAS Key Laboratory of Regenerative Biology, Guangdong Provincial Key Laboratory of Stem Cell and Regenerative Medicine, Guangdong Institutes of Biomedicine and Health, Chinese Academy of Sciences, China
Figures
Figure 1 with 1 supplement
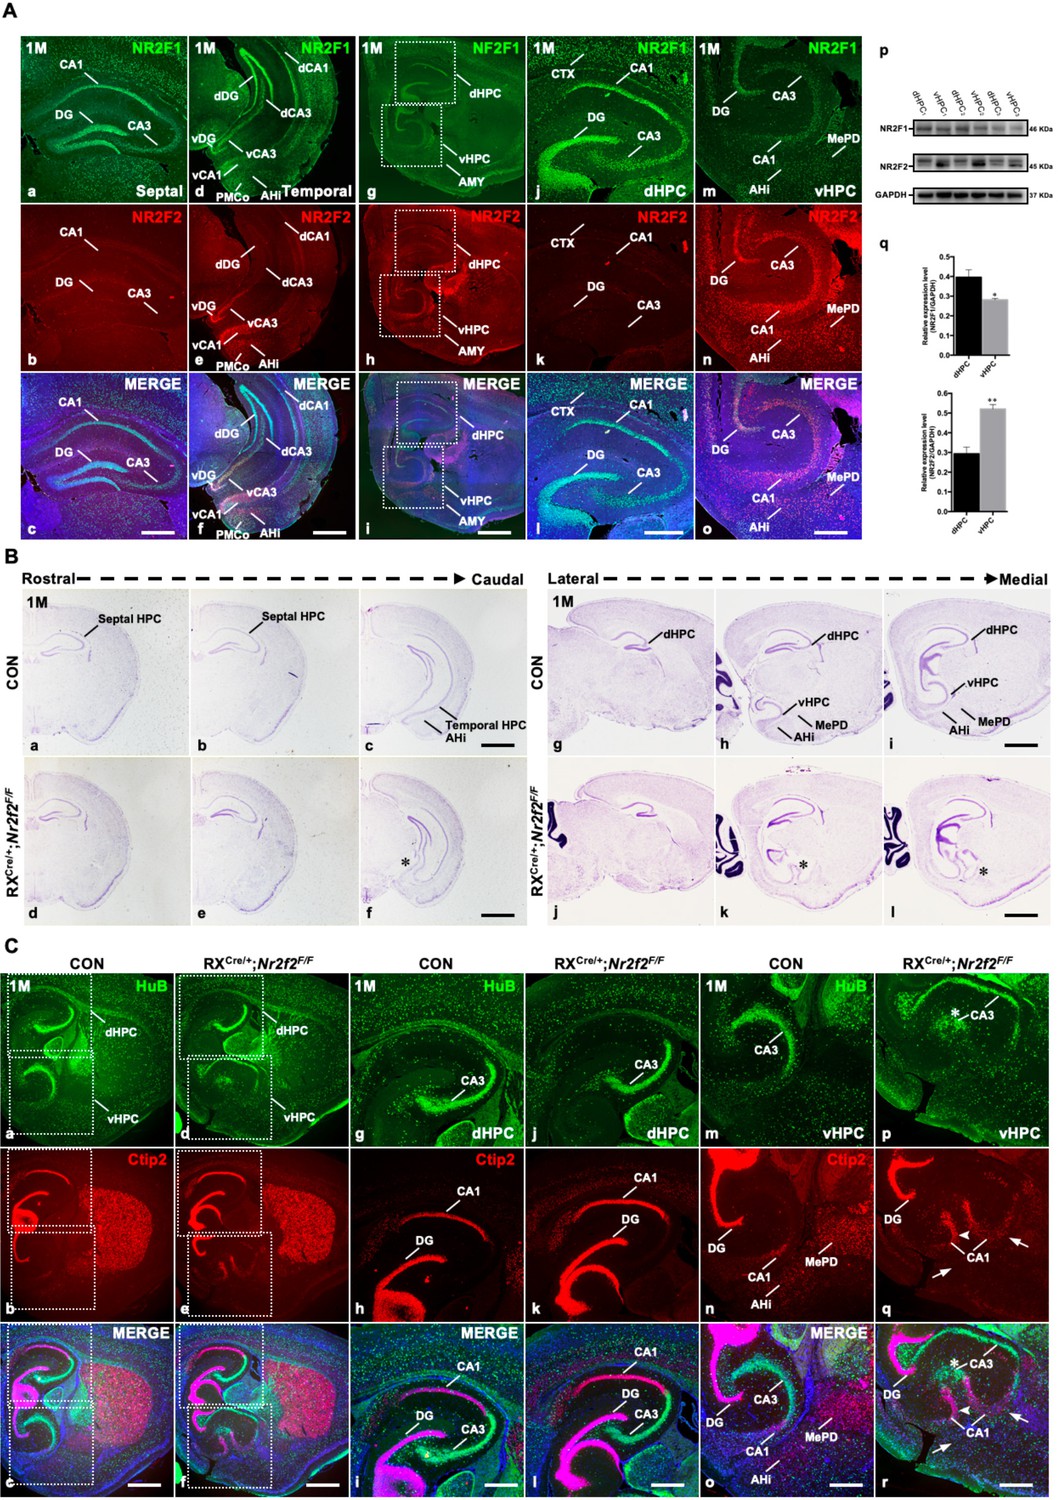
Duplicated CA1 and CA3 domains are generated in the ventral hippocampus of RXCre/+; Nr2f2F/F mutant mice.
(A) The expression of NR2F1 (a, d, g, j, m) and NR2F2 (b, e, h, k, n) in coronal sections (a–f) and sagittal sections (g–o) of the hippocampus at postnatal month 1 (1M); representative western blots and quantitative densitometry data for the expression of NR2F1 and NR2F2 in the dorsal and ventral hippocampus at 1M (p–q). Data are presented as mean ± SEM. Student’s t test was used in q, *P<0.05, **P<0.01; n represents separate experiments, n=3. (B) In coronal sections along the rostrocaudal axis (a–f) and sagittal sections along the lateral-medial axis (g–l) of the hippocampus in mutant mice, compared with that in control mice (a–c, g–i), the ectopic CA-like structure, indicated by the star, was observed in the ventral region in Nr2f2 gene mutant (RXCre/+; Nr2f2F/F) mice at 1M (d–f, j–l). (C) The expression of HuB and Ctip2 in the corresponding inserted area in (a–f) under a high-magnification objective lens at 1M (g–r); compared with those of control mice (a–c, g–i, m–o), the duplicated HuB-positive CA3 domain, indicated by the star, and Ctip2-positive domains, indicated by the arrowhead, were specifically observed in the ventral hippocampus (d–f, p–r) but not in the dorsal hippocampus (d–f, j–l) of Nr2f2 mutant mice at 1M; Ctip2-positive AHi and MePD amygdaloid nuclei were barely observed in the Nr2f2 mutant mice, indicated by the arrows, instead of the ectopic CA domains at the prospective amygdaloid regions (e–f, q–r). AHi, amygdalohippocampal area; AMY, amygdala nuclei; CTX, cortex; dCA1, dorsal CA1; dCA3, dorsal CA3; dDG, dorsal dentate gyrus; dHPC, dorsal hippocampus; MePD, posterodorsal part of the medial amygdaloid nucleus; PMCo, posteromedial cortical amygdaloid nucleus; vCA1, ventral CA1; vCA3, ventral CA3; vDG, ventral dentate gyrus; vHPC, ventral hippocampus. Scale bars, (Aa–c, Ad–f, Aj–o, Cg–r), 100 μm; (Ag–i, Ba–l, Ca–f), 200 μm.
-
Figure 1—source data 1
The Nissl staining results of the control and RXCre/+; Nr2f2F/F mutant mice at 1M (part 1); the expression of HuB and Ctip2 in the hippocampus of the control and RXCre/+; Nr2f2F/F mutant mice at 1M (part 1).
- https://cdn.elifesciences.org/articles/86940/elife-86940-fig1-data1-v1.zip
-
Figure 1—source data 2
The expression of NR2F1 and NR2F2 in coronal sections and sagittal sections of the mouse brain at 1M (part 1); the expression of HuB and Ctip2 in the hippocampus of the control and RXCre/+; Nr2f2F/F mutant mice at 1M (part 2).
- https://cdn.elifesciences.org/articles/86940/elife-86940-fig1-data2-v1.zip
-
Figure 1—source data 3
The expression of NR2F1 and NR2F2 in coronal sections and sagittal sections of the mouse brain at 1M (part 2).
- https://cdn.elifesciences.org/articles/86940/elife-86940-fig1-data3-v1.zip
-
Figure 1—source data 4
The expression of NR2F1 and NR2F2 in sagittal sections of the mouse brain at 1M (part 1).
- https://cdn.elifesciences.org/articles/86940/elife-86940-fig1-data4-v1.zip
-
Figure 1—source data 5
The expression of NR2F1 and NR2F2 in sagittal sections of the mouse brain at 1M (part 2); the Nissl staining results of the control and RXCre/+; Nr2f2F/F mutant mice at 1M (part 2).
- https://cdn.elifesciences.org/articles/86940/elife-86940-fig1-data5-v1.zip
-
Figure 1—source data 6
The expression of NR2F1 and NR2F2 in sagittal sections of the mouse brain at 1M (part 3); western blots data for the expression of NR2F1 and NR2F2 in the dorsal and ventral hippocampus at 1M; the Nissl staining results of the control and RXCre/+; Nr2f2F/F mutant mice at 1M (part 3).
- https://cdn.elifesciences.org/articles/86940/elife-86940-fig1-data6-v1.zip
Figure 1—figure supplement 1
The expression of Nr2f genes in the early developing hippocampus and different conditional knock mouse models.
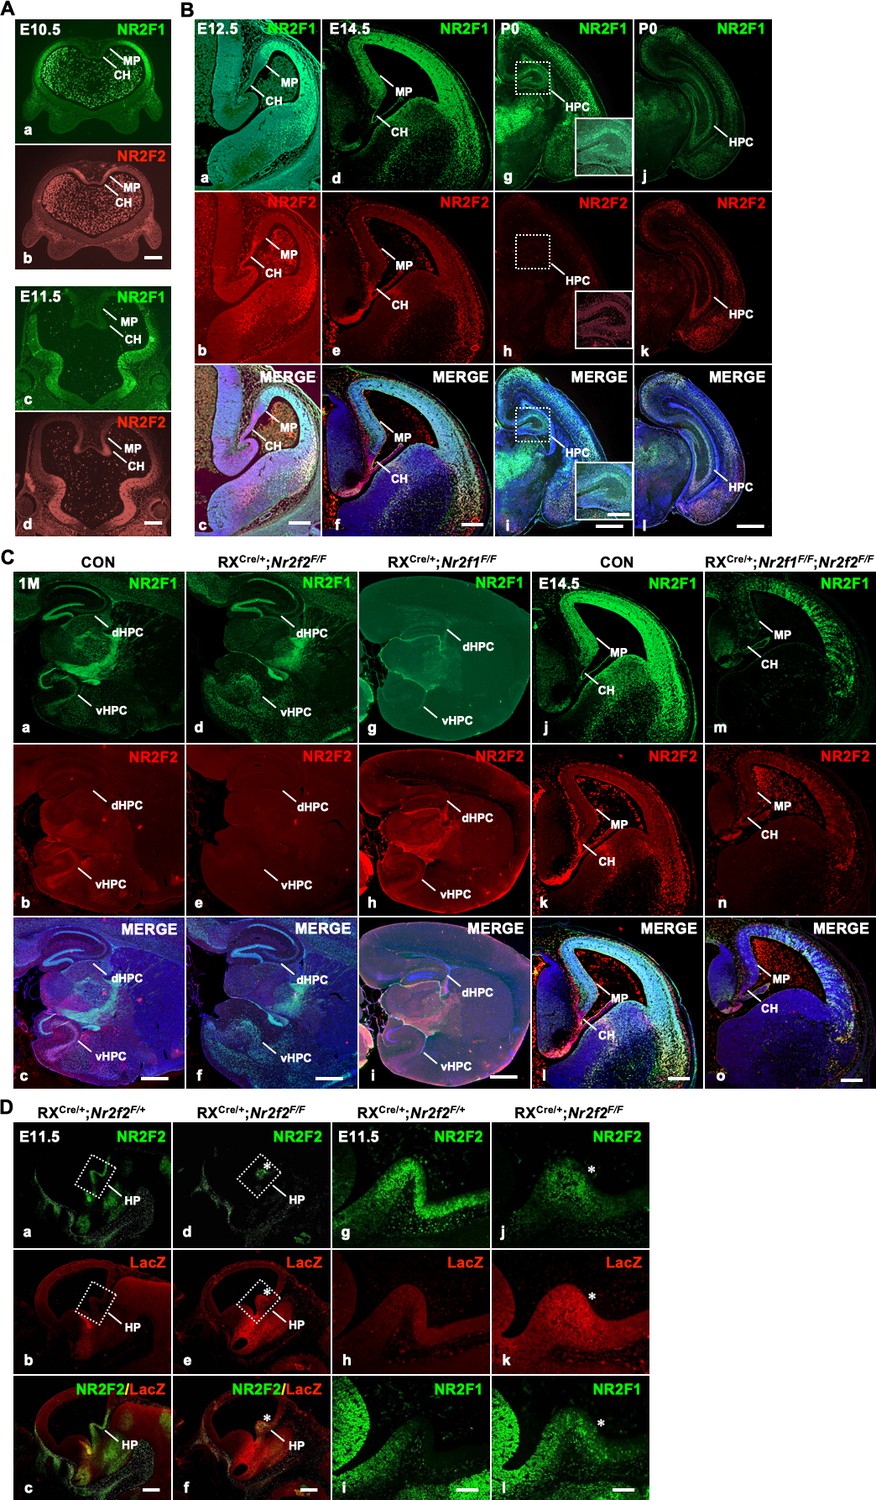
(A) The expression of Nr2f1 and Nr2f2 genes in the forebrain at E10.5 (a, b) and E11.5 (c, d). (B) The expression of Nr2f1 and Nr2f2 genes in the developing hippocampus at E12.5 (a–c), E14.5 (d–f), and P0 (g–l). (C) Compared with that of control mice (a–c), Nr2f2 is efficiently deleted by RXCre recombinase in the hippocampus of Nr2f2 mutant mice at 1M (d–f); Nr2f1 is clearly deleted by RXCre recombinase in the hippocampus of Nr2f1 mutant mice at 1M (g–i). Compared with that of control mice (j–l), NR2F1 and NR2F2 were efficiently deleted by RXCre recombinase at the hippocampal primordium, including the MP and CH, in Nr2f1/2 double-mutant mice at E14.5 (m–o). (D) Compared with that of the control mice (a–c, g–h), the expression of Nr2f2 was significantly decreased in the hippocampal primordium of the homozygous mutant mice at E11.5; meanwhile, the LacZ signals obviously increased in the Nr2f2 homozygous mutant mice at E11.5 (d–f, j–k). Compared with that of the control mice (i), the expression of NR2F1 is activated in the caudal hippocampal primordium of the homozygous mutant mice at E11.5 (l). CH, cortical hem; dHPC, dorsal hippocampus; HP, hippocampal primordium; HPC, hippocampus; MP, medial pallium; vHPC, ventral hippocampus. Scale bars, (Aa–d, Ba–f, Bg-i (insets), Cj–o), 200 μm; (Bg–l, Ca–i, Dg–l), 100 μm; (Da–f), 250 μm.
-
Figure 1—figure supplement 1—source data 1
The expression of Nr2f1 and Nr2f2 genes in the developing hippocampus at E12.5; the deletion efficiency of RXCre recombinase in the hippocampus of RXCre/+; Nr2f2F/F, RXCre/+; Nr2f1F/F, and RXCre/+; Nr2f1F/F; Nr2f2F/F mice (part 1).
- https://cdn.elifesciences.org/articles/86940/elife-86940-fig1-figsupp1-data1-v1.zip
-
Figure 1—figure supplement 1—source data 2
The expression of Nr2f1 and Nr2f2 genes in the telencephalon at E10.5, E11.5, E14.5, and P0; the deletion efficiency of RXCre recombinase in the hippocampus of RXCre/+; Nr2f2F/F, RXCre/+; Nr2f1F/F, and RXCre/+; Nr2f1F/F; Nr2f2F/F mice (part 2).
- https://cdn.elifesciences.org/articles/86940/elife-86940-fig1-figsupp1-data2-v1.zip
Figure 2 with 1 supplement
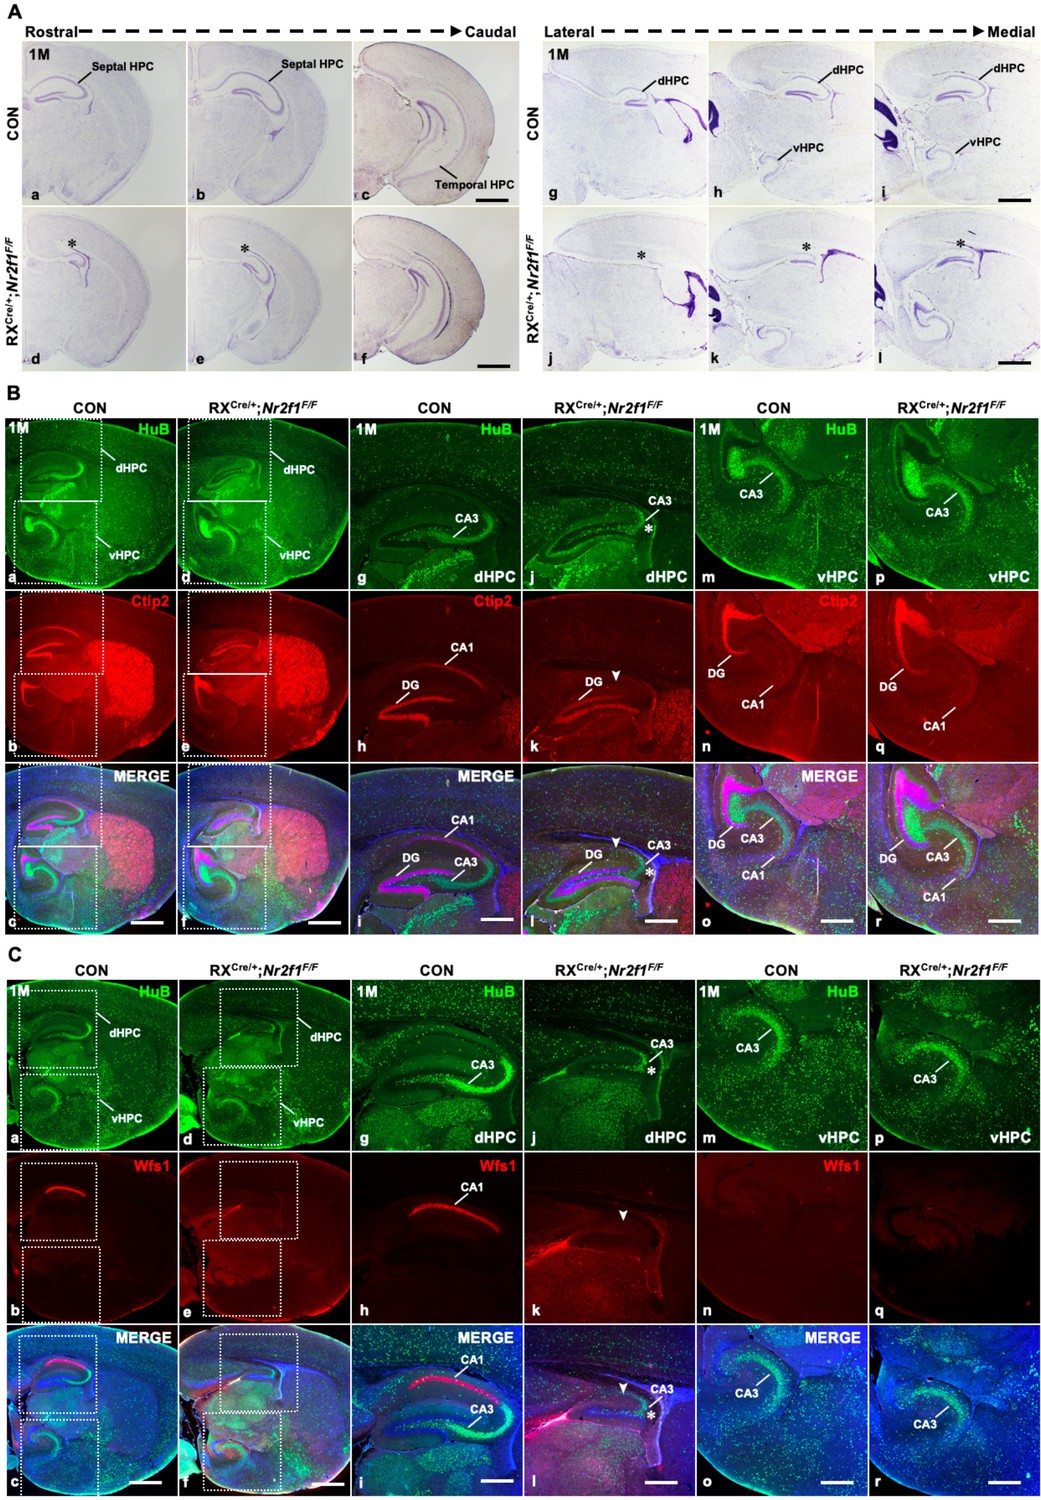
The specification and differentiation of the dorsal CA1 lineage failed with the dysplastic dorsal hippocampus in RXCre/+; Nr2f1F/F mutant mice.
(A) In coronal sections along the rostrocaudal axis (a–f) and sagittal sections along the lateral–medial axis (g–l) of the hippocampus, compared with that of control mice (a–c, g–i), the dorsal hippocampus was shrunken, indicated by the star, in Nr2f1 gene mutant (RXCre/+; Nr2f1F/F) mice at 1M (d–f, j–l). (B) The expression of HuB and Ctip2 in the corresponding inserted area in (a–f) under a high-magnification objective lens at 1M (g–r); compared with that of control mice (a–c, g–i, m–o), the HuB-positive CA3 domain was reduced in the dorsal hippocampus, especially the Ctip2-positive dorsal CA1, which was barely detected in Nr2f1 mutant mice at 1M (d–f, j–l), while their expression in the ventral hippocampus was comparable between the controls and mutants (d–f, p–r). (C) The expression of HuB and Wfs1 in the corresponding inserted area in (a–f) under a high-magnification objective lens at 1M (g–r); the expression of HuB and the dCA1 marker Wfs1 in the control (a–c, g–i, m–o) and Nr2f2 mutant mice (d–f, j–l, p–r) at 1M. Wfs1-positive dorsal CA1 could not be detected in Nr2f1 mutant mice at 1M, as indicated by the arrowhead. dHPC, dorsal hippocampus; HPC, hippocampus; vHPC, ventral hippocampus. Scale bars, (Aa–l, Ba–f, Ca–f), 200 μm; (Bg–r, Cg–r), 100 μm.
-
Figure 2—source data 1
The Nissl staining results of the control and RXCre/+; Nr2f1F/F mutant mice at 1M (part 1).
- https://cdn.elifesciences.org/articles/86940/elife-86940-fig2-data1-v1.zip
-
Figure 2—source data 2
The Nissl staining results of the control and RXCre/+; Nr2f1F/F mutant mice at 1M (part 2); the expression of HuB and Wfs1 in the hippocampus of the control and RXCre/+; Nr2f1F/F mutant mice at 1M.
- https://cdn.elifesciences.org/articles/86940/elife-86940-fig2-data2-v1.zip
-
Figure 2—source data 3
The expression of HuB and Ctip2 in the hippocampus of the control and RXCre/+; Nr2f1F/F mutant mice at 1M.
- https://cdn.elifesciences.org/articles/86940/elife-86940-fig2-data3-v1.zip
-
Figure 2—source data 4
The expression of HuB, Wfs1, and Ctip2 in the hippocampus of the control and RXCre/+; Nr2f1F/F mutant mice at 1M.
- https://cdn.elifesciences.org/articles/86940/elife-86940-fig2-data4-v1.zip
Figure 2—figure supplement 1
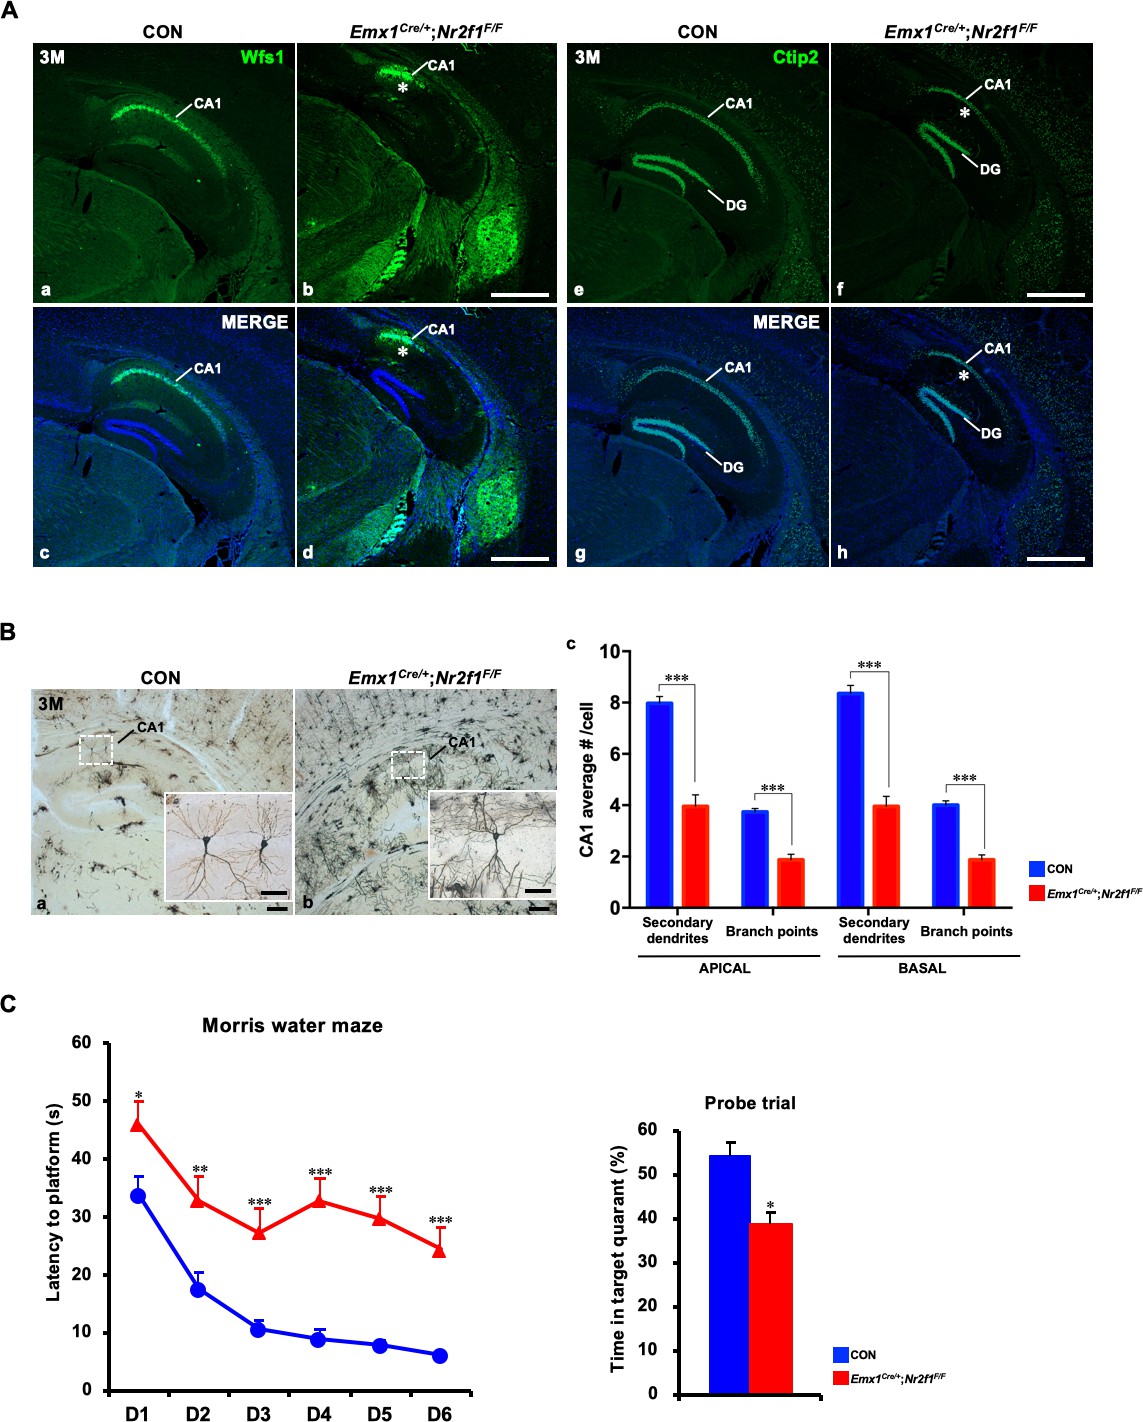
Defects in Emx1Cre/+; Nr2f1F/F mutant mice.
(A) Immunofluorescence staining data showed that compared with those of control mice (a, c, e, g), the proportions of either the Wfs1- or Ctip2-positive dorsal CA1 domain were reduced in Emx1Cre/+; Nr2f1F/F mutant mice at 3M (b, d, f, h). (B) Golgi staining showed that compared with those of controls, the numbers of branch points and secondary dendrites of both apical and basal dendrites were significantly reduced in the dorsal hippocampal CA1 pyramidal neurons of Emx1Cre/+; Nr2f1F/F mutant mice (a–c). Data are presented as mean ± SEM. Student’s t test was used in c, ***P<0.001; n represents separate experiments, n=3. (C) The Morris water maze behavior test showed that compared with that of controls, spatial learning and memory were significantly damaged in Emx1Cre/+; Nr2f1F/F mutant mice. Data are presented as mean ± SEM. Student’s t test was used in C, *p<0.05, **p<0.01, ***p<0.001; n represents animal number used in the experiments, n=12 (CON) and n=8 (Emx1Cre/+; Nr2f1F/F), 10 weeks or older adult male mice. Scale bars, (Aa–h), 100 μm; (Ba–b), 50 μm; (Ba-b (insets)), 200 μm.
-
Figure 2—figure supplement 1—source data 1
The expression of Wfs1 and Ctip2 in the dorsal hippocampus of the control and Emx1Cre/+; Nr2f1F/F mutant mice at 3M; Golgi staining results of the dorsal hippocampal CA1 pyramidal neurons and Morris water maze behavior test data of the control and Emx1Cre/+; Nr2f1F/F mutant mice.
- https://cdn.elifesciences.org/articles/86940/elife-86940-fig2-figsupp1-data1-v1.zip
Figure 3 with 1 supplement
Defects in the hippocampus in RXCre/+; Nr2f1F/F; Nr2f2F/F double-gene mutant mice.
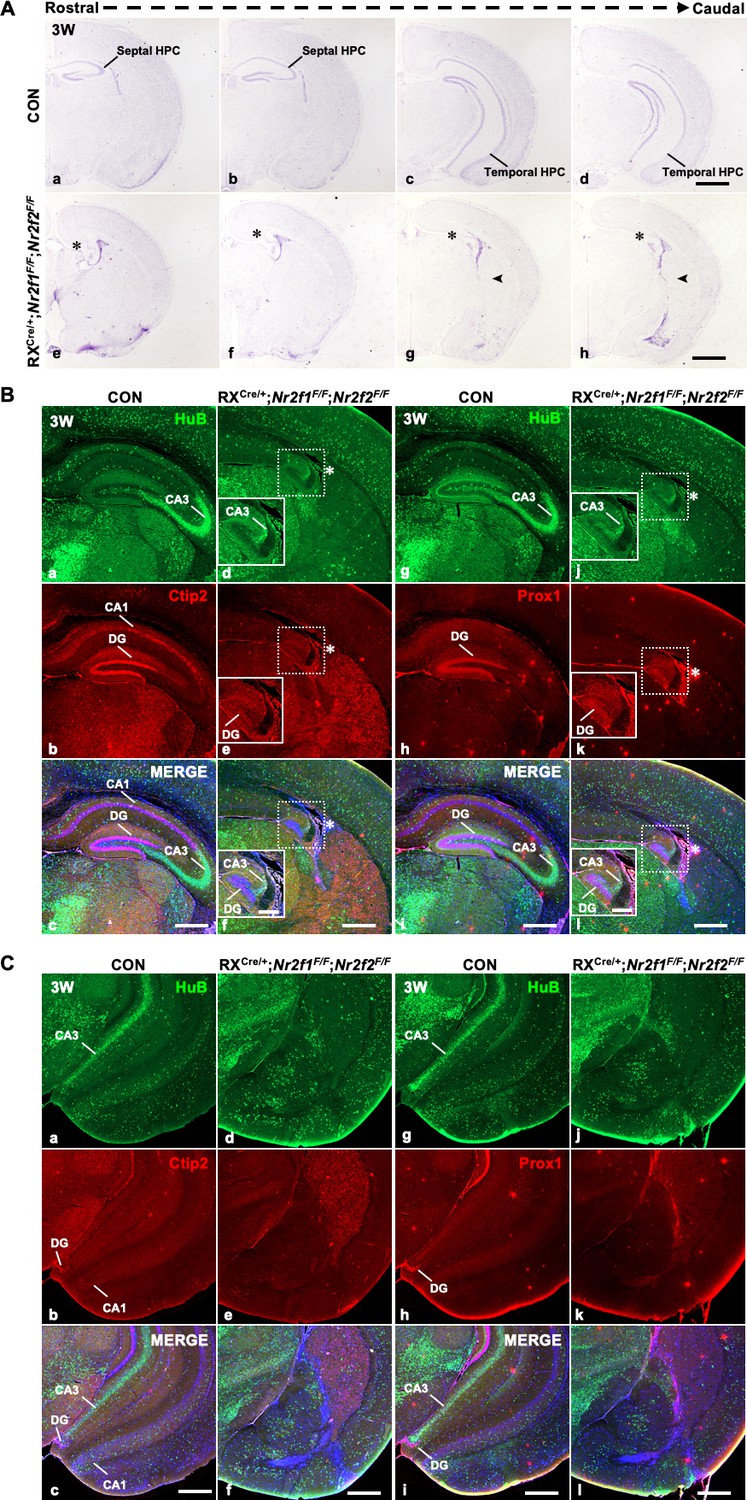
(A) In coronal sections along the rostrocaudal axis, compared with control mice (a–d), the hippocampus was atrophic in RXCre/+; Nr2f1F/F; Nr2f2F/F double-mutant mice, indicated by the star, and an ectopic unknown nucleus was observed in the caudal plates, indicated by the arrowhead (e–h). (B) Compared with that of control mice (a–c, g–i), the expression of HuB, Ctip2, and Prox1 was decreased in the hippocampus of Nr2f1/2 double-gene mutant mice at 3 weeks postnatal (3W) (d–f, j–l). (C) Compared with that of control mice (a–c, g–i), the expression of HuB could not be detected in the presumptive CA3 domain, and the expression of Ctip2 or Prox1 could not be detected in the presumptive DG domain of the prospective ventral hippocampus of RXCre/+; Nr2f1F/F; Nr2f2F/F double-mutant mice. Scale bars, (Aa–h), 200 μm; (Ba–l, Ca–l), 100 μm; (Bd-f (insets), Bj-l (insets)), 400 μm.
-
Figure 3—source data 1
The Nissl staining results of the control and RXCre/+; Nr2f1F/F; Nr2f2F/F double-gene mutant mice at 3W.
- https://cdn.elifesciences.org/articles/86940/elife-86940-fig3-data1-v1.zip
-
Figure 3—source data 2
The expression of HuB and Ctip2 in the hippocampus of the control and RXCre/+; Nr2f1F/F; Nr2f2F/F double-gene mutant mice at 3W.
- https://cdn.elifesciences.org/articles/86940/elife-86940-fig3-data2-v1.zip
-
Figure 3—source data 3
The expression of HuB and Prox1 in the hippocampus of the control and RXCre/+; Nr2f1F/F; Nr2f2F/F double-gene mutant mice at 3W.
- https://cdn.elifesciences.org/articles/86940/elife-86940-fig3-data3-v1.zip
-
Figure 3—source data 4
The expression of HuB, Ctip2, and Prox1 in the hippocampus of the control and RXCre/+; Nr2f1F/F; Nr2f2F/F double-gene mutant mice at 3W.
- https://cdn.elifesciences.org/articles/86940/elife-86940-fig3-data4-v1.zip
Figure 3—figure supplement 1
Adult neurogenesis was abnormal in the hippocampi of Nr2f1/2 double-gene mutant mice.
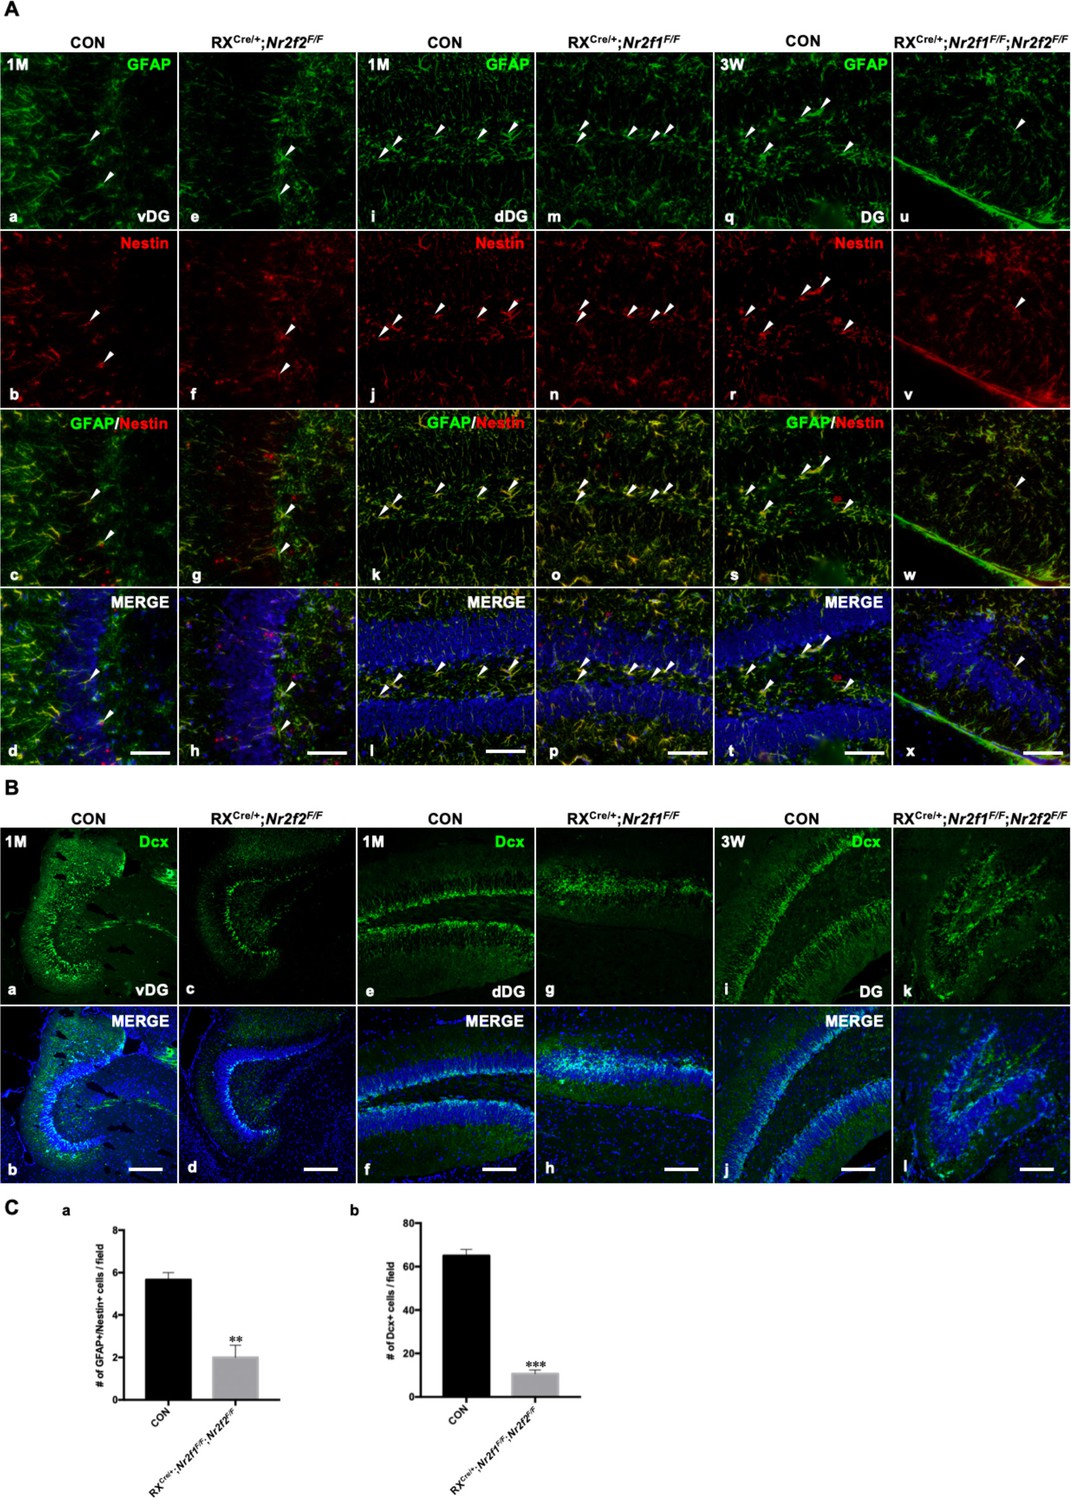
(A) The expression of GFAP and Nestin, markers of NSCs, in the SGZ of the vDG in control and Nr2f2 mutant mice at 1M (a–h), in the SGZ of the dDG in control and Nr2f1 mutant mice at 1M (i–p) and in the SGZ of the DG in control and Nr2f1/2 double-gene mutant mice at 3W (q–x). (B) The expression of Dcx, a marker of newborn neurons, in the SGZ of the vDG in control and Nr2f2 mutant mice at 1M (a–d), in the SGZ of the dDG in control and Nr2f1 mutant mice at 1M (e–h) and in the SGZ of the DG in control and Nr2f1/2 double-gene mutant mice at 3W (i–l). (C) Quantitative analysis of GFAP/Nestin-positive cells (a) and Dcx-positive cells (b) in the SGZ of the DG in control and Nr2f1/2 double-gene mutant mice at 3W. The numbers of GFAP and Nestin double-positive NSCs and Dcx-positive newborn neurons were significantly reduced in double-mutant mice. Data are presented as mean ± SEM. Student’s t-test was used in C, **p<0.01, ***p<0.001; n represents separate experiments, n=3. DG, dentate gyrus; dDG, dorsal DG; NSC, neural stem cell; SGZ, subgranular zone; vDG, ventral DG. Scale bars, (Aa–x), 50 μm; (Ba–l), 100 μm.
-
Figure 3—figure supplement 1—source data 1
The expression of GFAP, Nestin, and Dcx in the subgranular zone (SGZ) of ventral dentate gyrus (vDG) in the control and RXCre/+; Nr2f2F/F mutant mice at 1M, in the SGZ of dorsal dentate gyrus (dDG) in the control and RXCre/+; Nr2f1F/F mutant mice at 1M, and in the SGZ of DG in the control and RXCre/+; Nr2f1F/F; Nr2f2F/F double-gene mutant mice at 3W (part 1).
- https://cdn.elifesciences.org/articles/86940/elife-86940-fig3-figsupp1-data1-v1.zip
-
Figure 3—figure supplement 1—source data 2
The expression of GFAP, Nestin, and Dcx in the subgranular zone (SGZ) of ventral dentate gyrus (vDG) in the control and RXCre/+; Nr2f2F/F mutant mice at 1M, in the SGZ of dorsal dentate gyrus (dDG) in the control and RXCre/+; Nr2f1F/F mutant mice at 1M, and in the SGZ of DG in the control and RXCre/+; Nr2f1F/F; Nr2f2F/F double-gene mutant mice at 3W (part 2).
- https://cdn.elifesciences.org/articles/86940/elife-86940-fig3-figsupp1-data2-v1.zip
-
Figure 3—figure supplement 1—source data 3
The expression of GFAP and Nestin in the subgranular zone (SGZ) of ventral dentate gyrus (vDG) in the control and RXCre/+; Nr2f2F/F mutant mice at 1M, in the SGZ of dorsal dentate gyrus (dDG) in the control and RXCre/+; Nr2f1F/F mutant mice at 1M, and in the SGZ of DG in the control and RXCre/+; Nr2f1F/F; Nr2f2F/F double-gene mutant mice at 3W; quantitative analysis of GFAP/Nestin-positive cells in the SGZ of DG in the control and RXCre/+; Nr2f1F/F; Nr2f2F/F double-gene mutant mice at 3W.
- https://cdn.elifesciences.org/articles/86940/elife-86940-fig3-figsupp1-data3-v1.zip
-
Figure 3—figure supplement 1—source data 4
The expression of GFAP, Nestin, and Dcx in the subgranular zone (SGZ) of ventral dentate gyrus (vDG) in the control and RXCre/+; Nr2f2F/F mutant mice at 1M, in the SGZ of dorsal dentate gyrus (dDG) in the control and RXCre/+; Nr2f1F/F mutant mice at 1M, and in the SGZ of DG in the control and RXCre/+; Nr2f1F/F; Nr2f2F/F double-gene mutant mice at 3W (part 3); quantitative analysis of Dcx-positive cells in the SGZ of DG in the control and RXCre/+; Nr2f1F/F; Nr2f2F/F double-gene mutant mice at 3W.
- https://cdn.elifesciences.org/articles/86940/elife-86940-fig3-figsupp1-data4-v1.zip
Figure 4
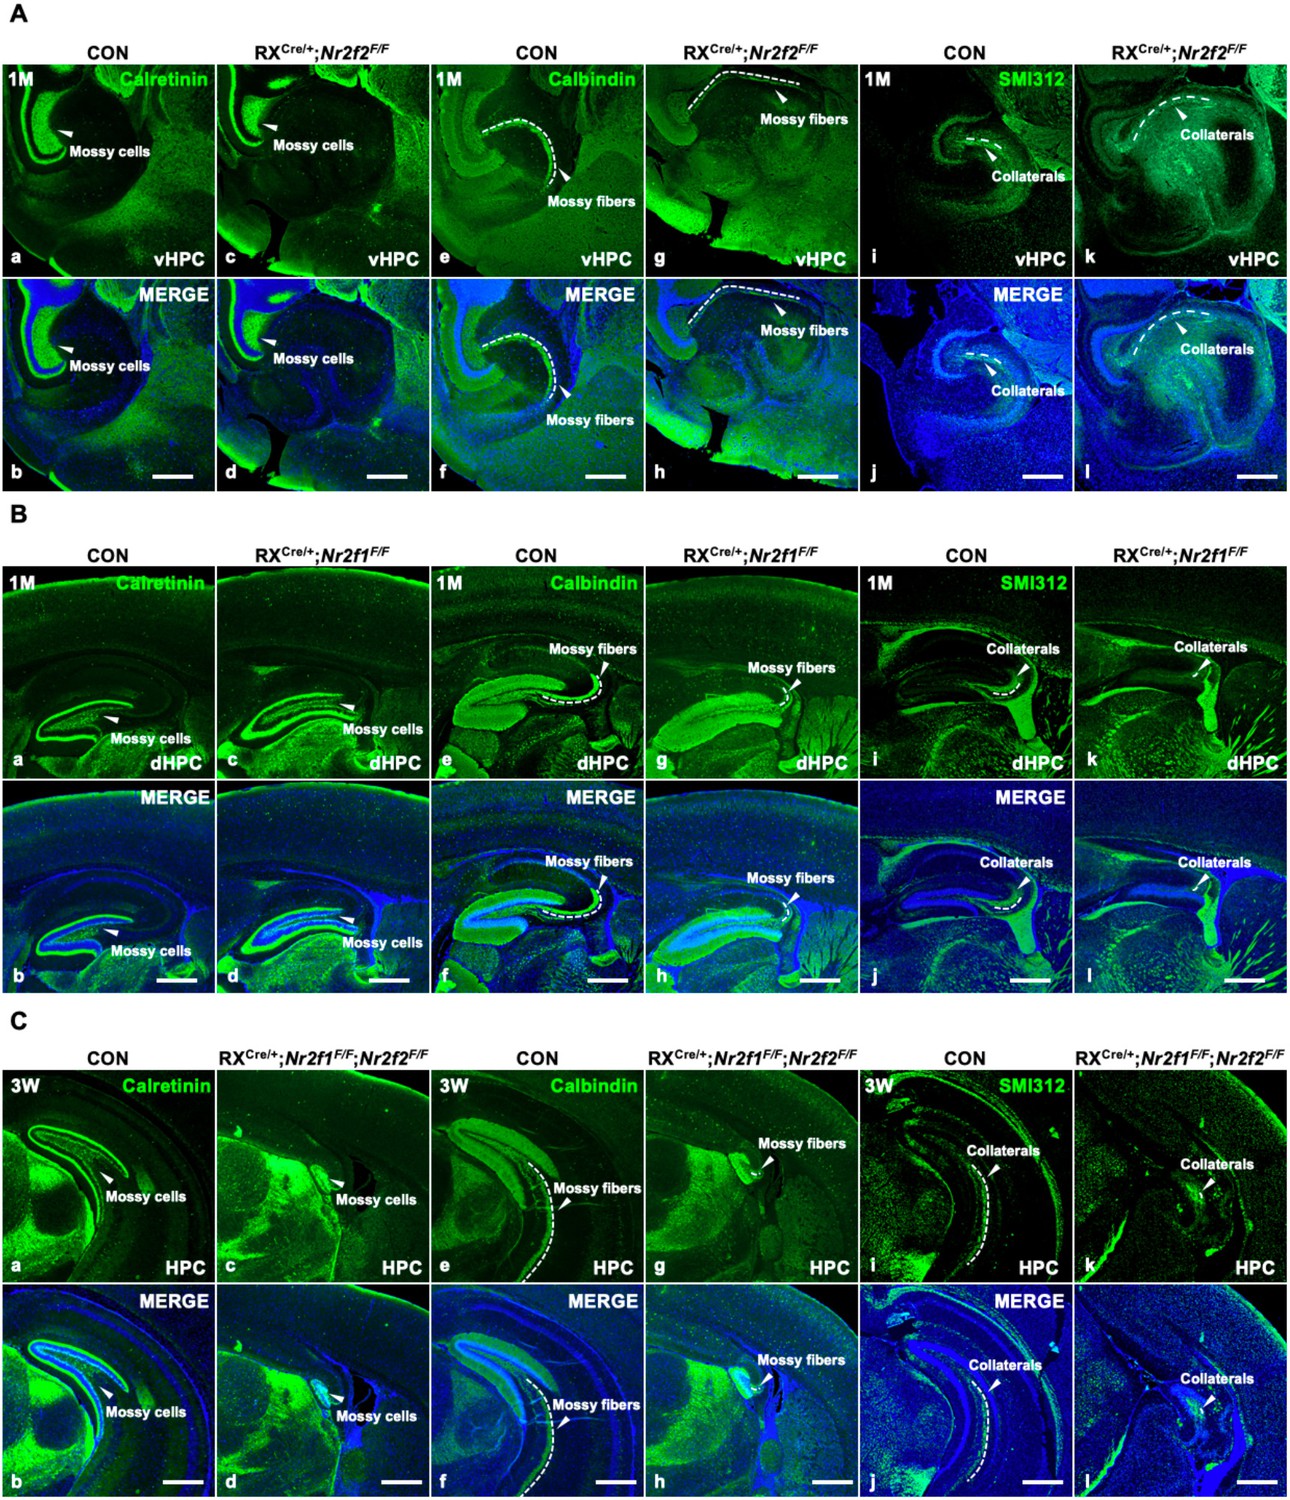
The impairment of hippocampal trisynaptic connectivity in Nr2f2 single-gene, Nr2f1 single-gene, and Nr2f1/2 double-gene mutant mice.
(A) The expression of Calretinin, Calbindin, and SMI312 in the ventral hippocampus of the control (a, b, e, f, i, j) and Nr2f2 single-gene mutant mice (c, d, g, h, k, l). (B) The expression of Calretinin, Calbindin, and SMI312 in the dorsal hippocampus of the control (a, b, e, f, i, j) and Nr2f1 single-gene mutant mice (c, d, g, h, k, l). (C) The expression of Calretinin, Calbindin, and SMI312 in the hippocampus of the control (a, b, e, f, i, j) and Nr2f1/2 double-gene mutant mice (c, d, g, h, k, l). dHPC, dorsal hippocampus; HPC, hippocampus; vHPC, ventral hippocampus. Scale bars, (Aa–l, Ba–l, Ca–l), 100 μm.
-
Figure 4—source data 1
The expression of Calretinin, Calbindin, and SMI312 in the ventral hippocampus of the control and RXCre/+; Nr2f2F/F single-gene mutant mice at 1M.
- https://cdn.elifesciences.org/articles/86940/elife-86940-fig4-data1-v1.zip
-
Figure 4—source data 2
The expression SMI312 in the dorsal hippocampus of the control and RXCre/+; Nr2f1F/F single-gene mutant mice at 1M, and the expression of Calretinin and Calbindin in the hippocampus of the control and RXCre/+; Nr2f1F/F; Nr2f2F/F double-gene mutant mice at 3W.
- https://cdn.elifesciences.org/articles/86940/elife-86940-fig4-data2-v1.zip
-
Figure 4—source data 3
The expression of Calretinin and Calbindin in the dorsal hippocampus of the control and RXCre/+; Nr2f1F/F single-gene mutant mice at 1M, and the expression of SMI312 in the hippocampus of the control and RXCre/+; Nr2f1F/F; Nr2f2F/F double-gene mutant mice at 3W.
- https://cdn.elifesciences.org/articles/86940/elife-86940-fig4-data3-v1.zip
Figure 5 with 1 supplement
Nr2f genes regulate the expression of key genes associated with early hippocampal development.
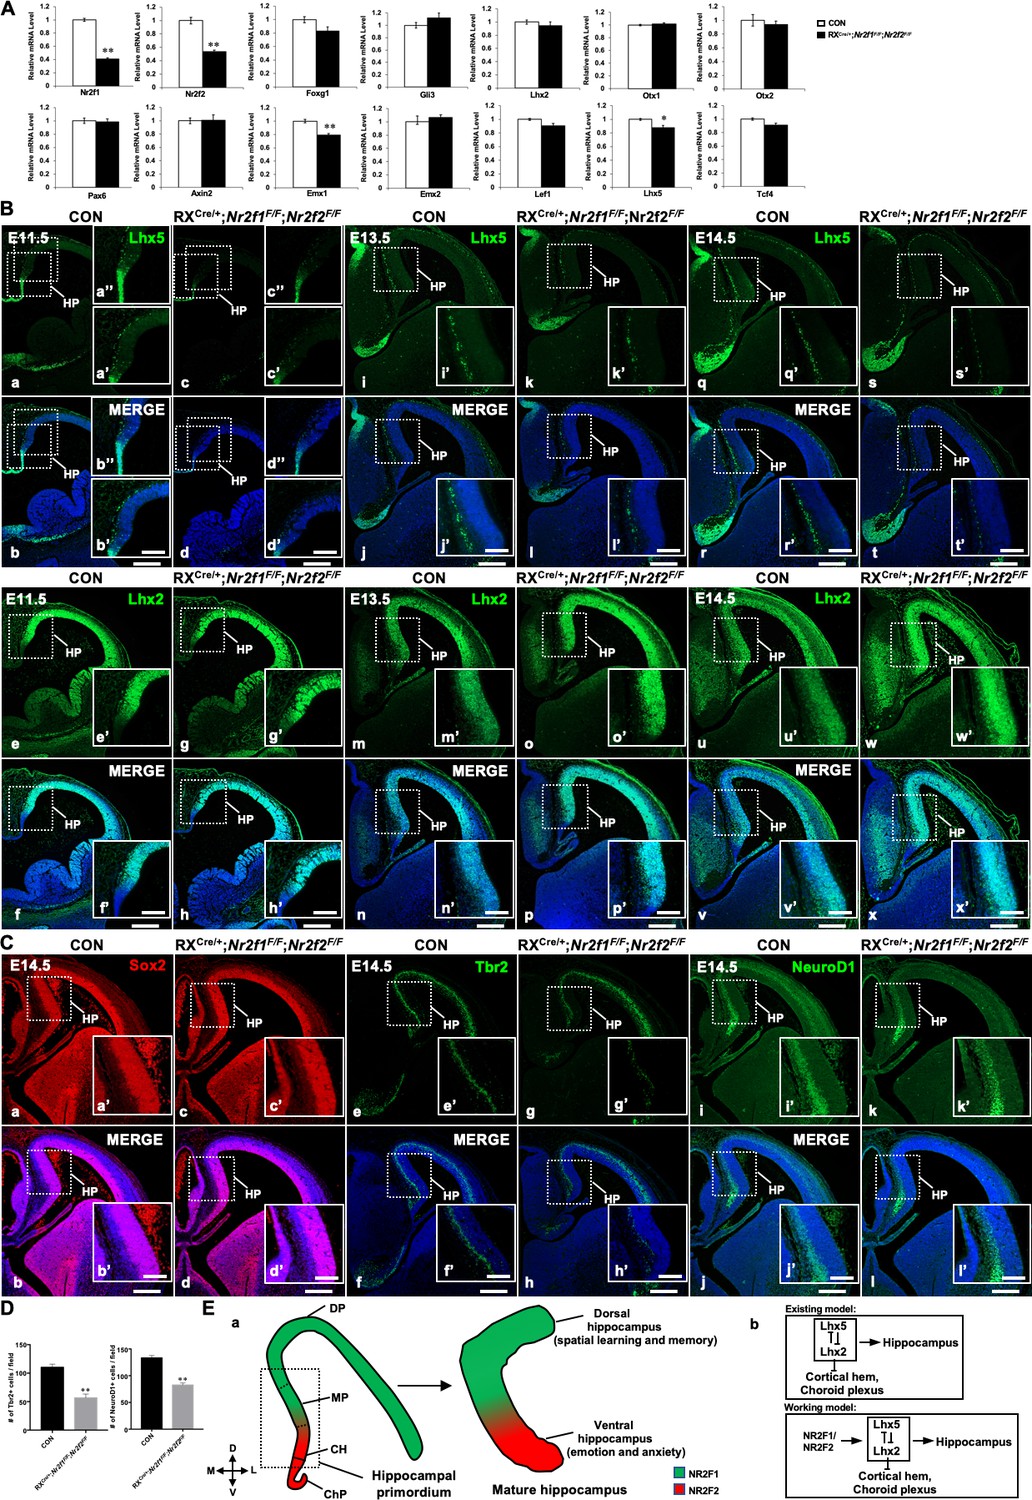
(A) The expression profiles of genes involved in hippocampal development in control and the double-mutant mice at E11.5. Data are presented as mean ± SEM. Student’s t test was used in A, *P<0.05, **P<0.01; n represents separate experiments, n=3. (B) Compared with that of control mice (a, b, a’, b’, a’’, b’’, i, j, i’, j’, q, r, q’, r’), the expression of Lhx5 was reduced in double-mutant mice at E11.5 (c, d, c’, d’, c’’, d’’), E13.5 (k, l, k’, l’), and E14.5 (s, t, s’, t’); the expression of Lhx2 was comparable between the control and double-mutant mice at E11.5 (e–h, e’–h’); and compared with that of control mice (m, n, m’, n’, u, v, u’, v’), the expression of Lhx2 was increased in double-mutant mice at E13.5 (o, p, o’, p’) and E14.5 (w, x, w’, x’). (C) Compared with that of control mice (a, b, a’, b’), the expression of Sox2 was normal in double-mutant mice at E14.5 (c, d, c’, d’); compared with that of control mice (e, f, e’, f’), the expression of Tbr2 was decreased in Nr2f mutant mice at E14.5 (g, h, g’, h’); compared with that of control mice (i, j, i’, j’), the expression of NeuroD1 was reduced in double-mutant mice at E14.5 (k, l, k’, l’). (D) Quantitative analysis of Tbr2-positive cells and NeuroD1-positive cells in (Ce’–h’) and (Ci’–l’). Data are presented as mean ± SEM. Student’s t test was used in D, **P<0.01; n represents separate experiments, n=3. (E), In the hippocampal primordium of the early embryo, Nr2f1 is expressed dorsally in the MP, and Nr2f2 is expressed ventrally in the CH. In the mature hippocampus, the expression of Nr2f1 is higher in the dorsal hippocampus, which is related to spatial learning and memory, and the expression of Nr2f2 is mainly in the ventral hippocampus, which is associated with emotion and anxiety (a). Our findings support a novel molecular mechanism by which Nr2f1 and Nr2f2 may cooperate to ensure the appropriate morphogenesis and functions of the hippocampus by modulating the Lhx5-Lhx2 axis (b). CH, cortical hem; ChP, choroid plexus; DP, dorsal pallium; HP, hippocampal primordium; MP, medial pallium. Scale bars, (Ba–x, Ca–l), 200 μm; (Ba’-x’, Ba’’-d’’, Ca’-l’), 100 μm.
-
Figure 5—source data 1
The expression of Lhx5 and Lhx2 in the telencephalon of the control and RXCre/+; Nr2f1F/F; Nr2f2F/F double-mutant mice at E14.5; the expression of Tbr2 and NeuroD1 in the telencephalon of the control and RXCre/+; Nr2f1F/F; Nr2f2F/F double-mutant mice at E14.5 (part 1).
- https://cdn.elifesciences.org/articles/86940/elife-86940-fig5-data1-v1.zip
-
Figure 5—source data 2
The expression of Sox2, Tbr2, and NeuroD1 in the telencephalon of the control and RXCre/+; Nr2f1F/F; Nr2f2F/F double-mutant mice at E14.5.
- https://cdn.elifesciences.org/articles/86940/elife-86940-fig5-data2-v1.zip
-
Figure 5—source data 3
The expression profiles of genes involved in the hippocampal development of the control and double-mutant mice at E11.5; the expression of Lhx5 and Lhx2 in the telencephalon of the control and RXCre/+; Nr2f1F/F; Nr2f2F/F double-mutant mice at E11.5 and E13.5; the expression of Tbr2 and NeuroD1 in the telencephalon of the control and RXCre/+; Nr2f1F/F; Nr2f2F/F double-mutant mice at E14.5 (part 2); quantitative analysis of Tbr2-positive and NeuroD1-positive cells in the hippocampal primordium of the control and RXCre/+; Nr2f1F/F; Nr2f2F/F double-mutant mice at E14.5.
- https://cdn.elifesciences.org/articles/86940/elife-86940-fig5-data3-v1.zip
Figure 5—figure supplement 1
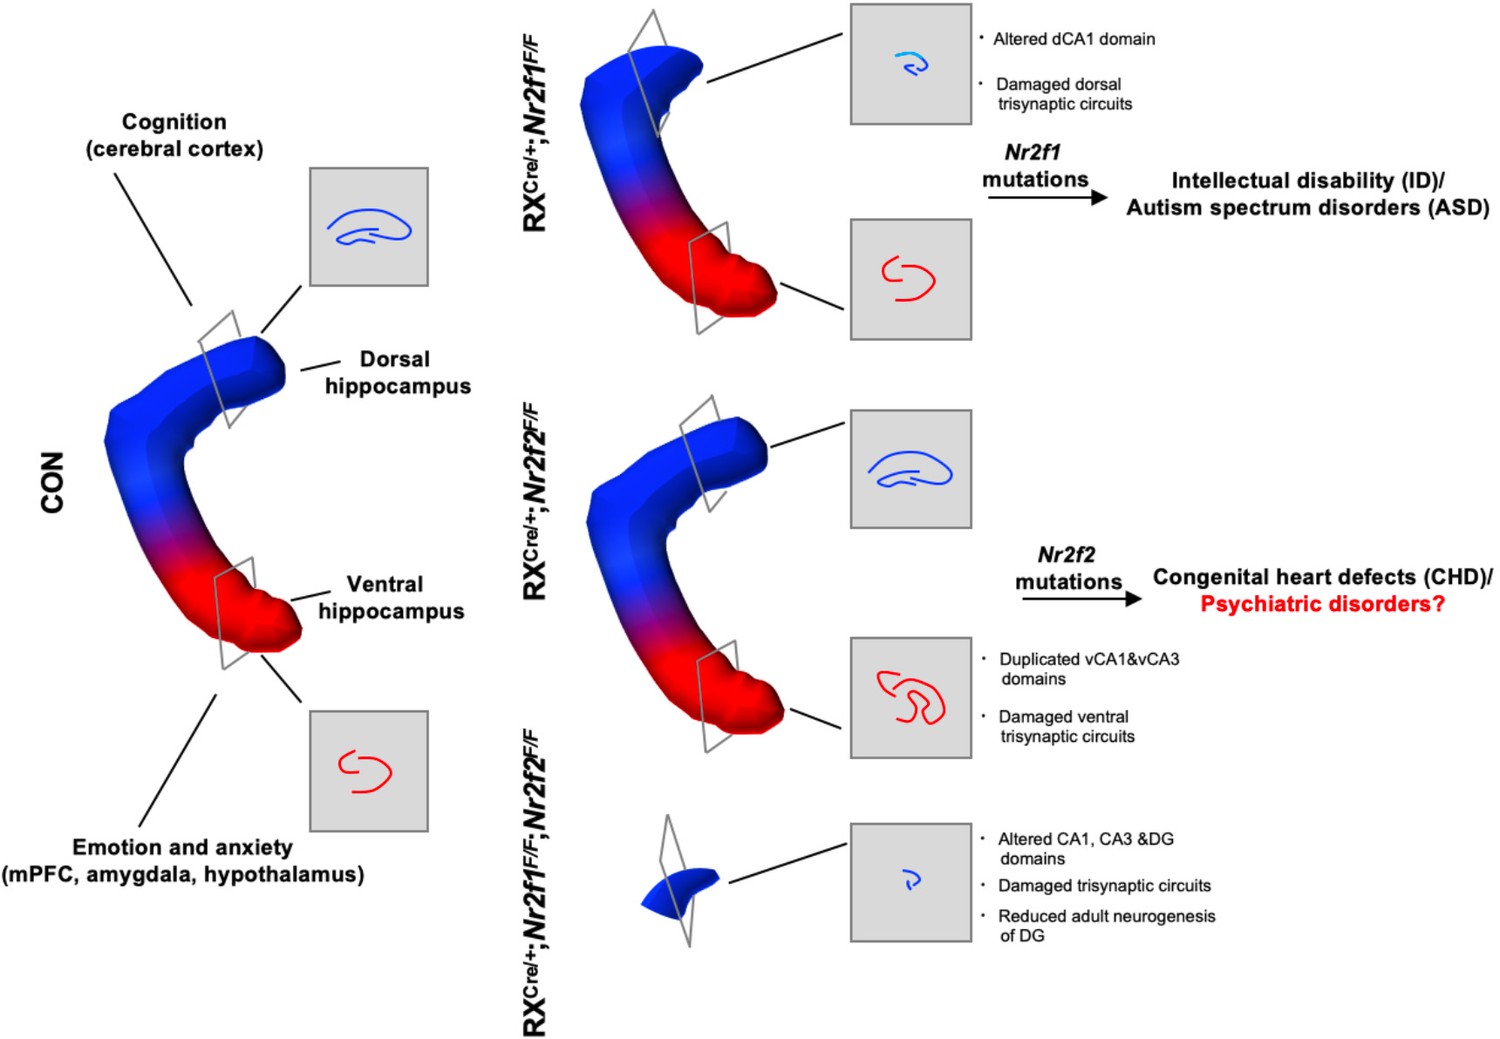
Nr2f1 and Nr2f2 genes coordinate to control distinct characteristics of the hippocampus.
Roles of Nr2f1 and Nr2f2 genes in the development and function of the hippocampus and the association with neurological diseases. Nr2f1 is required for the morphogenesis of the dorsal hippocampus and the specification of dorsal CA1 pyramidal neuron lineage, which are associated with neurodevelopmental disorders, including intellectual disability (ID) and autism spectrum disorders (ASD). Nr2f2 is required to prevent the duplication of the CA1 and CA3 lineages of the ventral hippocampus, which may be related to psychiatric diseases such as depression, anxiety, or schizophrenia. The Nr2f1 and Nr2f2 genes are novel intrinsic regulatory genes, which cooperate with each other to ensure the early morphogenesis of the hippocampus.
-
Figure 5—figure supplement 1—source data 1
Roles of Nr2f1 and Nr2f2 genes in the development and function of the hippocampus and the association with neurological disorders.
- https://cdn.elifesciences.org/articles/86940/elife-86940-fig5-figsupp1-data1-v1.zip
Additional files
Download links
A two-part list of links to download the article, or parts of the article, in various formats.
Downloads (link to download the article as PDF)
Open citations (links to open the citations from this article in various online reference manager services)
Cite this article (links to download the citations from this article in formats compatible with various reference manager tools)
The differentiation and integration of the hippocampal dorsoventral axis are controlled by two nuclear receptor genes
eLife 12:RP86940.
https://doi.org/10.7554/eLife.86940.3


