Purinergic GPCR-integrin interactions drive pancreatic cancer cell invasion
- Centre for Tumour Biology, Barts Cancer Institute, Queen Mary University of London, United Kingdom
- Centre for Endocrinology, William Harvey Research Institute, Queen Mary University of London, United Kingdom
- London Centre for Nanotechnology, University College London, United Kingdom
- Department of Chemistry, University College London, United Kingdom
Figures
Figure 1 with 1 supplement

Characterization of purinergic signaling in pancreatic adenocarcinoma.
(A) Purinergic signaling proteins and gene names. (B) Hazard ratios of overall survival were calculated using KMPlot and the pancreatic adenocarcinoma (PAAD) The Cancer Genome Atlas (TCGA) cohort (n=177) for different purinergic genes. Statistically significant hazard ratios (log-rank p-value) are highlighted in red for worse survival and in blue for better survival. (C) Heatmap of purinergic genes significantly correlated (q<0.05) to high (purple) or low (light blue) Winter hypoxia scores in the PAAD TCGA data set. Overall survival status and overall survival in months are shown at the top, and samples are ranked using the Winter Hypoxia score (Generated with cBioPortal). (D) Differential expression analysis of 60 paired stromal and tumor tissue microdissections (GSE93326) showing significantly differentially expressed purinergic genes in stromal or tumor epithelial tissue. (E) Gene weights for purinergic genes representing the relevance of each gene to each cell type compartment, obtained from DECODER PDAC TCGA deconvolution analysis.
Figure 1—figure supplement 1
Characterization of purinergic genes in pancreatic adenocarcinoma.
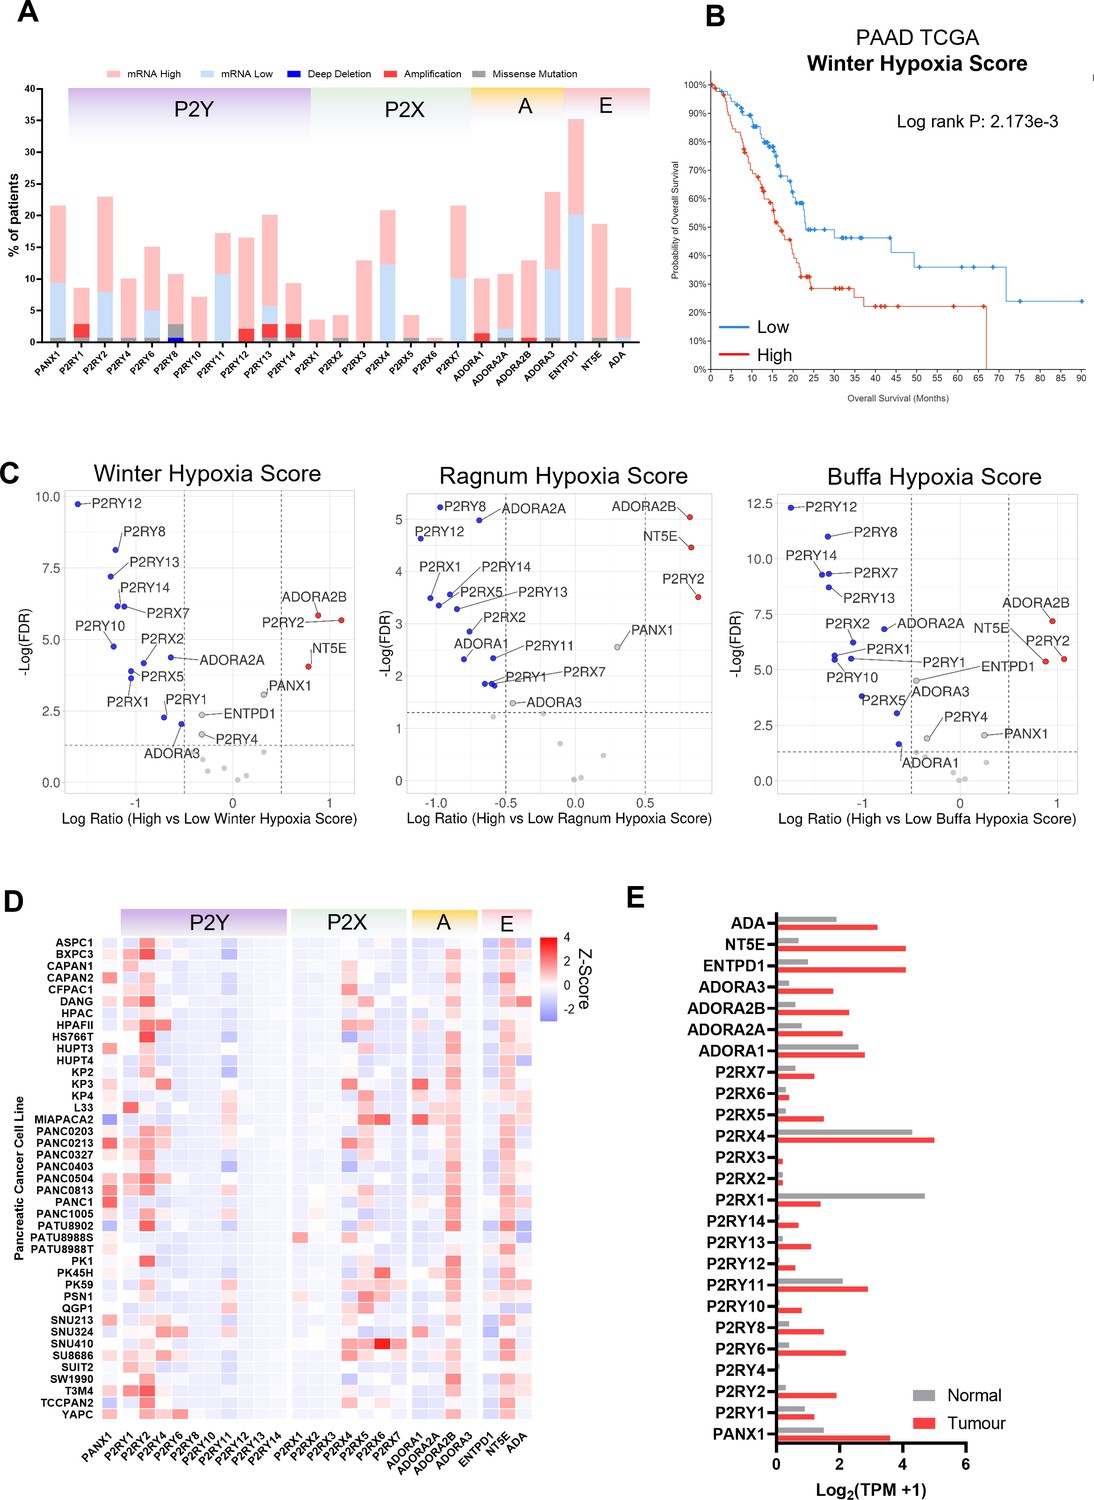
(A) Oncoprint from the pancreatic adenocarcinoma (PAAD) The Cancer Genome Atlas (TCGA) cohort was generated using cBioPortal. mRNA high and mRNA low represent Z-score values of >1 or < −1.(B) KMplot generated in cBioPortal for patients with high (red) vs low (blue) Winter hypoxia scores (C) Volcano plots for differential expression results of PAAD TCGA patient of high or low hypoxia scores using three different hypoxia signatures (Winter, Ragnum, and Buffa). (D) Heat map of purinergic mRNA expression data for different Pancreatic ductal adenocarcinoma (PDAC) cell lines from CCLE. (E) Comparison of normal versus tumor normalized transcripts per million (TPM) expression of purinergic genes. Data was obtained using GEPIA and PAAD TCGA and GTEx.
Figure 2 with 1 supplement
Expression of P2Y2 is specific to cancer cells, correlated with decreased overall survival in patients, and drives cytoskeletal rearrangements.
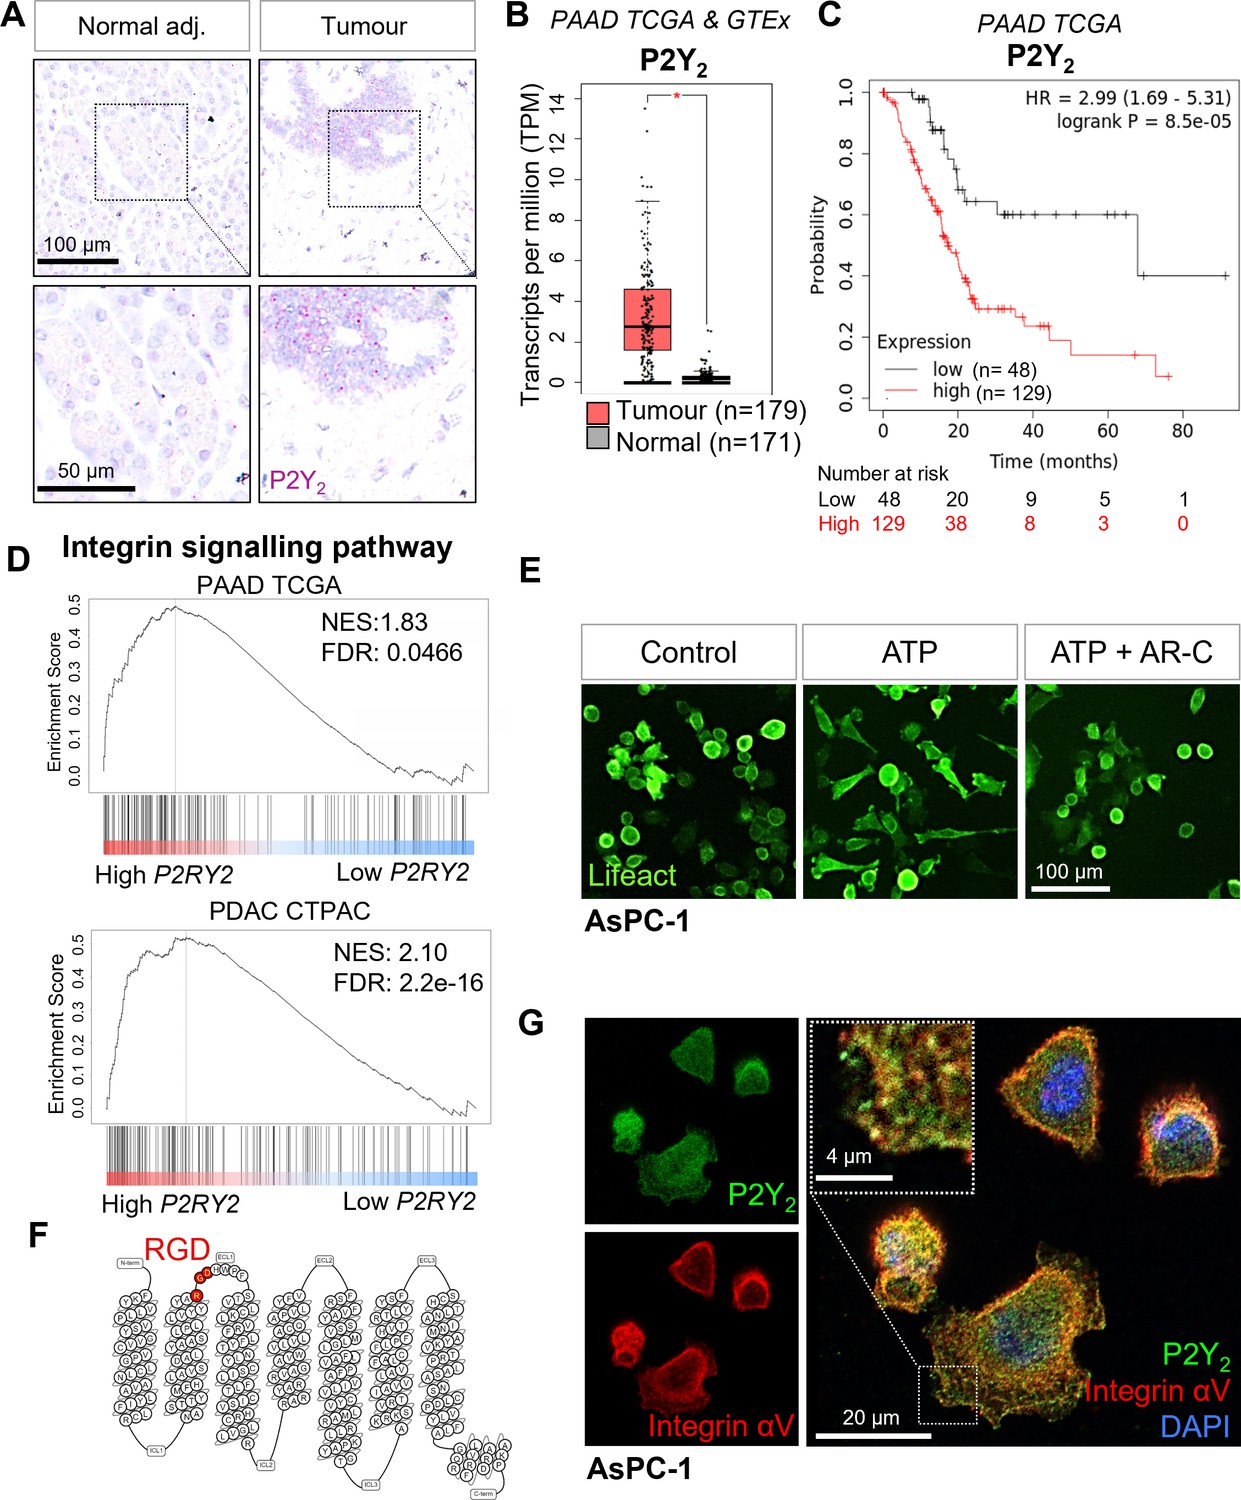
(A) RNAscope in-situ hybridization of P2Y2 mRNA expression (magenta) in tumor and matching normal adjacent tissue. (B) P2Y2 mRNA expression in tumor (TCGA) and normal (GTEx) pancreatic tissue samples (*p<0.0001). Graph generated using GEPIA. (C) Kaplan-Meier plot comparing patients with high vs low expression of P2Y2 in the Pancreatic Adenocarcinoma (PAAD) The Cancer Genome Atlas (TCGA) cohort. Graph generated using KMplot. (D) Top result of a GSEA (performed with WebGestalt) of two different pancreatic adenocarcinoma patient cohorts (PAAD TCGA and PDAC CPTAC) for the PANTHER pathway functional database. (E) Incucyte images of the pancreatic cancer cell line AsPC-1 12 hr after treatment with 100 µM ATP alone or with 5 µM AR-C (P2Y2 antagonist). Cells are transduced with Lifeact to visualize f-actin (green). (F) Schematic of the amino acid sequence of P2Y2 showing an RGD motif in the first extracellular loop (image generated in http://gpcrdb.org/). (G) IF staining of P2Y2 (green), integrin αV (red), and DAPI (blue) in AsPC-1 cells showing colocalization of P2Y2 and integrin αV (yellow).
Figure 2—figure supplement 1
mRNA and protein expression of P2Y2 in pancreatic ductal adenocarcinoma (PDAC) cells.
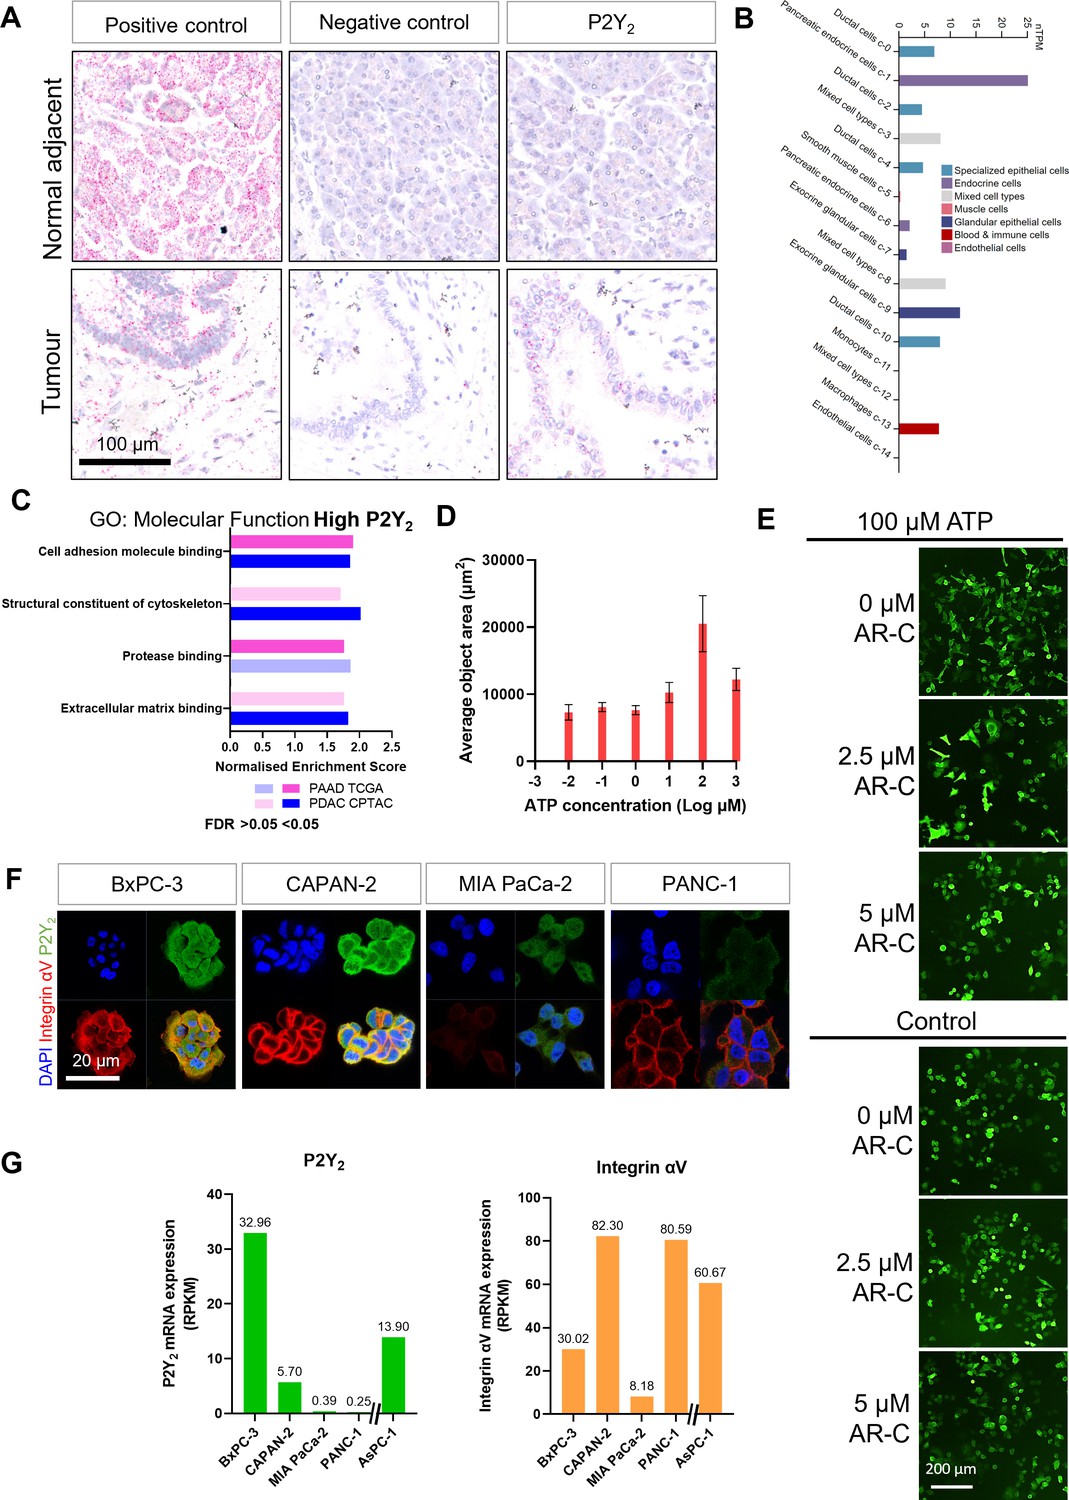
(A) RNAscope in-situ hybridization of a positive control (PPIB, Cyclophilin B), negative control (DapB), and P2Y2 mRNA expression in a PDAC tissue slide showing tumor and normal adjacent tissue. (B) Single-cell expression of P2Y2 in healthy pancreatic tissue from the Human Protein Atlas (https://www.proteinatlas.org/ENSG00000175591-P2RY2/single+cell+type/pancreas). (C) Top four results of a GSEA (performed with WebGestalt) of two different pancreatic adenocarcinoma patient cohorts (PAAD TCGA and PDAC CPTAC) for the ‘Molecular Function’ Gene Ontology (GO) functional database. (D) Incucyte analysis of average object area related to the average cell area of AsPC-1 cells at different concentrations of ATP (error bars show standard deviation). (E) Incucyte images of AsPC-1 cells with different concentrations of AR-C with or without ATP. (F) IF staining of four different PDAC cell lines showing various levels of P2Y2 (green) and integrin αV (red) protein expression. (G) The respective reads per kilobase of exon per million reads mapped (RPKM) from CCLE.
Figure 3 with 1 supplement
The RGD motif in P2Y2 is required for extracellular ATP-driven cancer cell invasion.
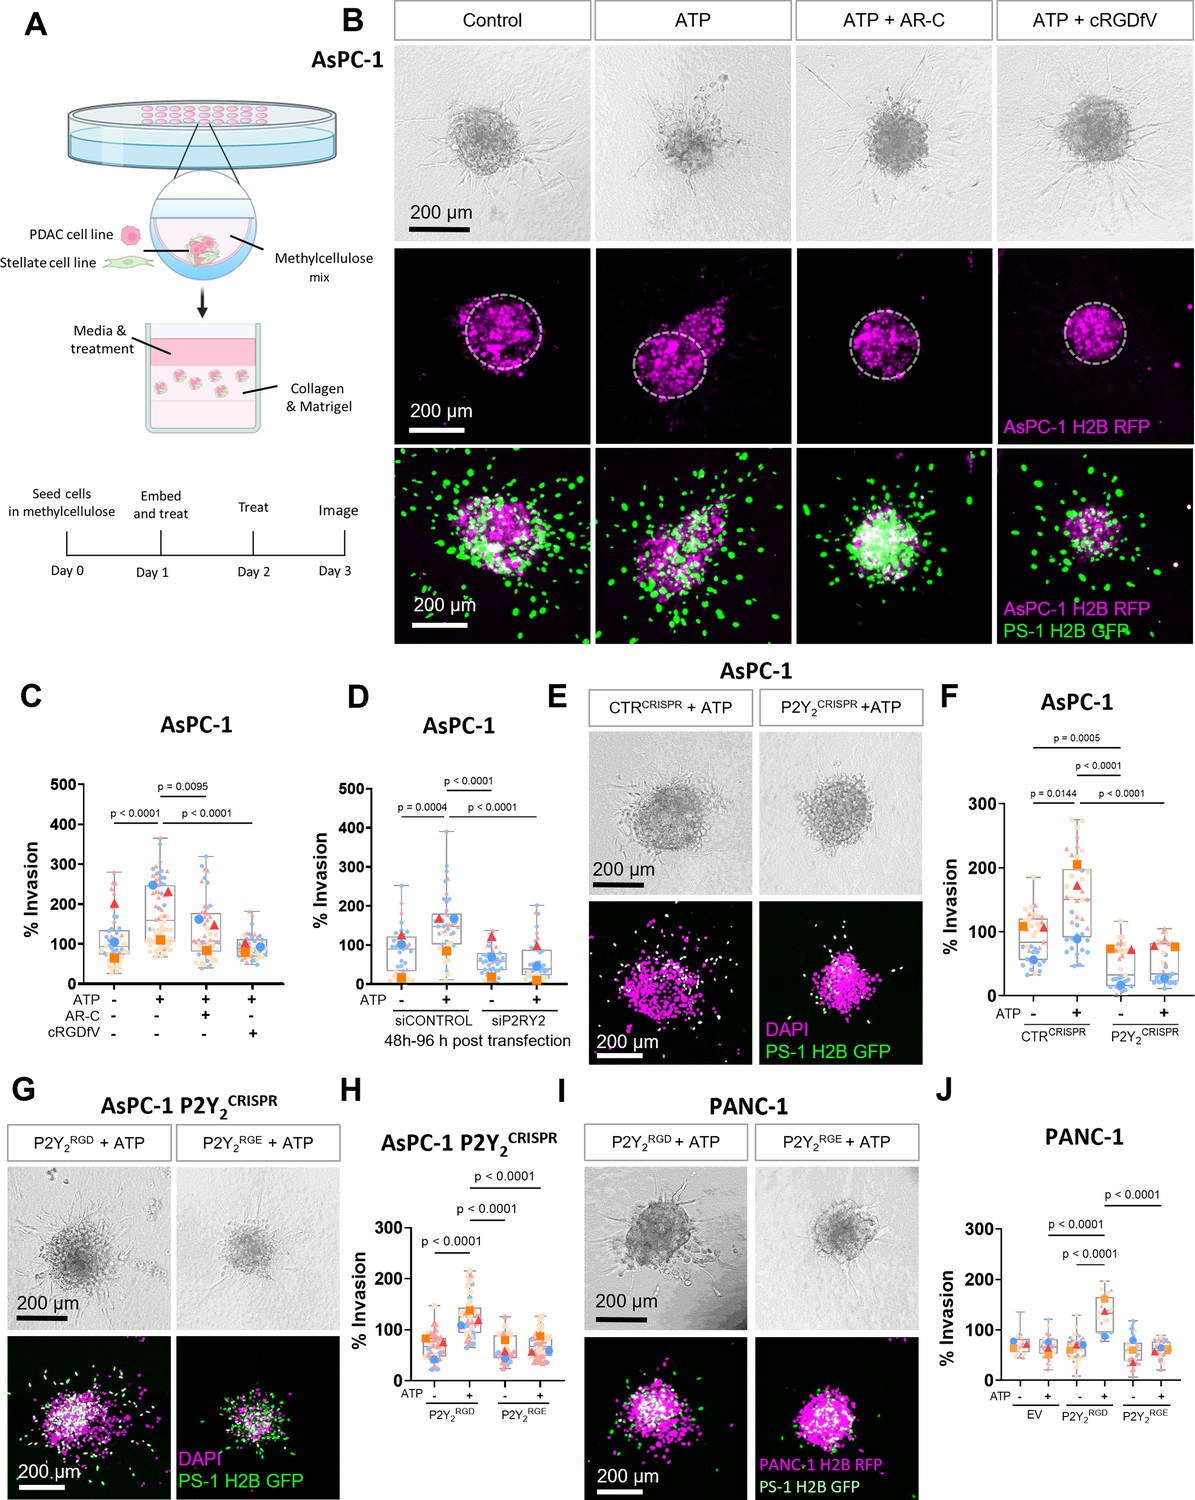
(A) Schematic diagram of the hanging drop sphere model for 3D sphere invasion assays. (B) Bright field and fluorescent images of spheres formed using AsPC-1 cells (magenta) with a histone 2B (H2B) tagged with a red fluorescent protein (RFP) and the stellate cell line PS-1 (green) with H2B tagged with a green fluorescent protein (GFP). Middle panel shows AsPC-1 cells in spheres with a dotted line highlighting the central sphere area. Spheres were treated with vehicle control or 100 µM ATP alone or with 5 µM AR-C or 10 µM cRGDfV. The quantification is shown in (C) using SuperPlots, where each color represents a biological repeat (n=3) and the larger points represent the mean % Invasion for each repeat. (D) Quantification of spheres formed by AsPC-1 cells transfected with a control siRNA or P2Y2 siRNA and treated with or without 100 µM ATP. (E) Bright field and fluorescent images of spheres formed by AsPC-1 cells subjected to CRISPR/Cas9 gene disruption using a control guide RNA (CTRCRISPR) or P2Y2 guide RNAs (P2Y2CRISPR) and treated with or without 100 µM ATP. Quantification in (F). (G, I) Bright field and fluorescent images of AsPC-1 P2Y2CRISPR cells or PANC-1 cells (respectively) transfected with wild-type P2RY2 (P2Y2RGD) or mutant P2RY2D97E (P2Y2RGE) treated with or without 100 µM ATP and its quantification in (H) and (J), respectively. Statistical analysis with Kuskal-Wallis multiple comparison tests.
Figure 3—figure supplement 1
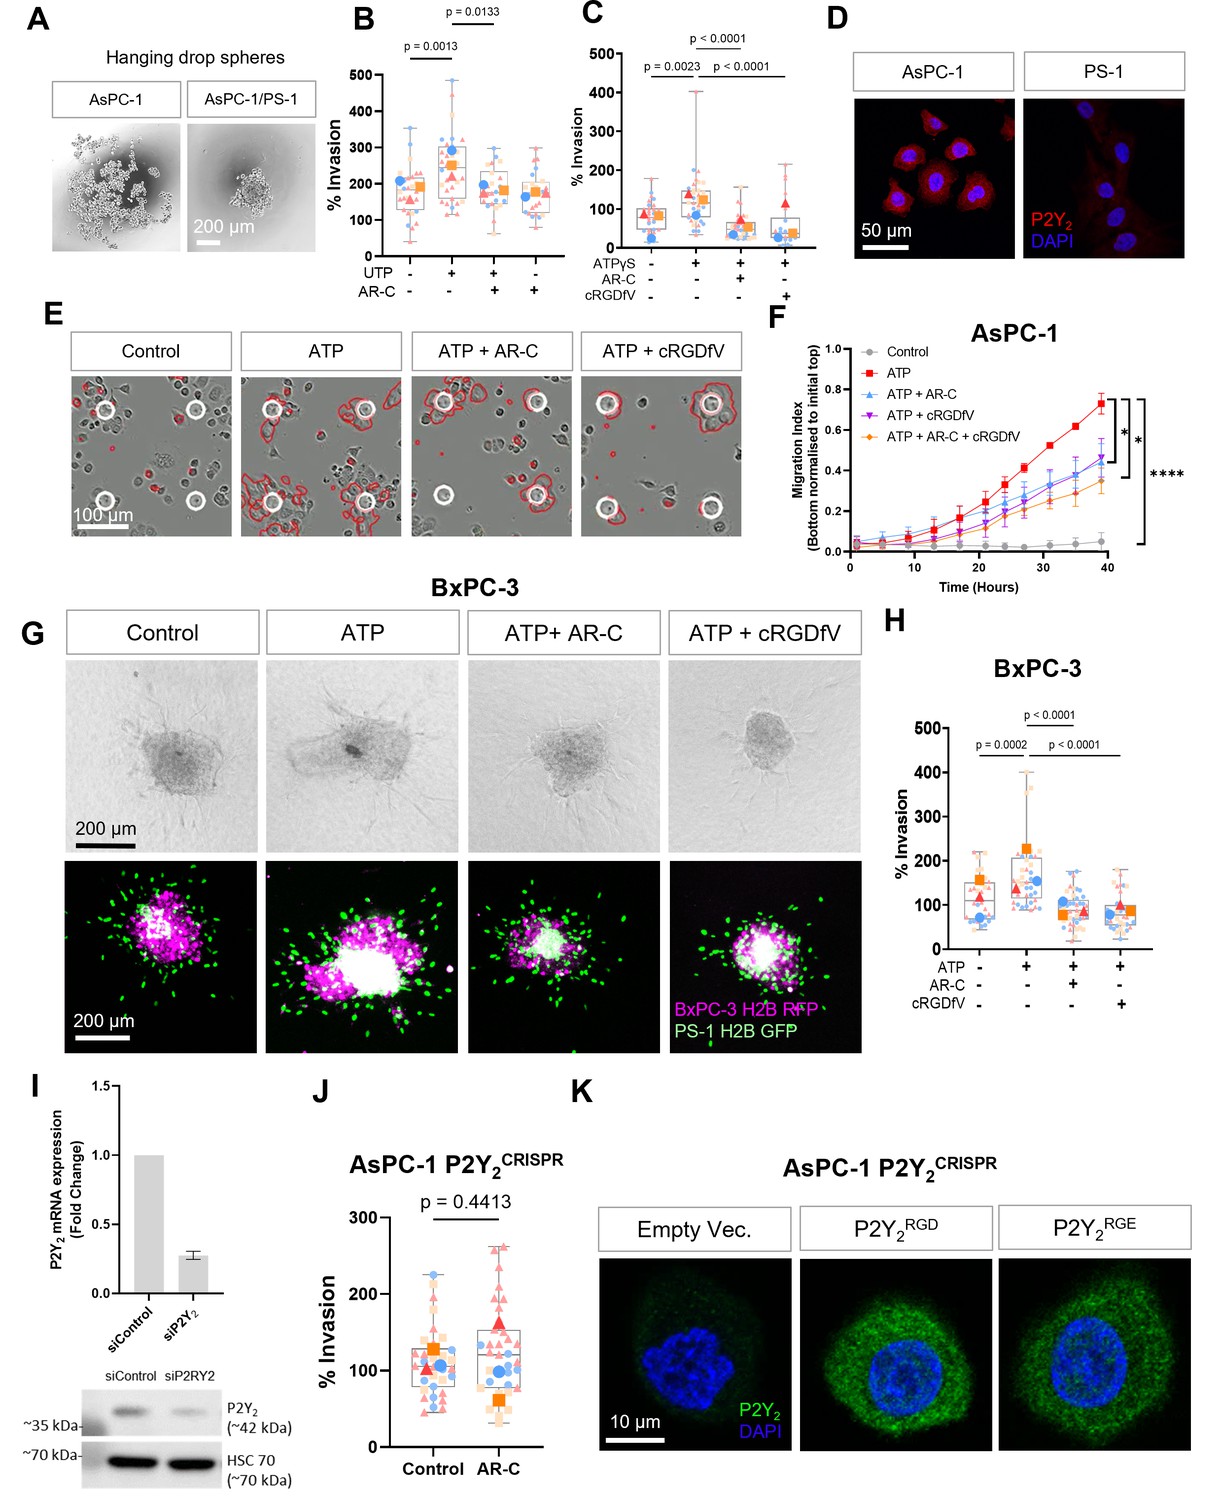
Invasion and migration experiments in Pancreatic ductal adenocarcinoma (PDAC) cell lines.
(A) Hanging drop sphere with and without PS-1 cells. (B, C) Quantification of AsPC-1 spheres treated with 100 µM UTP or ATPγS (respectively) in the absence or together with 5 µM AR-C or 10 µM cRGDfV (n=3 biological replicates). (D) IF staining of P2Y2 in AsPC-1 and PS-1 stellate cells. (E) Migration assay with AsPC-1 and 100 µM ATP in the absence or together with 5 µM AR-C or/and 10 µM cRGDfV and (F) its quantification (n=3 biological replicates, statistical analysis with one-way ANOVA, * p < 0.5, **** p < 0.0001, error bars show standard deviation). (G) 3D sphere invasion assay using BxPC-3 cells treated with 100 µM of ATP in the absence or together with 5 µM AR-C or/and 10 µM cRGDfV and (H) its quantification (n=3 biological replicates). (I) qPCR of P2Y2 expression and western blot of siRNA treated cells (control siRNA and P2Y2 targeting siRNA, n=3 biological replicates). (J) AsPC-1 P2Y2CRISPR spheres treated with or without 5 µM of AR-C (n=3 biological replicates). (K) P2Y2 IF staining of AsPC-1 P2Y2CRISPR cells transfected with an empty vector, P2Y2RGD or P2Y2RGE plasmids. Statistical analysis of all invasion experiments with Kuskal-Wallis multiple comparison tests.
-
Figure 3—figure supplement 1—source data 1
Labeled uncropped blot of Figure 3—figure supplement 1I.
- https://cdn.elifesciences.org/articles/86971/elife-86971-fig3-figsupp1-data1-v2.zip
-
Figure 3—figure supplement 1—source data 2
Full unedited blot of Figure 3—figure supplement 1I.
- https://cdn.elifesciences.org/articles/86971/elife-86971-fig3-figsupp1-data2-v2.zip
Figure 4 with 2 supplements
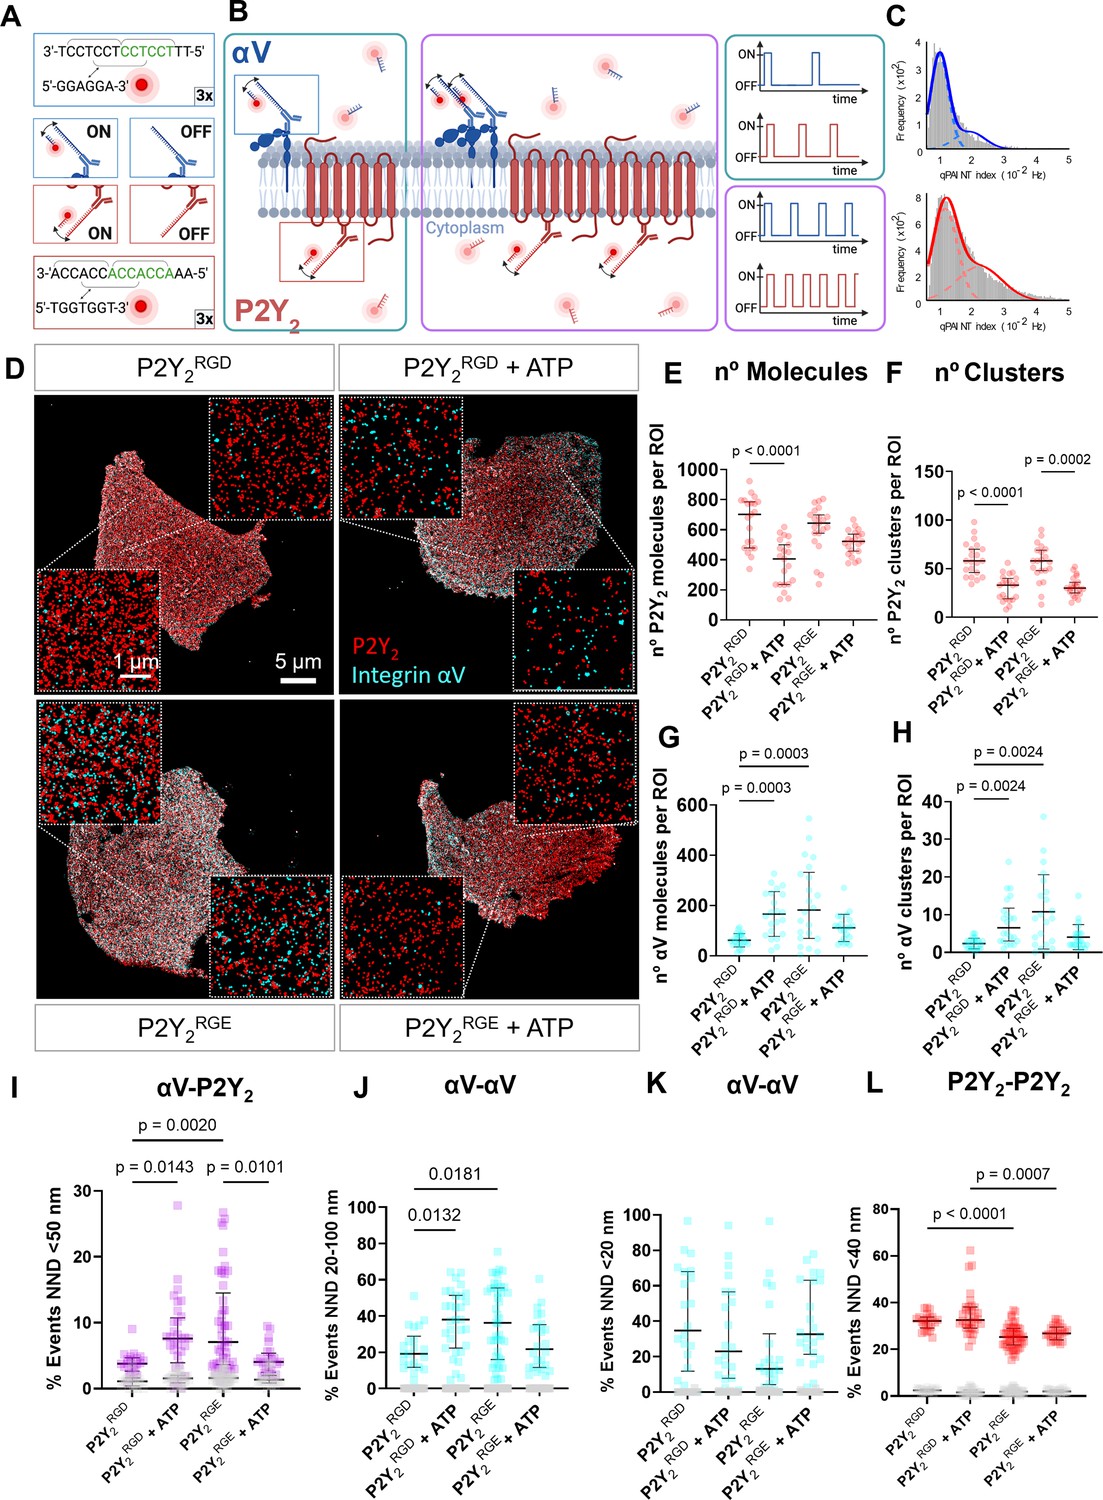
DNA-PAINT super-resolution microscopy reveals ATP and RGD-dependent changes in the number and distribution of integrin αV and P2Y2 molecules in the plasma membrane.
(A, B) Overview of the DNA-PAINT microscopy technique and qPAINT analysis pipeline. (C) Histogram of qPAINT indices for αV (blue) and P2Y2 (red) single-molecule localization clusters. Solid lines represent multi-peak Gaussian fit. (D) Rendered DNA-PAINT images of AsPC-1 P2Y2CRISPR cells transfected with P2Y2RGD or P2Y2RGE with or without 100 µM of ATP and close-ups showing the protein maps reconstructed from DNA-PAINT localization maps of P2Y2 (red) and integrin αV (cyan). The quantification of the number of proteins or protein clusters (>3 proteins) in each region of interest (ROI) are for P2Y2 (red) (E) and (F), respectively and integrin αV (cyan) (G) and (H), respectively. Quantification of protein proximity using the nearest neighbor distance (NND), with the percentages of integrin αV and P2Y2 proteins being <50 nm apart (I), between different αV integrins being 20–100 nm (J) or <20 nm (K) apart; and P2Y2 from other P2Y2 proteins being <40 nm apart (H). Statistical analysis with Kuskal-Wallis multiple comparison test of 21 4x4 µm ROIs from a minimum of 5 cell regions per condition.
Figure 4—figure supplement 1
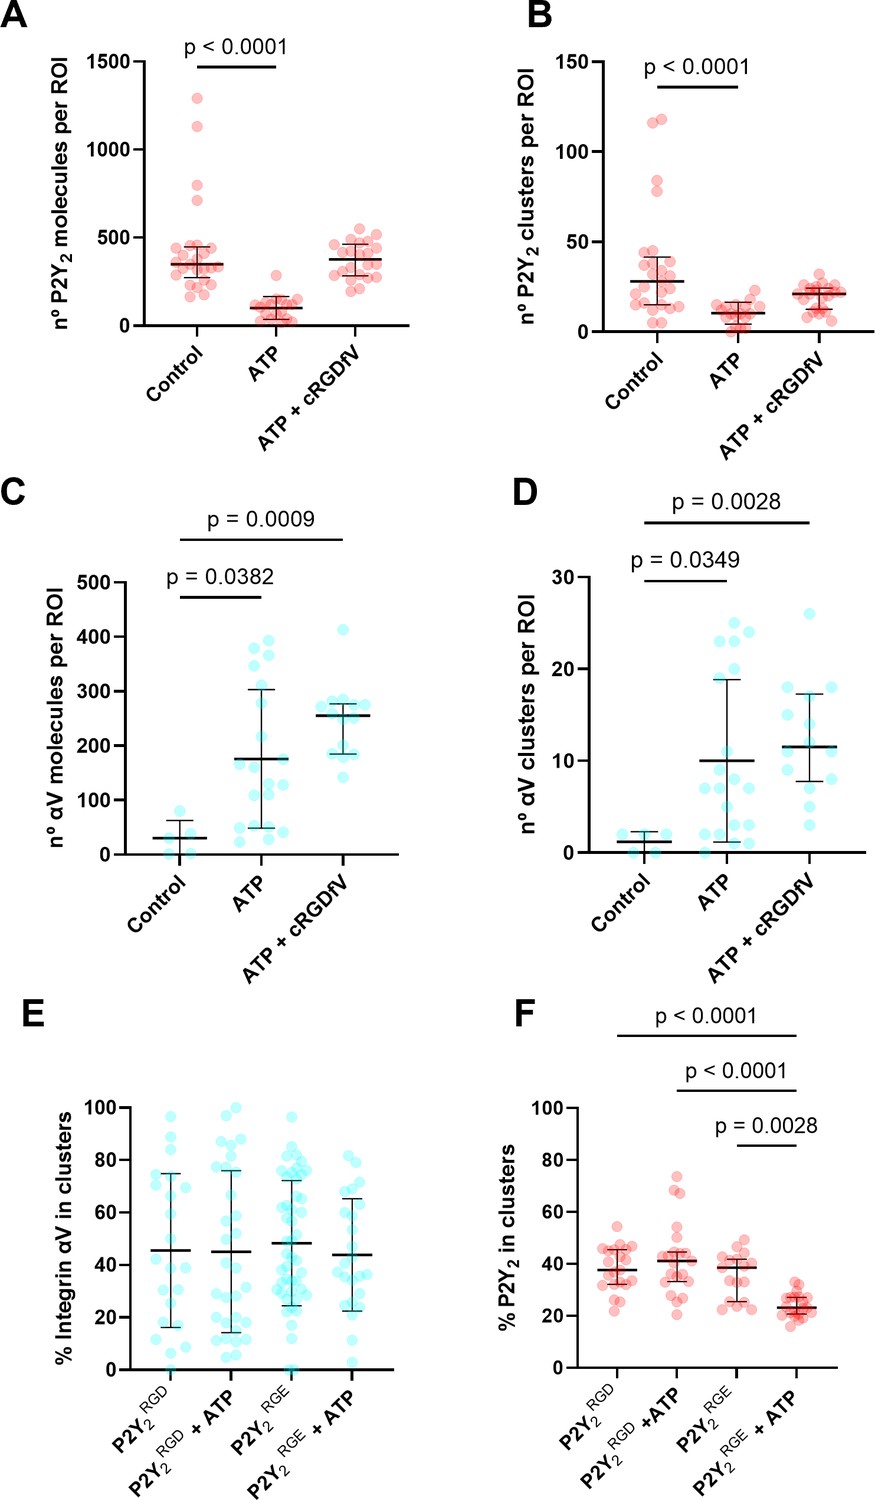
Quantification of P2Y2 and integrin αV at the membrane using DNA-PAINT.
Figure 4—figure supplement 2
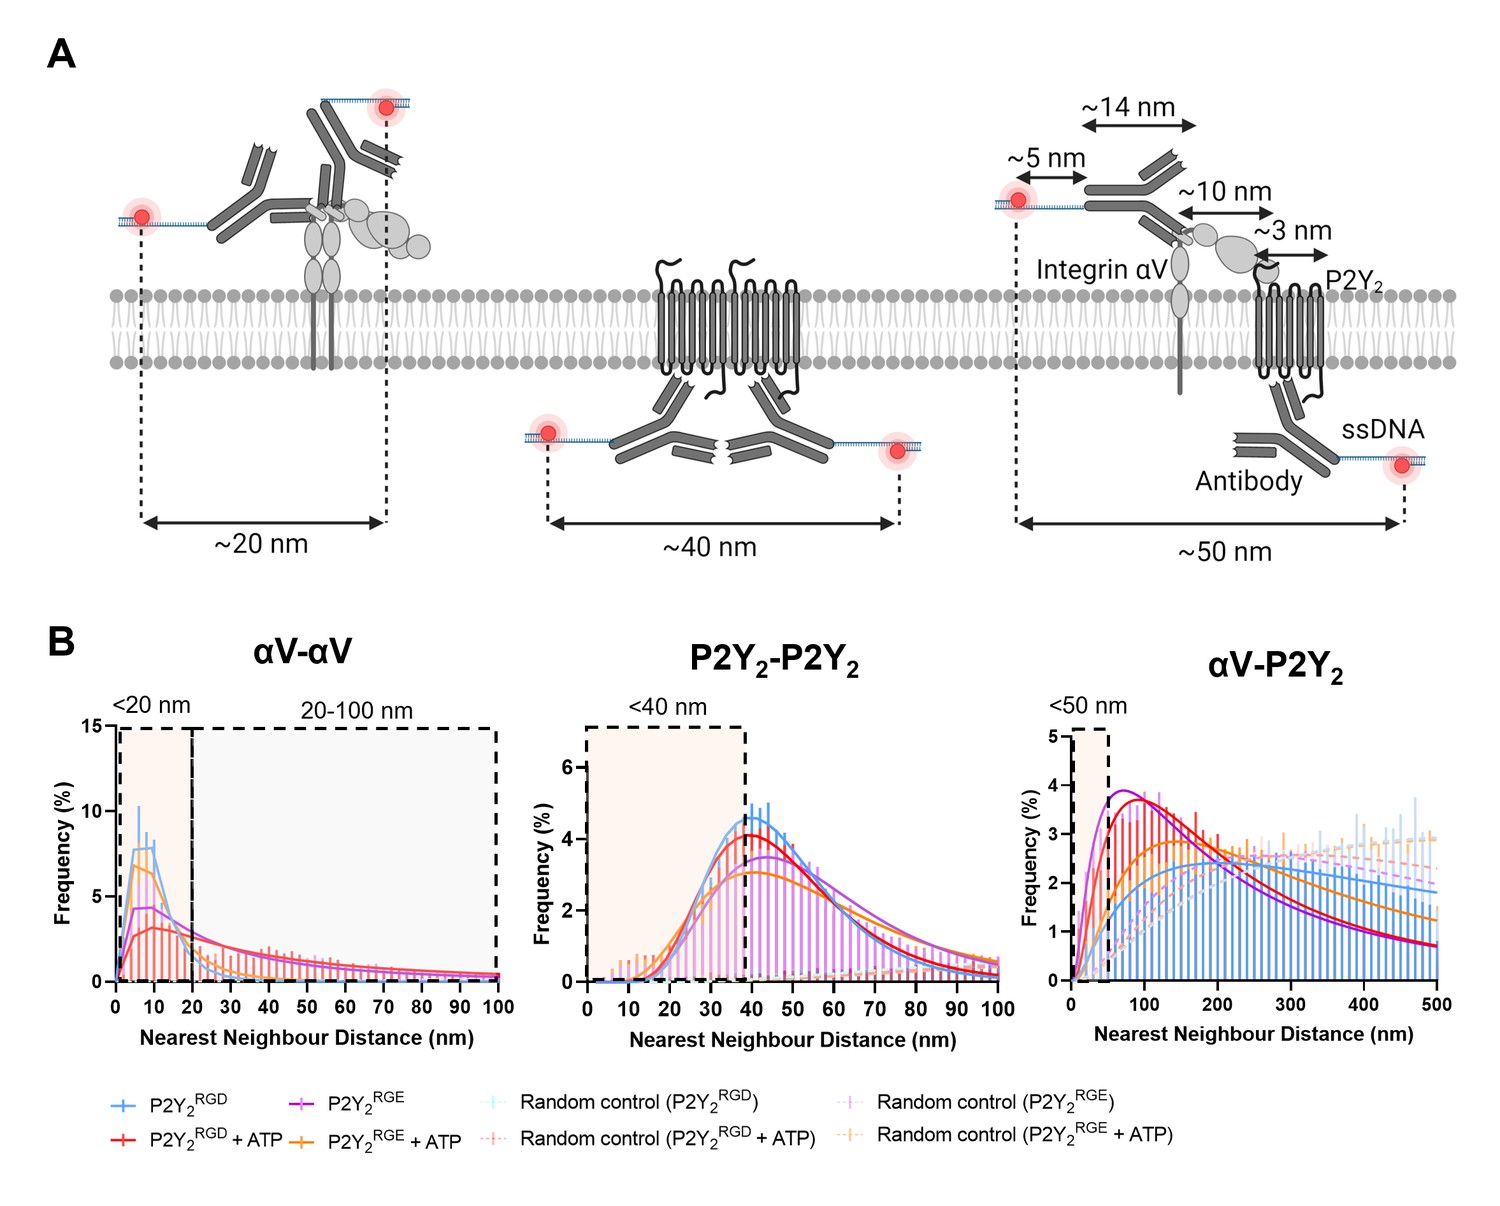
Schematic diagram of nearest neighbor distance (NND) distances and NND histograms.
(A) Schematic diagram of the predicted maximum distance between fluorescent molecules indicating physical contact between proteins, to the nearest first significant figure. (B) Histograms of the nearest neighbor distance between proteins vs the frequency of occurrence for AsPC-1 P2Y2CRISPR in different conditions (solid line, strong color) or randomly computer-generated controls (dotted line, light color).
Figure 5
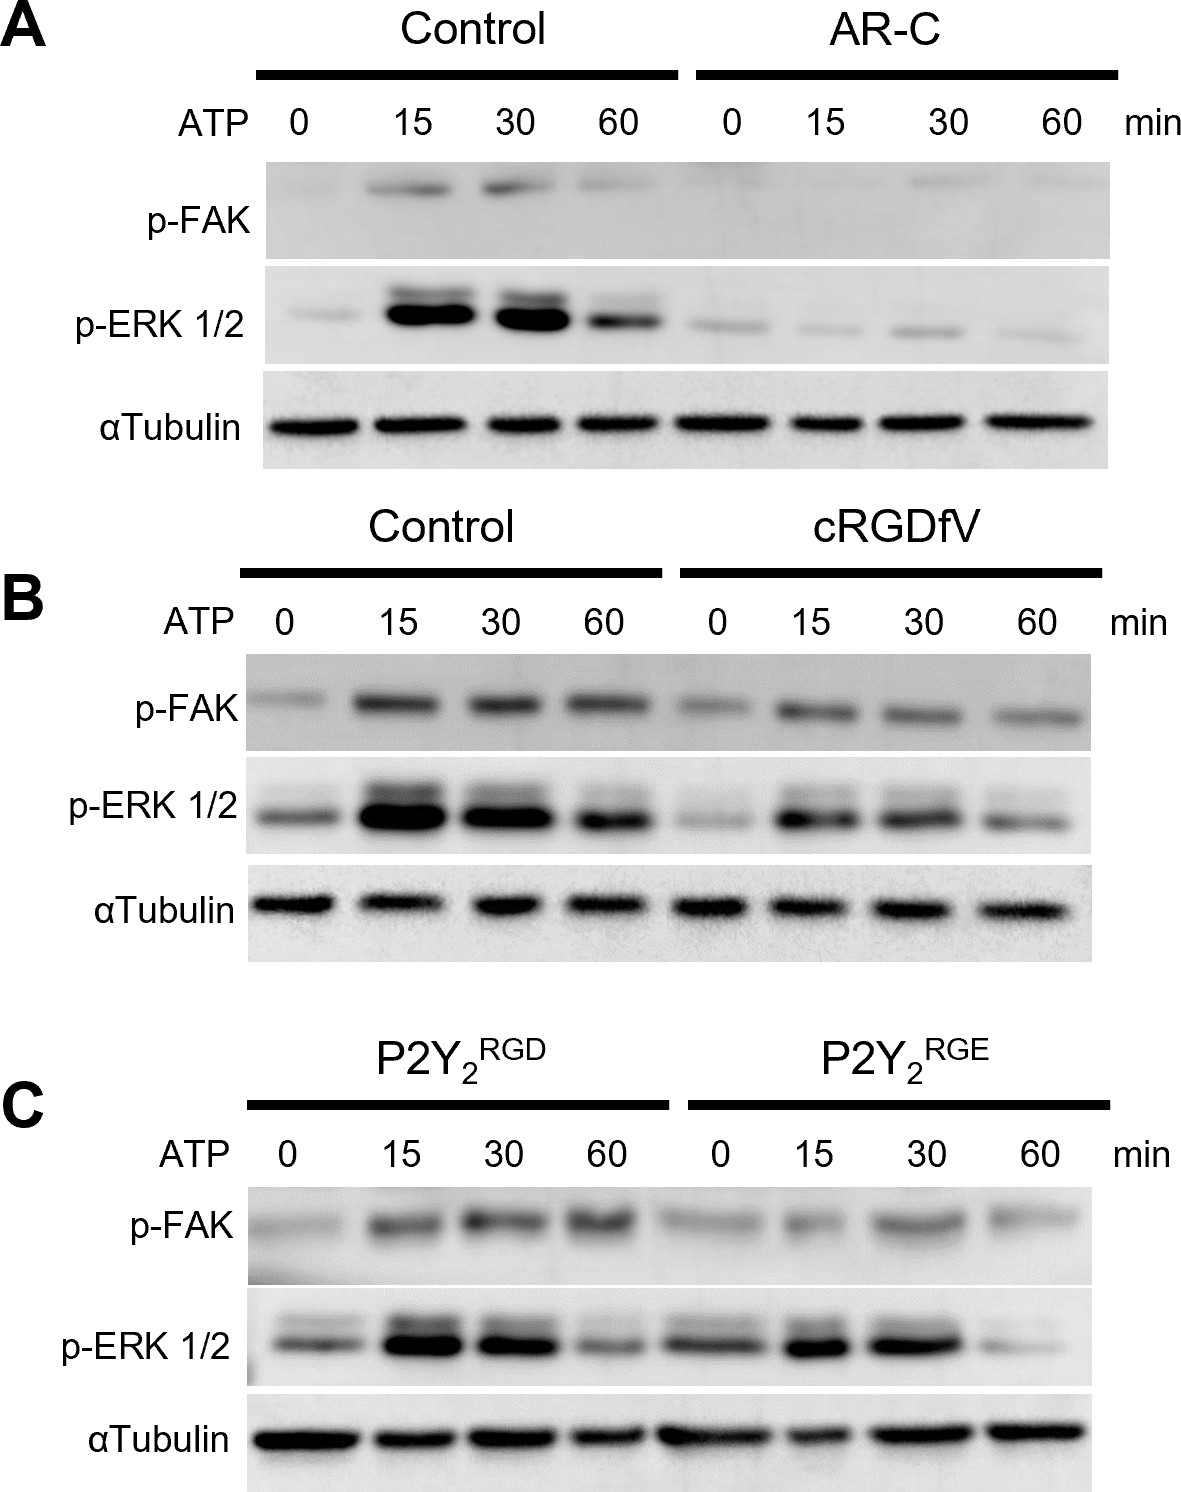
The RGD motif in P2Y2 is involved in FAK/ERK signaling.
(A, B) Western blots of phosphorylated FAK (p-FAK) and ERK (p-ERK) of AsPC-1 cells treated with ATP or pre-treated for 30 min with AR-C (5 µM) or cRGDfV (10 µM), respectively and treated with ATP for 60 min. (C) Western blot of AsPC-1 P2Y2CRISPR cells transfected with P2Y2RGD or P2Y2RGE and treated with ATP for 60 min. Representative images of three biological replicates.
-
Figure 5—source data 1
Labeled uncropped blots of Figure 5.
- https://cdn.elifesciences.org/articles/86971/elife-86971-fig5-data1-v2.zip
-
Figure 5—source data 2
Full unedited blots of Figure 5.
- https://cdn.elifesciences.org/articles/86971/elife-86971-fig5-data2-v2.zip
Figure 6
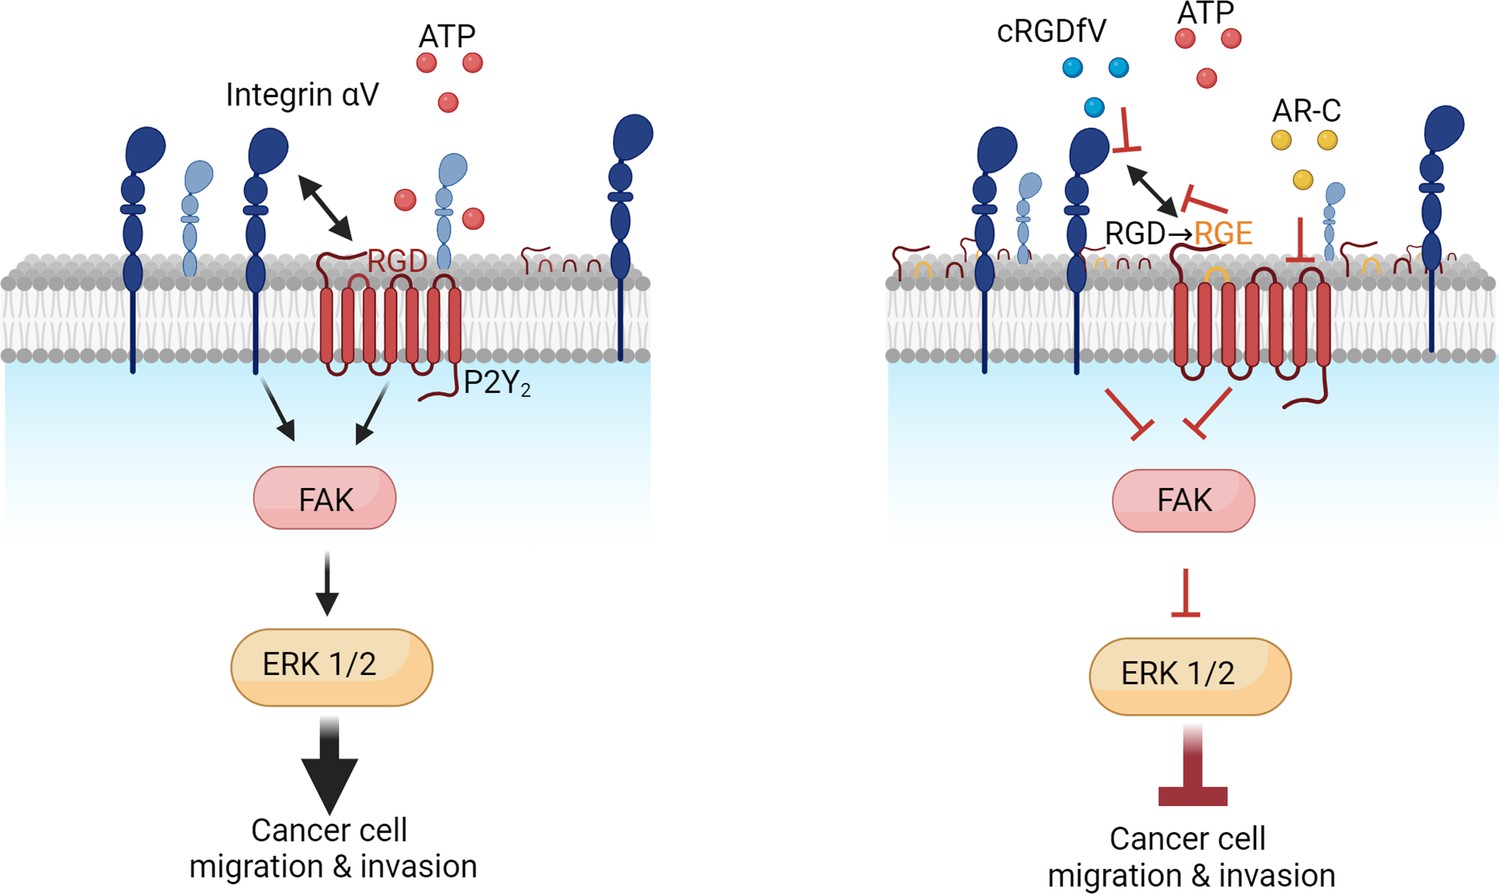
Proposed mechanism of P2Y2 and integrin interactions in pancreatic cancer invasion.
Author response image 1
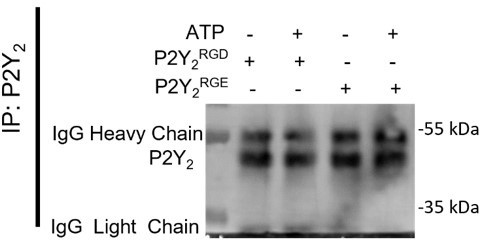
Immunoprecipitation of P2Y2 showing similar P2Y2 levels in AsPC-1 P2Y2CRISPR cells transfected with P2Y2RGD or P2Y2RGE and treated with 100 µM of ATP or control for 1 hour.
Antibody used: anti-P2Y2 (APR-010, Alomone Labs).
Additional files
-
Supplementary file 1
Pancreatic cancer molecular subtypes associated with purinergic gene expressions.
Purinergic genes with significantly higher expression in a specific molecular subtype have been listed below. If no significant higher expression was observed not applicable (N/A) is shown.
- https://cdn.elifesciences.org/articles/86971/elife-86971-supp1-v2.docx
-
MDAR checklist
- https://cdn.elifesciences.org/articles/86971/elife-86971-mdarchecklist1-v2.docx
Download links
A two-part list of links to download the article, or parts of the article, in various formats.
Downloads (link to download the article as PDF)
Open citations (links to open the citations from this article in various online reference manager services)
Cite this article (links to download the citations from this article in formats compatible with various reference manager tools)
Purinergic GPCR-integrin interactions drive pancreatic cancer cell invasion
eLife 12:e86971.
https://doi.org/10.7554/eLife.86971


