Key epigenetic and signaling factors in the formation and maintenance of the blood-brain barrier
- The Vivian L. Smith Department of Neurosurgery, University of Texas Health Science Center McGovern Medical School, United States
- Departments of Neurology & Neuroscience, University of Wisconsin School of Medicine and Public Health, United States
- Department of Neurology, Harvard Medical School, United States
- Department of Genetics, TheUniversity of Texas MD Anderson Cancer Center, United States
- Wisconsin Blood Cancer Research Institute, University of Wisconsin School of Medicine and Public Health, United States
- UTHealth School of Biomedical Informatics, United States
Figures
Figure 1 with 1 supplement

A distinct cohort of endothelial cells (EC) genes regulates the formation vs maintenance of blood-brain barrier (BBB).
(A) Workflow for transcriptomic analysis. Primary ECs were isolated from E13.5 and adult (2–3-months-old) cortex, followed by RNA isolation, mRNA sequencing, and transcriptomic analysis. (B) Comparative transcriptome analysis of ECs from E13.5 and adult cortex. Volcano plot depicting downregulated and upregulated genes in adult primary cortical ECs compared to E-13.5. Genes marked in red are significant (p<0.05) N=3. (C) Diagram depicting the number of genes downregulated and upregulated in adult cortical primary ECs compared to E-13.5. (D) Downregulated and upregulated genes were categorized with five important EC functions. (E) Enrichment analysis revealed important BBB-related genes that were differentially regulated during development. (F) Relative mRNA expression of Cldn1, Mfsd2a, Zic3, Sox17, and Cldn5. in primary cortical ECs isolated from E13.5, E-17.5, P0, P7 and adult. Significant differences are observed between E-13.5 and all consecutive stages for Cldn1(***p<0.001, N=3/group), Mfsd2a (***p<0.001, N=3–4/group) and Zic3(***p<0.001 N=3–4/group). Cldn1 showed significant differences between E-17.5 vs P7 and adult and P0 vs P7 and adult (***p<0.001 N=3/group). Zic3 significantly differed between E-17.5 vs P7 and adult ECs (**p<0.01 N=3/group). Significant differences are observed between E-13.5 vs P7 and adults for Cldn5 and Sox17 (*p<0.001 N=3–4/group).
Figure 1—figure supplement 1
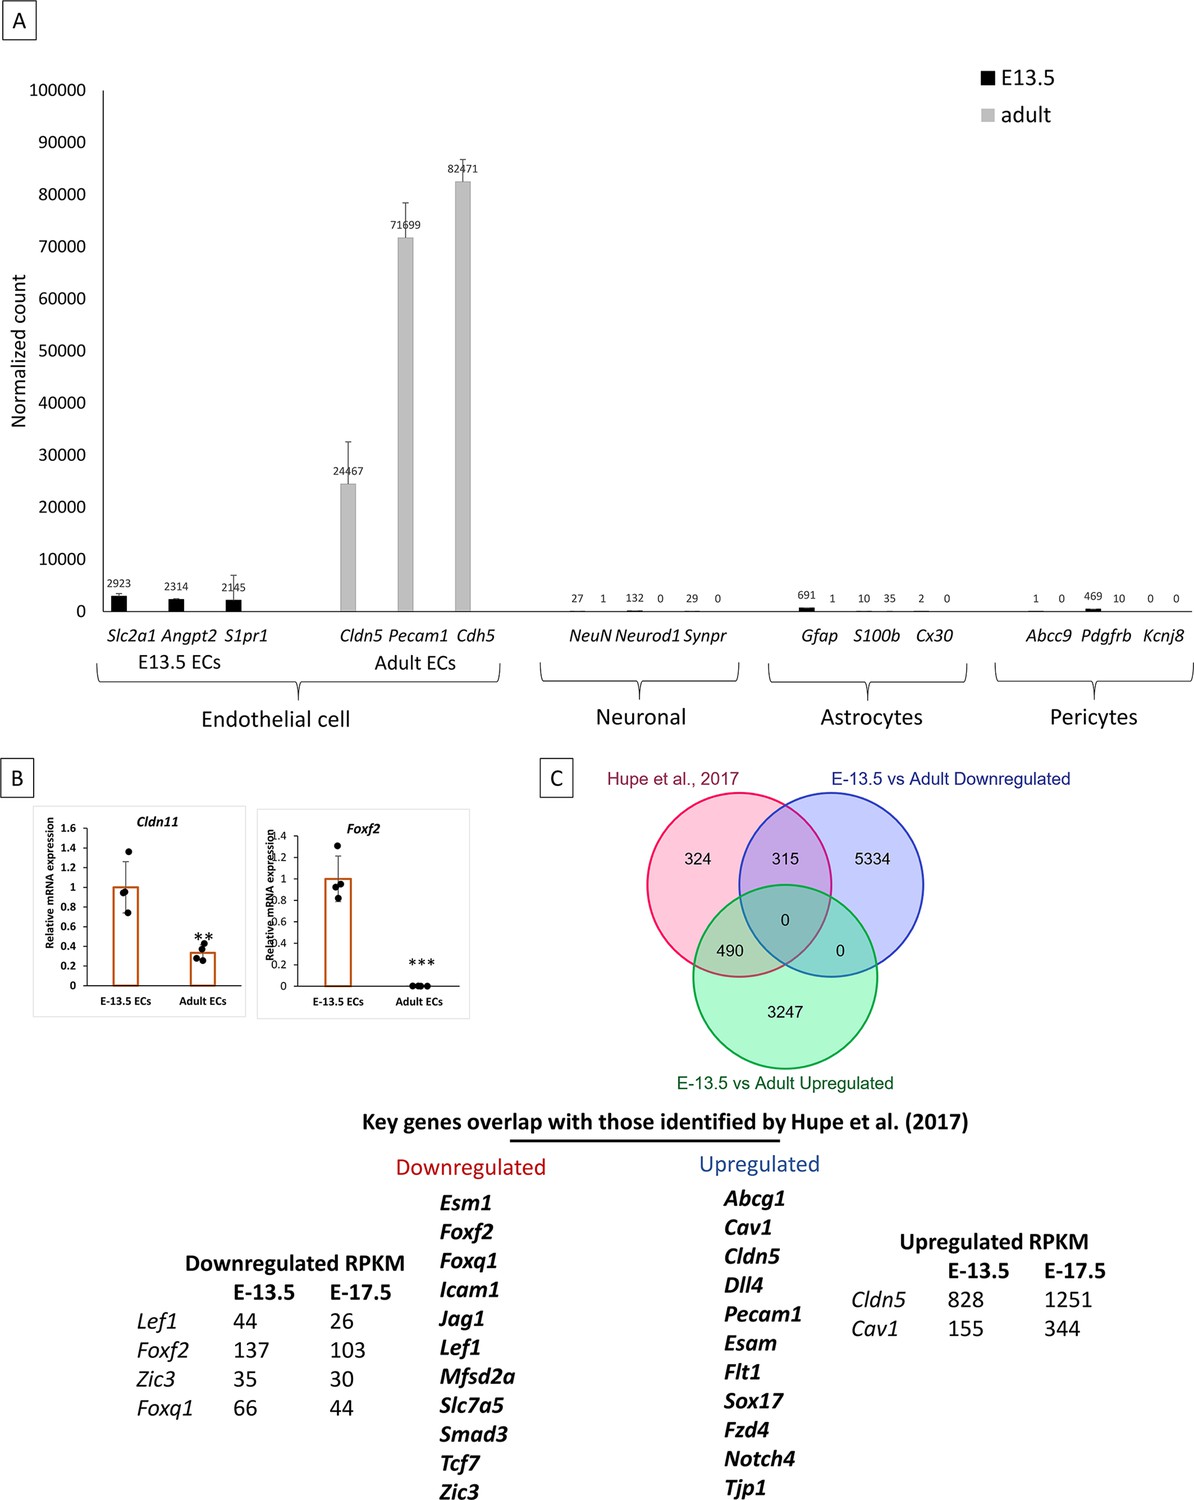
Endothelial cell markers expression and validation of mRNA seq data.
Endothelial cells (EC) markers Slc2a1, Angpt2, and Sipr1 expression were high in E-13.5 and adult primary cortical ECs. Adult ECs showed significant expression on Cldn5, Pecam, and Cdh5. These gene expressions were lower in E13.5 ECs. Neuronal, astrocytes, and pericytes population was low or null in isolated ECs. (B) Validation of mRNA-seq data for additional genes Foxf2 and Cldn11. ***p<0.001, **p<0.01, vs E-13.5 N=3–4/group. (C) Comparison of differentially expressed genes in E-13.5 vs adult stages with the Hupe et al., 2017 dataset, which includes genes regulated during embryonic development (E-11.5 to E-17.5). The Venn diagram shows the number of overlapping genes and highlights key genes that overlap with our data.
Figure 2 with 1 supplement

Epigenetic regulators histone deacetylase 2 (HDAC2) and polycomb repressive complex 2 (PRC2) regulate the transcription of blood-brain barrier (BBB) genes.
(A) Quantitative PCR (qPCR) of adult primary cortical endothelial cells (ECs) treated with trichostatin A (TSA) (200 nm) and MS-275(10 um) 48 hr showed significantly increased mRNA expression of Cldn1 compared to DMSO treated control while Cldn5 was significantly decreased with MS-275 treatment when compared to control (*p<0.001 vs Control #p<0.001 vs TSA treatment N=3/group). (B) mRNA expression level of class-I HDAC family members in adult primary cortical ECs. Expression was normalized to housekeeping genes GAPDH and HDAC1. Significant mRNA expression of Hdac2 was observed in adult primary cortical ECs compared to other Class-I HDACs (*p<0.05 vs HDAC1, 3, and 8 N=3/group). Hdac1 showed significantly higher expression compared to HDAC3 and HDAC8 (*p<0.05) and HDAC8 showed significantly higher expression compared to HDAC3 (*p<0.05). (C) Effect of Hdac2 siRNA on BBB gene expression in adult cortical ECs. Using lipofectamine adult cortical ECs were transfected with Hdac2 siRNA (500 µg). qPCR analysis revealed that compared to control siRNA treated group Hdac2 siRNA treated ECs showed significantly increased expression of Cldn1(*p<0.001), Mfsd2a (*p<0.05), and Zic3 (*p<0.05) while Cldn5 (*p<0.05) showed significantly decreased expression. N=3/group (D) HDAC2 occupancy of the indicated chromatin regions in primary cortical ECs from E-13.5 and adult. Occupancy was measured by ChIP followed by quantitative PCR (ChIP-qPCR). The adjacent gene and the distance to the TSS name chromatin regions. (* p<0.05 vs IgG N=3–4/group) (E) qPCR analysis of Cldn1, Cldn5, Mfsd2a, and Zic3 in EZH2 and control siRNA-treated adult primary cortical ECs. Compared to the control siRNA-treated group, Ezh2 siRNA-treated ECs showed significantly increased expression of Cldn1 (*p<0.001), Mfsd2a (*p<0.001), and Zic3 (*p<0.05), while Cldn5 (* p<0.05) showed significantly decreased expression. N=3/group. (F) ChIP-qPCR analysis of PRC2 subunit EED on indicated chromatin regions and genes in E13.5 and adult primary cortical ECs. *p<0.05 vs IgG, N=3–4 / group. (G) Schematic representation of HDAC2 and PRC2 binding on indicated genes in cortical ECs at E-13.5 and adult.
Figure 2—figure supplement 1
HDAC2 and PRC2 regulate the expression of key BBB genes during development.
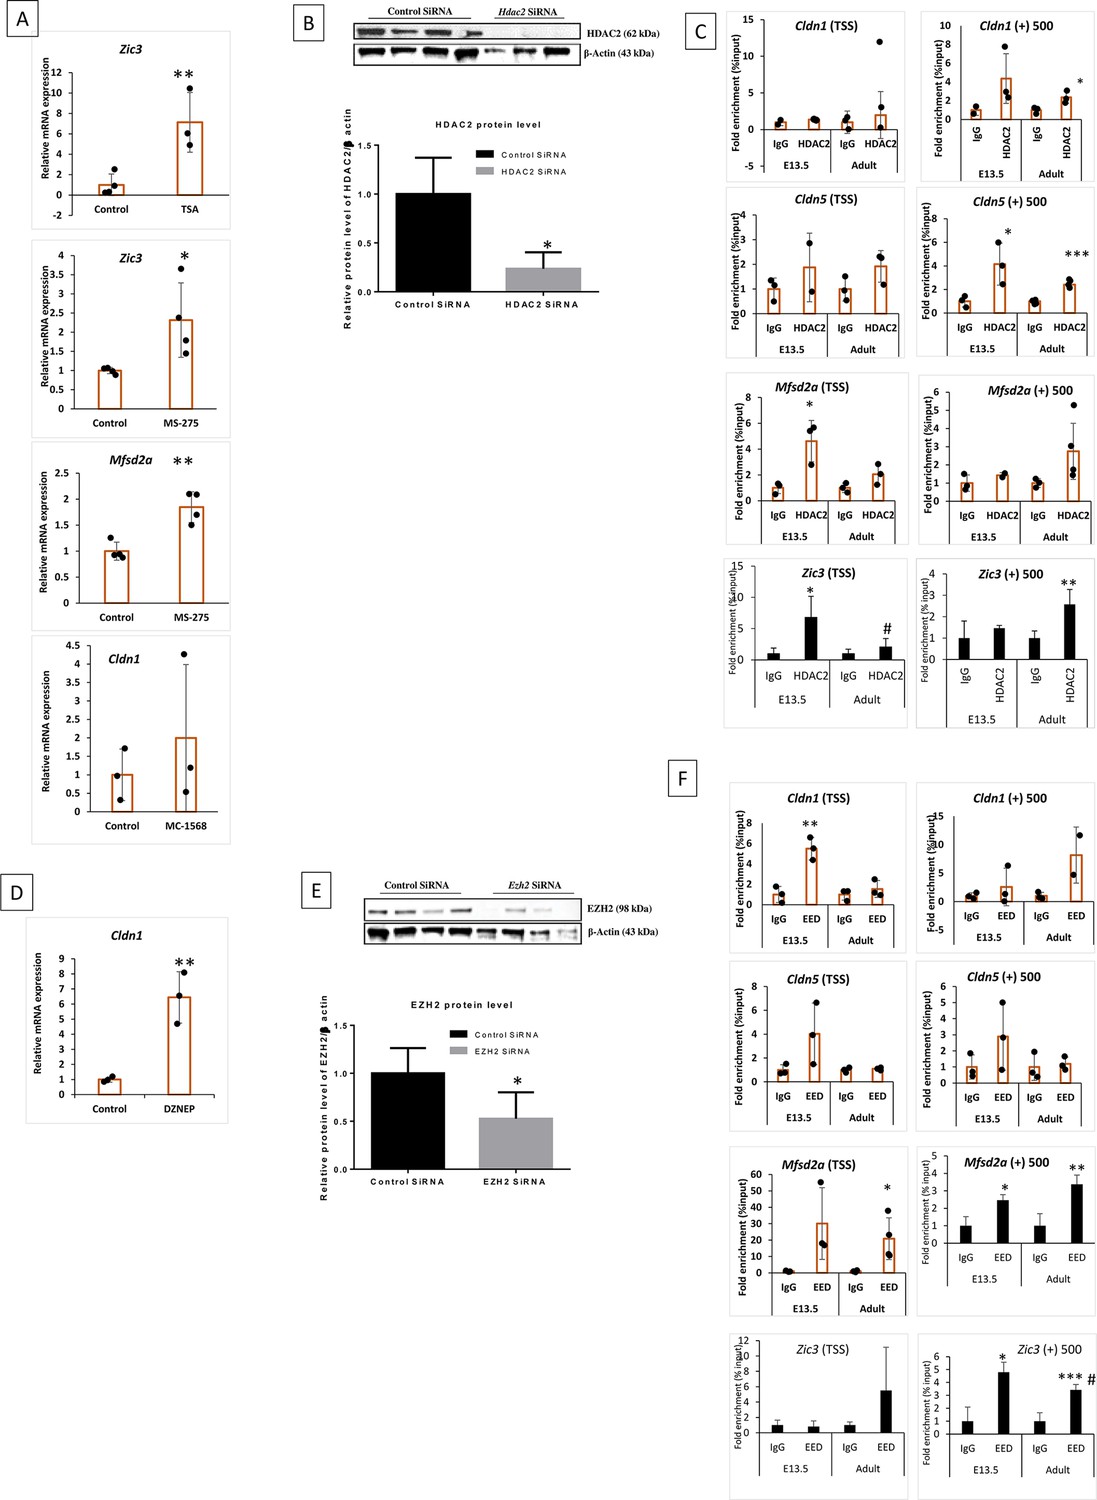
(A, D) Trichostatin A (TSA) treatment significantly increased the mRNA expression of Zic3 in primary adult primary cortical endothelial cells (ECs) **p<0.01 vs control, N=4. mRNA expression of Zic3 and Mfsd2a showed a significant increase in adult primary cortical ECs when treated with MS-275 **p<0.01, *p<0.05 vs control N=3. Cldn1 showed a significant increase in mRNA expression in adult primary cortical ECs when treated with DZNEP. (B, E) Western blot images and quantification showing the knockdown efficiency of Hdac2 and Ezh2 sirna. *p<0.05 vs. control N=3/4 group (C, F) ChIP-qPCR showing HDAC2 and PRC2 (EED) enrichment on indicated Cldn1, Cldn5, and Mfsd2a chromatin regions in E13.5 and adult cortical ECs. The ChIP signals were normalized to IgG. Data are shown as mean ± SD. ***p<0.001, **p<0.01, *p<0.05 vs IgG & ###p<0.001, ##p<0.01, #p<0.05 vs respective E-13.5 histone mark. N=3–4/group.
-
Figure 2—figure supplement 1—source data 1
PDF file containing original western blots for Figure 2—figure supplement 1B, E, indicating the relevant bands and treatments.
- https://cdn.elifesciences.org/articles/86978/elife-86978-fig2-figsupp1-data1-v1.zip
-
Figure 2—figure supplement 1—source data 2
Original files for western blot analysis are displayed in Figure 2—figure supplement 1B, E.
- https://cdn.elifesciences.org/articles/86978/elife-86978-fig2-figsupp1-data2-v1.zip
Figure 3 with 1 supplement

Blood-brain barrier (BBB) genes exhibit diverse post-translational histone modifications at E13.5 compared to adults.
(A, C & E) ChIP followed by quantitative PCR (ChIP-qPCR) analysis of histone marks H3K27me3, H3K4me3, and H3K9ac on 1 KB region Cldn1 gene in E13.5 and adult cortical endothelial cells (ECs). Cldn1 gene was downregulated in ECs during development. The ChIP signals were normalized to IgG. (B, D & F) ChIP-qPCR showing the H3K27me3, H3K4me3, and H3K9ac density at the Cldn5 gene in E13.5 and adult cortical ECs. Cldn5 gene was upregulated during development. Data are shown as mean ± S.D. ***p<0.001, **p<0.01, *p<0.05 vs IgG & ###p<0.001, ##p<0.01, #p<0.05 vs respective E-13.5 histone mark. N=3–4/group. (G) Schematic representation of H3K27me3, H3K4me3, and H3K9ac binding density on Cldn1, Cldn5, Mfsd2a, and Zic3 in E13.5 and adult primary cortical E.C.s. Shape size indicates the binding density in the indicated chromatin regions.
Figure 3—figure supplement 1
Key histone modifications in Mfsd2a, Zic3, and Sox17.
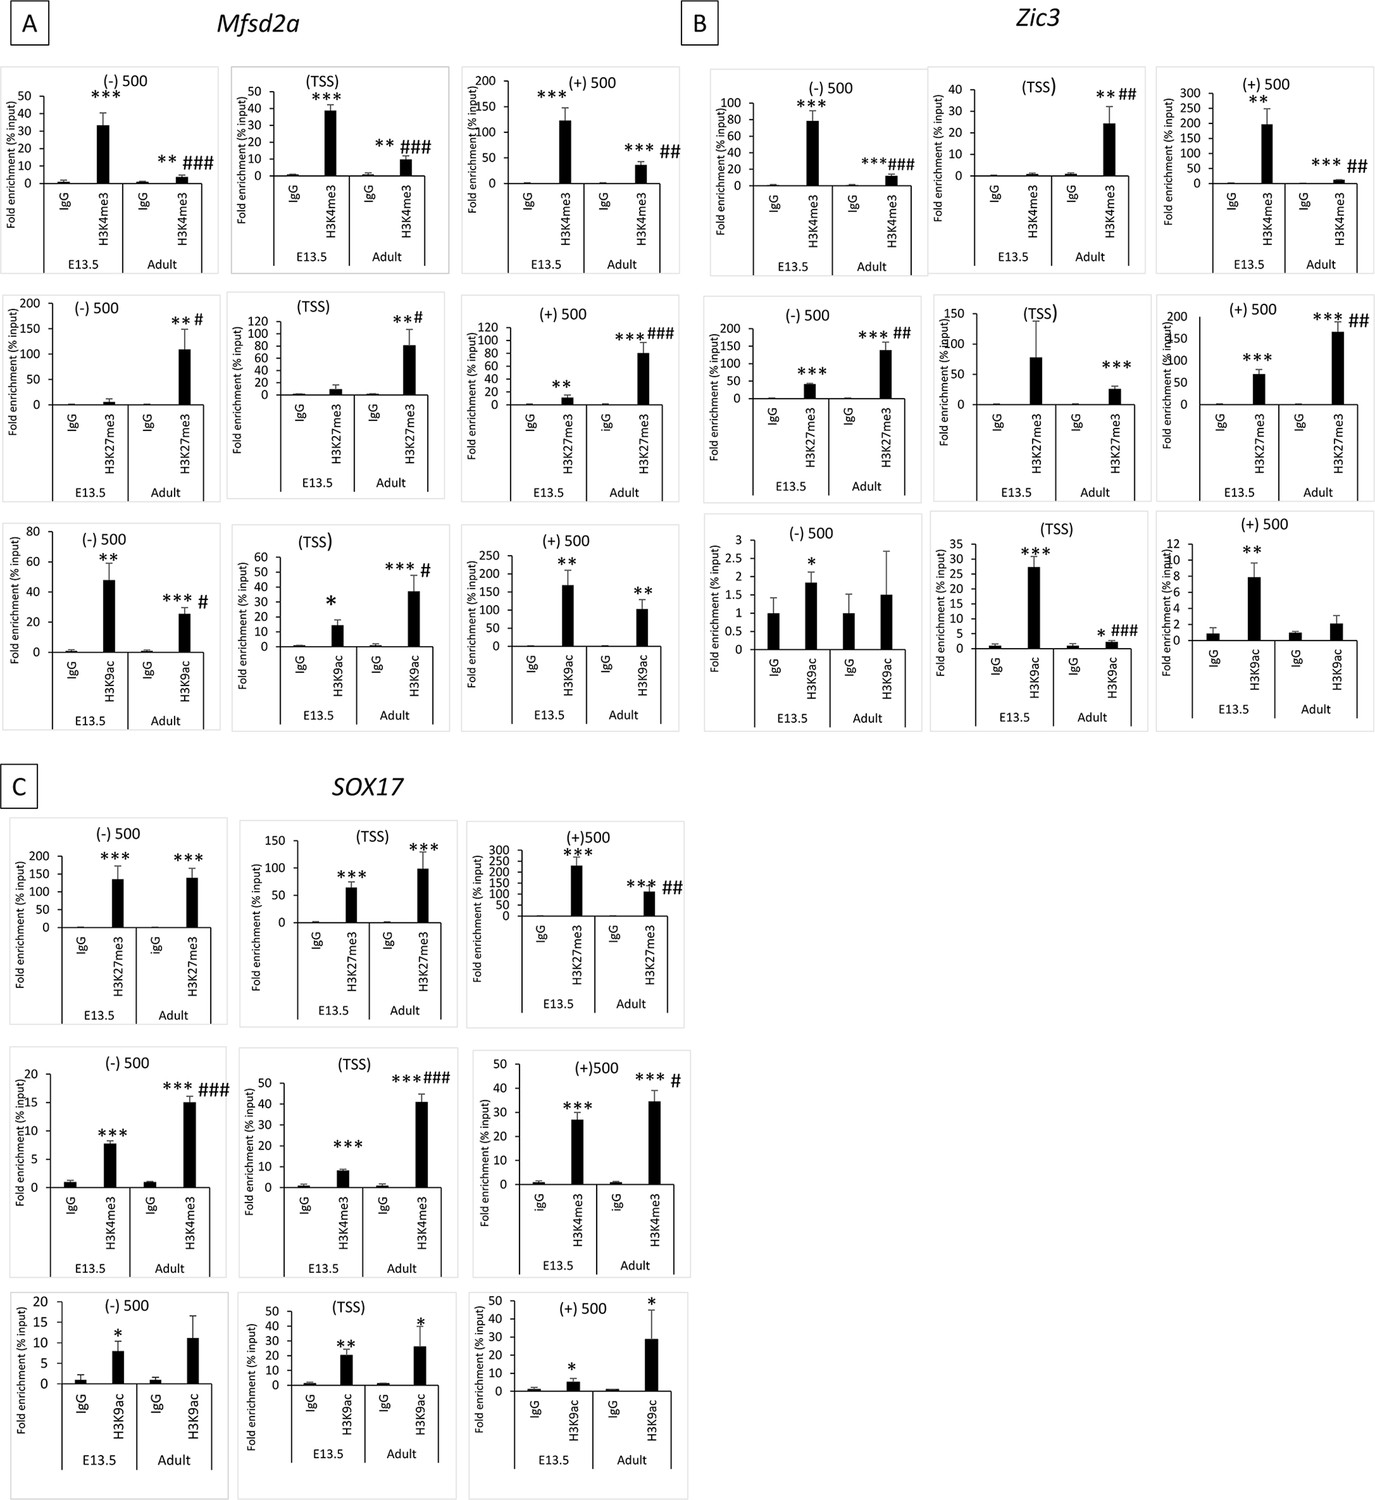
(A–C) Analysis of histone marks H3K27me3, H3K4me3, and H3K9ac in 1 KB regions of Mfsd2a, Zic3, and Sox17 genes in E13.5 and adult cortical endothelial cells (ECs) by ChIP followed by quantitative PCR (ChIP-qPCR). Mfsd2a, and Zic3 showed decreased and Sox17 showed increased expression in adults compared to E13.5. The ChIP signals were normalized to IgG. Data are shown as mean ± S.D. ***p<0.001, **p<0.01, *p<0.05 vs IgG & ###p<0.001, ##p<0.01, #p<0.05 vs respective E-13.5 histone mark. N=3–4/group.
Figure 4 with 1 supplement

Histone deacetylase 2 (HDAC2) activity is required to form a functional blood-brain barrier (BBB), while polycomb repressive complex 2 (PRC2) is dispensable.
(A) Effect of deletion of HDAC2 from the endothelial cells (ECs) during embryonic development. Schematic representation of breeding scheme and generation of EC-specific KO of HDAC2. Tamoxifen was delivered to the pregnant mother at E-12.5, and brains were harvested at E-17.5. (B) Representative phase microscopy images of the dorsal surface and ventral surface of the brain at E-17.5. Hdac2 ECKO shows a significant increase in pia vessels, as pointed out by black arrows on the dorsal surface. Black arrows in the ventral surface showed dilated vessels. (C) BBB permeability assay using 70KD tracer and isolectin B4 (IB4) staining to image the vessels. In Hdac2 ECKO, a green fluorescent tracer leaked out of the vessels, as indicated by the white arrows. 10 x images are acquired and merged using tile scanning. Scale bar, 500 µm (D) Vessel percentage area of Hdac2 ECKO was significantly higher than wild-type (WT) (*p<0.001 vs control N=10). A significant increase in fluorescent intensity was quantified in Hdac2 ECKO compared to WT (*p<0.0001 vs control N=3 for WT and N=5 for Hdac2 ECKO). (E) Schematic representation of breeding scheme and generation of Ezh2 ECKO. Tamoxifen was injected the same as for Hdac2 ECKO. (F) Representative phase microscopic image of WT and Ezh2 ECKO. As black arrows show, the Ezh2 ECKO brain shows dilated vessels with no visible increase in pial angiogenesis. (G) BBB permeability assay using 70KD-FITC Dextran shows subtle tracer leakage out of the vessels in Ezh2 ECKO, represented by white arrows. IB4 staining reveals the vessels in the brain. 10 x images are acquired and merged using tile scanning. Scale bar, 500 µm (H) Quantification of vessel percentage area (WT N=9 Ezh2 ECKO N=10) and fluorescent intensity didn't show any significant difference between WT and Ezh2 ECKO (WT N=5 Ezh2 ECKO N=5).
Figure 4—figure supplement 1
Effect of class-I HDAC2 inhibitor on the embryonic mouse brain and the expression of Ezh2, Cldn1, and Cldn5 in Ezh2 ECKO mice.
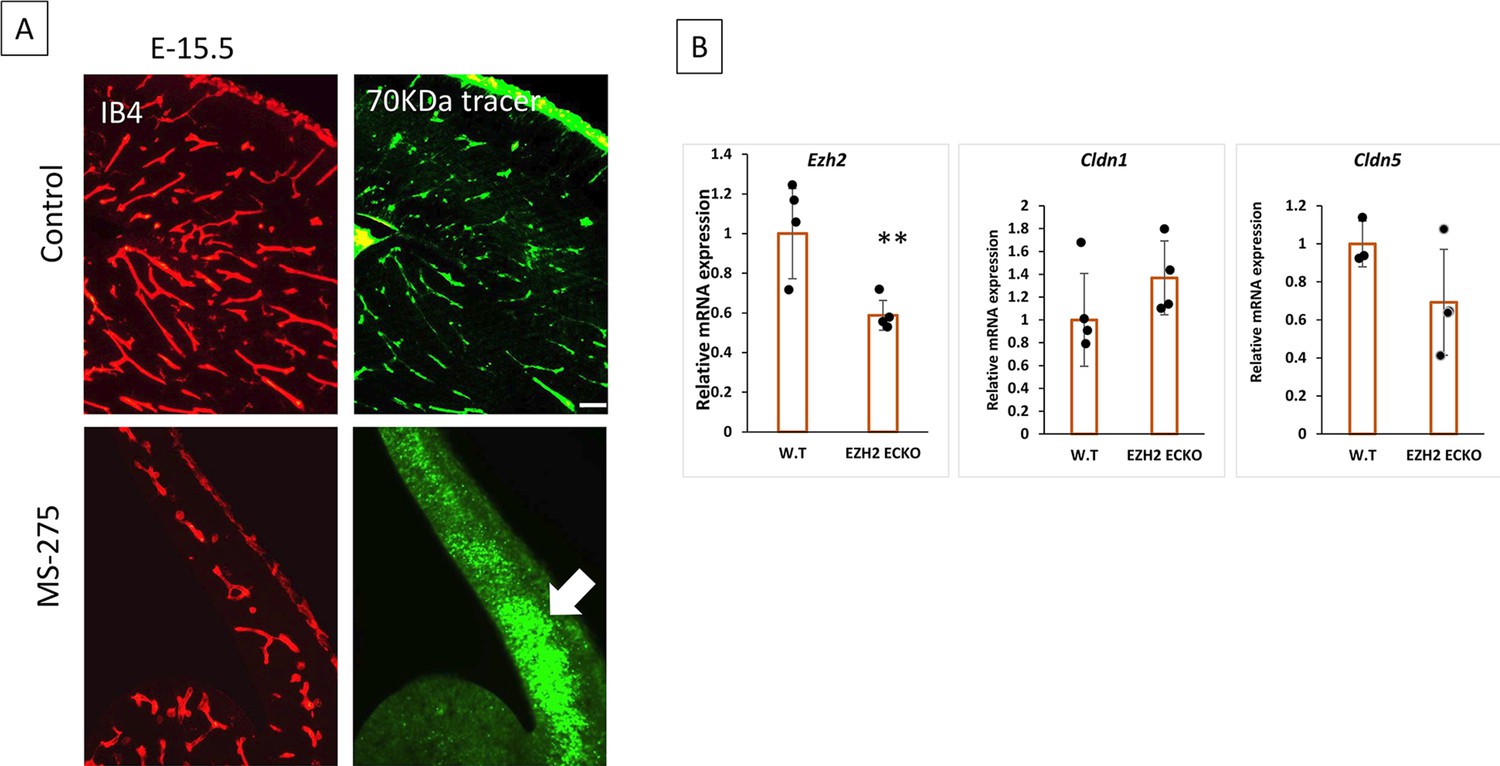
(A) Effect of Pharmacological inhibition of histone deacetylase 2 (HDAC2) in wild-type (WT) mice. MS275(20 mg/Kg) was injected IV into the pregnant mother at E13.5 and embryonic brains were harvested at E-15.5. MS-275 treated brain showed significant growth defects in the brain with narrow cortex, shunted, and leaky vessels. Vessels were stained with IB4 and 70 KDa FITC Dextran was used as a tracer. 10 x images are acquired, scale bar, 100 µm. (B) Compared to WT, Ezh2 ECKO showed significantly reduced Ezh2 mRNA expression. However, Cldn1 and Cldn5 showed no significant difference between WT and Ezh2 ECKO.
Figure 5 with 1 supplement

Upstream Wnt pathway is active in adult central nervous system (CNS) endothelial cells (ECs), but the Wnt target genes are epigenetically repressed.
(A) Diagram depicting the percentage of Wnt-related genes downregulated and upregulated adult cortical primary ECs compared to E-13.5. Selected important Wnt-related genes are shown. (B) Ligand-independent transcriptional repression of Wnt target genes. In primary cortical ECs from E-13.5, activating the Wnt pathway with Wnt3a (200 ng/mL) or CHIR-99021 (5 uM) for 48 hr. caused increased mRNA expression of Wnt target genes Axin2 and Lef1 (measured via qRT-PCR). However, activation of the Wnt pathway in primary adult mouse brain ECs does not increase Wnt target gene expressions. *p<0.001 vs E-13.5 control, ns-no significant difference n=3/group. (C) mRNA sequencing was performed in control and Wnt3a (200 ng/mL) treated adult primary cortical ECs. Differentially expressed genes were categorized into six categories important to CNS endothelial cells. (D) Immunofluorescence staining of β-catenin (green) in control and Wnt agonist Chir-99021 treated endothelial cells. White arrows indicate the nuclear localization of β-catenin to the nucleus. 20 x images are acquired, cropped, and enlarged. Scale bar, 1 µm. (E) Adult primary cortical ECs transfected with control, Hdac2 & Ezh2 siRNA showed significant upregulation of Wnt target genes Axin2. ***p<0.001 vs control siRNA & #p<0.05 vs control siRNA. N=3/group (F) histone deacetylase 2 (HDAC2), histone marks H3K27me3, H3K4me3, and H3K9ac occupancy on the Axin2 TSS regions in primary cortical ECs from E-13.5 and adult. ChIP followed by quantitative PCR (ChIP-qPCR) measured occupancy. N=3/group ***p<0.001, **p<0.01, *p<0.05 vs IgG & #p<0.05 vs H3K4me3 E-13.5.
Figure 5—figure supplement 1
Wnt target genes are epignetically silenced in adult ECs.
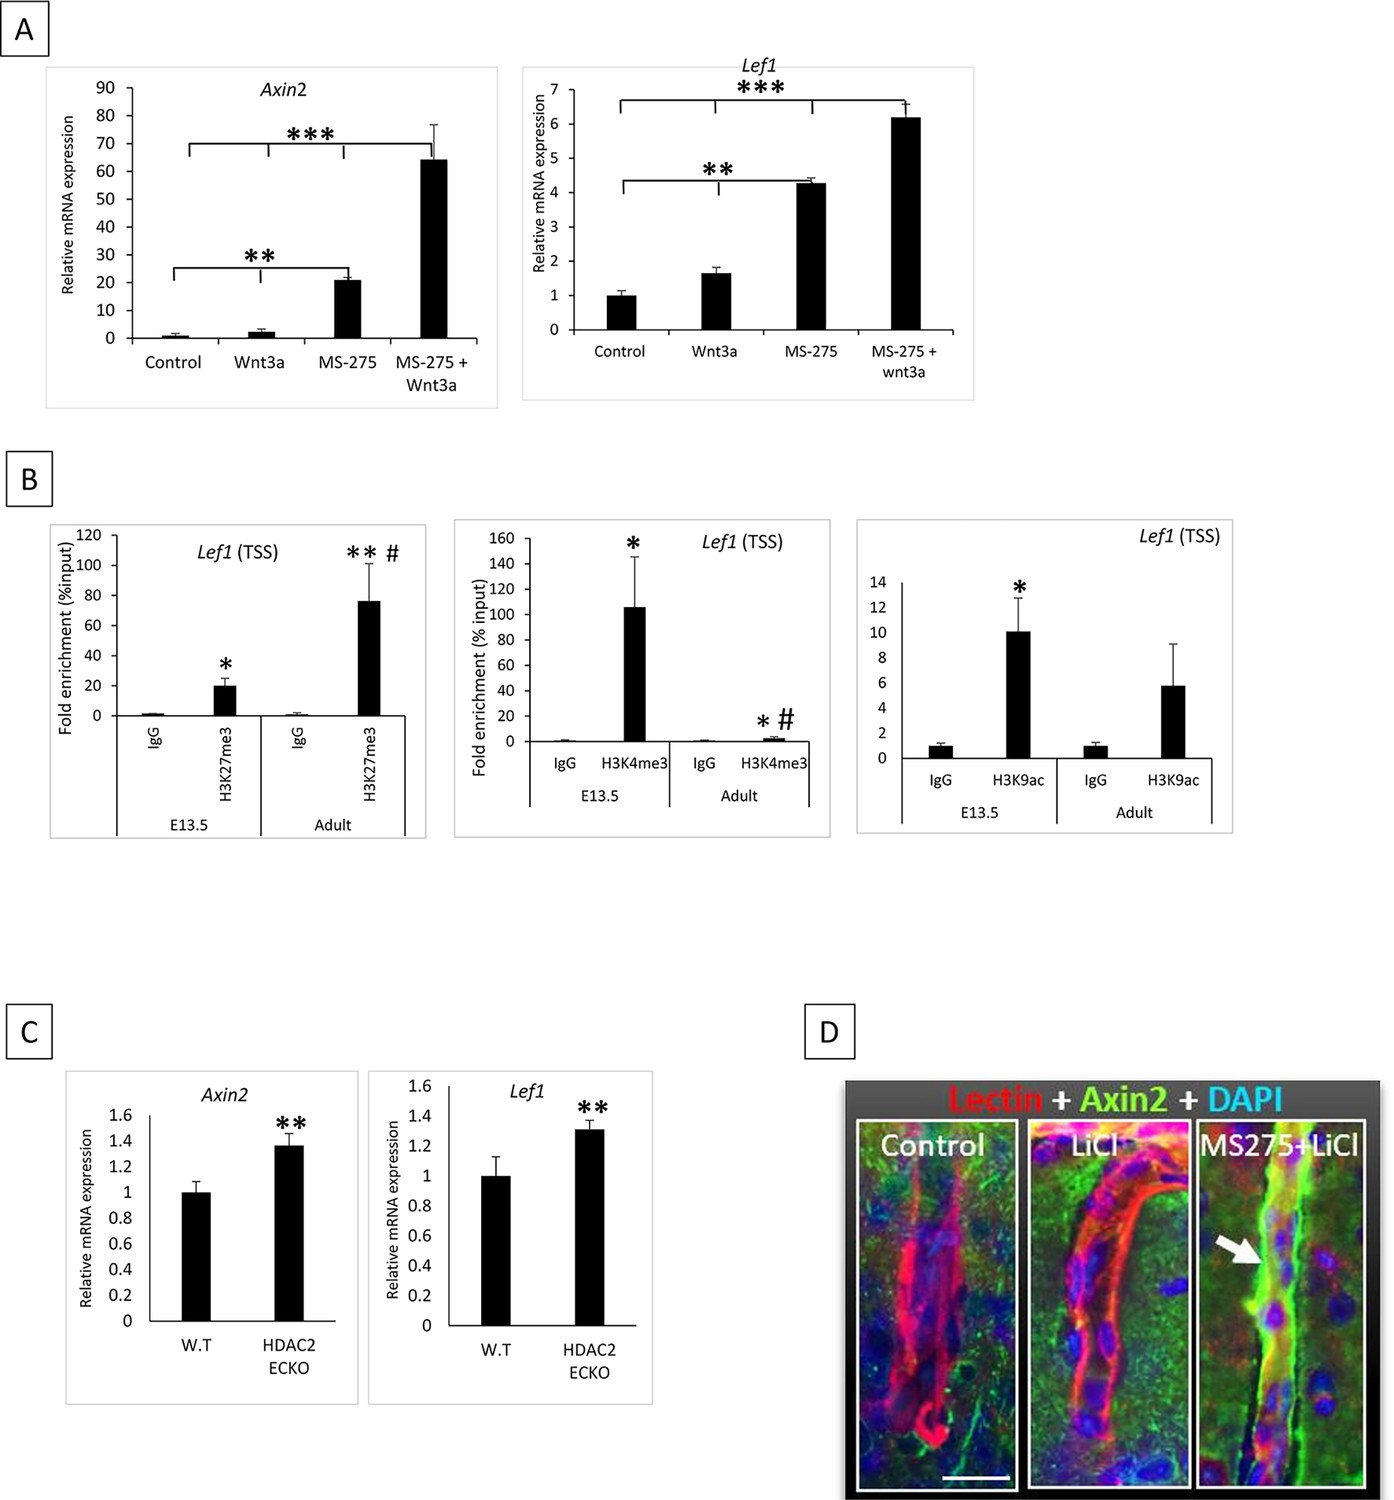
(A) Adult primary cortical endothelial cells (ECs) were treated with Wnt3a, MS-275, and MS-275 + Wnt3 a. mRNA expression of Wnt target genes Axin2 and Lef1 showed significantly increased expression with MS-275 treatment compared to control and Wnt3a. MS-275 + Wnt3 a treatment group showed significantly increased expression compared to other groups. ***p<0.001, **p<0.01, vs indicated conditions. N=3/condition. (B) ChIP followed by quantitative PCR (ChIP-qPCR) of H3K27me3, H3K4me3, and H3K9ac on Lef1 TSS. N=3–4/group **p<0.01, *p<0.05 vs IgG & #p<0.05 vs respective E-13.5 histone mark. (C) Axin2 and Lef1 mRNA expression showed significantly increased expression in Hdac2 ECKO compared to wild-type (WT) **p<0.01, vs WT N=3–5 group. (D) Immunohistochemistry showing the expression of Wnt target AXIN2 in the cortical vessels of control (DMSO + Saline), LiCl (80 mg/Kg) treated, and MS-275 (25 mg/Kg)+ LiCl treated mice. Vessels were stained with isolectin B4 (Red) and Axin2 is shown in a green channel and pointed with a white arrow. Scale bar, 10 µm.
Figure 6 with 1 supplement

Low Wnt signaling epigenetically modifies the blood-brain barrier (BBB) genes to achieve BBB maturation.
(A) Effect of Wnt pathway inhibition on BBB genes in E13.5 primary cortical endothelial cells (ECs). E-13.5 ECs were treated with LF3 (50 um) for 48 hr to inhibit the Wnt pathway. Significantly decreased mRNA expression of Axin2 confirmed the reduced Wnt pathway. mRNA expression of Cldn1, Mfsd2a, and Zic3 was significantly decreased Cldn5 and Sox17 expression was significantly increased after LF3 treatment. Data are shown as mean ± S.D. ***p<0.001, **p<0.01, *p<0.05 vs E13.5 control N=3/group. (B) Wnt pathway inhibition via LF3 induces epigenetic modifications in target gene Axin2 and BBB genes Cldn1, Mfsd2a, and Cldn5. First row- Axin2 showed significant enrichment of histone deacetylase 2 (HDAC2) and EED in LF3 treated E13.5 ECs compared to control (*p<0.05 vs IgG). Histone mark H3K27me3 showed significant enrichment in both conditions compared to IgG however, LF3-treated ECs showed significantly increased enrichment compared to the control. **p<0.01 vs IgG, #p<0.05 vs control N=3–4/group. Second row- LF3 treated E13.5 ECs showed significant enrichment of HDAC2 in Cldn1 TSS (*p<0.05 vs IgG N=3–4/group). Mfsd2a showed significant enrichment in both conditions, while LF3 treatment showed a significantly increased enrichment compared to the control (*p<0.05 vs IgG & ##p<0.01 vs control N=3/group). Cldn5 didn't show any significant difference in HDAC2 binding (not shown). At the same time, active histone marks H3K9ac showed significant enrichment in both conditions with an increased enrichment with LF3 treatment (***p<0.001, *p<0.05 vs IgG & #p<0.05 vs control N=3/group). Third row- H3K4me3 ChIP-qPCR on the TSS region of Cldn1, Mfsd2a, and Cldn5 showed significant enrichment in both conditions with a decreased enrichment with LF3 treatment on Cldn1 and Mfsd2a and an increased enrichment with LF3 treatment on Cldn5. ***p<0.001, *p<0.05 vs IgG & ##p<0.01, #p<0.05 vs control N=3–4/group. (C) Schematic representation of breeding scheme and generation of EC-specific gain of function (GOF) of β-catenin. Tamoxifen was delivered to the pregnant mother at E-12.5 and brains were harvested at E-17.5. (D) Representative Phase microscopy image of the dorsal brain from wild-type (WT) and β-catenin-GOF. Images in the square box were enlarged to show increased pial vessel angiogenesis. (E) BBB permeability assay using the 70KD FITC-Dextran tracer. Cortical vessels were stained using IB4.10X tile scanning images acquired and merged. FITC dextran was leaked out of the vessels in the brain of β-catenin GOF compared to WT 10 x images were acquired and merged using tile scanning. Scale bar, 500 µm (F) Quantification of brain vessels percentage area (***p<0.001 vs WT N=4–5/group) and green fluorescent intensity showed a significant increase in β-catenin GOF compared to WT ***p<0.001, *p<0.05 vs WT N=5–6/group.
Figure 6—figure supplement 1
Low Wnt signaling epigenetically modifies BBB genes to achieve a non-permeable BBB.
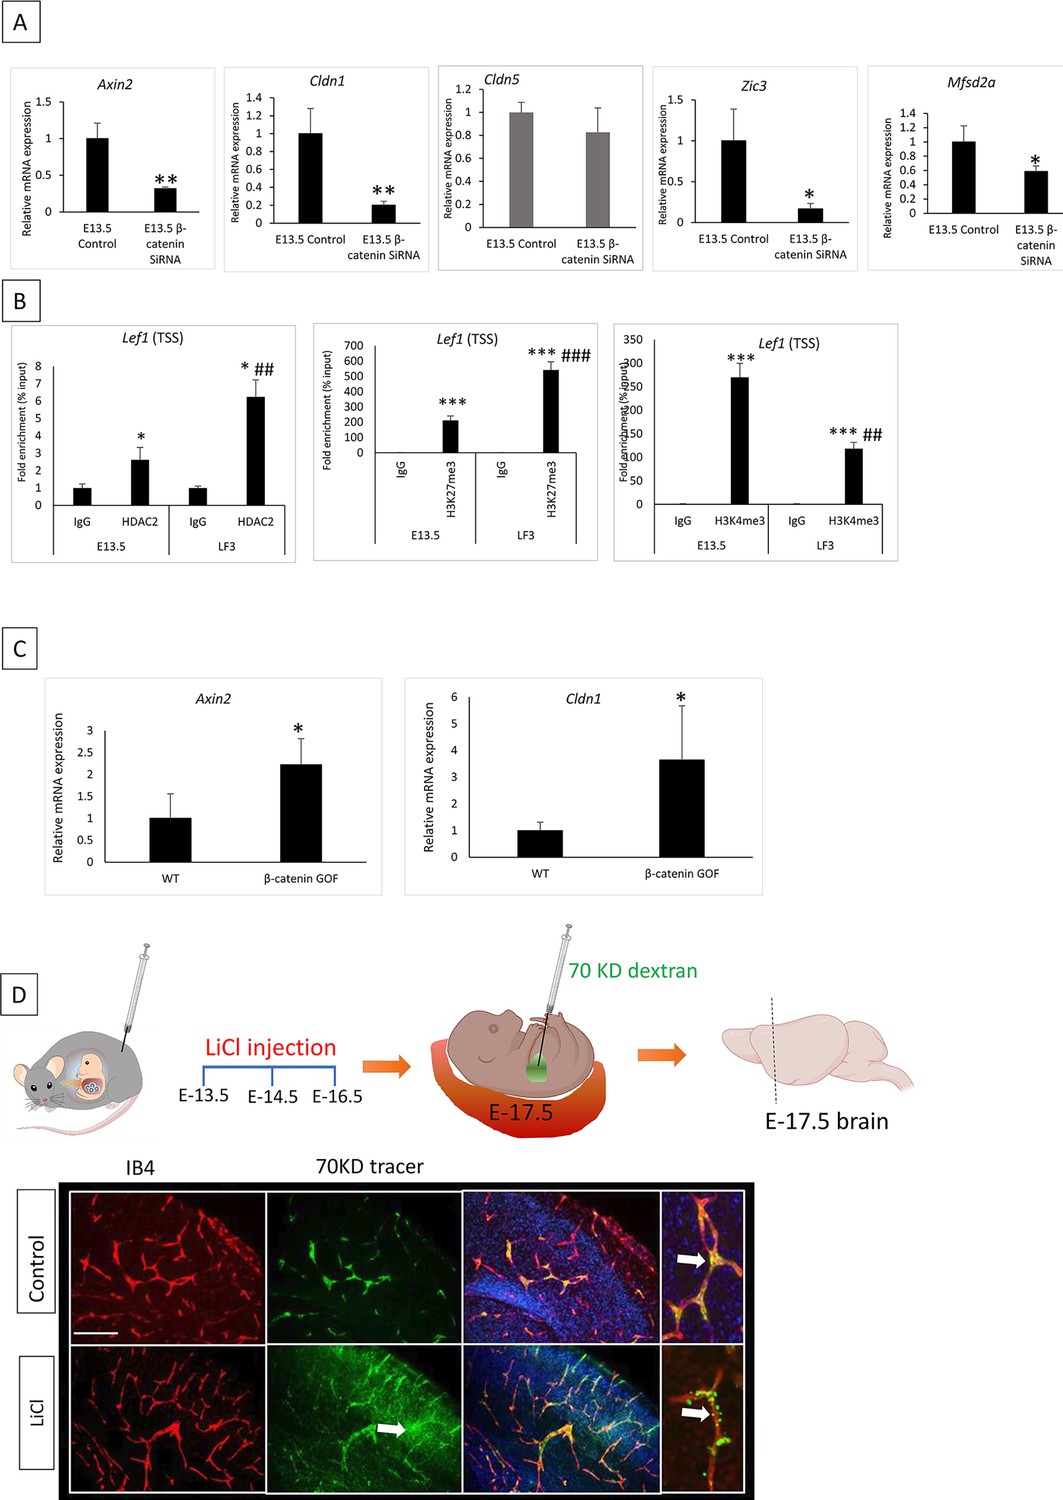
(A) E13.5 primary cortical endothelial cells (ECs) transfected with β-catenin siRNA showed a significant decrease in expression of Axin2, Cldn1, Zic3, and Mfsd2a with no significant difference in Cldn5 compared to the control. **p<0.01, *p<0.05 vs control N=3/group. (B) Wnt target gene Lef1 showed significantly increased enrichment of histone deacetylase 2 (HDAC2) in LF3 treated E13.5 ECS compared to control. *p<0.05 vs respective IgG and ##p<0.01 vs E13.5 control HDAC2 N=3–4/group. Repressive histone mark H3K7me3 showed significantly increased enrichment, and active histone mark H3K4me3 showed significantly decreased enrichment in LF3-treated E13.5 cortical E.C.s. *p<0.05 vs respective IgG and ###p<0.001, ##p<0.00 vs E13.5 control H3K27me3 or H3K4me3. (C) mRNA analysis of Axin2 and Cldn1 in the whole brain of WT and β-catenin GOF. *p<0.05 vs WT N=3–4/group. (D) Pharmacological activation of Wnt pathway using LiCl (80 mg/Kg) in pregnant mice. LiCl was injected on days as shown, and the brain was harvested at E-17.5 after the tracer was injected. White arrows show that a 70KD FITC-dextran tracer leaked outside of the vessel in the LiCl-treated embryos, and the control showed a tracer inside the vessels. Vessels were stained with isolectin B4, and the nucleus was stained with DAPI. The scale bar is 100 µm.
Figure 7 with 1 supplement

Histone deacetylase 2 (HDAC2) deletion or inhibition activates the angiogenesis, blood-brain barrier (BBB), and Wnt pathway genes.
(A) Tamoxifen was administered to pregnant mothers starting at E-12.5 on alternate days until E-16.5. The cortex was harvested at E-17.5, and CD31+ endothelial cells were isolated via fluorescence-activated cell sorting (FACS). The resulting cells were processed for ultra-low-input mRNA sequencing. (B) Six key EC-regulated pathways categorize downregulated and Upregulated genes. (C) Key differentially expressed genes in EC-regulated pathways. N=3 from three different mothers (*p<0.05). (D) In adult ECs, treatment with MS-275 induces partial reactivation of angiogenesis and BBB formation supporting gene cohorts. Diagram depicting the number of genes downregulated and upregulated in MS-275 treated adult cortical ECs compared to control. (E) Downregulated and upregulated genes were categorized with six important EC functions. (F) Heat map of expression values (Z score) for differentially expressed genes (*p adj <0.05) in E13.5, adult Control, and adult treated with MS-275. Five gene categories showing significant differences between E13.5 vs adult control and Adult Control vs Adult MS-275 treatment are presented. N=3 for E13.5 and adult control, N=4 for MS-275.
Figure 7—figure supplement 1
Wnt7a expression is suppressed in adult CNS ECs, but epigenetic activation is possible.
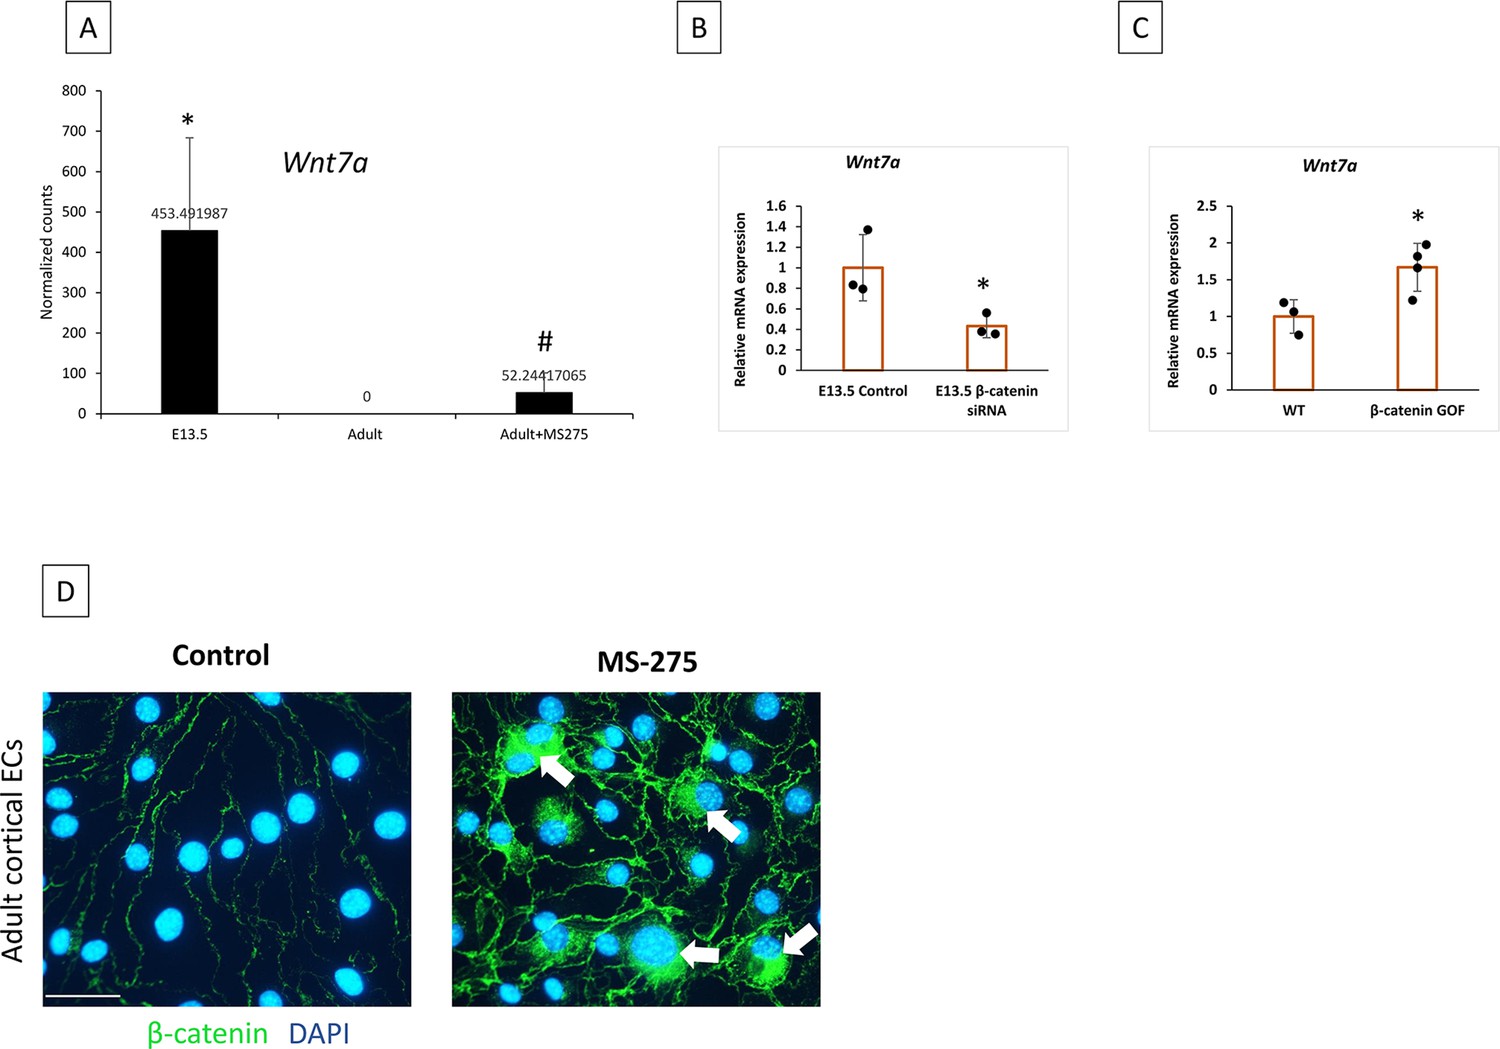
(A) Normalized count for Wnt7a in endothelial cells (ECs) from E13.5, adults, and adults treated with MS-275. *p<0.05 vs Adult and #p<0.05 vs adult. (B) E13.5 primary cortical ECs transfected with β-catenin siRNA showed a significant decrease in expression of Wnt7a compared to the control. *p<0.05 Vs control N=3/group. (C) β-catenin gain of function (GOF) in ECs significantly increased the mRNA level of Wnt7a in the whole brain analysis. *p<0.05 vs WT N=3–4/group. (D) β-catenin staining on primary adult cortical ECs treated with vehicle DMSO and MS-275(10 uM). MS-275 treatment showed nuclear localization of β-catenin into the nucleus as indicated by white arrows. 20 x images are acquired. Scale bar, 20 µm.
Figure 8

Epigenetic modification induced by MS-275 is temporary.
(A) Adult primary cortical endothelial cells (ECs) treated with MS-275 for 48 hr showed significant activation of Cldn1 and downregulation of Cldn5. mRNA analysis on ECs after 7 d of withdrawing MS-275 showed a significant reversal of expression back to normal. *p<0.001 compared to control 48 hrs. # p<0.001 compared to MS-275 48 hr (B) Effect of class-I histone deacetylase (HDAC) inhibition on adult human cerebral arteries. Representative phase contrast image of human temporal lobe vessels in culture collected from epilepsy patients undergoing surgery. MS-275 treated human vessels showed significantly increased mRNA expression of Cldn1 and Axin2 compared to control. **p<0.01 and *p<0.05 N=5/group. No significant difference was observed in Cldn5 expression. (C) Schematic diagram illustrating the mechanisms underlying blood-brain barrier (BBB) formation and maintenance led by epigenetic regulators histone deacetylase 2 (HDAC2) and polycomb repressive complex 2 (PRC2). HDAC2 and PRC2 epigenetically repress EC gene cohorts that support BBB formation during development. Active Wnt signaling supports the expression of gene cohorts required for BBB formation. In contrast, a reduction in Wnt signaling recruits HDAC2 to these gene cohorts to support the formation of a functional or intact BBB. Inhibiting HDAC2 in adult ECs induces the reacquisition of gene cohorts that support BBB formation, thus representing a potential therapeutic opportunity to repair a damaged BBB.
Additional files
-
MDAR checklist
- https://cdn.elifesciences.org/articles/86978/elife-86978-mdarchecklist1-v1.docx
-
Supplementary file 1
QPCR and Chip-qPCR primers.
- https://cdn.elifesciences.org/articles/86978/elife-86978-supp1-v1.docx
Download links
A two-part list of links to download the article, or parts of the article, in various formats.
Downloads (link to download the article as PDF)
Open citations (links to open the citations from this article in various online reference manager services)
Cite this article (links to download the citations from this article in formats compatible with various reference manager tools)
Key epigenetic and signaling factors in the formation and maintenance of the blood-brain barrier
eLife 12:RP86978.
https://doi.org/10.7554/eLife.86978.3


