Reciprocal discoidin domain receptor signaling strengthens integrin adhesion to connect adjacent tissues
- Department of Biology, Duke University, United States
- Department of Cell Biology, Duke University Medical Center, United States
Figures
Figure 1

Morphogenesis of the C. elegans utse-seam basement membrane (BM)-BM tissue connection.
(A) Left and center: Schematic depicting the utse-seam connection. The utse (a syncytial uterine cell) and the seam epidermal cells are both encased in BMs, which are linked by a BM-BM connecting matrix. Right: Ventral fluorescence z-projection showing the utse and seam cells visualized by the markers cdh-3p::mCherry::PLC δPH and scmp::GFP::CAAX, respectively. (B) Schematic illustrating the role of the utse-seam connection in supporting the uterus during egg-laying muscle contractions. Disruption of the connection results in uterine prolapse. (C) Lateral brightfield images of adult worms on control RNAi treatment or RNAi against a key component of the BM-BM linkage, α1 type IV collagen/emb-9 (RNAi fed from the L1 onward); note the uterine prolapse after loss of collagen. (D) A schematic summarizing the development of the utse-seam connection. Fluorescence images shown are ventral z-projections of the utse and the seam at the respective developmental stages from the late L3 to young adult (hours post-hatch at 20°C). Arrow indicates the uterine anchor cell (AC) that fuses with adjacent uterine cells to form the utse. During syncytium formation, the utse makes contact with the seam cells (arrowheads). Dotted boxes denote the BM-BM connection. Scale bars, 20 µm.
Figure 2 with 1 supplement
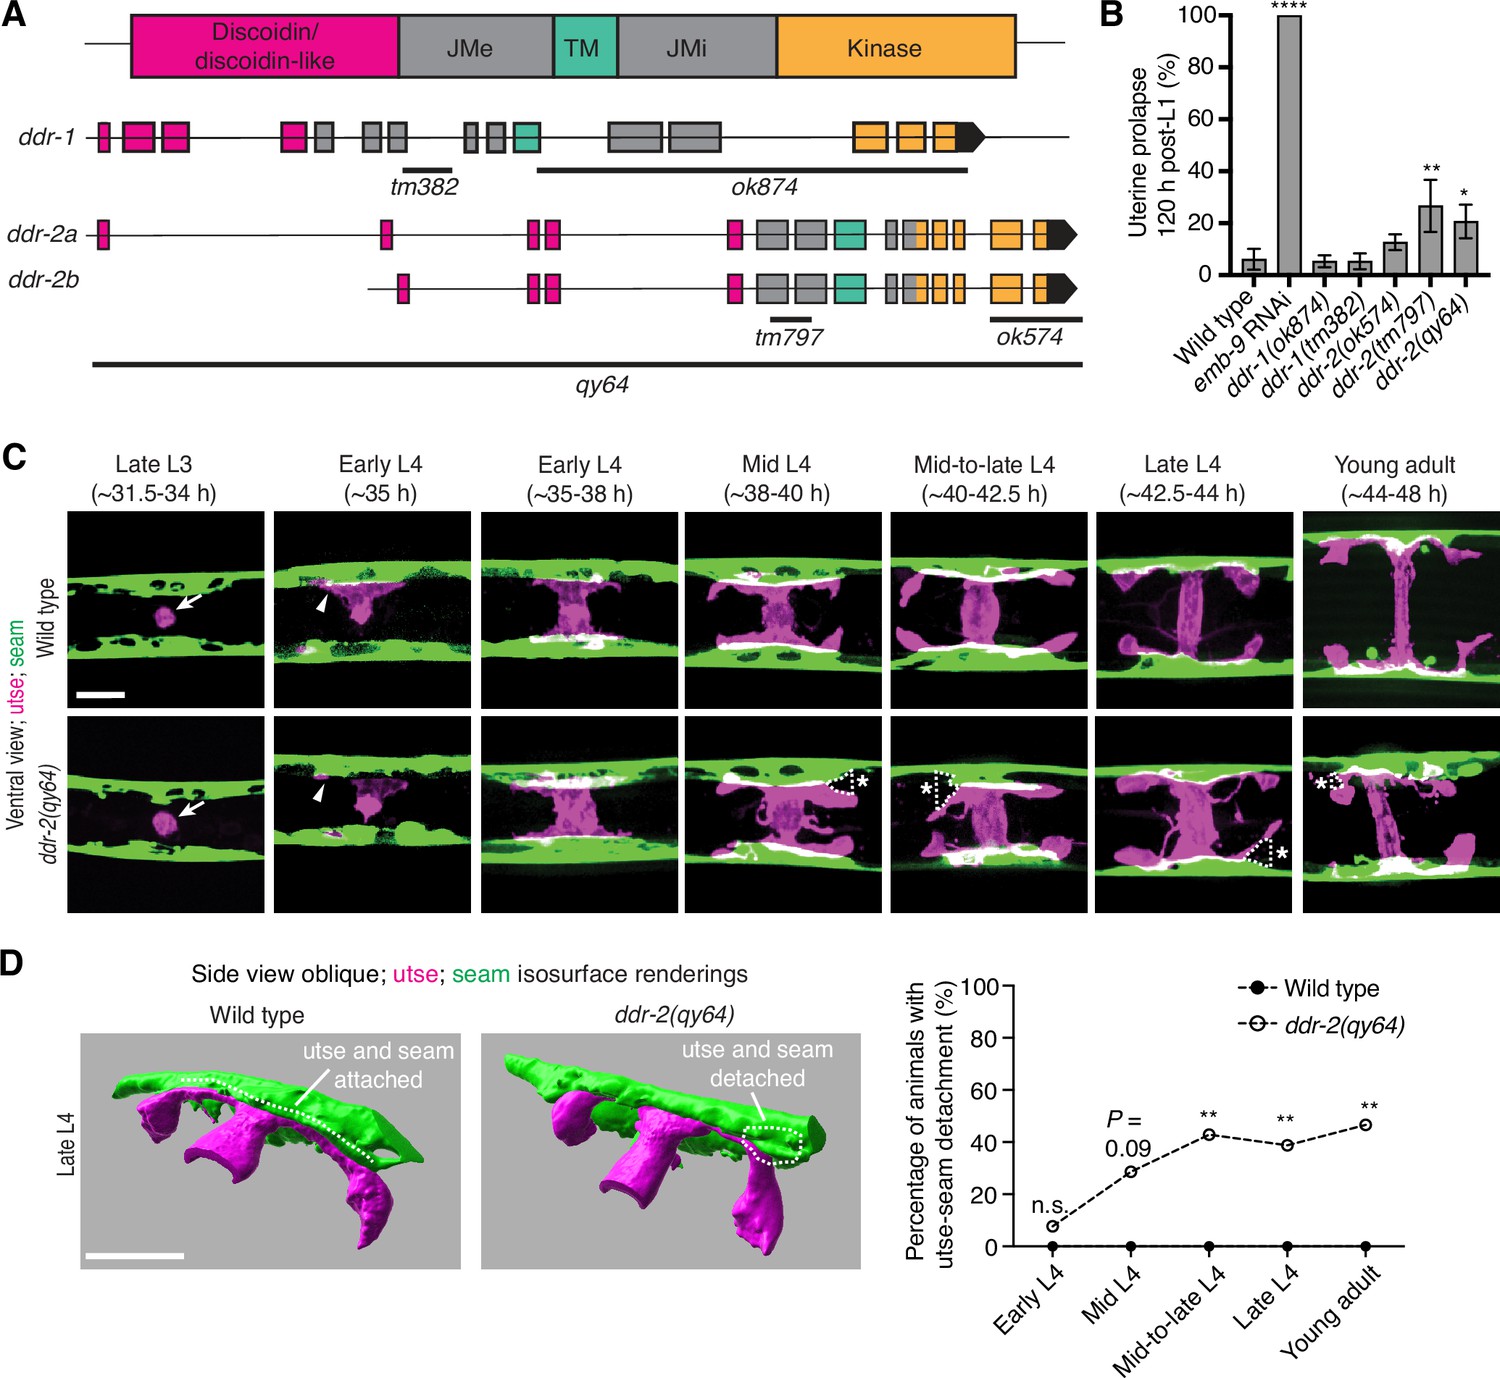
Discoidin domain receptor-2 (DDR-2) promotes utse-seam attachment and protects against uterine prolapse.
(A) Domain structure of C. elegans DDRs and exon-intron gene structures of ddr-1 and ddr-2. Exons are color coded according to respective domains. Gene regions that are deleted in respective mutant alleles (italicized text) are demarcated by solid black lines. (B) Frequency of uterine prolapse in ddr-1 and ddr-2 mutant animals compared to wild type 120 hr post-L1 plating. Data are shown as mean prolapse percentage ± SD, derived from three independent trials (n=50 animals screened per trial). α1 type IV collagen/emb-9 RNAi was used as a positive control. ****p≤0.0001, **p≤0.01, *p≤0.05; one-way ANOVA with post hoc Dunnett’s test. (C) Ventral fluorescence z-projections of the utse (cdh-3p::mCherry::PLC δPH) and seam (scmp::GFP::CAAX) cells in wild-type and ddr-2 knockout (ddr-2(qy64)) animals from the late L3 to young adult developmental stages (hours post-hatch at 20°C). Arrows indicate the AC prior to utse formation and arrowheads denote early contacts between the utse and seam. Dotted lines with asterisks indicate regions of utse-seam detachment in ddr-2(qy64) animals. (D) Left: 3D isosurface renderings of the utse and seam in representative late L4 wild-type and ddr-2(qy64) animals (see also Figure 2—video 1). Right: Quantification of the percentage of animals with utse-seam detachment. Wild type, early L4 to young adult: n=0/13, n=0/14, n=0/22, n=0/21, n=0/18 animals with detachments respectively; ddr-2(qy64), early L4 to young adult: n=1/13, n=4/14, n=9/22, n=7/18, n=7/15 animals with detachments respectively. **p≤0.01, n.s. (not significant), p>0.05; Fisher’s exact test. Scale bars, 20 µm.
-
Figure 2—source data 1
Source data for Figure 2.
Raw data of uterine prolapse frequency used to generate Figure 2B in Microsoft Excel format.
- https://cdn.elifesciences.org/articles/87037/elife-87037-fig2-data1-v1.xlsx
Figure 2—video 1
Animation of 3D isosurface rendering of the utse and seam in a representative late L4 wild-type animal; related to Figure 2D.
Figure 3 with 1 supplement
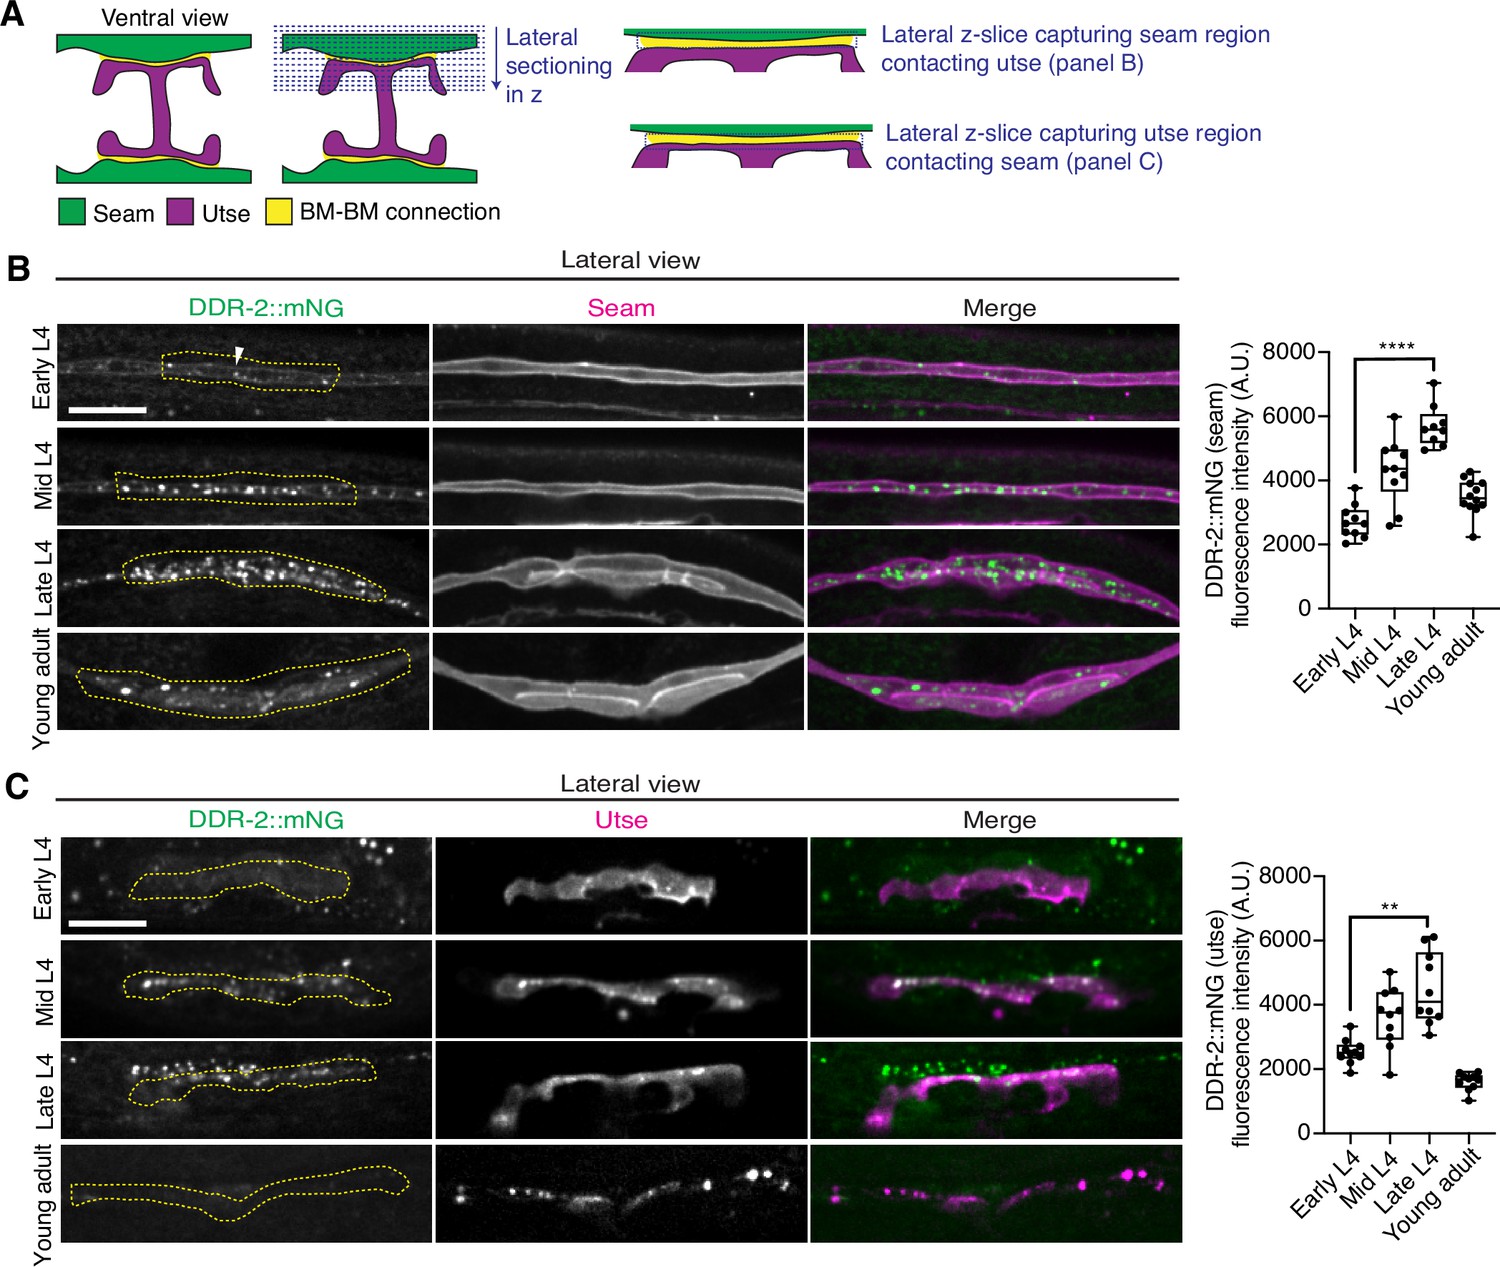
Discoidin domain receptor-2 (DDR-2) levels peak in the utse and seam during the formation of the basement membrane (BM)-BM connection.
(A) Schematic illustrating lateral z-sectioning to determine slices that capture the seam region in contact with the utse and vice versa. (B) Left: Lateral fluorescence images of DDR-2::mNG visualized with the seam marker scmp::2xmKate2::PLC δPH from the early L4 to young adult stages. Dotted yellow regions indicate DDR-2 signal in the seam contacting the utse. White arrowhead denotes DDR-2 signal at the cell surface. Right: Quantification of mean DDR-2::mNG fluorescence intensity in the dotted regions (n≥9 for each developmental stage). ****p≤0.0001, one-way ANOVA with post hoc Dunnett’s test. (C) Left: Lateral fluorescence images of DDR-2::mNG visualized with the utse marker cdh-3p::mCherry::PLC δPH from the early L4 to young adult stages. Dotted yellow regions indicate DDR-2 signal in the utse contacting the seam. Right: Quantification of mean DDR-2::mNG fluorescence intensity in dotted yellow regions (n=10 all stages). **p≤0.01, one-way ANOVA with post hoc Dunnett’s test. Scale bars, 20 µm. Box edges in boxplots represent the 25th and 75th percentiles, the line in the box denotes the median value, and whiskers mark the minimum and maximum values.
-
Figure 3—source data 1
Source data for Figure 3.
Raw data of DDR-2::mNG fluorescence intensity quantification in the seam and utse used to generate boxplots in Figure 3B and C in Microsoft Excel format. Note that the boxplot in Figure 3—figure supplement 1A was also generated from these data.
- https://cdn.elifesciences.org/articles/87037/elife-87037-fig3-data1-v1.xlsx
Figure 3—figure supplement 1
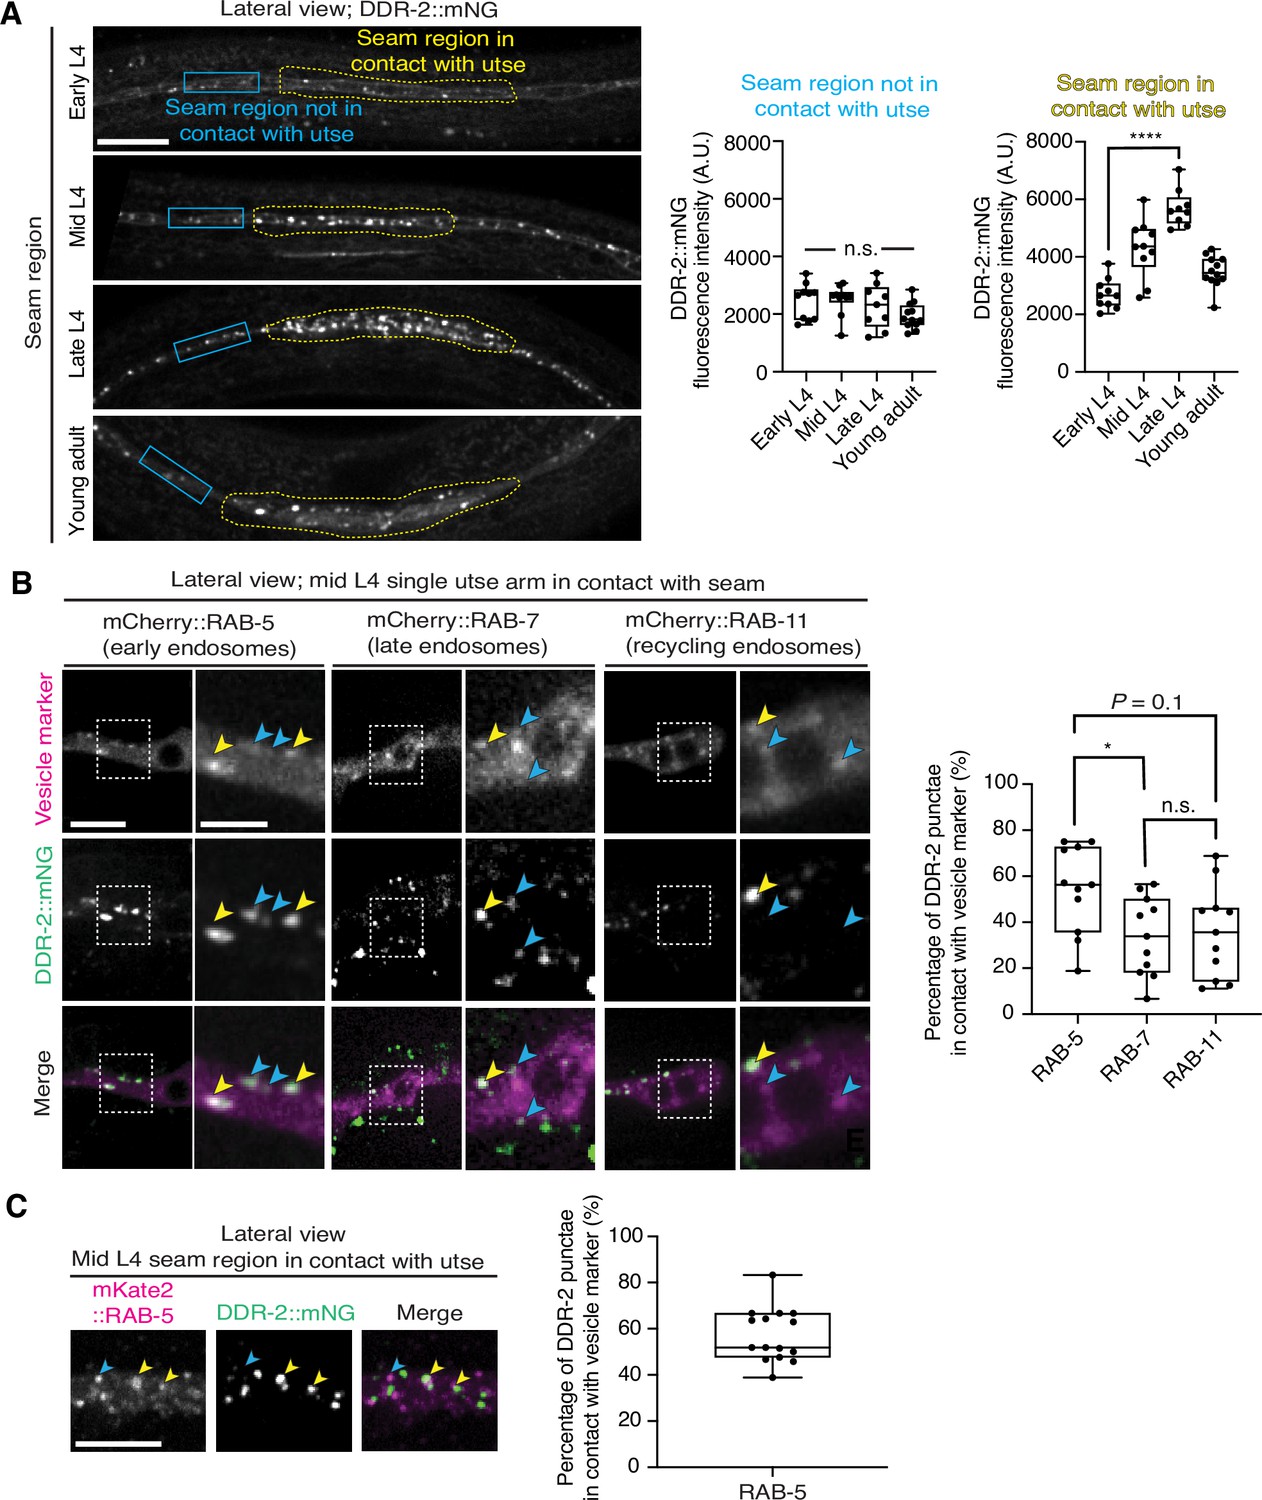
Discoidin domain receptor-2 (DDR-2) is found within endocytic vesicles.
Related to Figure 3. (A) Lateral fluorescence images of DDR-2::mNG in the seam cells from the early L4 to young adult stages. Note that these images are the same animals as in Figure 3B with a larger cropped field of view to include regions of the seam not in contact with the utse. Quantification of mean fluorescence intensity in the blue and yellow boxed regions is shown on the right (n≥9 all stages). Boxplots for yellow boxed regions are reproduced from Figure 3B. n.s. (not significant), p>0.05; Kruskal-Wallis H test. ****p≤0.0001, one-way ANOVA with post hoc Dunnett’s test. (B) Lateral fluorescence images of DDR-2::mNG within a single arm of the utse tissue at the mid L4 stage, visualized together with mCherry-tagged RAB-5, RAB-7, or RAB-11. Boxed regions are magnified on the right. Yellow arrowheads denote DDR-2 punctae in contact with the respective vesicle marker, while blue arrowheads correspond to DDR-2 punctae that are not in contact with vesicle markers. The boxplot shows quantification of percentage overlap of DDR-2 punctae with vesicle markers (n=11 animals per marker). *p≤0.05, n.s. (not significant), p>0.05; one-way ANOVA with post hoc Dunnett’s T3 test. (C) Left: Lateral fluorescence images of DDR-2::mNG and mKate2::RAB-5 in the seam region contacting the utse. Arrowheads denote DDR-2 punctae in contact with (yellow) or not in contact with (blue) mCherry::RAB-5 punctae. Right: Percentage overlap of DDR-2 punctae with RAB-5 (n=15). Scale bars, 20 µm. Box edges in boxplots represent the 25th and 75th percentiles, the line in the box denotes the median value, and whiskers mark the minimum and maximum values.
-
Figure 3—figure supplement 1—source data 1
Source data for Figure 3—figure supplement 1.
Raw data of DDR-2::mNG and mCherry-tagged vesicle marker co-localization analysis used to generate boxplots in Figure 3—figure supplement 1B and C in Microsoft Excel format.
- https://cdn.elifesciences.org/articles/87037/elife-87037-fig3-figsupp1-data1-v1.xlsx
Figure 4 with 2 supplements
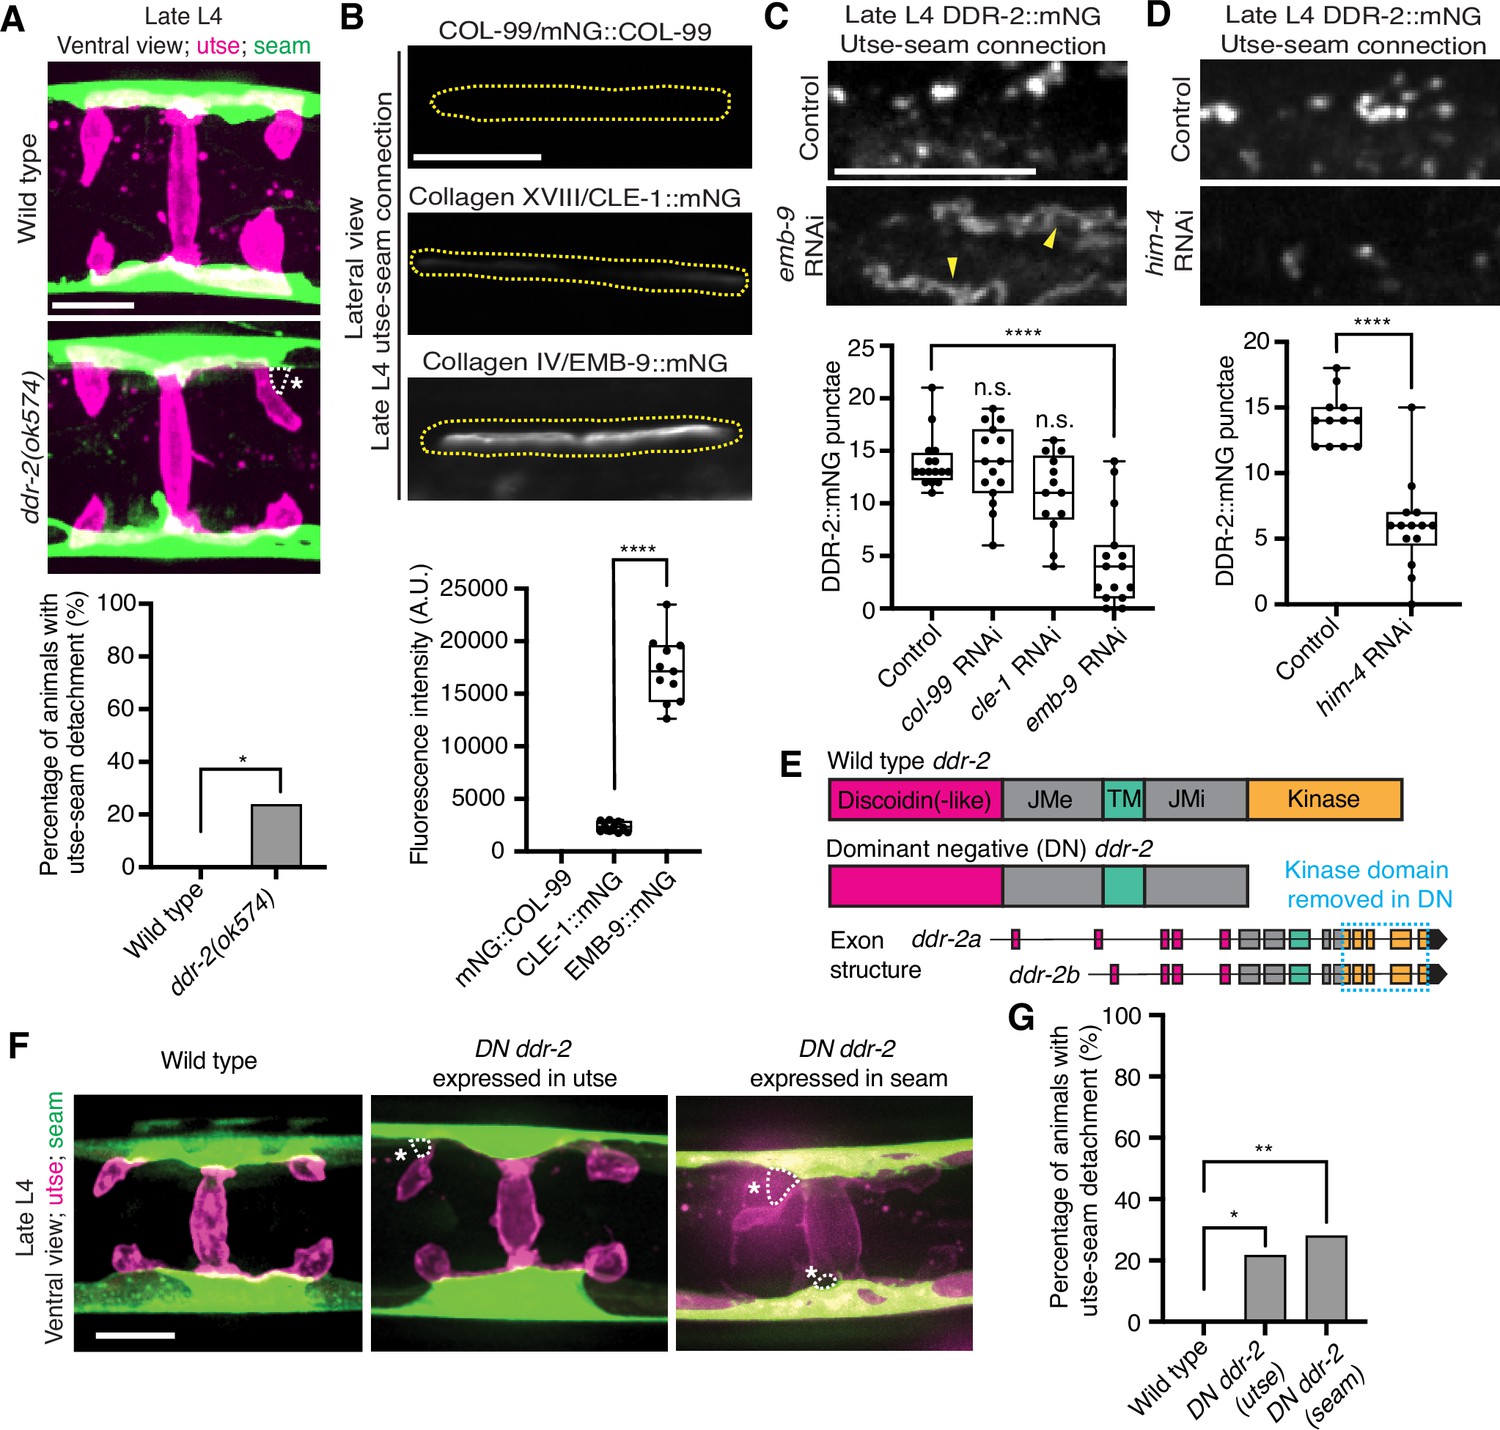
Discoidin domain receptor-2 (DDR-2) endocytosis is triggered by type IV collagen and DDR-2 is required in both the utse and seam to promote tissue connection.
(A) Top: Ventral fluorescence z-projections of the utse (nas-22p::2xmKate2::PLC δPH) and seam (scmp::GFP::CAAX) cells in late L4 wild-type and ddr-2 kinase domain truncation mutant (ddr-2(ok574)) animals. Dotted lines with asterisks indicate regions of utse-seam detachment. Bottom: Quantification of the percentage of animals with utse-seam detachment. Wild type, n=0/26; ddr-2(ok574), n=5/21 animals with detachments respectively. **p≤0.01, Fisher’s exact test. (B) Top: Lateral fluorescence images of COL-99 (mNG::COL-99), type XVIII collagen (CLE-1::mNG), and α1 type IV collagen (EMB-9::mNG) at the utse-seam connection (dotted yellow regions) of late L4 animals. All images were acquired at the same exposure. Bottom: Quantification of mean fluorescence intensity (n≥10 for each fluorescent protein). ****p≤0.0001, unpaired two-tailed Student’s t test. (C) Top: Lateral fluorescence z-projections of DDR-2::mNG at the utse-seam connection in control or emb-9 RNAi-treated late L4 animals. Note that the field of view contains a single utse arm contacting the seam tissue. Arrowheads indicate cell surface accumulation of DDR-2 upon collagen IV depletion. Bottom: Quantification of the average number of discrete DDR-2 punctae at the utse-seam connection on control, col-99, cle-1, or emb-9 RNAi treatments (n≥13 animals for all treatments). ****p≤0.0001, n.s. (not significant), p>0.05; Kruskal-Wallis H test with post hoc Dunn’s test. (D) Top: Lateral fluorescence z-projections of DDR-2::mNG at the utse-seam attachment in control or hemicentin/him-4 RNAi-treated late L4 animals. Bottom: Quantification of the average number of discrete DDR-2 punctae at the utse-seam attachment on control or him-4 RNAi-treated animals (n≥13 all treatments). ****p≤0.0001, Mann-Whitney U test. (E) Schematic of dominant negative (DN) ddr-2. (F) Ventral fluorescence z-projections of the utse (nas-22p::2xmKate2::PLC δPH) and seam (wrt-2p::GFP::PLC δPH) tissues in late L4 stage wild-type animals and animals expressing DN ddr-2 in the utse (driven by cdh-3 promoter) or the seam (driven by scm promoter). Dotted lines with asterisks indicate regions of utse-seam detachment. (G) Quantification of the percentage of animals with utse-seam detachment. Wild type, n=0/23; DN ddr-2(utse), n=5/23; DN ddr-2(seam), n=7/25 animals with detachments respectively. **p≤0.01, *p≤0.05; Fisher’s exact test. Scale bars, 20 µm. Box edges in boxplots represent the 25th and 75th percentiles, the line in the box denotes the median value, and whiskers mark the minimum and maximum values.
-
Figure 4—source data 1
Source data for Figure 4.
Raw data of fluorescence intensity quantification for boxplot in Figure 4B, and raw data of DDR-2::mNG puncta counts for boxplots in Figure 4C and D in Microsoft Excel format.
- https://cdn.elifesciences.org/articles/87037/elife-87037-fig4-data1-v1.xlsx
Figure 4—figure supplement 1
Collagen and hemicentin knockdown efficiencies.
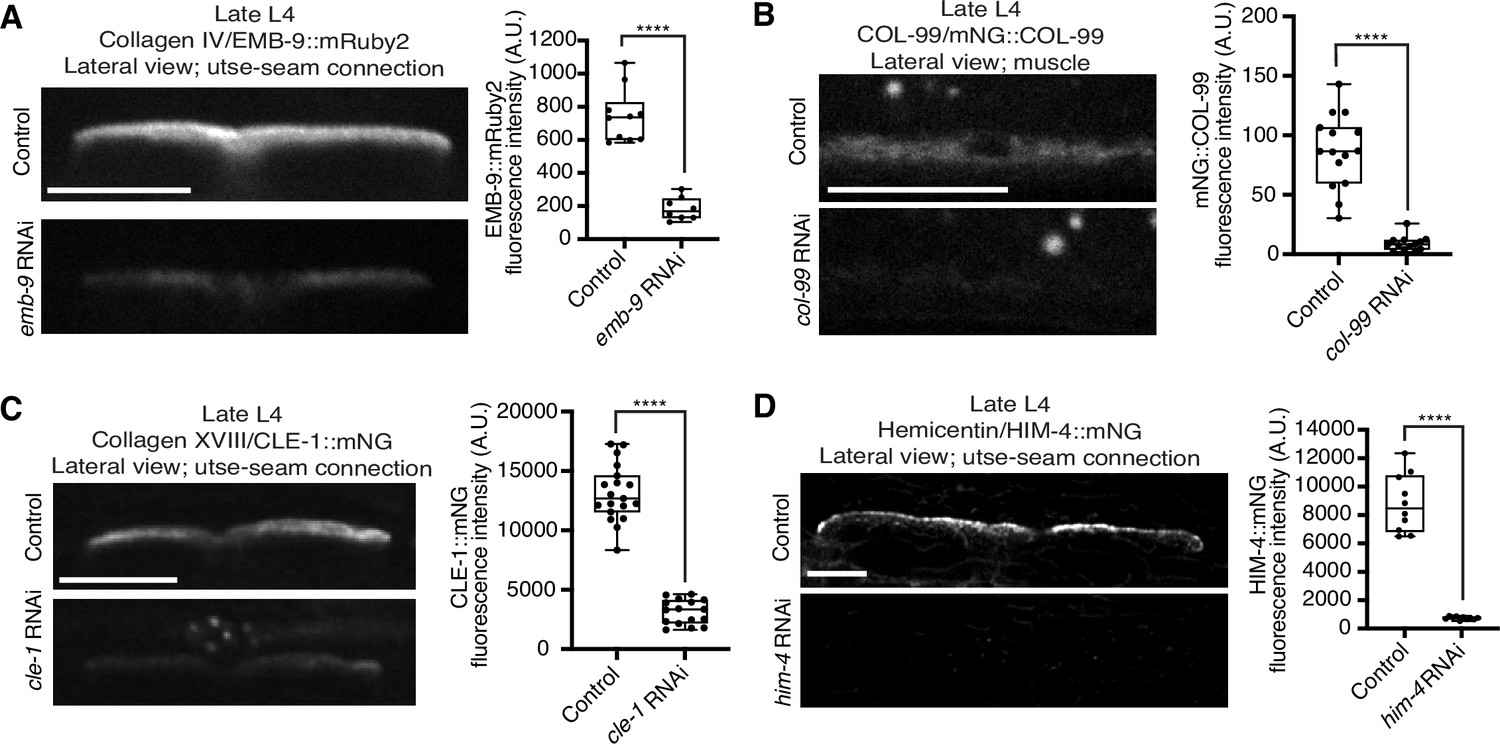
Related to Figure 4. (A) Lateral fluorescence images of EMB-9::mRuby2 (type IV collagen) at the utse-seam basement membrane (BM)-BM connection in late L4 control or emb-9 RNAi-treated animals. Mean fluorescence intensity quantified on the right (n≥8 all treatments). (B) Lateral fluorescence images of mNG::COL-99 (COL-99) in the body wall muscle tissue in late L4 control or col-99 RNAi-treated animals. Mean fluorescence intensity quantified on the right (n≥13 all treatments). COL-99 signal in the muscle was analyzed as COL-99 was not detected at the utse-seam connection. (C) Lateral fluorescence images of CLE-1::mNG (type XVIII collagen) at the utse-seam BM-BM attachment in late L4 control or cle-1 RNAi-treated animals. Mean fluorescence intensity quantified on the right (n≥16 all treatments). (D) Lateral fluorescence images of HIM-4::mNG (hemicentin) at the utse-seam BM-BM connection in late L4 control or him-4 RNAi-treated animals. Mean fluorescence intensity quantified on the right (n=10 all treatments). ****p≤0.0001, unpaired two-tailed Student’s t test (EMB-9, CLE-1, and HIM-4) or Mann-Whitney U test (COL-99). Scale bars, 20 µm. Box edges in boxplots represent the 25th and 75th percentiles, the line in the box denotes the median value, and whiskers mark the minimum and maximum values.
-
Figure 4—figure supplement 1—source data 1
Source data for Figure 4—figure supplement 1.
Raw data of knockdown efficiency quantification for Figure 4—figure supplement 1 in Microsoft Excel format.
- https://cdn.elifesciences.org/articles/87037/elife-87037-fig4-figsupp1-data1-v1.xlsx
Figure 4—figure supplement 2
ddr-2 loss does not reduce functional levels of fibulin, hemicentin, type IV collagen, and matrix metalloproteinase ZMP-4 at the utse-seam connection.
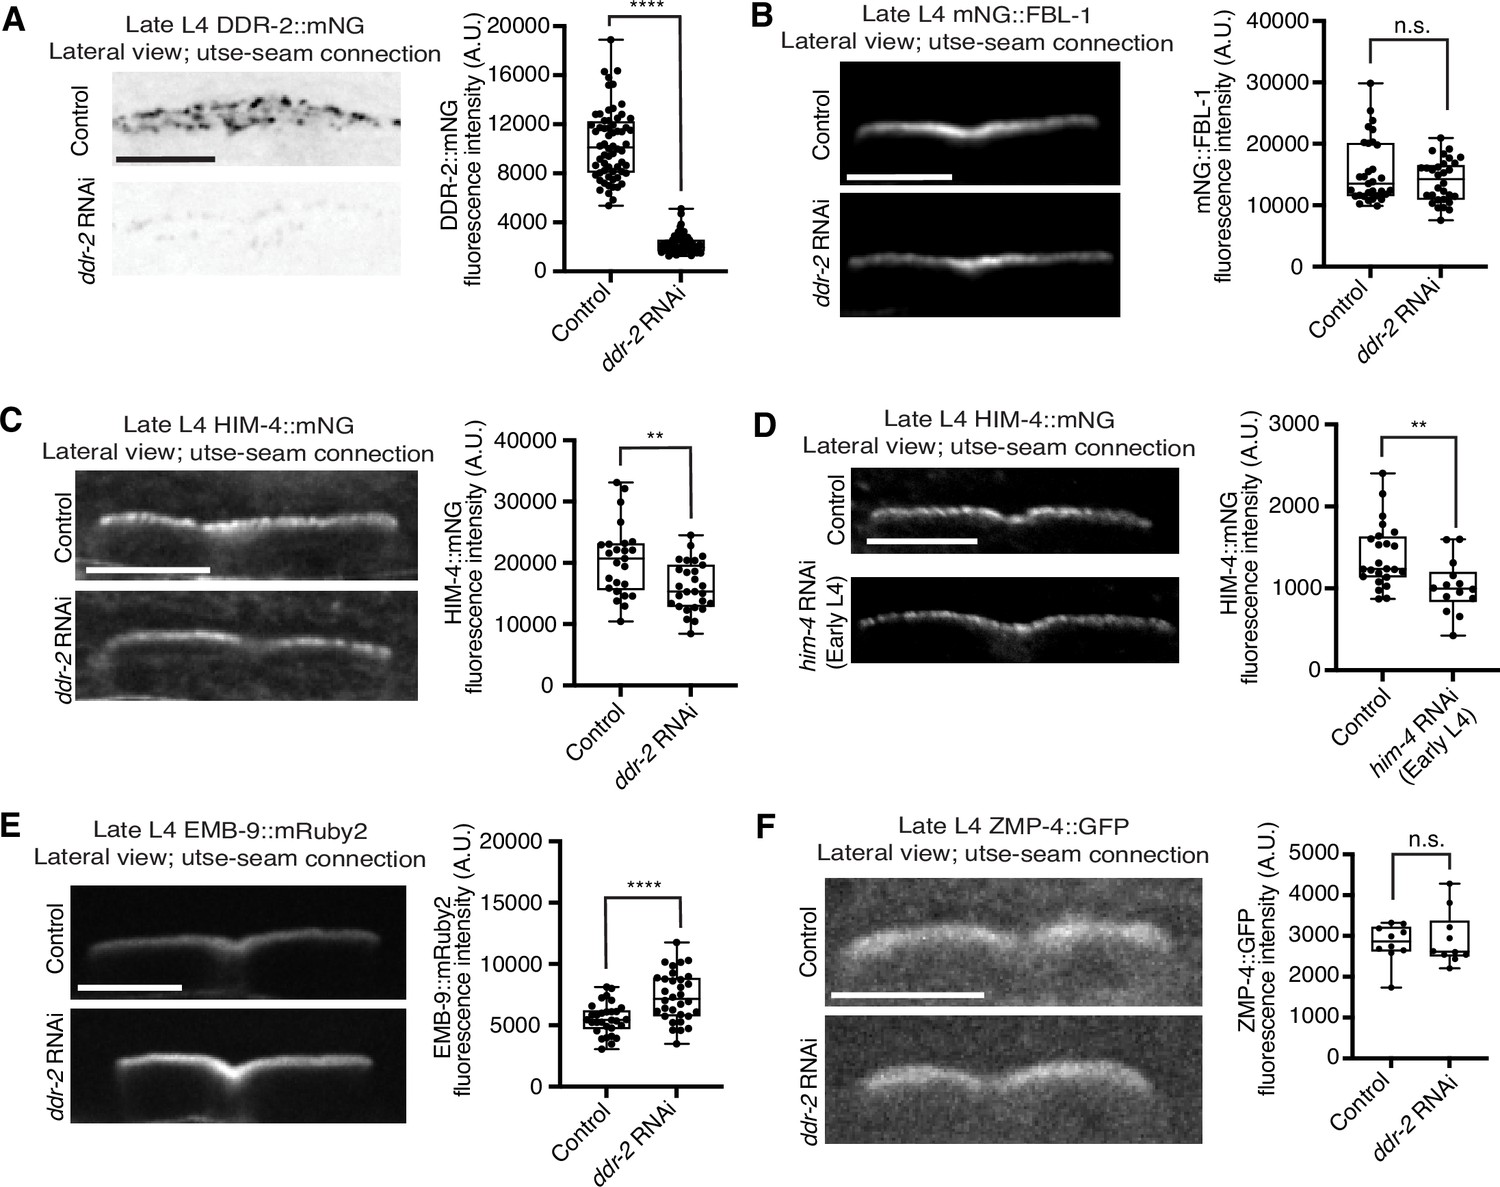
Related to Figure 4. (A) Lateral fluorescence images of DDR-2::mNG at the utse-seam basement membrane (BM)-BM connection in late L4 control or ddr-2 RNAi-treated animals. Mean fluorescence intensity quantified on the right (n≥60 all treatments). ****p≤0.0001, Mann-Whitney U test. (B) Lateral fluorescence images of mNG::FBL-1 (fibulin) at the utse-seam connection in late L4 control or ddr-2 RNAi-treated animals. Mean fluorescence intensity quantified on the right (n≥30 all treatments). n.s. (not significant), p>0.05, Mann-Whitney U test. (C) Lateral fluorescence images of HIM-4::mNG (hemicentin) at the utse-seam tissue linkage in late L4 control or ddr-2 RNAi-treated animals. Mean fluorescence intensity quantified on the right (n≥25 all treatments). **p≤0.01, unpaired two-tailed Student’s t test. (D) Lateral fluorescence images of HIM-4::mNG (hemicentin) at the utse-seam connection in late L4 control or him-4 RNAi-treated animals. RNAi was initiated at the early L4 stage. Mean fluorescence intensity quantified on the right (n≥14 all treatments). **p≤0.01, unpaired two-tailed Student’s t test. (E) Lateral fluorescence images of EMB-9::mRuby2 (type IV collagen) at the utse-seam attachment site in late L4 control or ddr-2 RNAi-treated animals. Mean fluorescence intensity quantified on the right (n≥30 all treatments). ****p≤0.0001, unpaired two-tailed Student’s t test. (F) Lateral fluorescence images of matrix metalloproteinase ZMP-4::GFP at the utse-seam tissue connection in late L4 control or ddr-2 RNAi-treated animals. Mean fluorescence intensity quantified on the right (n=10 all treatments). n.s. (not significant), p>0.05, Mann-Whitney U test. Scale bars, 20 µm. Box edges in boxplots represent the 25th and 75th percentiles, the line in the box denotes the median value, and whiskers mark the minimum and maximum values.
-
Figure 4—figure supplement 2—source data 1
Source data for Figure 4—figure supplement 2.
Raw data of fluorescence intensity quantification for Figure 4—figure supplement 2 in Microsoft Excel format.
- https://cdn.elifesciences.org/articles/87037/elife-87037-fig4-figsupp2-data1-v1.xlsx
Figure 5 with 1 supplement

Discoidin domain receptor-2 (DDR-2) regulates integrin levels at the utse-seam connection and integrin functions in the utse and seam to mediate tissue attachment.
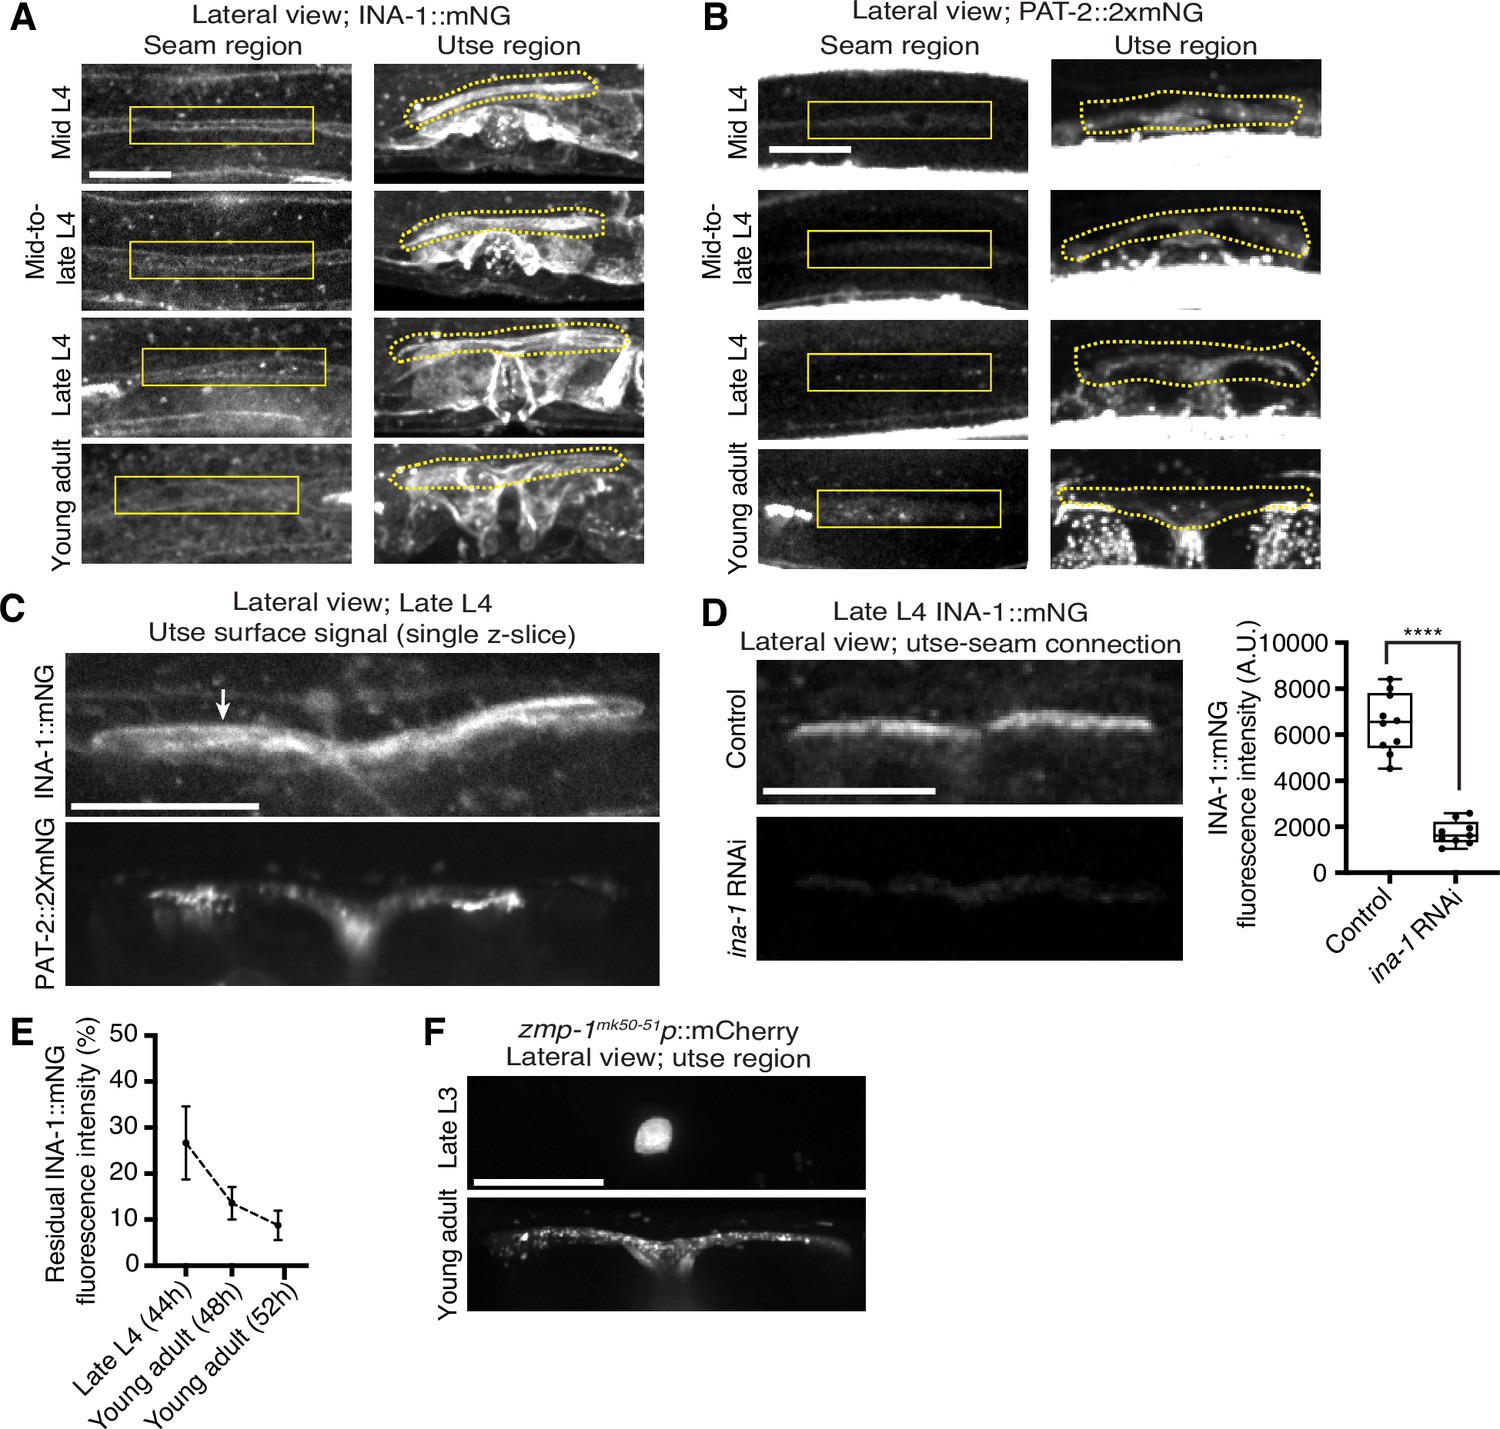
(A) Lateral fluorescence z-projections of integrin α subunits INA-1::mNG and PAT-2::2XmNG at the utse-seam connection (yellow arrowheads) from the mid L4 to young adult stages. Blue asterisks and arrowheads denote INA-1 signal in the developing vulva and PAT-2 at muscle attachment sites, respectively. Fluorescence intensity at the utse-seam connection measured in yellow boxes. (B) Quantification of mean fluorescence intensity in wild-type and ddr-2 knockout (ddr-2(qy64)) animals (n≥9 all conditions). Error bars represent SD. ****p≤0.0001, ***p≤0.001, **p≤0.01, *p≤0.05, n.s. (not significant), p>0.05; unpaired two-tailed Student’s t test. (C) Frequency of uterine prolapse in wild-type and ddr-2(qy64) animals treated with control or ina-1 RNAi 120 hr post-L1 plating. Control n=1/70, ddr-2(qy64) n=4/60, ina-1 RNAi n=22/66, and ddr-2(qy64); ina-1 RNAi n=31/60 animals with uterine prolapse respectively. ****p≤0.0001, *p≤0.05; Fisher’s exact test. (D) Frequency of utse-seam detachments in late L4 wild-type and ddr-2(qy64) animals treated with control or ina-1 RNAi. Control n=0/21, ina-1 RNAi n=0/25, ddr-2(qy64) n=2/21, and ddr-2(qy64); ina-1 RNAi n=9/21 animals with detachments, respectively. ***p≤0.001, *p≤0.05; Fisher’s exact test. (E) Schematic of dominant negative (DN) β integrin pat-3. (F) Ventral fluorescence z-projections of the utse (cdh-3p::mCherry::PLC δPH or nas-22p::2xmKate2::PLC δPH) and seam (wrt-2p::GFP::PLC δPH or scmp::GFP::CAAX) cells in late L4 wild-type animals and animals expressing DN integrin in the utse (zmp-1mk50-51 promoter) or the seam (wrt-2 promoter). Dotted lines with asterisks indicate regions of utse-seam detachment. (G) Percentage of animals with utse-seam detachment. Wild type, n=0/19; DN integrin (utse), n=4/18; DN integrin (seam), n=4/16 animals with detachments, respectively. *p≤0.05, Fisher’s exact test. Scale bars, 20 µm.
-
Figure 5—source data 1
Source data for Figure 5.
Raw data of INA-1/PAT-2 fluorescence intensity quantification used to generate Figure 5B in Microsoft Excel format.
- https://cdn.elifesciences.org/articles/87037/elife-87037-fig5-data1-v1.xlsx
Figure 5—figure supplement 1
The integrin α subunits INA-1 and PAT-2 are localized within both the utse and seam cells.
Related to Figure 5. (A) Lateral fluorescence z-projections of the integrin α subunit INA-1::mNG between the mid L4 and young adult stages. Localization in the seam and utse are indicated by solid and dotted boxed regions respectively (n≥10 animals examined all stages). (B) Lateral fluorescence z-projections of the integrin α subunit PAT-2::2XmNG between the mid L4 and young adult stages. Localization in the seam and utse are indicated by solid and dotted boxed regions respectively (n≥7 animals examined all stages). (C) Lateral fluorescence images of INA-1::mNG and PAT-2::2XmNG at the z-plane of the utse surface in late L4 animals (n≥10 animals examined each). Arrow indicates strong INA-1 signal at the utse surface. (D) Lateral fluorescence images of INA-1::mNG at the utse-seam connection in late L4 control or ina-1 RNAi-treated animals. Mean fluorescence intensity quantified on the right (n≥9 all treatments). ****p≤0.0001, unpaired two-tailed Student’s t test. (E) Quantification of residual INA-1::mNG fluorescence intensity at the utse-seam interface at the indicated developmental stages following ina-1 knockdown initiated at the L1 stage. Data are represented as percentages of mean INA-1::mNG at the respective stages in control animals (n≥7 animals examined all stages). Error bars denote SD. (F) Lateral fluorescence z-projections of mCherry driven by the zmp-1mK50-51 promoter in the utse region in late L3 and young adult animals (n=5 animals examined at each stage).
-
Figure 5—figure supplement 1—source data 1
Source data for Figure 5—figure supplement 1.
Raw data of fluorescence intensity quantification of ina-1 knockdown used to generate plots in Figure 5—figure supplement 1D and E in Microsoft Excel format.
- https://cdn.elifesciences.org/articles/87037/elife-87037-fig5-figsupp1-data1-v1.xlsx
Figure 6 with 1 supplement
Discoidin domain receptor-2 (DDR-2) upregulates vinculin levels and stabilizes integrin at the utse-seam connection.
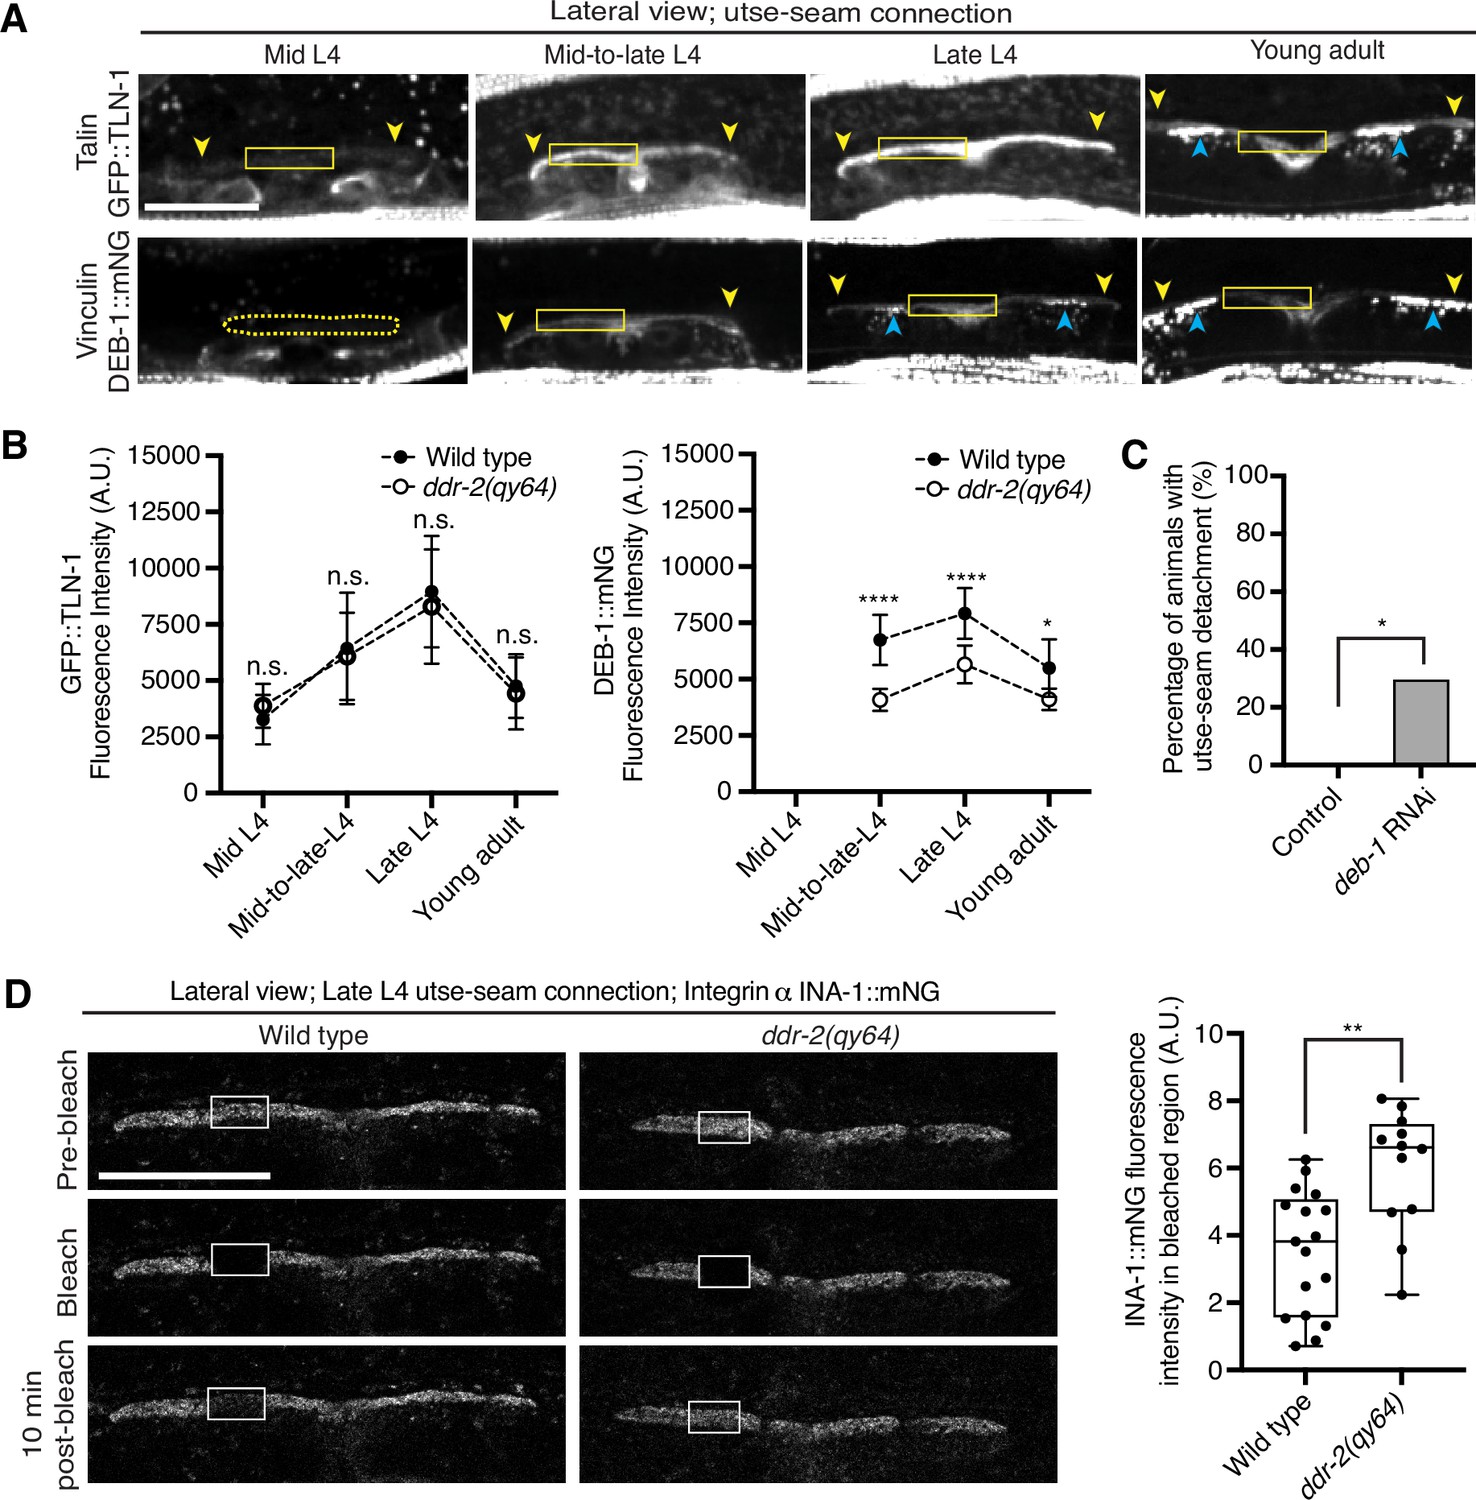
(A) Lateral fluorescence z-projections of the integrin activators talin (GFP::TLN-1) and vinculin (DEB-1::mNG) at the utse-seam attachment region (bounded by yellow arrowheads) from the mid L4 to young adult stages. Vinculin was not detected at the utse-seam attachment region at the mid L4 stage (dotted yellow box). Blue arrowheads indicate fluorescence signal at muscle attachment sites. Fluorescence intensity at the utse-seam attachment region was measured in the solid yellow boxes. (B) Quantification of TLN-1 and DEB-1 mean fluorescence intensity in wild-type and ddr-2 knockout (ddr-2(qy64)) animals (n≥9 all conditions). Error bars represent SD. ****p≤0.0001, **p≤0.01, *p≤0.05, n.s. (not significant), p>0.05; unpaired two-tailed Student’s t test. (C) Frequency of utse-seam detachments observed in control or deb-1 RNAi-treated late L4 animals. Control n=0/21, ina-1 RNAi n=5/17 animals with detachments respectively. *p≤0.05, Fisher’s exact test. (D) Left: Lateral fluorescence images of INA-1::mNG at the utse-seam connection before photobleaching, immediately after photobleaching, and 10 min post-photobleaching in late L4 wild-type and ddr-2(qy64) animals. Box indicates bleached region. Right: Quantification of mean INA-1::mNG fluorescence intensity in the bleached region 10 min post-photobleaching. Wild type, n=17; ddr-2(qy64), n=12. **p≤0.01, unpaired two-tailed Student’s t test. Scale bars, 20 µm. Box edges in boxplots represent the 25th and 75th percentiles, the line in the box denotes the median value, and whiskers mark the minimum and maximum values.
-
Figure 6—source data 1
Source data for Figure 6.
Raw data of fluorescence intensity quantification of TLN-1 and DEB-1 as well as INA-1 recovery after photobleaching used to generate plots in Figure 6B and D in Microsoft Excel format.
- https://cdn.elifesciences.org/articles/87037/elife-87037-fig6-data1-v1.xlsx
Figure 6—figure supplement 1

deb-1 knockdown efficiency.
Related to Figure 6. Lateral fluorescence images of DEB-1::mNG (vinculin) at the utse-seam connection in late L4 control or deb-1 RNAi-treated animals. Mean fluorescence intensity quantified on the right (n=12 all treatments). ****p≤0.0001, unpaired two-tailed Student’s t test. Scale bars, 20 µm. Box edges in boxplots represent the 25th and 75th percentiles, the line in the box denotes the median value, and whiskers mark the minimum and maximum values.
-
Figure 6—figure supplement 1—source data 1
Source data for Figure 6—figure supplement 1.
Raw data of fluorescence intensity quantification of deb-1 knockdown at the utse-seam connection used to generate boxplot in Figure 6—figure supplement 1 in Microsoft Excel format.
- https://cdn.elifesciences.org/articles/87037/elife-87037-fig6-figsupp1-data1-v1.xlsx
Figure 7 with 1 supplement
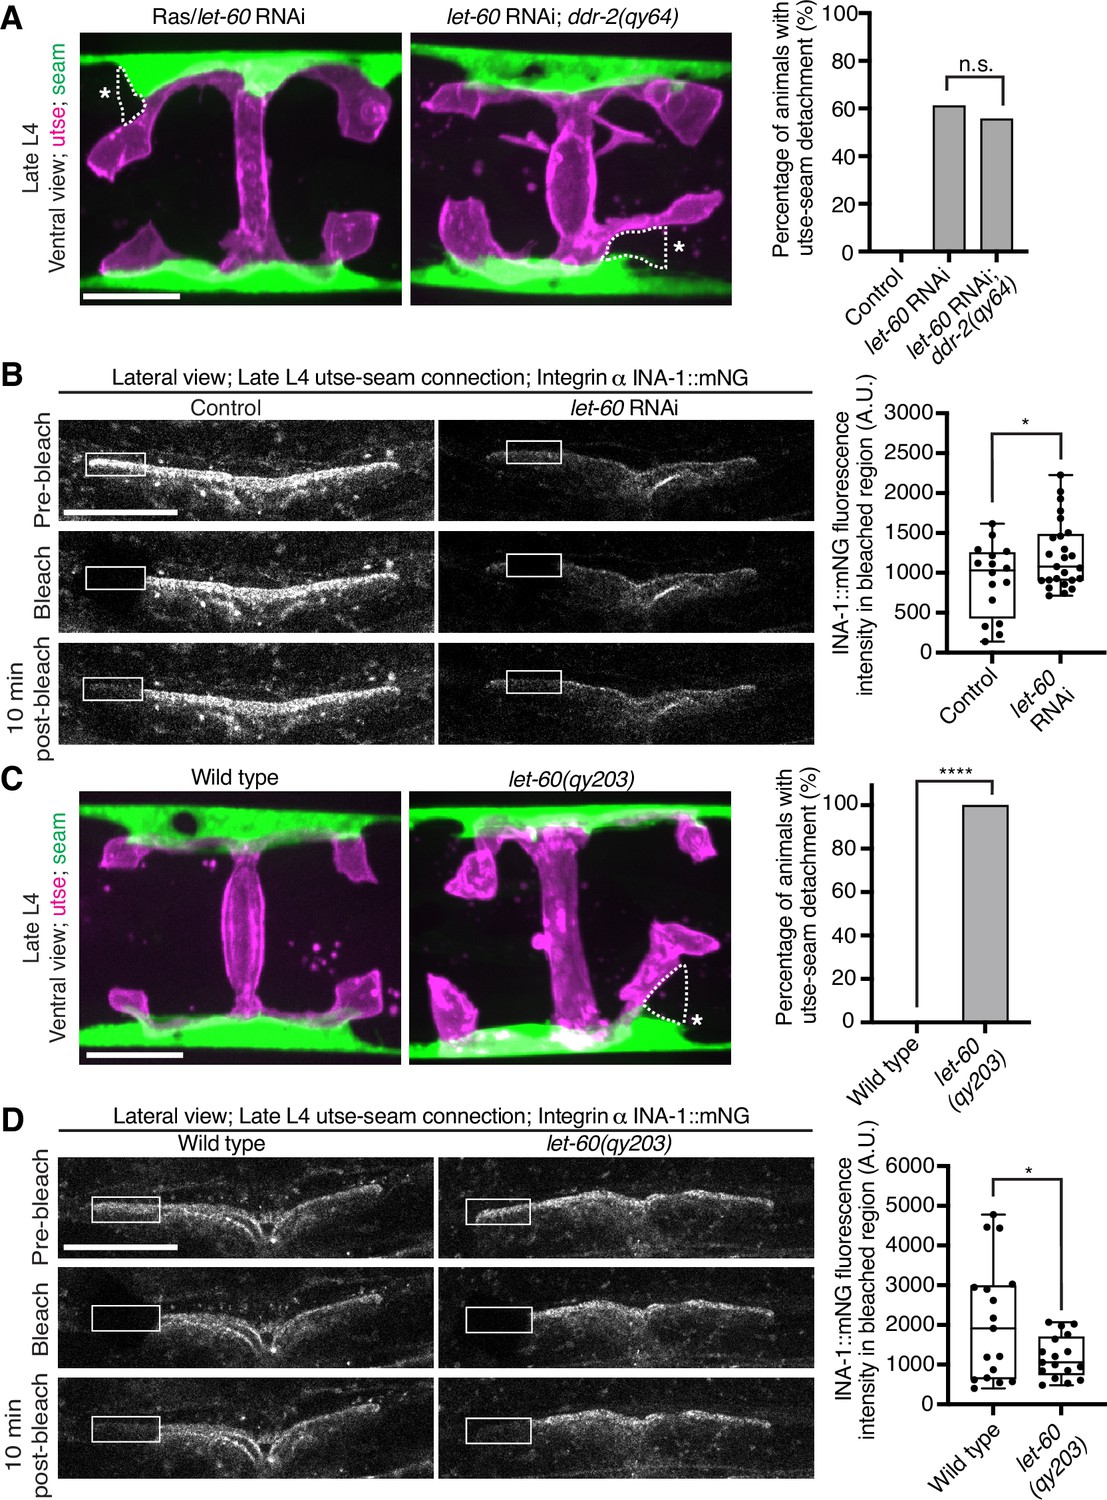
Ras/LET-60 acts in the same pathway as discoidin domain receptor-2 (DDR-2) and controls integrin stability at the utse-seam tissue connection.
(A) Left: Ventral fluorescence z-projections of the utse (nas-22p::2xmKate2::PLC δPH) and seam (scmp::GFP::CAAX) tissues in wild-type and ddr-2 knockout (ddr-2(qy64)) animals on Ras/let-60 RNAi treatment. Dotted lines with asterisks indicate regions of utse-seam detachment. Right: Percentage of animals with utse-seam detachment. Control n=0/21, let-60 RNAi n=11/18, and let-60 RNAi; ddr-2(qy64), n=10/18 animals with detachments respectively. n.s. (not significant), p>0.05; Fisher’s exact test. (B) Left: Lateral fluorescence images of INA-1::mNG at the utse-seam connection before photobleaching, immediately after photobleaching, and 10 min post-photobleaching in late L4 control or let-60 RNAi-treated animals. Box indicates bleached region. Right: Quantification of mean INA-1::mNG fluorescence intensity in the bleached region 10 min post-photobleaching. Control n=16, let-60 RNAi n=25. *p≤0.05, unpaired two-tailed Student’s t test. (C) Left: Ventral fluorescence z-projections of the utse and seam tissues in late L4 wild-type and let-60 gain-of-function mutant (let-60(qy203)) animals. Dotted lines with asterisks indicate regions of utse-seam detachment. Right: Quantification of utse-seam detachment frequency. Wild type, n=0/26; let-60(qy203), n=11/11 animals with detachments respectively. ****p≤0.0001, Fisher’s exact test. (D) Left: Lateral fluorescence images of INA-1::mNG at the utse-seam attachment region before photobleaching, immediately after photobleaching, and 10 min post-photobleaching in late L4 wild-type and let-60(qy203) animals. Box indicates bleached region. Right: Quantification of mean INA-1::mNG fluorescence intensity in the bleached region 10 min post-photobleaching (n=17 each genotype). *p≤0.05, unpaired two-tailed Student’s t test. Scale bars, 20 µm. Box edges in boxplots represent the 25th and 75th percentiles, the line in the box denotes the median value, and whiskers mark the minimum and maximum values.
-
Figure 7—source data 1
Source data for Figure 7.
Raw data of fluorescence intensity quantification used to generate boxplots in Figure 7B and D in Microsoft Excel format. Note that source data for Figure 7—figure supplement 1 is also found within Figure 7—source data 1.
- https://cdn.elifesciences.org/articles/87037/elife-87037-fig7-data1-v1.xlsx
Figure 7—figure supplement 1

Ras/let-60 knockdown reduces INA-1::mNG levels at the utse-seam connection.
Related to Figure 7. Quantification of mean INA-1::mNG fluorescence intensity at the utse-seam connection prior to photobleaching in control or Ras/let-60 RNAi-treated late L4 animals (see representative images in Figure 7B, pre-bleach panel. Control n=16; let-60 RNAi n=25. ****p≤0.0001, unpaired two-tailed Student’s t test). Scale bars, 20 µm. Box edges in boxplots represent the 25th and 75th percentiles, the line in the box denotes the median value, and whiskers mark the minimum and maximum values.
Figure 8
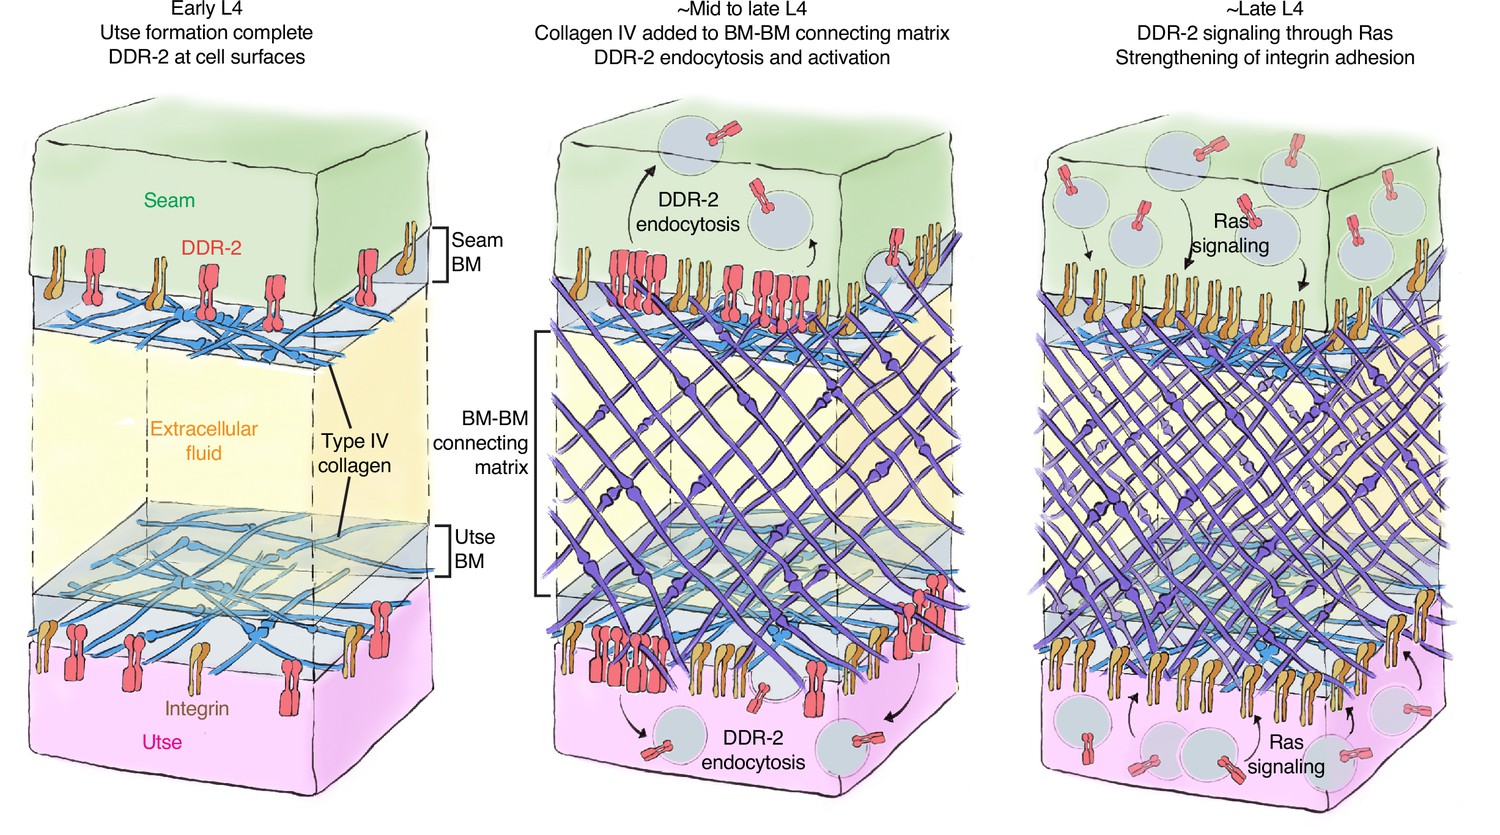
Model of discoidin domain receptor-2 (DDR-2) function at the utse-seam tissue connection.
At the early L4 larval stage, DDR-2 is predominantly found at the surfaces of utse and seam cells. Between the mid and late L4 stages, type IV collagen assembles in the basement membrane (BM)-BM connecting matrix to link the utse and seam tissues. Collagen addition and binding to DDR-2 triggers DDR-2 endocytosis and activation. By the late L4, endocytic localization of DDR-2 reaches peak levels. Ras/LET-60 acts in the same pathway and may function downstream of DDR-2 to stabilize integrin adhesion. Thus, type IV collagen has a dual role in fastening the tissue connection and in signaling through DDR-2 to bolster cell adhesion at the linkage site.
Tables
Appendix 1—key resources table
| Reagent type (species) or resource | Designation | Source or reference | Identifiers | Additional information |
|---|---|---|---|---|
| Strain, strain background (C. elegans) | NK2617 | Gianakas et al., 2023 | qyIs23 [cdh-3p::mCh::PH] II; lqIs80 [scmp::GFP::CAAX] IV | |
| Strain, strain background (C. elegans) | N2 | Caenorhabditis Genetics Center (CGC) | Wild-type (ancestral) | |
| Strain, strain background (C. elegans) | RB970 | Caenorhabditis Genetics Center (CGC) | ddr-1(ok874) X | |
| Strain, strain background (C. elegans) | VH1387 | Unsoeld et al., 2013 | ddr-1(tm382) X | |
| Strain, strain background (C. elegans) | RB788 | Caenorhabditis Genetics Center (CGC) | ddr-2(ok574) X | |
| Strain, strain background (C. elegans) | VH1383 | Unsoeld et al., 2013 | ddr-2(tm797) X | |
| Strain, strain background (C. elegans) | NK2511 | This study | ddr-2(qy64) X | |
| Strain, strain background (C. elegans) | NK2655 | This study | qyIs23 [cdh-3p::mCh::PH] II; lqIs80 [scmp::GFP::CAAX] IV; ddr-2(qy64) X | |
| Strain, strain background (C. elegans) | NK2640 | This study | qy91 [nas-22p::2xmKate2::PH] II; IqIs80 [scmp::GFP::CAAX] IV | |
| Strain, strain background (C. elegans) | NK2682 | This study | qy91 [nas-22p::2xmKate2::PH] II; lqIs80 [scmp::GFP::CAAX] IV; ddr-2(qy64) X | |
| Strain, strain background (C. elegans) | NK2994 | This study | qy44 [ddr-2::mNG] X; qyEx605 [scmp::2xmKate2:PH] | |
| Strain, strain background (C. elegans) | NK2620 | This study | qyIs23 [cdh-3p::mCh::PH] II; qy44 [ddr-2::mNG] X | |
| Strain, strain background (C. elegans) | NK2763 | This study | qyIs256 [cdh-3p::mCherry::rab-5]?; qy44 [ddr-2::mNG] X | |
| Strain, strain background (C. elegans) | NK2766 | This study | qyIs252 [cdh-3p::mCherry::rab-7]?; qy44 [ddr-2::mNG] X | |
| Strain, strain background (C. elegans) | NK2769 | This study | qyIs205 [cdh-3p::mCherry::rab-11]?; qy44 [ddr-2::mNG] X | |
| Strain, strain background (C. elegans) | NK2901 | This study | qy188 [scmp::mKate2::rab-5] I; qy44 [ddr-2::mNG] X | |
| Strain, strain background (C. elegans) | NK2926 | This study | qy91 [nas-22p::2xmKate2::PH] II; IqIs80 [scmp::GFP::CAAX] IV; ddr-2(ok574) X | |
| Strain, strain background (C. elegans) | NK2705 | Jayadev et al., 2022 | qy118 [col-99::mNG (internal tag)] IV | |
| Strain, strain background (C. elegans) | NK2322 | Keeley et al., 2020 | qy22 [cle-1::mNG] I | |
| Strain, strain background (C. elegans) | NK2326 | Keeley et al., 2020 | qy24 [emb-9::mNG (internal tag)] III | |
| Strain, strain background (C. elegans) | NK2830 | This study | qy166 [cdh-3p::dominant negative ddr-2::mNG] I; qy91 [nas-22p::2xmKate2::PH] II; heIs63 [wrt-2p::GFP::PH +wrt-2p::GFP:: H2B+lin-48p:mCherry] V | |
| Strain, strain background (C. elegans) | NK2848 | This study | qy175 [scmp::dominant negative ddr-2::mKate2] I; qy91 [nas-22p::2xmKate2::PH] II; heIs63 [wrt-2p::GFP::PH +wrt-2p::GFP::H2B+lin-48p:mCherry] V | |
| Strain, strain background (C. elegans) | NK2585 | Jayadev et al., 2022 | qy83 [emb-9::mRuby2 (internal tag)] III | |
| Strain, strain background (C. elegans) | NK2422 | Keeley et al., 2020 | qy33 [him-4::mNG] X | |
| Strain, strain background (C. elegans) | NK2324 | Jayadev et al., 2019 | qy23 [ina-1::mNG] III | |
| Strain, strain background (C. elegans) | NK2479 | Jayadev et al., 2019 | qy49 [pat-2::2xmNG] III | |
| Strain, strain background (C. elegans) | NK2825 | This study | qy23 [ina-1::mNG] III; ddr-2(qy64) X | |
| Strain, strain background (C. elegans) | NK2858 | This study | qy49 [pat-2::2xmNG] III; ddr-2(qy64) X | |
| Strain, strain background (C. elegans) | NK2804 | This study | qyIs23 [cdh-3p::mCh::PH] II; heIs63 [wrt-2p::GFP::PH +wrt-2p::GFP:: H2B+lin-48p:mCherry] V | |
| Strain, strain background (C. elegans) | NK2824 | This study | qyIs23 [cdh-3p::mCh::PH] II; qyIs15 [zmp-1mk50-51p::dominant negative integrin b-pat-3] IV;heIs63 [wrt-2p:: GFP::PH +wrt-2p::GFP::H2B+lin-48p:mCherry] V | |
| Strain, strain background (C. elegans) | NK2934 | This study | qy91 [nas-22p::2xmKate2::PH] II; unc-119(ed4) III; IqIs80 [scmp::GFP:: CAAX] IV; qyEx604 [wrt-2p::dominant negative integrin b-pat-3+unc-119(+)] | |
| Strain, strain background (C. elegans) | NK2579 | Keeley et al., 2020 | qy62 [mNG::fbl-1] IV | |
| Strain, strain background (C. elegans) | NK932 | Keeley and Sherwood, 2019 | qyIs190 [zmp-4p::zmp-4::GFP] | |
| Strain, strain background (C. elegans) | NK268 | Hagedorn et al., 2009 | qyIs17 [zmp-1mk50-51p mCherry] | |
| Strain, strain background (C. elegans) | AH3437 | Walser et al., 2017 | zh117 [GFP::tln-1] I | |
| Strain, strain background (C. elegans) | NK2478 | This study | qy48 [deb-1::mNG] IV | |
| Strain, strain background (C. elegans) | NK2854 | This study | zh117 [GFP::tln-1] I; ddr-2(qy64) X | |
| Strain, strain background (C. elegans) | NK2860 | This study | qy48 [deb-1::mNG] IV; ddr-2(qy64) X | |
| Strain, strain background (C. elegans) | NK2944 | This study | qy91 [nas-22p::2xmKate2::PH] II; IqIs80 [scmp::GFP::CAAX] IV; let-60(qy203) IV | |
| Strain, strain background (C. elegans) | NK2957 | This study | qy23 [ina-1::mNG] III; let-60(qy203) IV | |
| Strain, strain background (E. coli) | emb-9 RNAi | Kamath and Ahringer, 2003 | Clone from Ahringer library (L4440 vector backbone) | |
| Strain, strain background (E. coli) | col-99 RNAi | Rual et al., 2004 | Clone from Vidal library (L4440 vector backbone) | |
| Strain, strain background (E. coli) | cle-1 RNAi | Rual et al., 2004 | Clone from Vidal library (L4440 vector backbone) | |
| Strain, strain background (E. coli) | ina-1 RNAi | Rual et al., 2004 | Clone from Vidal library (L4440 vector backbone) | |
| Strain, strain background (E. coli) | let-60 RNAi | Rual et al., 2004 | Clone from Vidal library (L4440 vector backbone) | |
| Strain, strain background (E. coli) | deb-1 RNAi | Rual et al., 2004 | Clone from Vidal library (L4440 vector backbone) | |
| Strain, strain background (E. coli) | him-4 RNAi | Gianakas et al., 2023 | T444t vector backbone | |
| Strain, strain background (E. coli) | ddr-2 RNAi | This study | T444t vector backbone | |
| Sequence-based reagent | ddr-2 knockout (ddr-2(qy64)) sgRNA 1 | This study | ATCCTGACATAGATGAGCGT | |
| Sequence-based reagent | ddr-2 knockout (ddr-2(qy64)) sgRNA 2 | This study | GTCATTGGTGCACACTTCTC | |
| Sequence-based reagent | ddr-2 knockout (ddr-2(qy64)) sgRNA 3 | This study | AAGTGTGCACCAATGACTGG | |
| Sequence-based reagent | deb-1::mNG (deb-1(qy48)) sgRNA 1 | This study | AGTTGGACCACATTGGCTTT | |
| Sequence-based reagent | deb-1::mNG (deb-1(qy48)) sgRNA 2 | This study | ATTTAGAAGTTGGACCACAT | |
| Sequence-based reagent | let-60 gain-of-function (let-60(qy203)) sgRNA 1 | This study | CTTGTGGTAGTTGGAGATGG | |
| Sequence-based reagent | Primer ddr-2(qy64) homology arm forward | This study | TTTTCAGAGTCTCCGACGCTCATCTA | |
| Sequence-based reagent | Primer ddr-2(qy64) homology arm reverse | This study | TAAATATTATTCTGAGAATATA | |
| Sequence-based reagent | Primer ddr-2(qy64) genotyping forward | This study | TGGTAATTGATGAGAGGGTG | |
| Sequence-based reagent | Primer ddr-2(qy64) genotyping reverse | This study | TGTCGTTTCGACACCGGCAA 1.8 kb band | |
| Sequence-based reagent | Primer let-60(qy203) homology arm forward | This study | ATGACGGAGTACAAGCTTGTGGTAGTTGGAGATGGAGAAGT | |
| Sequence-based reagent | Primer let-60(qy203) homology arm reverse | This study | TACCCTTTTCTGAAAAAAGACGC | |
| Sequence-based reagent | Primer nas-22 promoter forward | This study | TCAAAGCGTCAAGCTTTACG | |
| Sequence-based reagent | Primer nas-22 promoter reverse | This study | TTTTCTGTCTACAAGGACTGTGC | |
| Sequence-based reagent | Primer scm promoter forward | Chapman et al., 2008 | AACCTCCACCAGATGGTTGGCG | |
| Sequence-based reagent | Primer scm promoter reverse | Chapman et al., 2008 | CCCGGGGATCCGTCCACTCT | |
| Sequence-based reagent | Primer cdh-3 promoter forward | This study | CTAGAGCATGATGTCCTTAC | |
| Sequence-based reagent | Primer cdh-3 promoter reverse | This study | CAAAACGGACCGACCGTCCC | |
| Sequence-based reagent | Primer dominant negative ddr-2 forward | This study | ATGAAGTTGCTGCTGTATCT | |
| Sequence-based reagent | Primer dominant negative ddr-2 reverse | This study | TCTGCTCACGCAAATCAACT | |
| Sequence-based reagent | Primer wrt-2 promoter forward | This study | TCAGAACTCTAATACTTACT | |
| Sequence-based reagent | Primer wrt-2 promoter reverse | This study | CCGAGAAACAATTGGCAGGT | |
| Sequence-based reagent | Primer dominant negative integrin b pat-3 forward | Hagedorn et al., 2009 | TCTAGAGGATCCCGGGGAT | |
| Sequence-based reagent | Primer dominant negative integrin b pat-3 reverse | Hagedorn et al., 2009 | ATTTAGTTGGCTTTTCCAGC | |
| Sequence-based reagent | Primer ddr-2 RNAi forward | This study | ATGAAGTTGCTGCTGTATCT | |
| Sequence-based reagent | Primer ddr-2 RNAi reverse | This study | ATGAATATGAGGAGAAGTGTGC | |
| Recombinant DNA reagent | Plasmid: pCFJ352 | Addgene | RRID: Addgene_30539 | sgRNA targeting MosSCI insertion site on Chr I, from Erik Jorgensen |
| Recombinant DNA reagent | Plasmid: pDD122 | Dickinson et al., 2013 | RRID: Addgene_47550 | sgRNA targeting MosSCI insertion site on Chr II |
| Recombinant DNA reagent | Plasmid: pAP087 | Pani and Goldstein, 2018 | Starter SEC repair template plasmid for single copy insertion at the ttTi5605 site on chromosome II | |
| Recombinant DNA reagent | Plasmid: pAP088 | Pani and Goldstein, 2018 | Starter SEC repair template plasmid for single copy insertion at the ttTi4348 site on chromosome I | |
| Chemical compound, drug | Ampicillin | Sigma-Aldrich | #A0166 | |
| Chemical compound, drug | Isopropyl β-D-1-thiogalactopyranoside | Sigma-Aldrich | #I6758 | |
| Chemical compound, drug | Hygromycin B | Sigma-Aldrich | #H3274 | |
| Chemical compound, drug | Sodium azide | Sigma-Aldrich | #S2002 | |
| Chemical compound, drug | Levamisole | Sigma-Aldrich | #L9756 | |
| Software, algorithm | µManager v.1.4.23 | Edelstein et al., 2010 | RRID: SCR_016865 | |
| Software, algorithm | Zen Black | Zeiss | RRID:SCR_018163 | |
| Software, algorithm | Fiji/ImageJ | Schindelin et al., 2012 | RRID:SCR_002285 | |
| Software, algorithm | GraphPad Prism v9 | GraphPad Software | RRID:SCR_002798 |
Additional files
Download links
A two-part list of links to download the article, or parts of the article, in various formats.
Downloads (link to download the article as PDF)
Open citations (links to open the citations from this article in various online reference manager services)
Cite this article (links to download the citations from this article in formats compatible with various reference manager tools)
Reciprocal discoidin domain receptor signaling strengthens integrin adhesion to connect adjacent tissues
eLife 12:RP87037.
https://doi.org/10.7554/eLife.87037.3


