Systematic analysis of the molecular and biophysical properties of key DNA damage response factors
- Institute for Quantitative Health Science and Engineering, Michigan State University, United States
- Department of Biochemistry and Molecular Biology, Michigan State University, United States
- College of Osteopathic Medicine, Michigan State University, United States
- Department of Physiology, Michigan State University, United States
- Department of Obstetrics, Gynecology, and Reproductive Biology, Michigan State University, United States
Figures
Figure 1 with 1 supplement
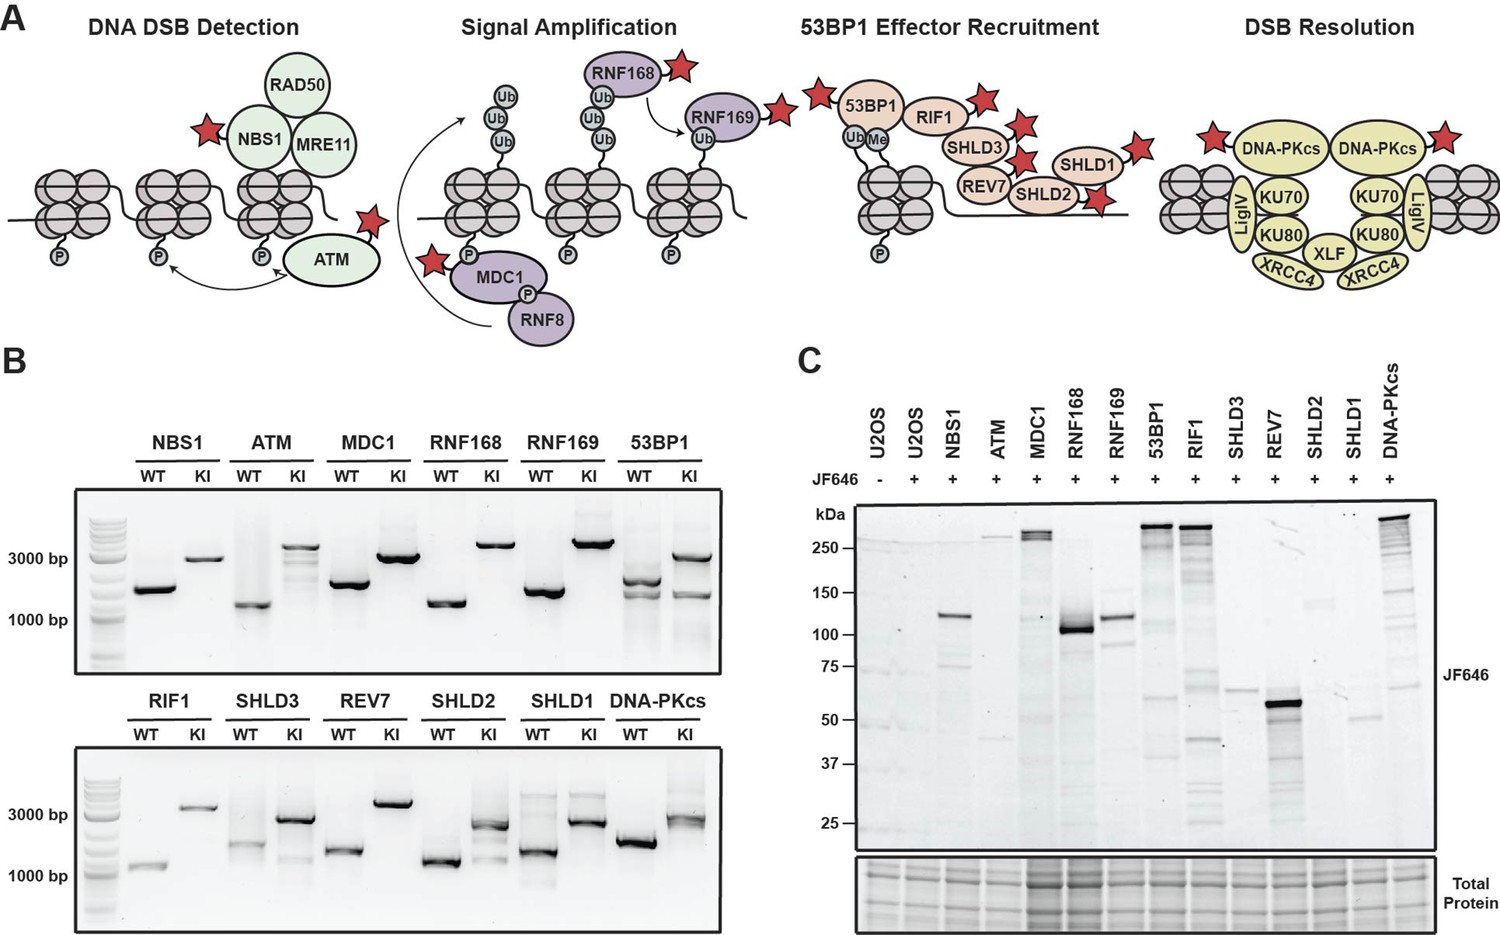
Generation of a panel HaloTagged DNA damage response proteins with CRISPR-Cas9 and homology-directed repair.
(A) Model of the DDR factors HaloTagged by genome editing and their roles in DSB repair. Red star indicates HaloTagged protein. (B) Agarose gels depicting PCR products amplified from genomic DNA showing insertion of the 3xFLAG-HaloTag into the genomic loci of each tagged DDR factor using primers oriented outside of both left and right homology arms. (WT = wildtype; KI = knock in) (C) SDS-PAGE gel showing fluorescently labeled HaloTagged proteins in each cell line after labeling with JF646 HaloTag ligand.
-
Figure 1—source data 1
Uncropped gels corresponding to Figure 1.
- https://cdn.elifesciences.org/articles/87086/elife-87086-fig1-data1-v2.zip
Figure 1—figure supplement 1
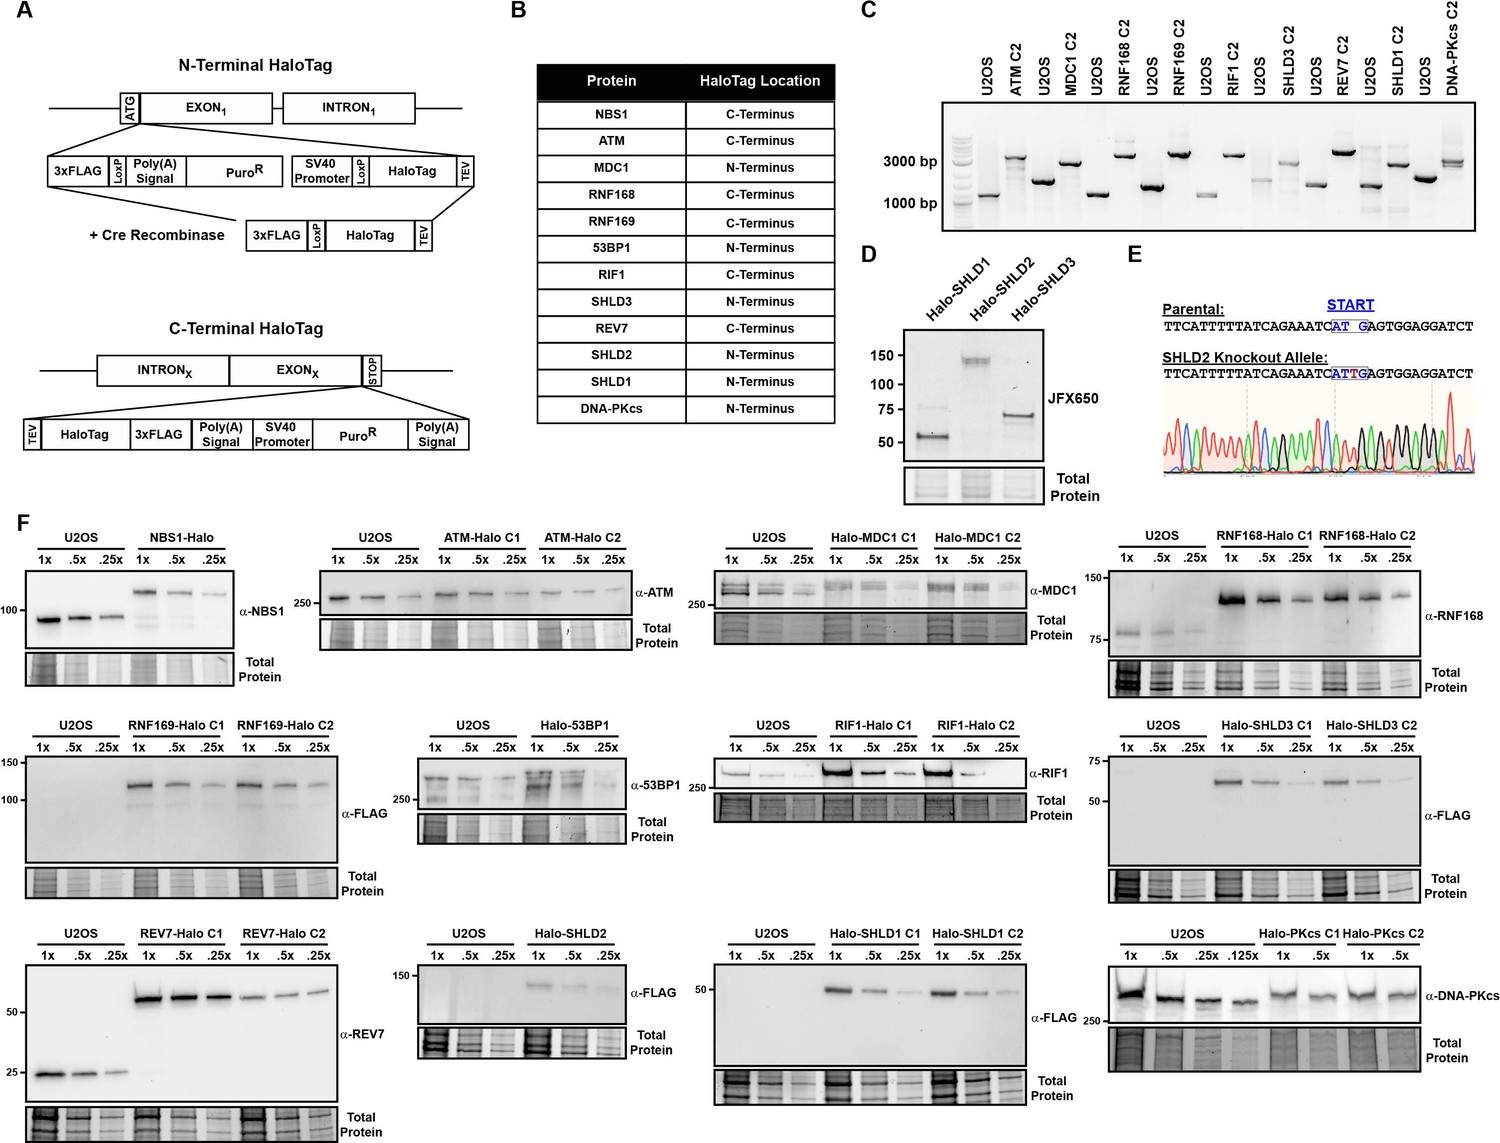
HaloTag knock-in design and knock-in validation.
(A) Graphical representation of the N-terminal and C-Terminal 3xFLAG-HaloTag used for genome editing. (B) Table indicating the terminus where the HaloTag was introduced for each protein (C) Agarose gel showing genomic PCR products and HaloTag insertion for second knock-in clones using primers oriented outside of the left and right homology arms. (D) SDS-PAGE gel of fluorescently tagged SHLD1, SHLD2, and SHLD3 with higher exposure than the gel presented in Figure 1C. (E) Sanger sequencing of the knockout allele of SHLD2 where the Start codon is highlighted in blue and the red indicated the single nucleotide insertion. (F) Western blots for HaloTagged DDR proteins showing relative expression of each tagged protein compared to parental U2OS cells for proteins where a commercially available antibody was both available and capable of detecting endogenous expression levels. For proteins where protein-specific antibodies were not available, proteins were probed with anti-FLAG antibody.
-
Figure 1—figure supplement 1—source data 1
Uncropped gels and blots corresponding to Figure 1—figure supplement 1.
- https://cdn.elifesciences.org/articles/87086/elife-87086-fig1-figsupp1-data1-v2.zip
Figure 2 with 1 supplement
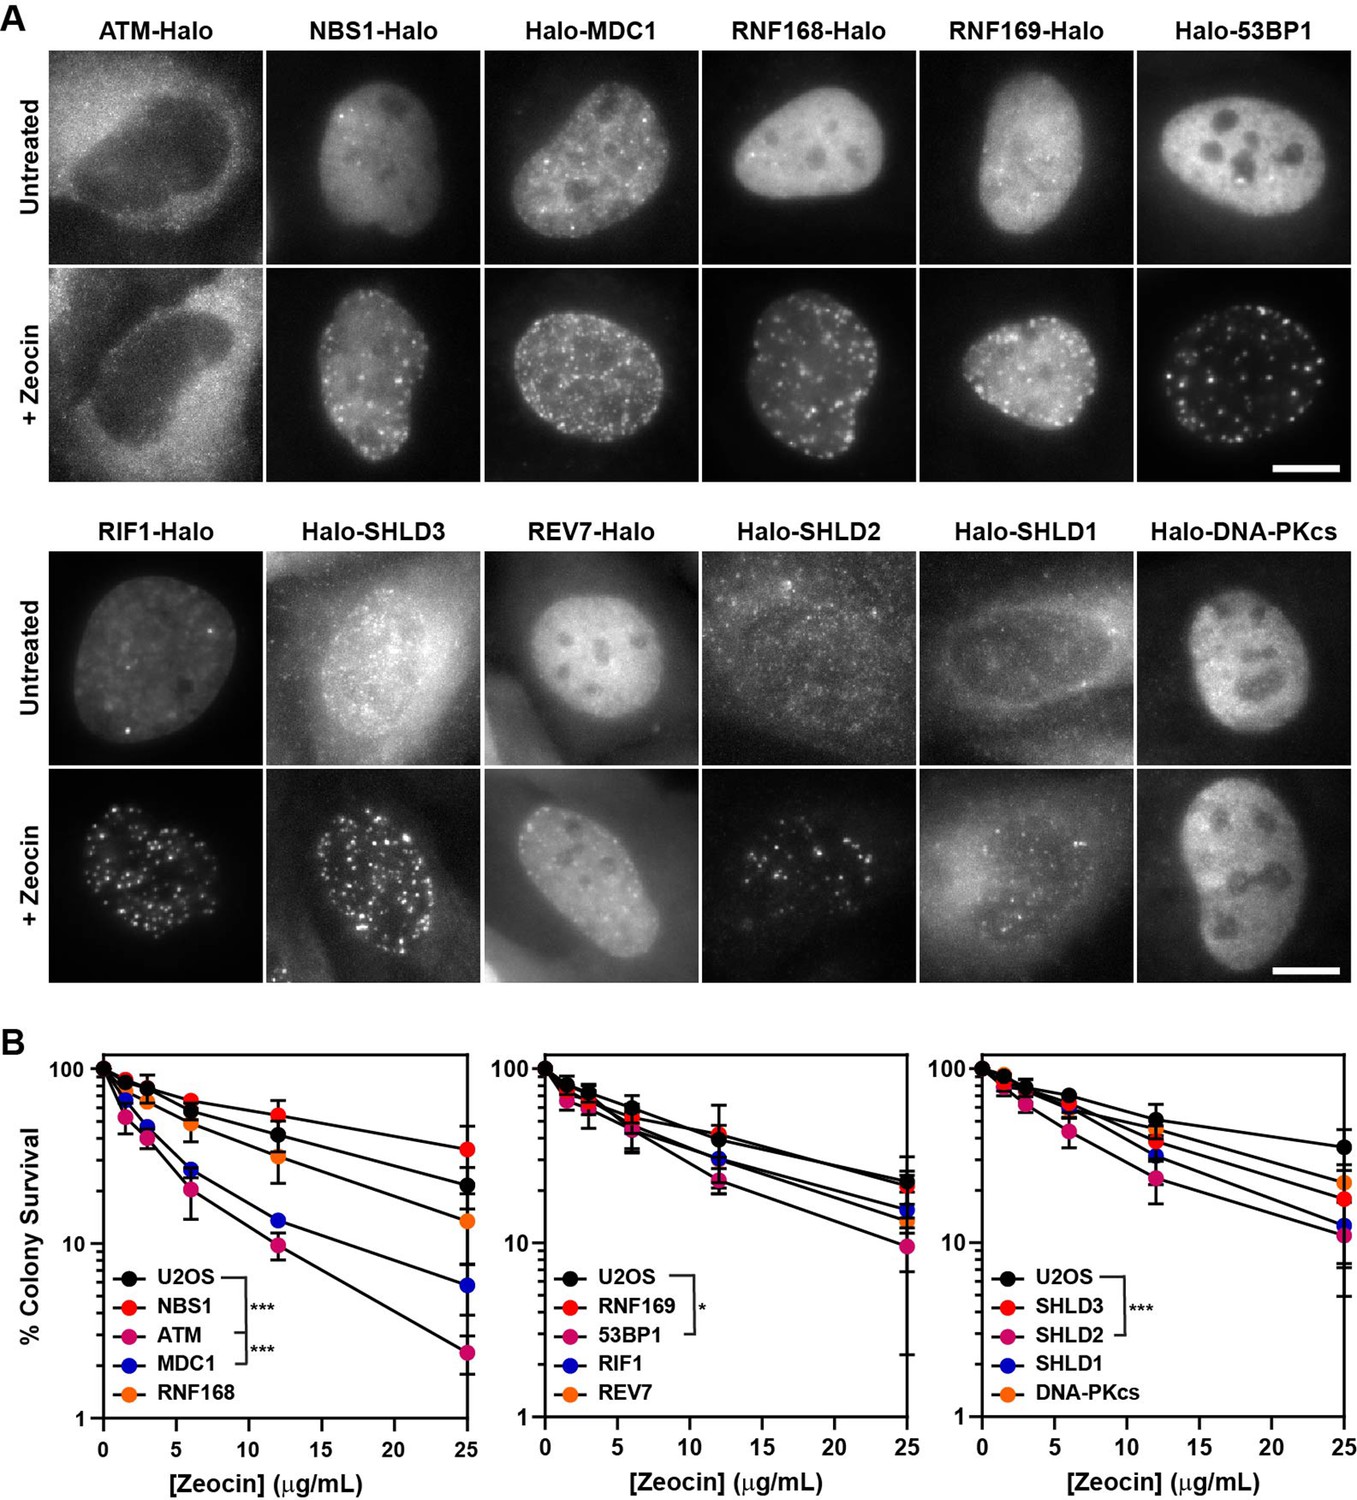
HaloTagged DDR proteins retain proper subcellular localization, foci-forming ability, and are competent for DNA repair.
(A) Representative images of JF646-labeled HaloTagged proteins in the absence or presence of Zeocin in living cells. Data presented show protein cellular localization and foci-forming ability. Scale bar = 10 μm. Images are scaled differently between untreated and treated samples to demonstrate both localization and foci-forming ability. (B) Clonogenic survival assays representing the Zeocin-sensitivity of each HaloTagged DDR cell line relative to untagged parental U2OS cells. Data presented are the results of at least three independent experiments each plated in triplicate ± S.D. Data were compared by one-way ANOVA with Dunnett’s posthoc test. * p<0.05; *** p<0.001.
Figure 2—figure supplement 1
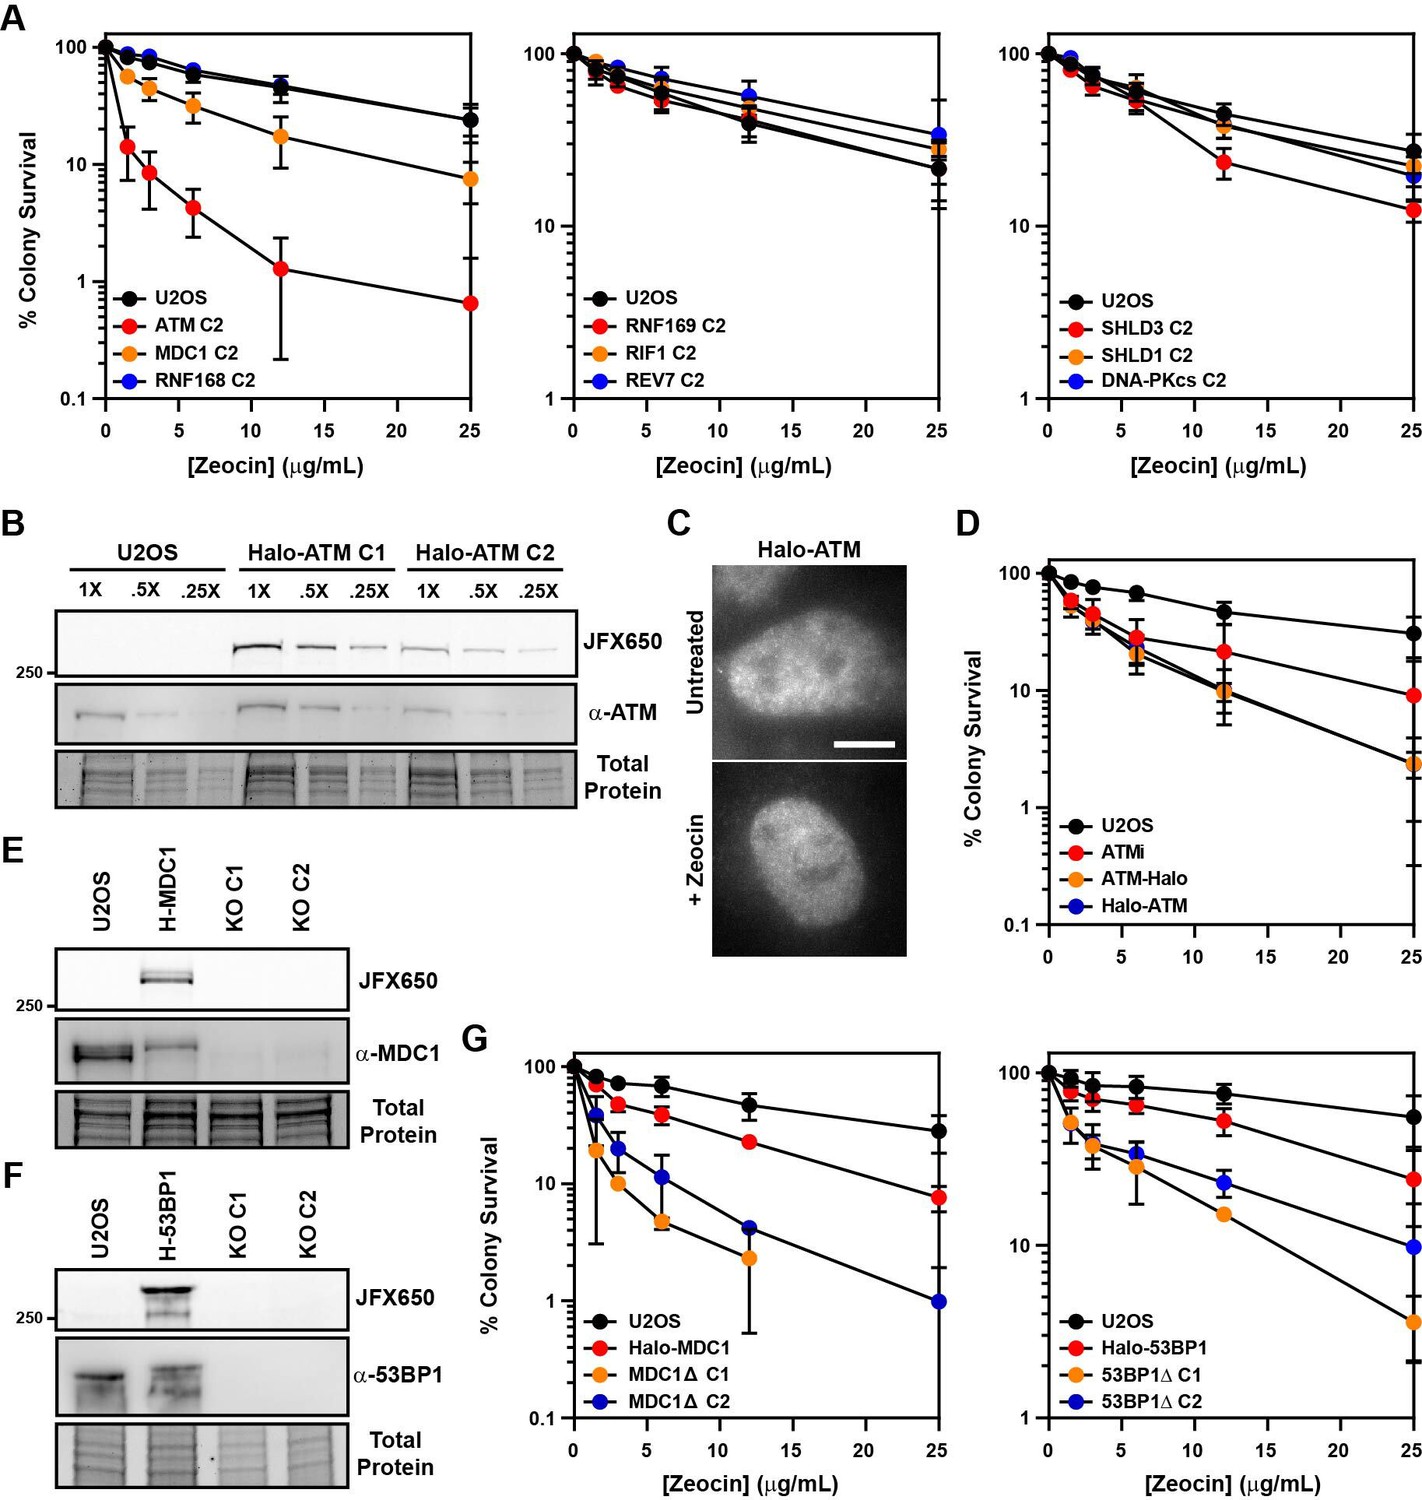
Functional validation of HaloTagged DDR proteins.
(A) Clonogenic survival assay showing sensitivity of second HaloTag clones to Zeocin relative to parental U2OS cells. (C) SDS-PAGE and Western blot showing expression of N-terminally HaloTagged ATM. (C) Representative image of live cells expressing Halo-ATM in the presence or absence of Zeocin. Scale bar = 10 μm.(D) Clonogenic survival assays in the presence of absence of 10 μm ATMi (KU-55933) indicating that HaloTagging at either terminus abolishes ATM-mediated resistance to Zeocin. (E & F) SDS-PAGE and Western blot showing absence of Halo-MDC1 (H-MDC1) or Halo-53BP1 (H-53BP1) expression in MDC1 and 53BP1 knockout cells.(G) Clonogenic survival assays of MDC1 and 53BP1 knockout clones showing sensitivity to Zeocin relative to Halo-MDC1 or Halo-53BP1 and U2OS cells. Clonogenic survival assays are presented as the average ± S.D. of at least three independent experiments performed in triplicate. Data compared by one-way ANOVA with Dunnett’s posthoc test. * p<0.05; ** p<0.01.
-
Figure 2—figure supplement 1—source data 1
Uncropped gels and blots corresponding to Figure 2—figure supplement 1.
- https://cdn.elifesciences.org/articles/87086/elife-87086-fig2-figsupp1-data1-v2.zip
Figure 3 with 1 supplement
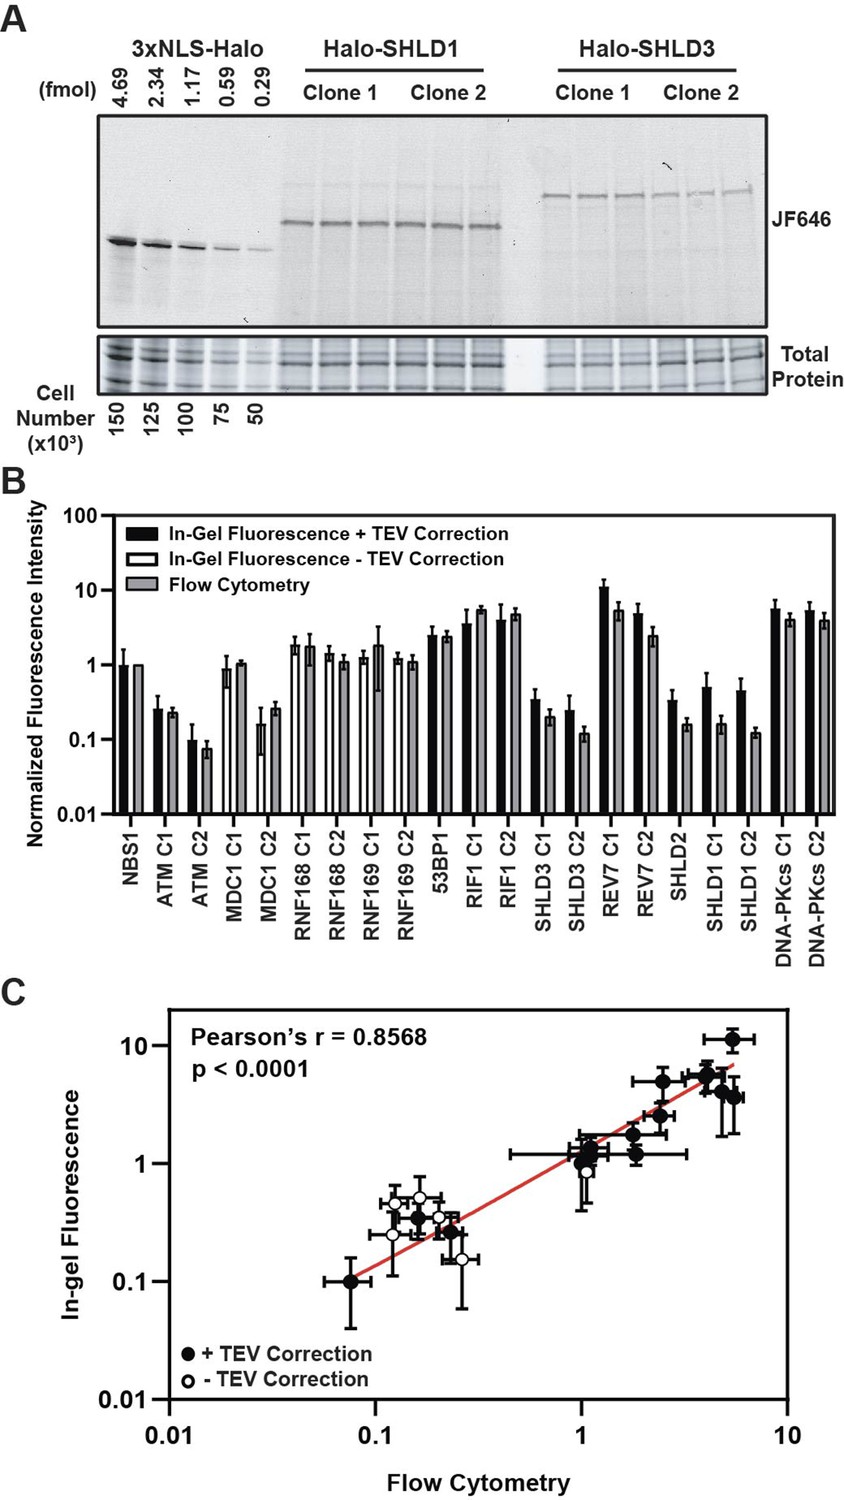
HaloTag enables quantification of absolute cellular protein abundances.
(A) Example image of in-gel fluorescence of JF646-labeled HaloTagged proteins. (B) Comparison of JF646 fluorescence intensity values (normalized to NBS1-Halo) between in-gel fluorescence after applying the TEV correction factor and flow cytometry. White columns indicate unadjusted samples because of the inability to accurately determine a TEV correction factor due to protein degradation. Data are presented as the mean of ≥ three independent experiments ± S.D. (C) Plot representing the correlation of normalized JF646 fluorescence intensities ± S.D. for each protein between TEV-corrected in-gel fluorescence and flow-cytometry. Data were analyzed by Pearson’s correlation coefficient. White points indicate those proteins for which a TEV-correction factor could not be accurately determined. Red line represents an interpolated standard curve.
-
Figure 3—source data 1
Uncropped gels corresponding to Figure 3.
- https://cdn.elifesciences.org/articles/87086/elife-87086-fig3-data1-v2.zip
Figure 3—figure supplement 1
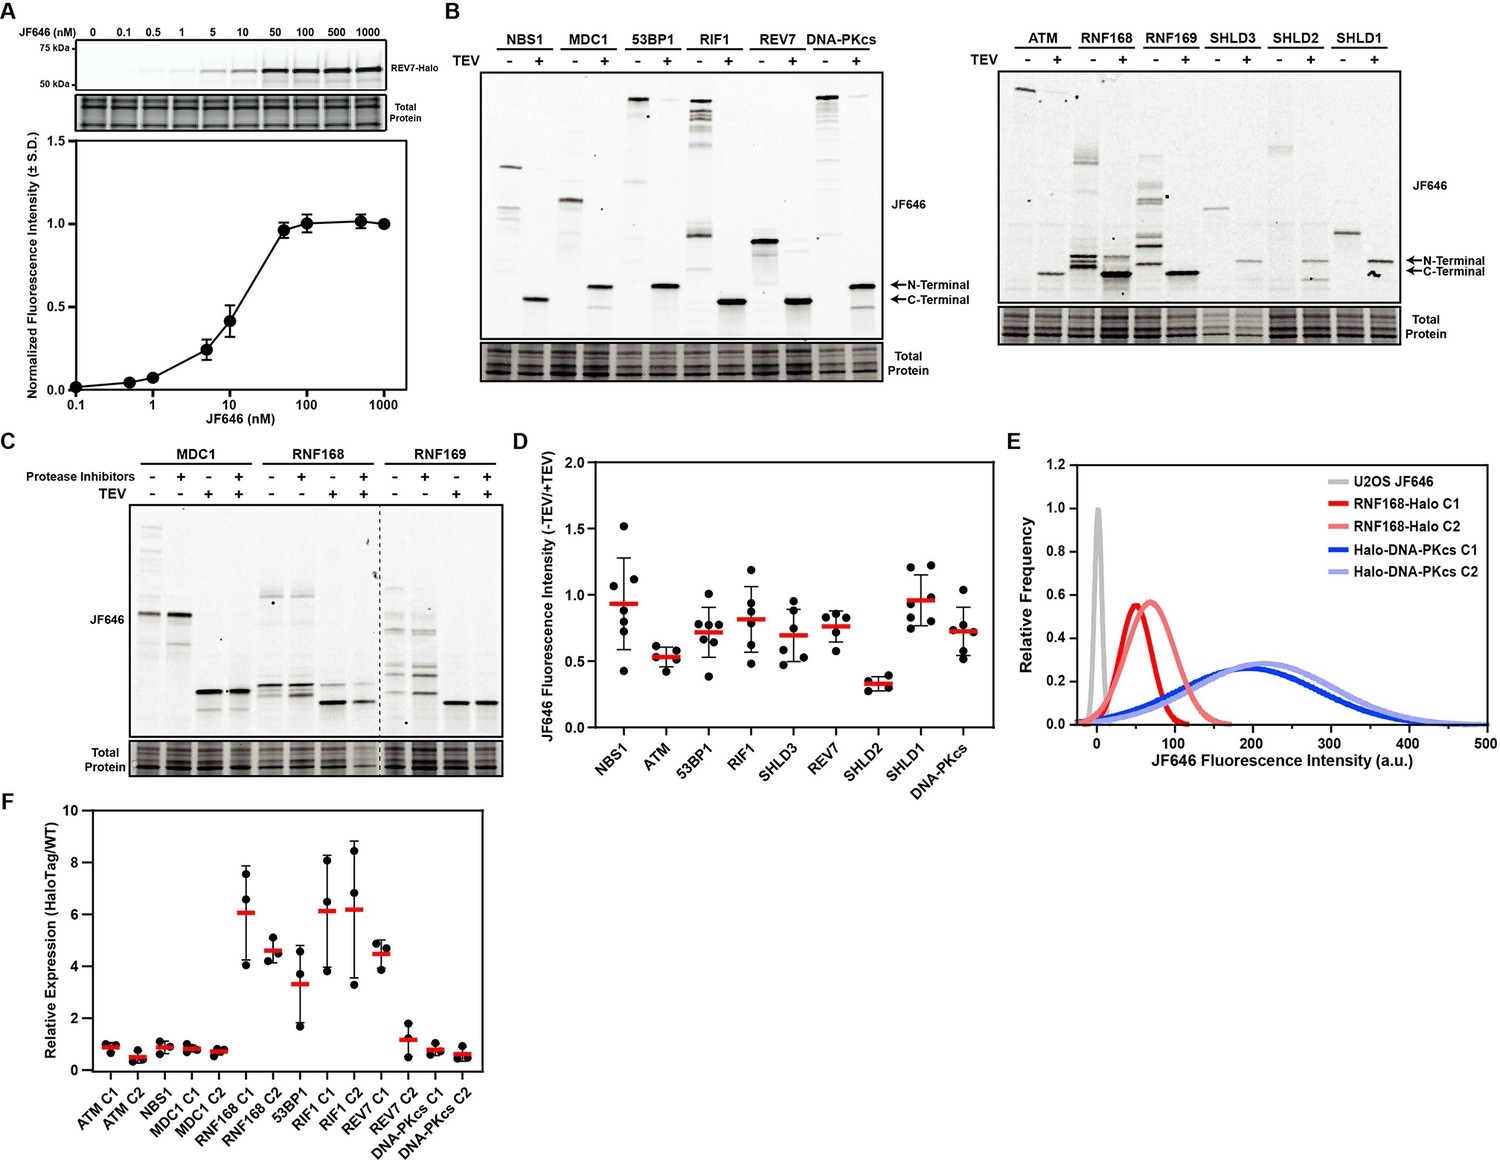
Quantification of absolute protein abundance using HaloTagged DDR proteins.
(A) HaloTag labeling of REV7-Halo in cells titrated with increasing concentrations of JF646 with an associated saturation curve. Saturation curve data is plotted as the mean ± S.D. from three independent experiments. (B) Representative in-gel fluorescence images for TEV-digestion experiments used to generate an adjustment factor for protein abundance based upon JF646 signal intensity. N-terminal refers to the N-terminal 3XFLAG-HaloTag and C-Terminal refers to the C-terminal 3XFLAG-HaloTag. (C) In-gel fluorescence showing protein degradation products of MDC1, RNF168, and RNF169 in the presence or absence of protease inhibitor cocktail after lysing in CHAPS lysis buffer. (D) Quantification of TEV digestion experiments generating a TEV adjustment factor for absolute protein abundance. Each data point represents and independent experiment. Red bar indicates the mean and error bars represent S.D. (E) Representative plots of JF646 fluorescence intensity in parental U2OS cells, two RNF168-Halo clones, and two Halo-DNA-PKcs clones detected by flow cytometry. (F) Quantification of expression of HaloTagged protein relative to untagged protein in U2OS cells to generate a correction factor which was used to calculate the number of molecules per cell for each protein in wild-type U2OS cells. Data are quantified from three independent experiments. Red bar indicates the mean and error bars represent S.D.
-
Figure 3—figure supplement 1—source data 1
Uncropped gels corresponding to Figure 3—figure supplement 1.
- https://cdn.elifesciences.org/articles/87086/elife-87086-fig3-figsupp1-data1-v2.zip
Figure 4 with 1 supplement
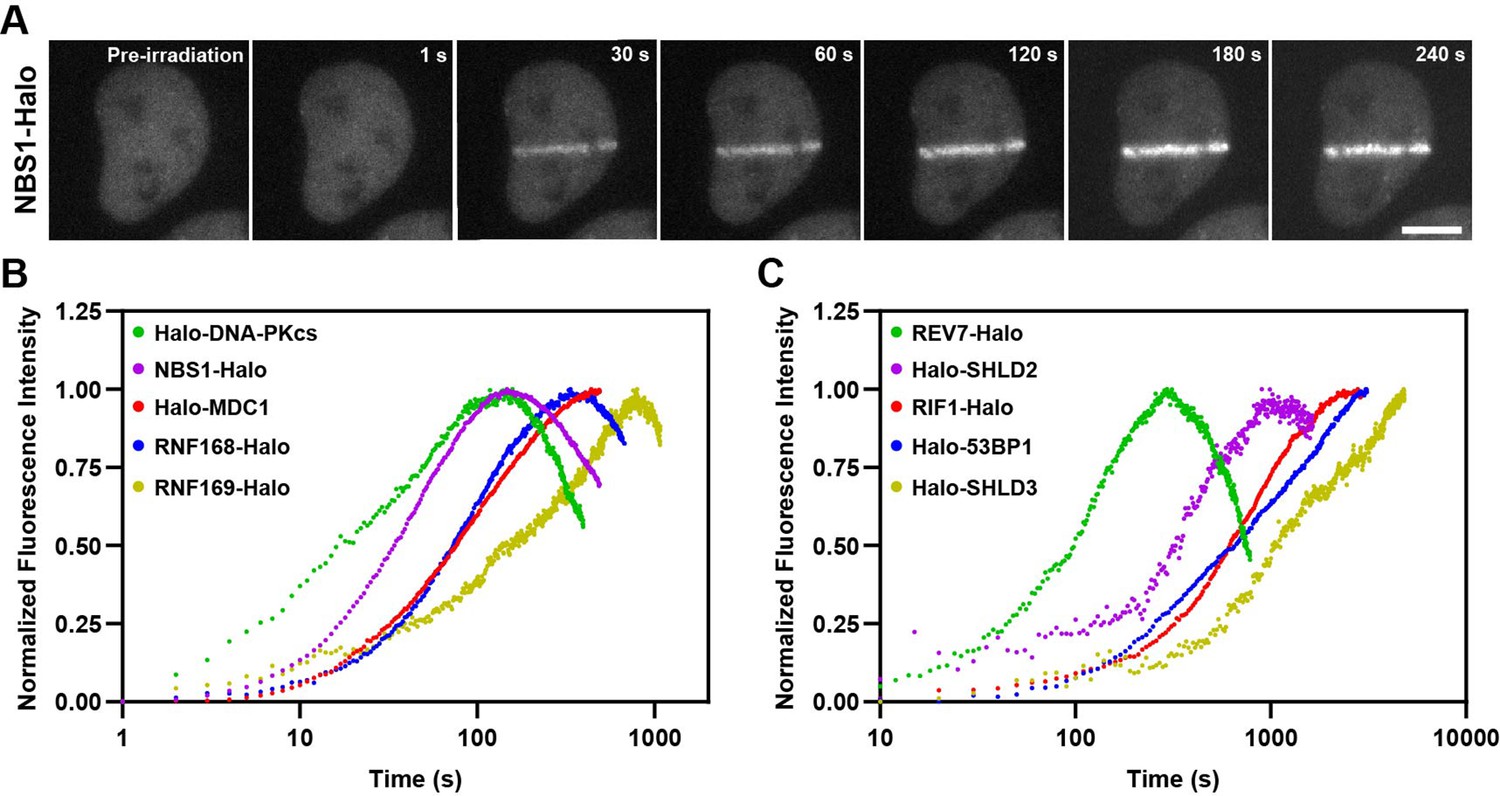
Kinetics of HaloTagged DDR proteins recruitment to sites of laser microirradiation induced DNA breaks.
(A) Representative images of NBS1-Halo (JFX650) recruitment to laser-induced DSBs over time (Scale bar = 10 μm). (B) Normalized recruitment kinetics of HaloTagged DNA-PKcs, NBS1, MDC1, RNF168, and RNF169 proteins to laser-induced DSBs. (C) Normalized recruitment kinetics of HaloTagged 53BP1, RIF1, REV7, SHLD2, and SHLD3 proteins to laser-induced DSBs. Data are presented as the average increase in fluorescence post-laser microirradiation normalized to the brightest average frame for each movie. n=8–13 individual cells analyzed for each HaloTag cell line.
Figure 4—figure supplement 1
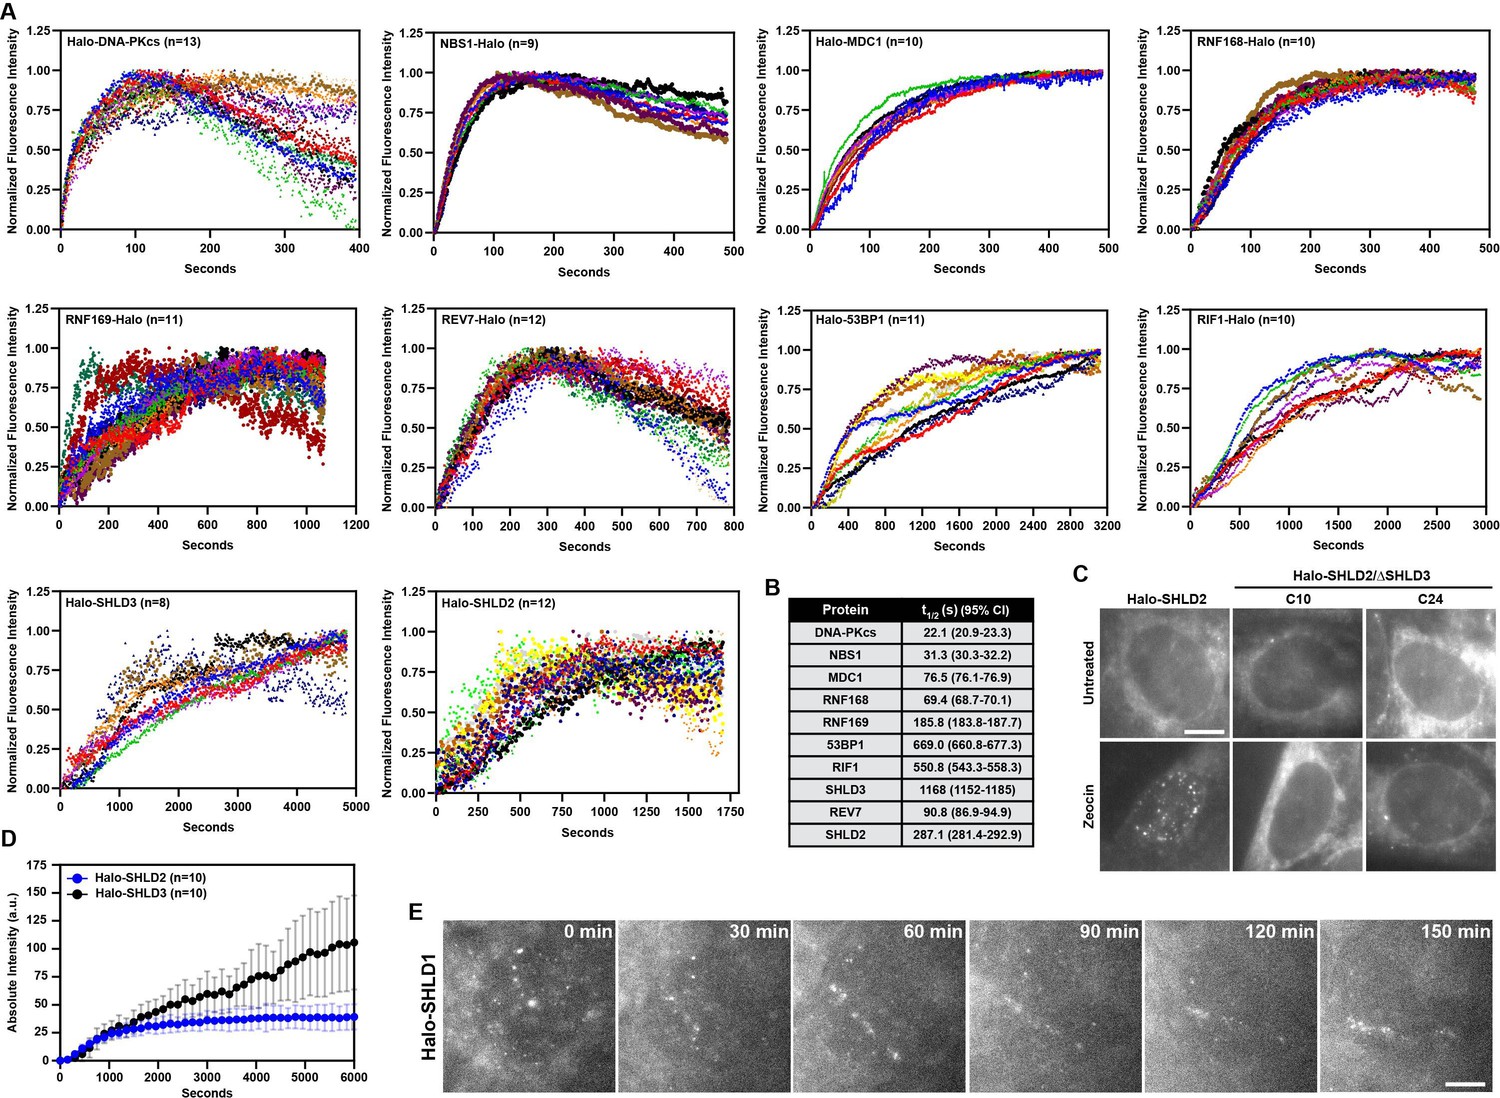
Kinetics of HaloTagged DDR protein recruitment to laser-induced DSBs.
(A) Plots showing normalized fluorescence intensity and recruitment of each HaloTagged DDR protein to laser-induced DSBs plotted by individual cells rather than normalized average. Each color represents an individual cell that was analyzed. Normalized fluorescence intensity was done by setting the brightest frame for each cell to 1. (B) Table listing the recruitment half-times (t1/2) of each protein to laser-induced DSBs determined by nonlinear regression assuming one-phase association. (C) Live-cell imaging of SHLD2 foci in SHLD3 +/+and SHLD3 -/- cells in the presence or absence of 100 μg/mL Zeocin. Scale bar = 5 μm. (D) Plot depicting the absolute fluorescence intensities of Halo-SHLD2 and Halo-SHLD3 recruitment to sites of laser-induced DNA damage. Data plotted as the average ± standard deviation. (E) Live-cell imaging of Halo-SHLD1 recruitment to DNA damage sites after laser microirradiation. Scale bar = 5 µm.
Figure 5 with 1 supplement
HaloTagged DDR proteins exhibit distinct nuclear diffusion and chromatin binding characteristics.
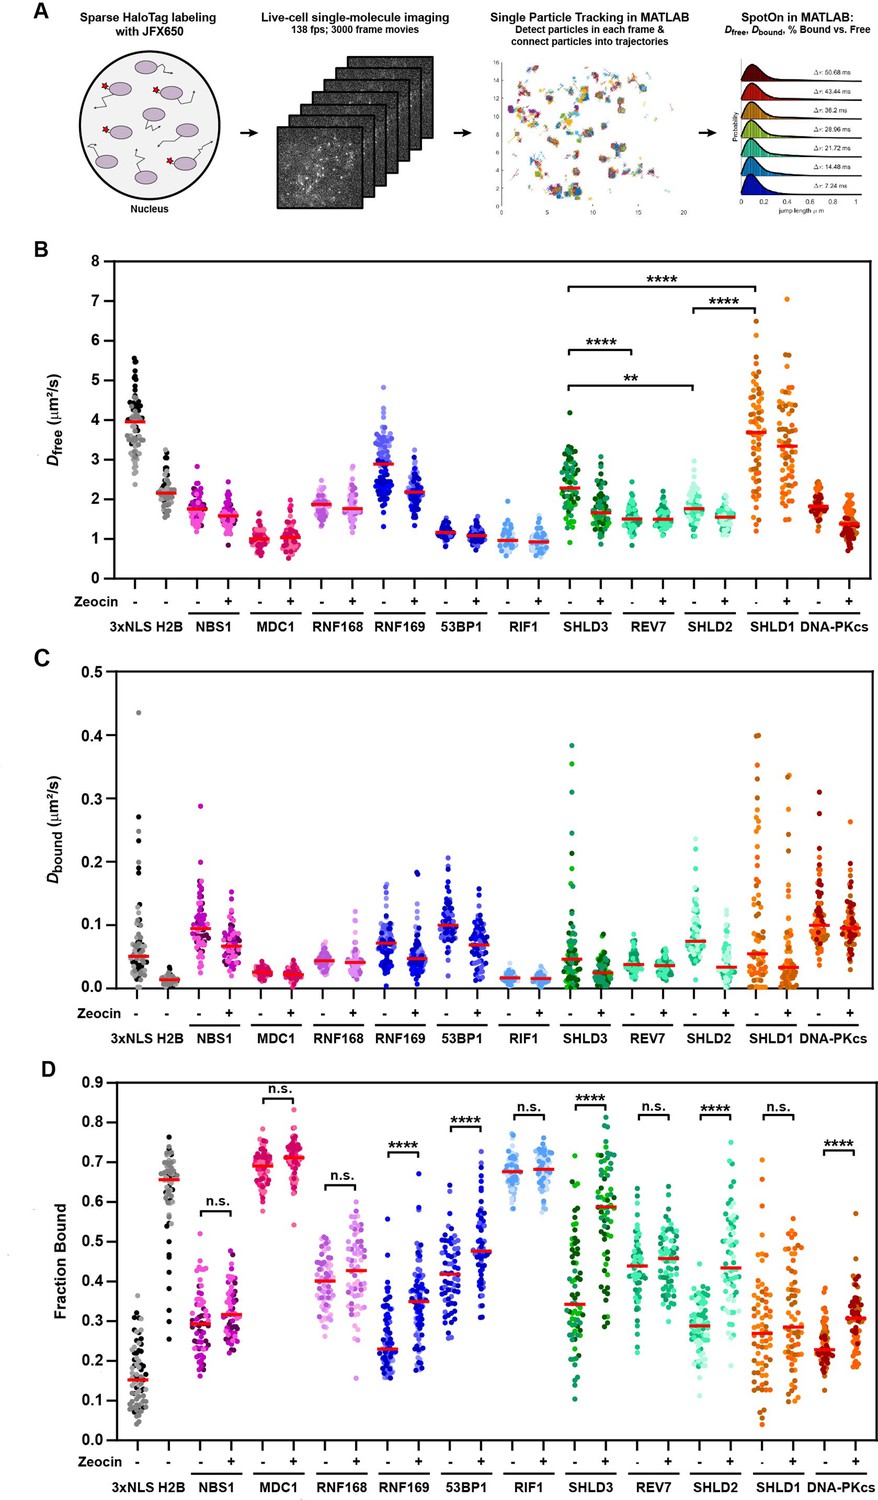
(A) Graphical representation of the workflow used for live-cell single-molecule imaging of HaloTagged DDR proteins. (B) Diffusion coefficients for freely diffusing HaloTag DDR proteins present in at least three consecutive frames in untreated conditions and post-Zeocin exposure. Values plotted indicate the Dfree for all analyzed tracks per cell with each dot indicating a separate cell that was analyzed. Live-cell single-molecule imaging was performed over 3–4 separate days imaging at least 20 individual cells per condition per experimental replicate (n≥60 cells total for each protein and condition representing three to four independent experiments). Red bar = median. (C) Diffusion coefficients of the bound fraction of HaloTag DDR proteins present in at least three consecutive frames in untreated conditions and post-Zeocin exposure. Values plotted indicate the Dbound for all analyzed tracks per cell with each dot indicating a separate cell that was analyzed. Live-cell single-molecule imaging was performed over 3–4 separate days imaging at least 20 individual cells per condition per experimental replicate (n≥60 cells total for each protein and condition). Red bar = median. (D) Plot of the Fraction Bound for each HaloTag DDR protein under each condition that were analyzed using a two-state model of diffusion. Each dot represents the fraction bound of each protein in an individual cell (n≥60 cells for each protein and condition). Red bar = median. Differently shaded points indicate data collected from separate biological experiments. Data were analyzed by two-way ANOVA with Tukey’s posthoc test. n.s.=not significant. ** p=0.004; **** p<0.0001.
Figure 5—figure supplement 1
Nuclear diffusion and chromatin binding characteristics of HaloTagged DDR proteins.
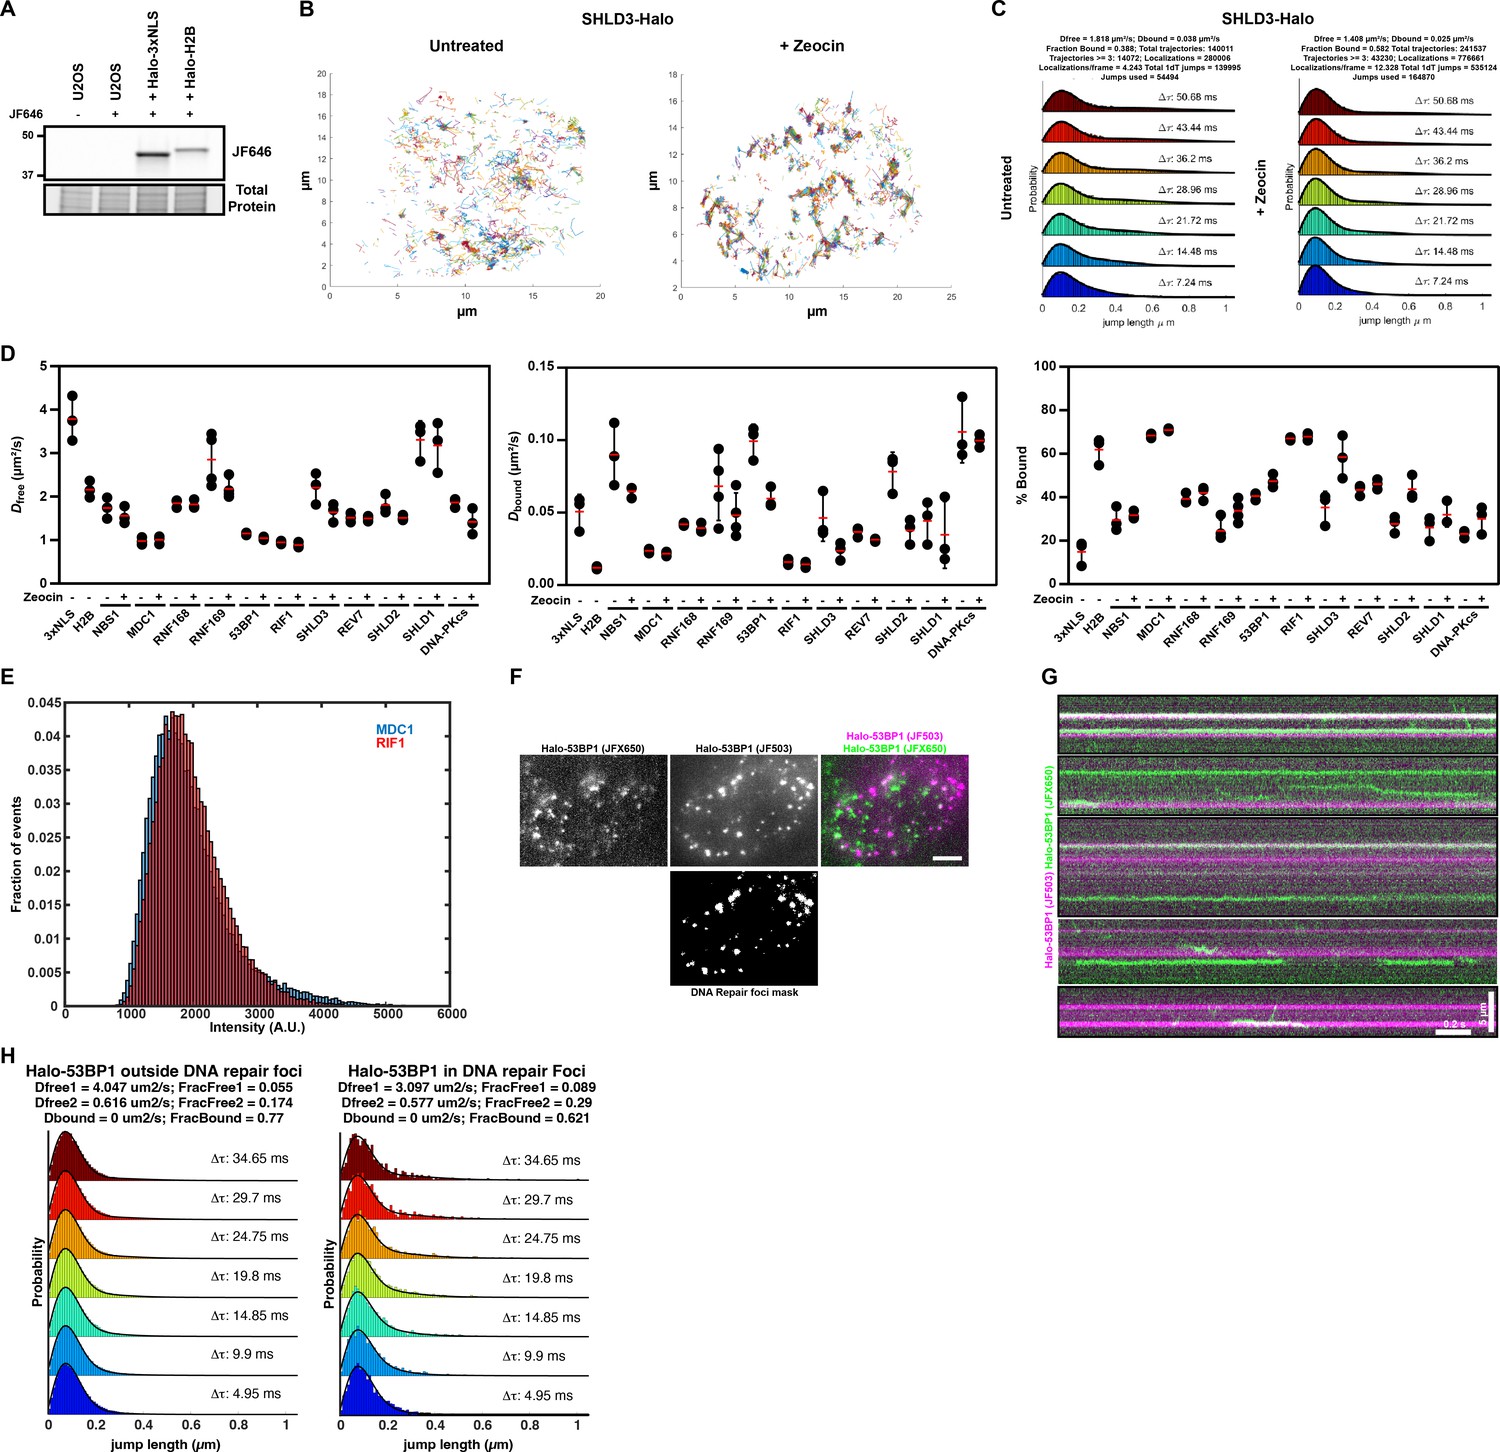
(A) SDS-PAGE gel showing expression of Halo-H2B and Halo-3xNLS in cells labeled with JF646. (B) Example images of protein tracks generated by single particle tracking of Halo-SHLD3 ±Zeocin. (C) Example plots from SpotOn for a single live-cell single-molecule experiment (>20 cells) for Halo-SHLD3 ±Zeocin. (D) Same data presented in Figure 5B & C, except plotted by individual experiment, rather than as individual cells, to demonstrate the reproducibility of imaging between experiments. Each dot represents results from an individual experiment. Red bar = mean. Error bars = S.D. (E) Intensity profiles of analyzed tracks for JFX650-labeled MDC1 and RIF1. (F) Still frames Zeocin-treated Halo-53BP1 cells sparsely labeled with JFX650 (pseudo-colored green) and a Z-projected image of densely labeled Halo-53BP1 with JF503 (pseudo-colored magenta). Movies were acquired at 202 frames per second. Scale bar = 5 µm. (G) Kymographs of Halo-53BP1 (single-particles pseudo-colored green; foci pseudo-colored magenta) taken from Videos 23–24 demonstrating distinct behaviors of 53BP1 particles inside and outside of foci. (H) SpotOn analysis using a three-state model of 53BP1 foci inside and outside of DNA repair foci. Tracks were filtered using the 53BP1 mask in (F).
-
Figure 5—figure supplement 1—source data 1
Uncropped gels corresponding to Figure 5—figure supplement 1.
- https://cdn.elifesciences.org/articles/87086/elife-87086-fig5-figsupp1-data1-v2.zip
Figure 6 with 1 supplement
Residence time analysis of DNA repair factors in response to DNA damage.
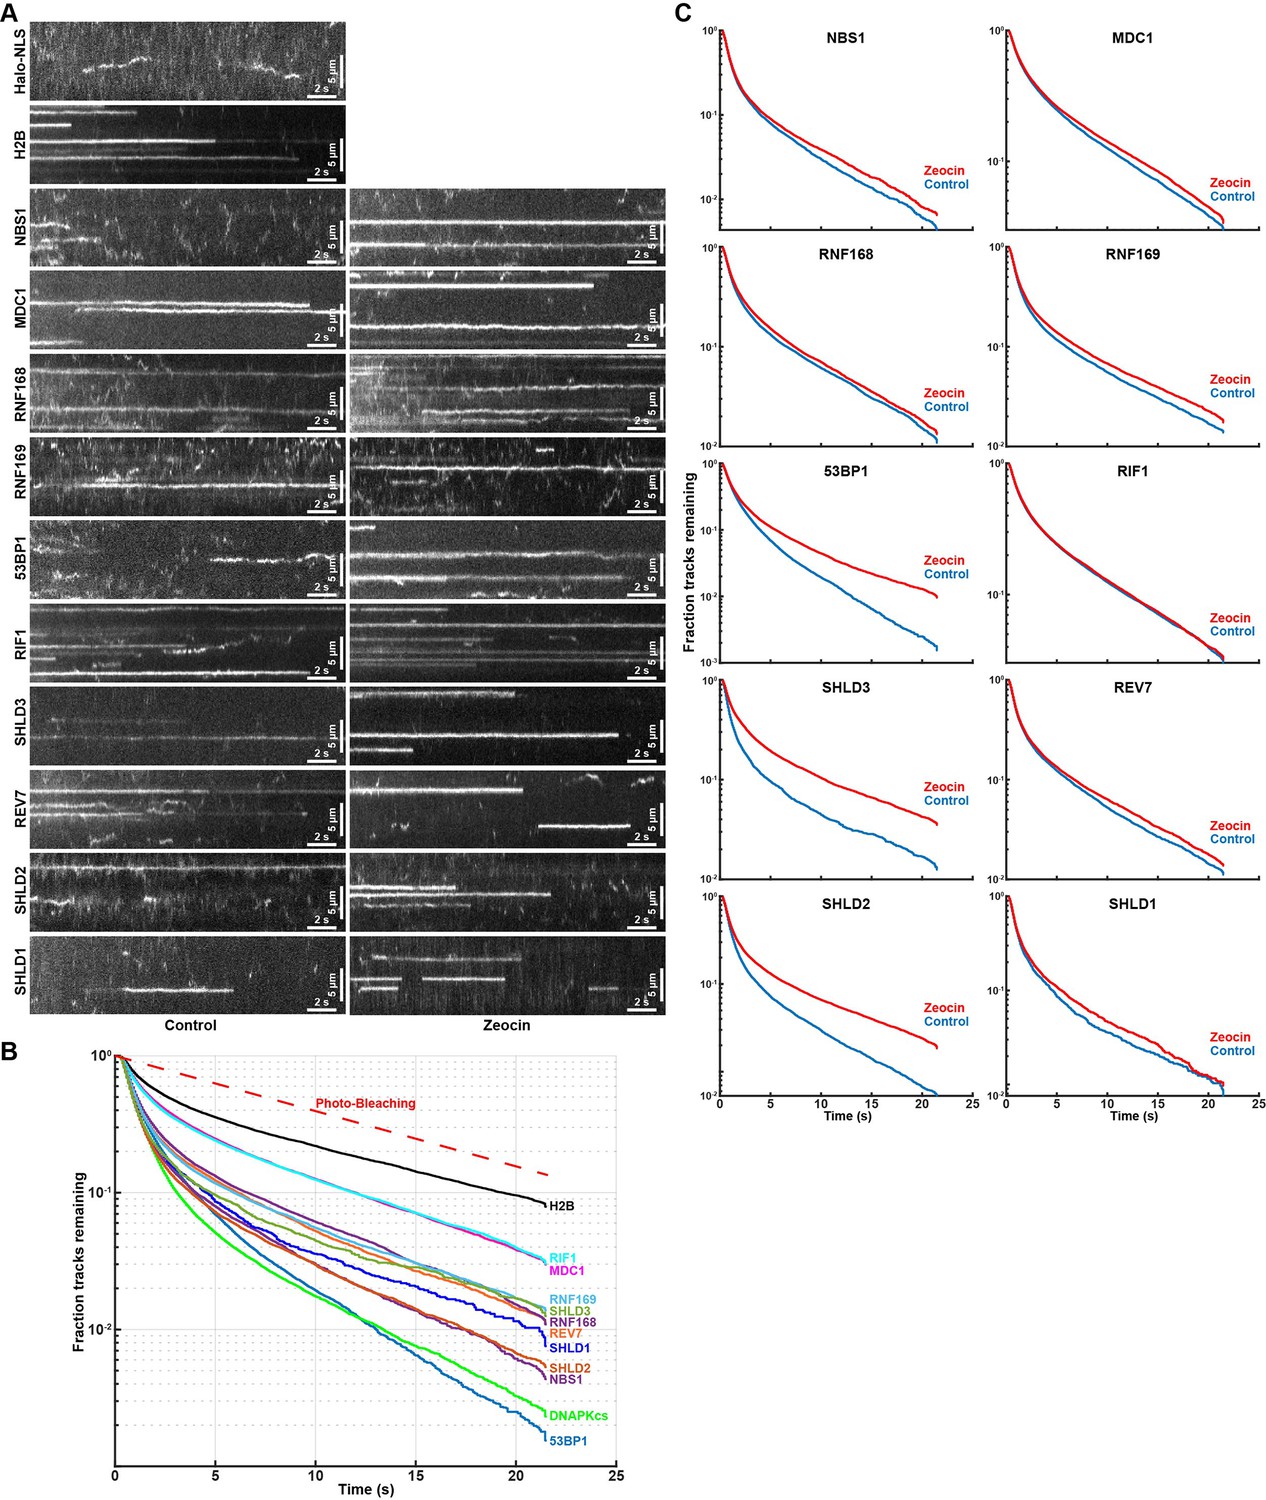
(A) Kymographs of single-molecule imaging movies for HaloTagged DNA repair factors. Movies were acquired with 7.2ms exposure times and to amplify long lasting interactions the intensity of 10 consecutive frames was averaged. (B) Residence time (track length) distribution of long-lasting chromatin binding events of DNA repair factors displayed as survival probability after the elapsed time. (C) Residence time (track length) distribution of long-lasting chromatin binding for the indicated DNA repair factors displayed as survival probability after the elapsed time. Aggregated data from 3 to 4 separate days imaging at least 20 individual cells per condition per experimental replicate (n≥60 cells total for each protein and condition) was fit with two exponential decay functions (R2 >0.99 for all proteins) and half-lives and fractions of slow and fast decaying components are reported.
Figure 6—figure supplement 1
Residence time analysis of DNA repair factors in response to DNA damage.
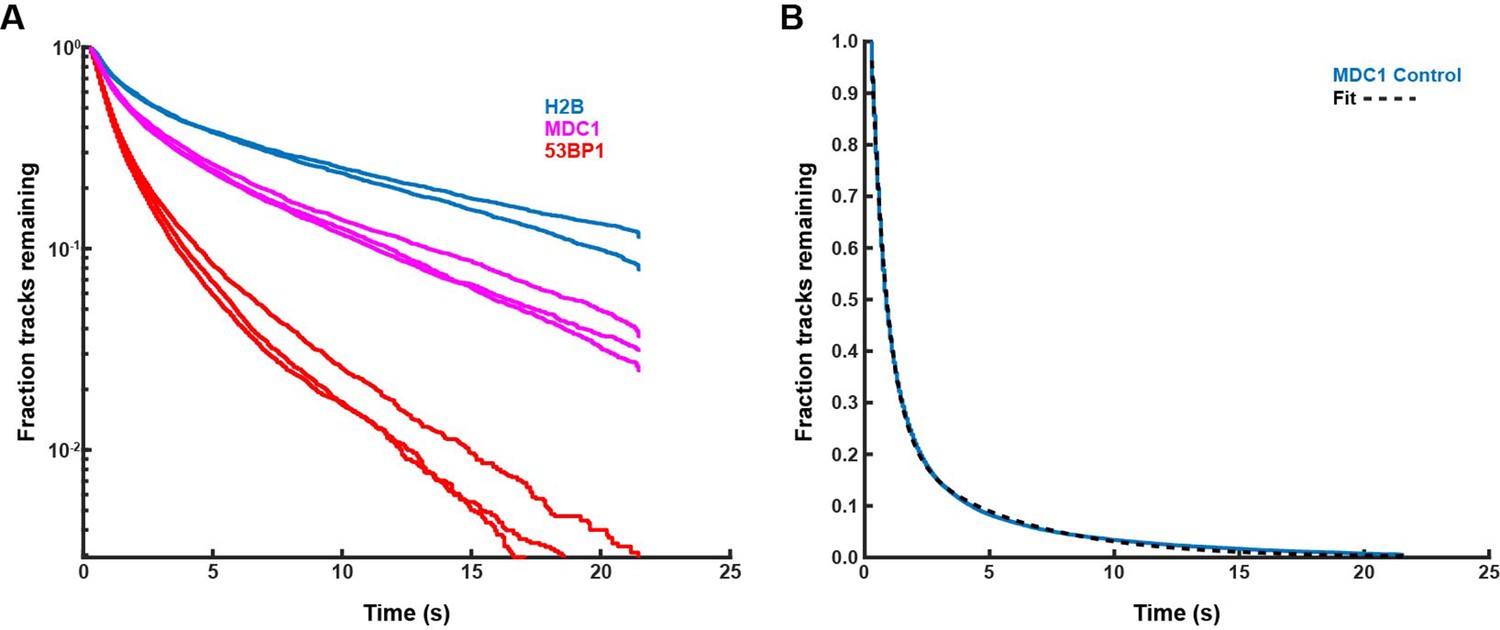
(A) Residence time (track length) distribution of long-lasting chromatin binding for the indicated DNA repair factors displayed as survival probability after the elapsed time. Graphs represent individual experimental replicates carried out on different days. (B) Residence time analysis for Halo-MDC1 fit with two exponential decay functions.
Figure 7 with 1 supplement
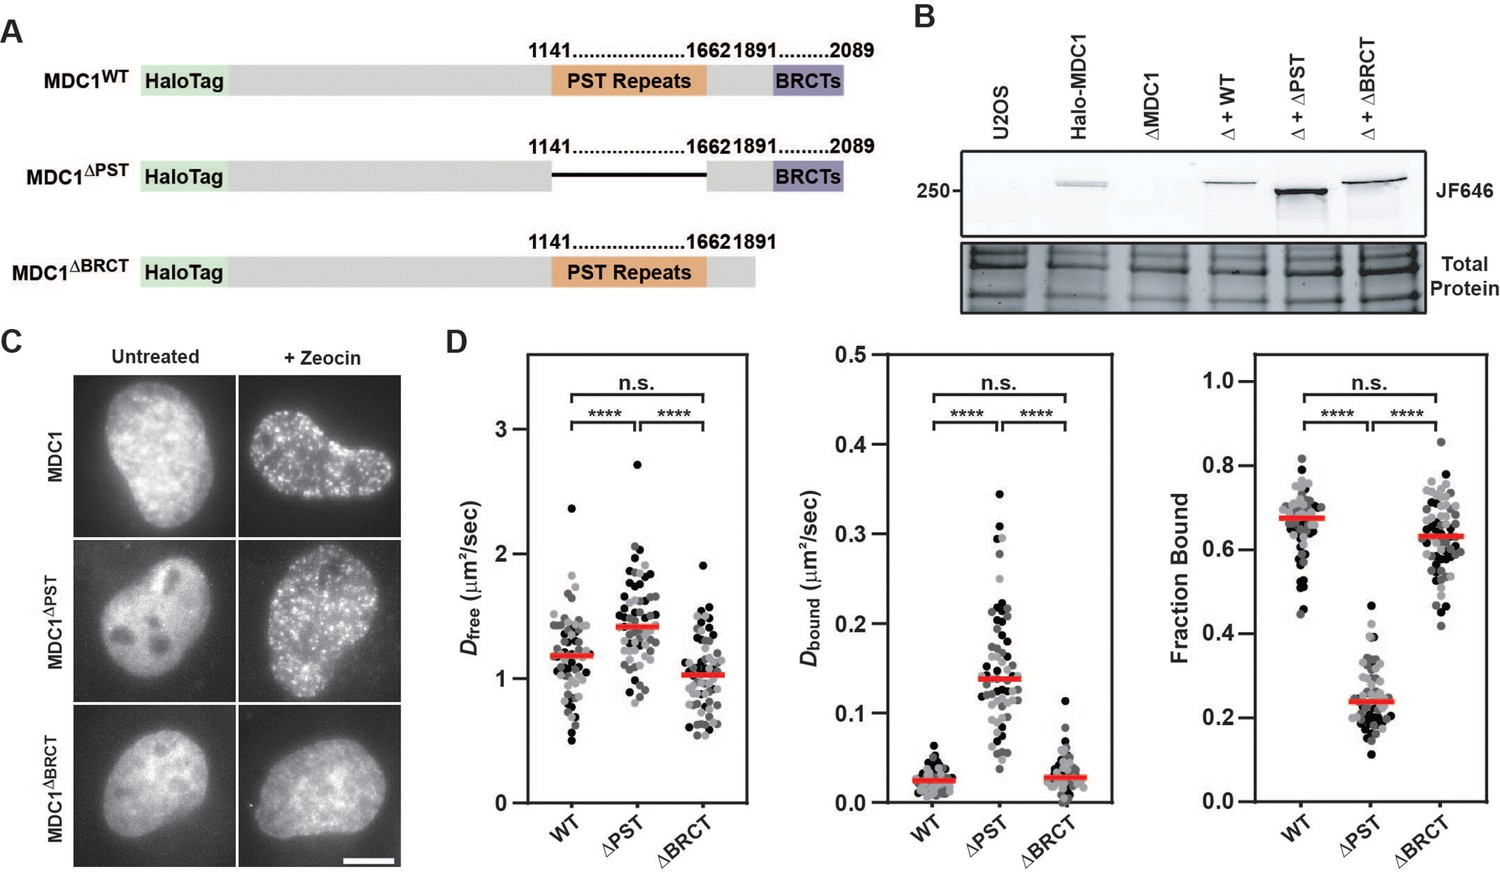
MDC1’s constitutive chromatin association is mediated by its PST repeat region.
(A) Graphical illustration of the primary sequence of MDC1 indicating the location of the PST repeat and BRCT domain and the associated deletion mutants generated to analyze effects on the MDC1-chromatin interaction. (B) SDS-PAGE gel of JF646-labeled cells depicting expression of transiently expressed WT, ΔPST, and ΔBRCT MDC1 in Halo-MDC1 knockout cells. (C) Representative images of transiently expressed, JF646-labeled MDC1 deletion mutants in living cells in the presence of absence of Zeocin. (D) Results of live-cell single-molecule analysis of transiently overexpressed MDC1 deletion mutants analyzed with single particle tracking and SpotOn. Each dot represents the indicated Dfree, Dbound, or Fraction Bound for MDC1 molecules appearing in at least three consecutive frames within a single cell. Red bar = median. Data are the combination of all analyzed cells imaged over three independent experiments (n≥60 cells total). Differently shaded points indicate data collected from separate biological replicates. Data were analyzed by two-way ANOVA with Tukey’s posthoc test. n.s.=not significant. ****=p < 0.0001.
-
Figure 7—source data 1
Uncropped gels corresponding to Figure 7.
- https://cdn.elifesciences.org/articles/87086/elife-87086-fig7-data1-v2.zip
Figure 7—figure supplement 1
MDC1’s constitutive chromatin association is mediated by its PST repeat region.
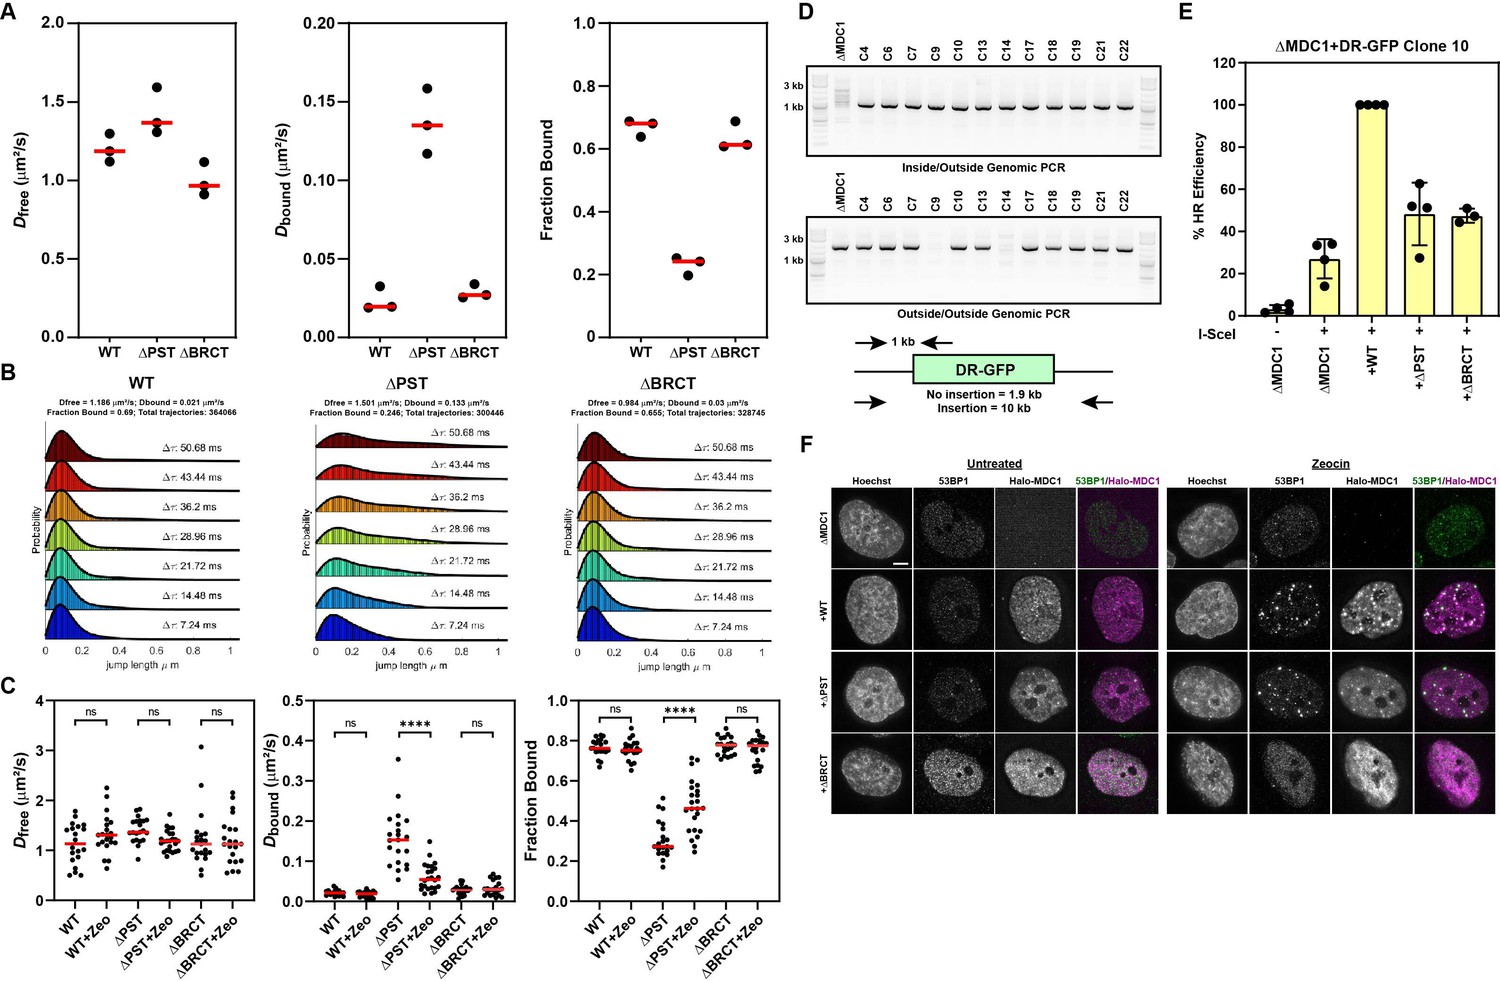
(A) Same data presented in Figure 6D, except plotted by individual experiment, rather than individual cells, demonstrating the reproducibility of analysis experiments. Each dot represents results from an individual experiment. Red bar = median. (B) Example plots generated by SpotOn for a single live-cell single-molecule experiment (>20 cells) of WT, ΔPST, and ΔBRCT MDC1. (C) Live-cell single-molecule imaging of MDC1 deletion mutants in untreated or after treatment with 100 μg/mL Zeocin (n≥20 cells per condition). Data compared by two-way ANOVA with Tukey’s posthoc test. **** p<0.0001. (D) Genomic PCR demonstrating heterozygous knockin of the DR-GFP substrate into the AAVS1 locus of ΔMDC1 cells. (E) Results from DR-GFP assay in ΔMDC1 cells transiently transfected with Halo-MDC1 mutants and I-SceI expression plasmid. (F) Immunofluorescence in ΔMDC1 cells transfected with HaloTagged MDC1 mutants ±10 μg/mL Zeocin treatment for one hour. Scale bar = 5 μm.
Videos
Video 1
Representative movie demonstrating recruitment of JFX650-labeled 3xFLAG-HaloTagged DNA-PKcs to DNA DSBs after laser microirradiation.
Images were acquired at one frame per second. 170x170 pixels with a pixel size of 0.16 μm.
Video 2
Representative movie demonstrating recruitment of JFX650-labeled 3xFLAG-HaloTagged NBS1 to DNA DSBs after laser microirradiation.
Images were acquired at one frame per second. 170x170 pixels with a pixel size of 0.16 μm.
Video 3
Representative movie demonstrating recruitment of JFX650-labeled 3xFLAG-HaloTagged MDC1 to DNA DSBs after laser microirradiation.
Images were acquired at one frame per second. 170x170 pixels with a pixel size of 0.16 μm.
Video 4
Representative movie demonstrating recruitment of JFX650-labeled 3xFLAG-HaloTagged RNF168 to DNA DSBs after laser microirradiation.
Images were acquired at one frame per second. 170x170 pixels with a pixel size of 0.16 μm.
Video 5
Representative movie demonstrating recruitment of JFX650-labeled 3xFLAG-HaloTagged RNF169 to DNA DSBs after laser microirradiation.
Images were acquired at one frame per second. 170x170 pixels with a pixel size of 0.16 μm.
Video 6
Representative movie demonstrating recruitment of JFX650-labeled 3xFLAG-HaloTagged 53BP1 to DNA DSBs after laser microirradiation.
Images were acquired at one frame every 10 s. 170x170 pixels with a pixel size of 0.16 μm.
Video 7
Representative movie demonstrating recruitment of JFX650-labeled 3xFLAG-HaloTagged RIF1 to DNA DSBs after laser microirradiation.
Images were acquired at one frame every 10 s. 170x170 pixels with a pixel size of 0.16 μm.
Video 8
Representative movie demonstrating recruitment of JFX650-labeled 3xFLAG-HaloTagged SHLD3 to DNA DSBs after laser microirradiation.
Images were acquired at one frame every 10 s. 170x170 pixels with a pixel size of 0.16 μm.
Video 9
Representative movie demonstrating recruitment of JFX650-labeled 3xFLAG-HaloTagged REV7 to DNA DSBs after laser microirradiation.
Images were acquired at one frame every two seconds. 170x170 pixels with a pixel size of 0.16 μm.
Video 10
Representative movie demonstrating recruitment of JFX650-labeled 3xFLAG-HaloTagged SHLD2 to DNA DSBs after laser microirradiation.
Images were acquired at one frame every five seconds. 170x170 pixels with a pixel size of 0.16 μm.
Video 11
Representative live-cell single-molecule imaging movies of untreated and zeocin-treated U2OS cells expressing 3xFLAG-HaloTagged NBS1 labeled with JFX650 and acquired at 138 frames per second.
170x140 pixels with a pixel size of 0.16 μm.
Video 12
Representative live-cell single-molecule imaging movies of untreated and zeocin-treated U2OS cells expressing 3xFLAG-HaloTagged MDC1 labeled with JFX650 and acquired at 138 frames per second.
170x140 pixels with a pixel size of 0.16 μm.
Video 13
Representative live-cell single-molecule imaging movies of untreated and zeocin-treated U2OS cells expressing 3xFLAG-HaloTagged RNF168 labeled with JFX650 and acquired at 138 frames per second.
170x140 pixels with a pixel size of 0.16 μm.
Video 14
Representative live-cell single-molecule imaging movies of untreated and zeocin-treated U2OS cells expressing 3xFLAG-HaloTagged RNF169 labeled with JFX650 and acquired at 138 frames per second.
170x140 pixels with a pixel size of 0.16 μm.
Video 15
Representative live-cell single-molecule imaging movies of untreated and zeocin-treated U2OS cells expressing 3xFLAG-HaloTagged 53BP1 labeled with JFX650 and acquired at 138 frames per second.
170x140 pixels with a pixel size of 0.16 μm.
Video 16
Representative live-cell single-molecule imaging movies of untreated and zeocin-treated U2OS cells expressing 3xFLAG-HaloTagged RIF1 labeled with JFX650 and acquired at 138 frames per second.
170x140 pixels with a pixel size of 0.16 μm.
Video 17
Representative live-cell single-molecule imaging movies of untreated and zeocin-treated U2OS cells expressing 3xFLAG-HaloTagged REV7 labeled with JFX650 and acquired at 138 frames per second.
170x140 pixels with a pixel size of 0.16 μm.
Video 18
Representative live-cell single-molecule imaging movies of untreated and zeocin-treated U2OS cells expressing 3xFLAG-HaloTagged SHLD3 labeled with JFX650 and acquired at 138 frames per second.
170x140 pixels with a pixel size of 0.16 μm.
Video 19
Representative live-cell single-molecule imaging movies of untreated and zeocin-treated U2OS cells expressing 3xFLAG-HaloTagged SHLD2 labeled with JFX650 and acquired at 138 frames per second.
170x140 pixels with a pixel size of 0.16 μm.
Video 20
Representative live-cell single-molecule imaging movies of untreated and zeocin-treated U2OS cells expressing 3xFLAG-HaloTagged SHLD1 labeled with JFX650 and acquired at 138 frames per second.
170x140 pixels with a pixel size of 0.16 μm.
Video 21
Representative live-cell single-molecule imaging movies of untreated and zeocin-treated U2OS cells expressing 3xFLAG-HaloTagged DNA-PKcs labeled with JFX650 and acquired at 138 frames per second.
170x140 pixels with a pixel size of 0.16 μm.
Video 22
Representative live-cell single-molecule imaging movies of U2OS cells transiently expressing HaloTag-H2B and HaloTag-3xNLS labeled with JFX650 and acquired at 138 frames per second.
170x140 pixels with a pixel size of 0.16 μm.
Video 23
Representative live-cell single-molecule imaging movie of Zeocin-treated U2OS cells expressing endogenous 3xFLAG-HaloTag-53BP1 sparsely labeled with JFX650 (pseudo-colored green) acquired at 202 frames per second and overlayed with a Z-projected image of 53BP1 foci which were densely labeling with JF503 (pseudo-colored magenta).
Pixel size = 0.108 μm.
Video 24
A second representative live-cell single-molecule imaging movie of Zeocin-treated U2OS cells expressing endogenous 3xFLAG-HaloTag-53BP1 sparsely labeled with JFX650 (pseudo-colored green) acquired at 202 frames per second and overlayed with a Z-projected image of 53BP1 foci which were densely labeling with JF503 (pseudo-colored magenta).
Pixel size = 0.108 μm.
Video 25
Representative movie demonstrating robust tracking of bound particles after averaging the image intensity over 10 frames and constraining the expected diffusion coefficient of bound particles to Dmax = 0.05 µm2/s.
Images acquired at 138 frames per second and the frame rate was reduced to 13.8 frames per second by the averaging over 10 consecutive frames. Pixel size = 0.16 μm.
Video 26
Representative live-cell single-molecule imaging movies of HaloTagged MDC1 deletion mutants transiently expressed in ΔMDC1 U2OS cells, labeled with JFX650, and acquired at 138 frames per second.
170x140 pixels with a pixel size of 0.16 μm.
Tables
Table 1
Absolute protein abundances of HaloTagged DNA repair proteins in U2OS cells.
Left column: Absolute protein abundance of HaloTagged proteins determined by in-gel fluorescence after adjusting with the TEV correction factor calculated for each protein. An asterisk (*) indicates the three proteins for which an accurate TEV correction factor could not be generated. For TEV-corrected samples, the S.D. includes propagated error. Right column: Determination of absolute protein abundances of untagged DNA repair proteins in parental U2OS cells by applying a Western blot correction factor to adjust for differences in expression between HaloTagged and untagged protein. For western blot corrected samples, S.D. includes propagated error. An asterisk (*) denotes samples where the Western correction was applied to samples that were not TEV corrected. No Data indicates the absence of a commercially available antibody or an antibody that detects endogenous levels of protein expression.
| Protein | HaloTag Protein ± S.D. | Western Correction ± S.D. |
|---|---|---|
| NBS1 | 15,846±9547 | 18,055±11,180 |
| ATM C1 | 4161±1897 | 4738±2379 |
| ATM C2 | 1578±945 | 3115±2365 |
| MDC1 C1 | 13,352±6001* | 16,030±7631* |
| MDC1 C2 | 2434±1506 | 3390±2180* |
| RNF168 C1 | 27,787±7241* | 4585±1819* |
| RNF168 C2 | 21,531±4801* | 4678±1145 |
| RNF169 C1 | 19,013±3759* | No Data |
| RNF169 C2 | 18,413±3119* | No Data |
| 53 BP1 | 40,162±11,498 | 12,109±5792 |
| RIF1 C1 | 57,486±28,970 | 9382±5765 |
| RIF1 C2 | 64,358±37,504 | 10,398±7506 |
| SHLD3 C1 | 5555±1913 | No Data |
| SHLD3 C2 | 3953±2187 | No Data |
| REV7 C1 | 178,131±40,757 | 39,803±10,299 |
| REV7 C2 | 78,340±25,161 | 66,790±42,830 |
| SHLD2 | 7257±3104 | No Data |
| SHLD1 C1 | 8124±4104 | No Data |
| SHLD1 C2 | 7257±3103 | No Data |
| DNA-PKcs C1 | 90,899±26,030 | 115,143±46,933 |
| DNA-PKcs C2 | 85,786±23,508 | 138,704±71,488 |
Additional files
-
Supplementary file 1
Oligonucleotide sequences used in this study including gRNAs, PCR primers, homology arms, and N-terminal and C-terminal 3XFLAG-HaloTag.
- https://cdn.elifesciences.org/articles/87086/elife-87086-supp1-v2.docx
-
MDAR checklist
- https://cdn.elifesciences.org/articles/87086/elife-87086-mdarchecklist1-v2.pdf
Download links
A two-part list of links to download the article, or parts of the article, in various formats.
Downloads (link to download the article as PDF)
Open citations (links to open the citations from this article in various online reference manager services)
Cite this article (links to download the citations from this article in formats compatible with various reference manager tools)
Systematic analysis of the molecular and biophysical properties of key DNA damage response factors
eLife 12:e87086.
https://doi.org/10.7554/eLife.87086


