Microhomology-mediated circular DNA formation from oligonucleosomal fragments during spermatogenesis
- State Key Laboratory of Pharmaceutical Biotechnology, School of Life Sciences, Chemistry and Biomedicine Innovation Center (ChemBIC), Department of Andrology, Nanjing Drum Tower Hospital, Nanjing University, China
- Department of Urology, Department of Reproductive Medicine Center, Peking University Third Hospital, China
- Guangzhou Women and Children's Medical Center, Guangzhou Medical University, China
- Department of Urology, Peking University First Hospital Institute of Urology, China
- State Key Laboratory of Stem Cell and Reproductive Biology, Institute of Zoology, Stem Cell and Regenerative Medicine Innovation Institute, Chinese Academy of Science, China
- Nanchuang (Jiangsu) Institute of Chemistry and Health, China
Figures
Figure 1 with 3 supplements

Overview of extrachromosomal circular DNA (eccDNA) formation during mouse spermatogenesis.
(A) Schematic representation of Circle-seq in human sperm cells and mouse spermatocytes (SPA), round spermatids (RST), elongated spermatids (EST), and sperm cells validated with immunochemistry. SYCP3: a component of the synaptonemal complex; γH2AX: a marker for double-strand breaks; SP56: a marker for acrosome organelle; TUBULIN: structural component of manchette in EST and flagellum axoneme in sperm cells. (B) Number of eccDNAs detected in different cell types. *Two-sided t-test p-value<0.05; **two-sided t-test p-value<0.01. (C) Size distribution of eccDNAs during mouse spermatogenesis. Dotted lines indicate multiplies of 180 bp. (D) A representative genomic locus showing the gene annotation, Circle-seq signals, detected eccDNAs, and SINE and DNA repeat elements. Highlighted in red rectangle is a large-sized eccDNA. (E) Enrichment of eccDNAs at given genomic regions relative to randomly-selected control regions. (F) Enrichment of eccDNAs at given repeat elements relative to randomly selected control regions.
Figure 1—figure supplement 1
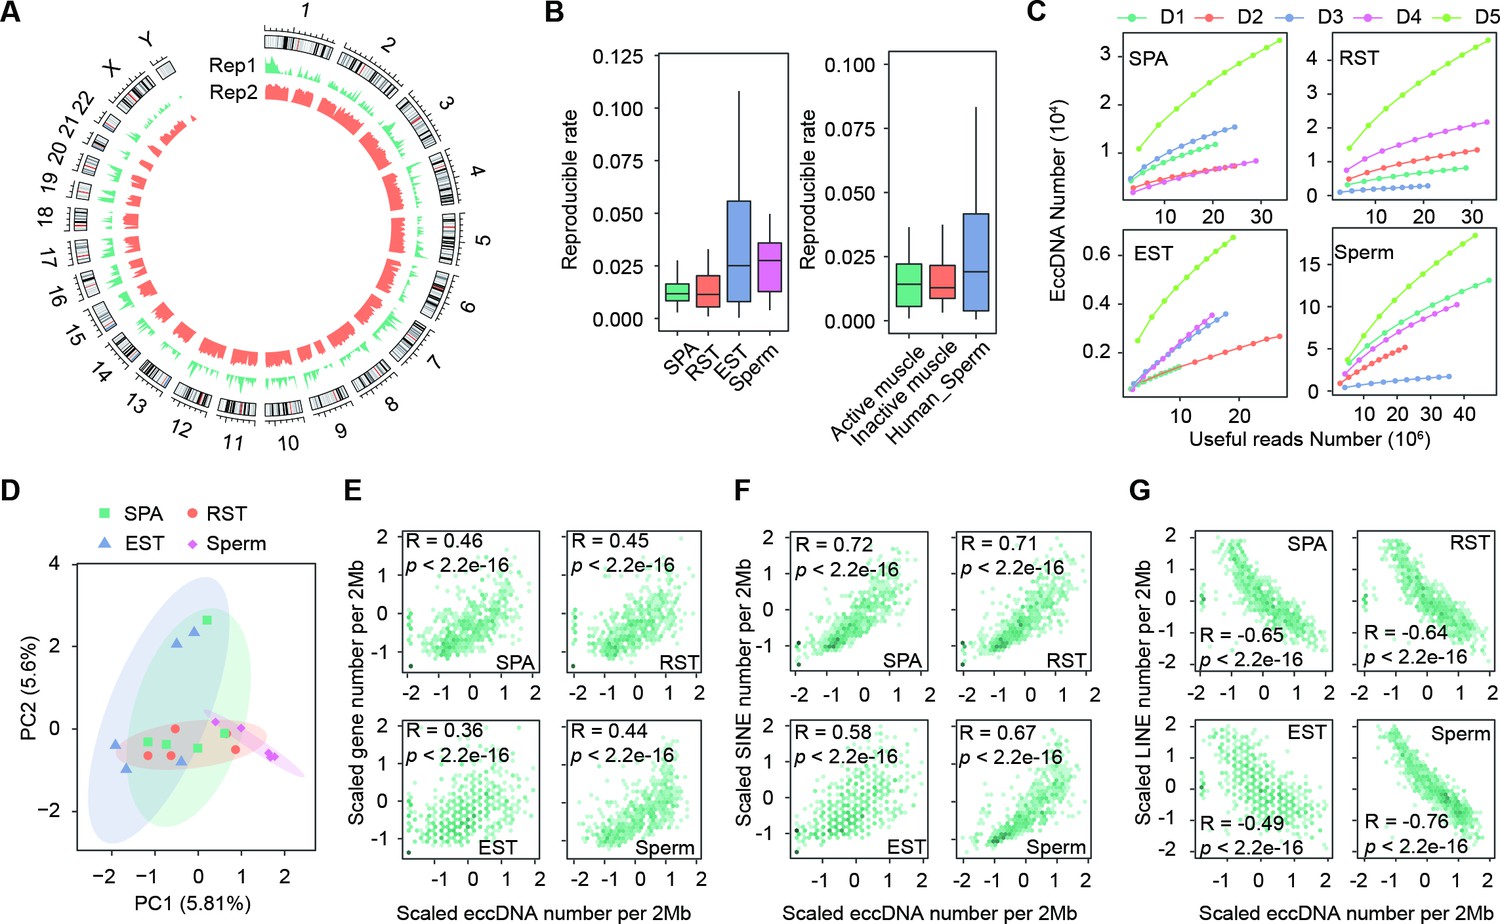
Detection and characterization of extrachromosomal circular DNAs (eccDNAs).
(A) Genome-wide distribution of eccDNAs detected in two human sperm samples. (B) Histograms showing distributions of reproducible rates between any two replicates of the same biological sample. Left: data generated in this study; right: public datasets (Møller et al., 2018; Henriksen et al., 2022). (C) Number of detected eccDNAs as a function of non-redundant uniquely mapped reads (useful reads) randomly sampled from indicated Circle-seq sequencing libraries. (D) Principal component analysis of biological replicates using Jaccard indexes with all other replicates as features. 75% confidence ellipses are indicated. (E–G) eccDNA number per 2 megabases as a function of gene density (E), density of SINE (F) and LINE (G) elements.
Figure 1—figure supplement 2
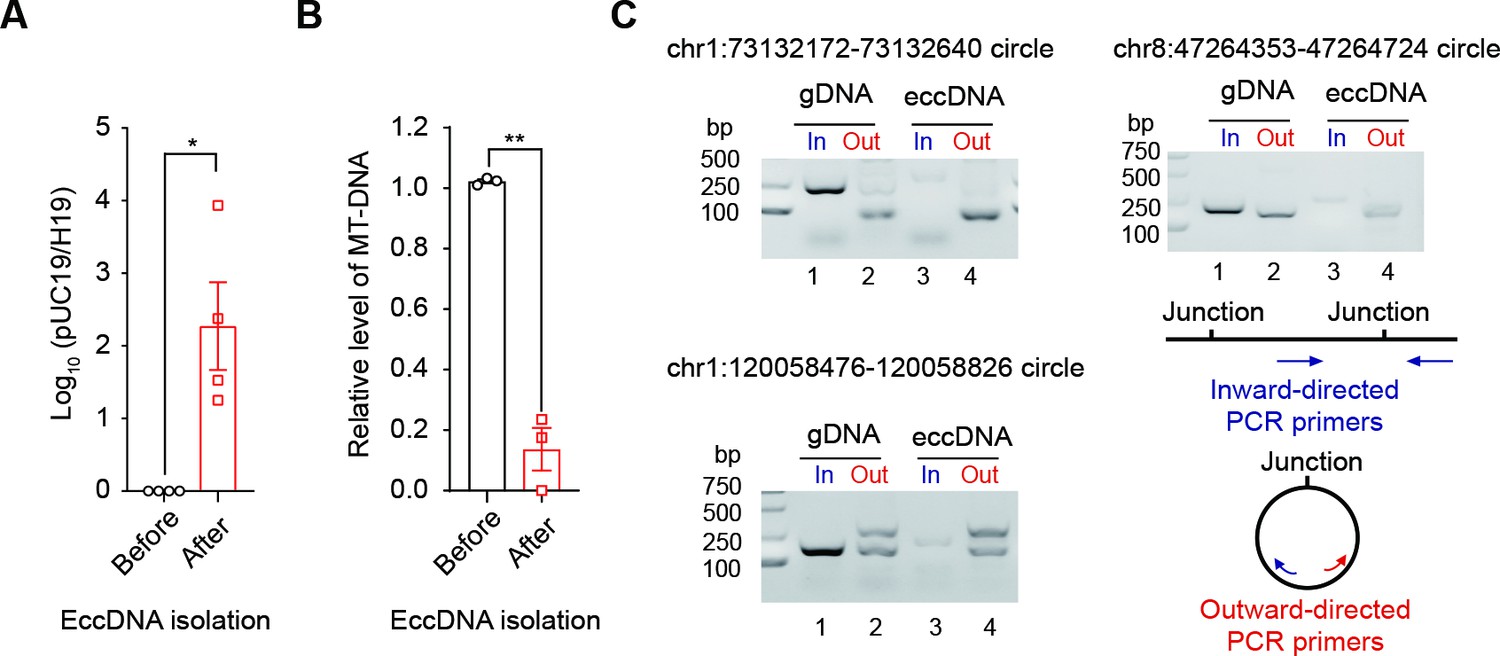
Quality control of the extrachromosomal circular DNA (eccDNA) isolation procedure.
(A) qPCR quantification of the ratio of an exogenous circular DNA (pUC19) to a linear DNA locus (H19 gene) before and after eccDNA isolation procedures. The ratio before eccDNA isolation is normalized to 1 (n = 4 independent experiments, two-tailed Student’s t-test p-value=0.0327). Data are presented as means ± SEM. *Two-tailed Student’s t-test p-value<0.05. (B) Relative abundance of mtDNA before and after eccDNA isolation procedures. The abundance of mtDNA before eccDNA isolation is normalized to 1 (n = 3 independent experiments, two-tailed Student’s t-test p-value=0.0068). Data are presented as means ± SEM. **Two-tailed Student’s t-test, p-value<0.01. (C) Gel image showing PCR validation of three eccDNAs using inward and outward PCR primers.
-
Figure 1—figure supplement 2—source data 1
The original gel images for Figure 1—figure supplement 2C showing PCR validation of three extrachromosomal circular DNAs (eccDNAs) using inward and outward PCR primers.
- https://cdn.elifesciences.org/articles/87115/elife-87115-fig1-figsupp2-data1-v1.zip
Figure 1—figure supplement 3
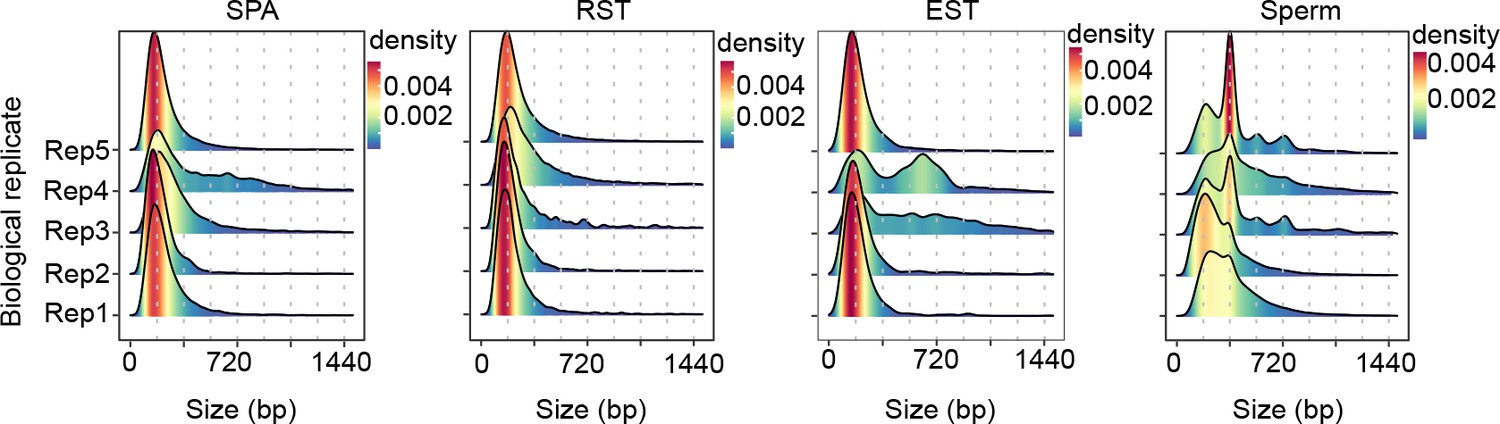
Length distribution of extrachromosomal circular DNAs (eccDNAs) in different cells.
Dotted lines indicate multiplies of 180 bp.
Figure 2

Association between sperm extrachromosomal circular DNAs (eccDNAs) and nucleosome positioning.
(A) GC contents of sperm eccDNAs, regions upstream and downstream of eccDNAs, and randomly selected length-matched control regions. ***Two-sided Wilcoxon test p-value<0.001. (B) Predicted probability of nucleosome occupancy for eccDNA and randomly selected length-matched control regions (highlighted by red-shaded area), and surrounding regions. Boxplots showing the probability distribution of individual eccDNAs and control regions. ***Two-sided Wilcoxon test p-value<0.001. (C) Enrichment of eccDNAs at different histones and histone modifications. (D, E) ChIP-seq signal distribution at [–1.8 kb, +1.8 kb] of the centers of ~180 bp (D) and ~360 bp (E) eccDNAs. ChIP-seq signals quantified as reads density are color-coded below heatmaps.
Figure 3 with 1 supplement

Large-sized extrachromosomal circular DNAs (eccDNAs) are preferentially generated from heterochromatin regions.
(A) Distribution at H3K27ac- and H3K9me3-marked regions for eccDNAs of different sizes. (B) Distribution at different genomic regions for eccDNAs of different sizes. (C) Number of small (<3 kb) vs. large (≥3 kb) eccDNAs per Mb as a function of gene number per Mb. Pearson correlation coefficients and two-sided t-test p-values are indicated. (D) Number of small (<3 kb) vs. large (≥3 kb) eccDNAs per Mb as a function of Alu number per Mb. Pearson correlation coefficients and two-sided t-test p-values are indicated.
Figure 3—figure supplement 1

Correlation between the density of small-sized (A) vs. large-sized (B) extrachromosomal circular DNAs (eccDNAs) and the meiotic recombination rate (Jensen-Seaman et al., 2004).
Figure 4 with 2 supplements

Microhomology-directed ligation accounts for emergence of most extrachromosomal circular DNAs (eccDNAs).
(A) Numbers of eccDNAs or randomly selected control regions overlapped with recombination hotspots in mouse. (B) Shown are numbers of mouse sperm eccDNAs or randomly selected control regions having 95% reciprocal overlap with different types of structural variations. (C) Illustrated are how an eccDNA with homologous sequences (CGA) at two ends is identified from short-read sequencing data by our methods vs. other methods. (D) Percentages of homologous sequences of different lengths (coded by different color saturation levels) are shown for eccDNAs and randomly selected control regions. (E) GC content of homologous sequences and randomly selected control regions. (F) Percentages of homologous sequences of different lengths (coded by different color saturation levels) are shown for small-sized (<3 kb) and large-sized (≥3 kb) eccDNAs. (G) Length of microhomologous sequences as a function of the eccDNA size. Data points are shown as median plus lower (25%) and upper (75%) quartiles. The shaded area is 95% confidence interval of linear regression line. Pearson correlation coefficient and two-sided t-test p-value are indicated. (H) Sequencing motif analysis for ±10 bp leftmost left ends and ±10 bp leftmost right ends of eccDNAs with no perfectly matched homologous sequences observed. (I) Model for microhomology-mediated end joining (MMEJ)-directed eccDNA biogenesis.
Figure 4—figure supplement 1
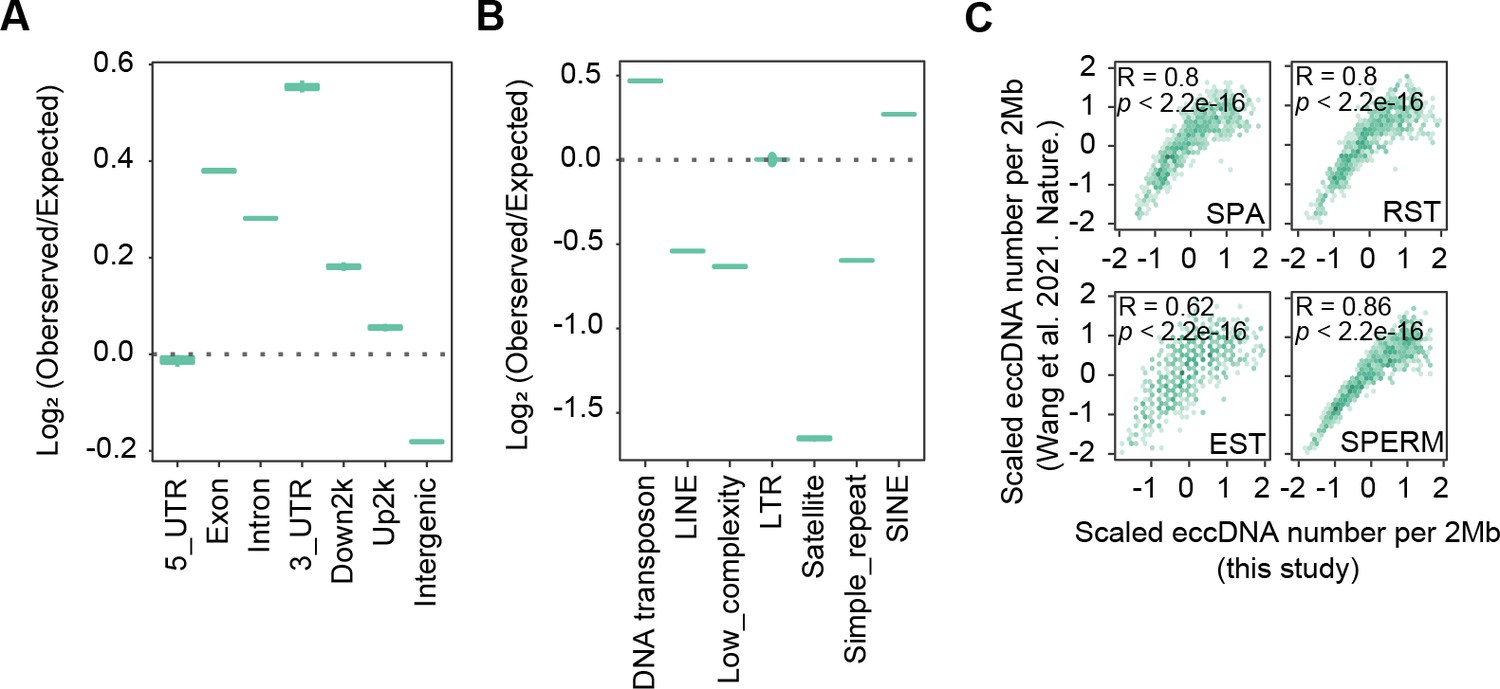
High similarity between sperm extrachromosomal circular DNAs (eccDNAs) detected in this study and those from apoptotic DNA fragmentation reported previously.
(A) Enrichment of eccDNAs reported in Wang et al., 2021a at given genomic regions relative to randomly selected control regions. (B) Enrichment of eccDNAs reported in Wang et al., 2021a at given repeat elements relative to randomly selected control regions. (C) eccDNA numbers per 2 Mb region in this study as a function of eccDNA numbers per 2 Mb reported in Wang et al., 2021a.
Figure 4—figure supplement 2
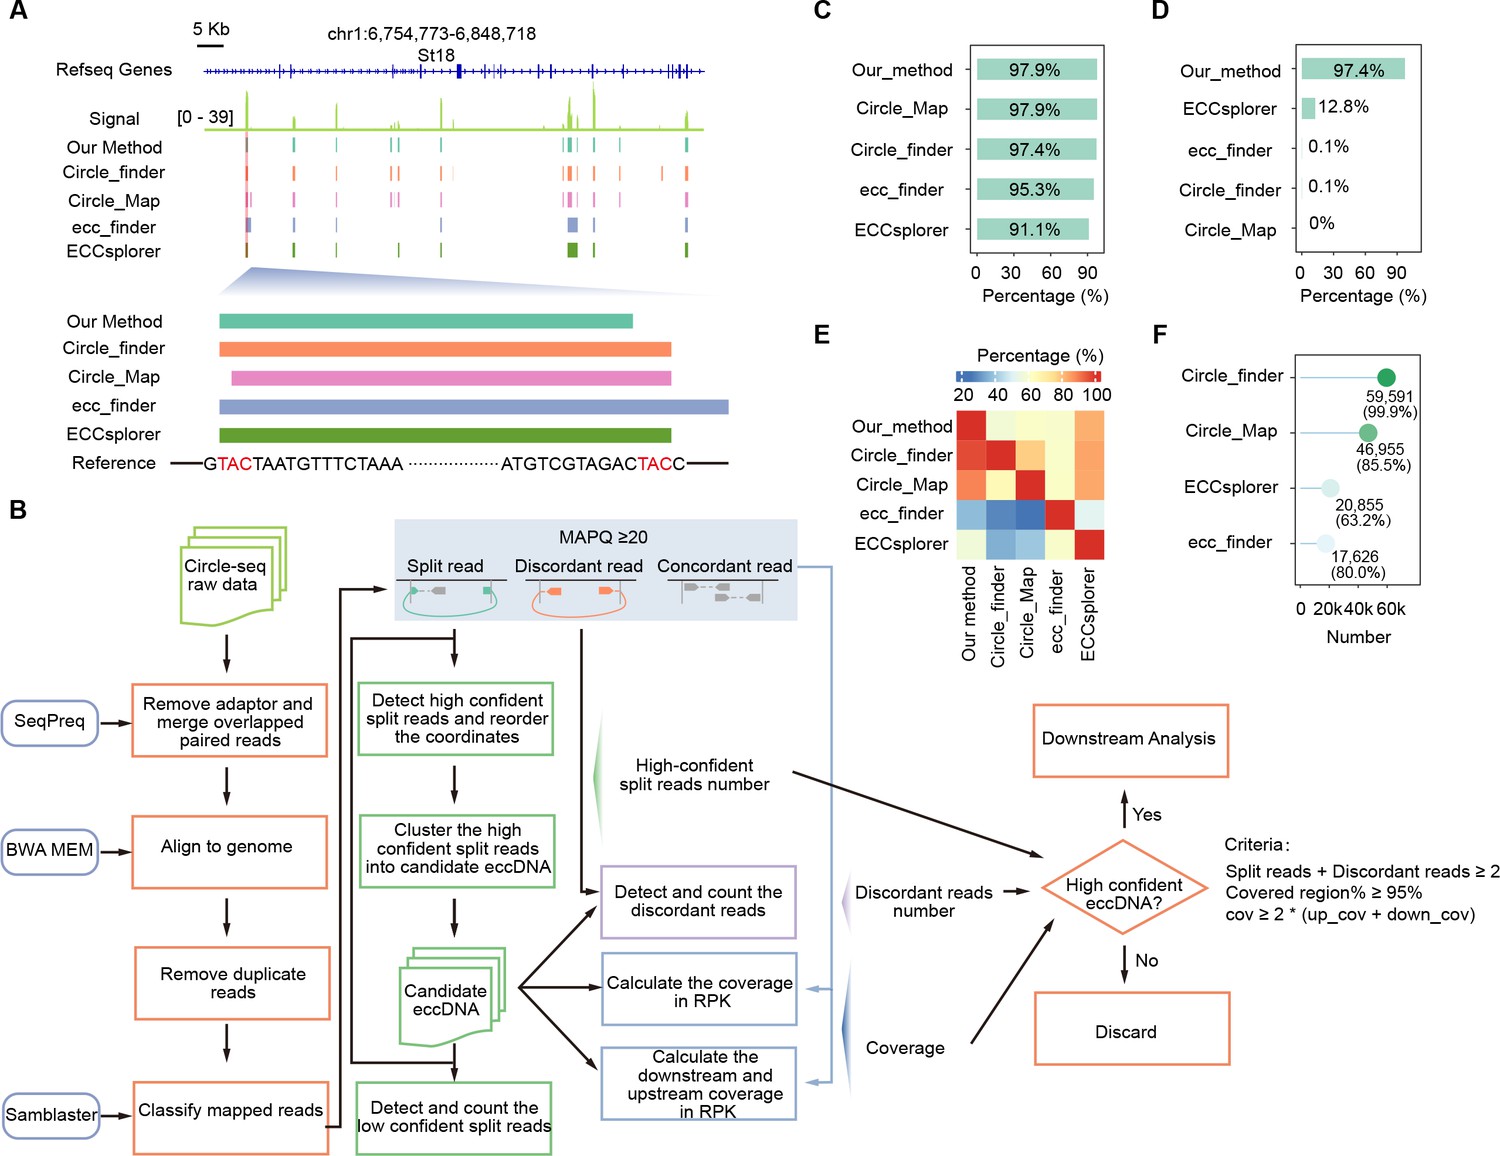
Evaluation of our nucleotide-resolution extrachromosomal circular DNA (eccDNA) detection method.
(A) A representative genomic locus showing Circle-seq signals and eccDNAs detected by individual methods. Enlarged are the first eccDNA as well as its sequence information. Homologous sequences (TAC) at the eccDNA end are highlighted in red. (B) Schematic representation of our eccDNA detection pipeline. (C) Percentages of simulated eccDNA regions correctly detected by different methods. (D) Percentages of eccDNA breakpoints correctly assigned by different methods. (E) Percentages of eccDNAs detected by individual methods (x-axis) that were co-detected by other methods (y-axis). (F) Numbers and percentages of eccDNA breakpoints misassigned by different methods.
Figure 5 with 1 supplement

The biogenesis mechanism of germline extrachromosomal circular DNAs (eccDNAs) is conserved between human and mouse.
(A) Size distribution of sperm eccDNAs in two biological replicates. (B) GC contents of sperm eccDNAs, regions upstream and downstream of eccDNAs, and randomly selected length-matched control regions. ***Two-sided Wilcoxon test p-value<0.001. (C) Predicted probability of nucleosome occupancy for eccDNA and randomly selected length-matched control regions (highlighted by red-shaded area), and surrounding regions. Boxplots showing the probability distribution of individual eccDNAs and control regions. ***Two-sided Wilcoxon test p-value<0.001. (D) Numbers of eccDNAs or randomly selected control regions overlapped with recombination hotspots in human. eccDNAs located completely within a hotspot (Intra-), or with both ends overlapped with two different hotspots (Inter-) are shown separately. (E) Shown are numbers of human sperm eccDNAs or randomly selected control regions having 95% reciprocal overlap with different types of structural variations. (F) Percentages of homologous sequences of different lengths (coded by different color saturation levels) are shown for eccDNAs and randomly selected control regions. (G) Length of microhomologous sequences as a function of the eccDNA size. Data points are shown as median plus lower (25%) and upper (75%) quartiles. The shaded area is 95% confidence interval of linear regression line. Pearson correlation coefficient and two-sided t-test p-value are indicated.
Figure 5—figure supplement 1
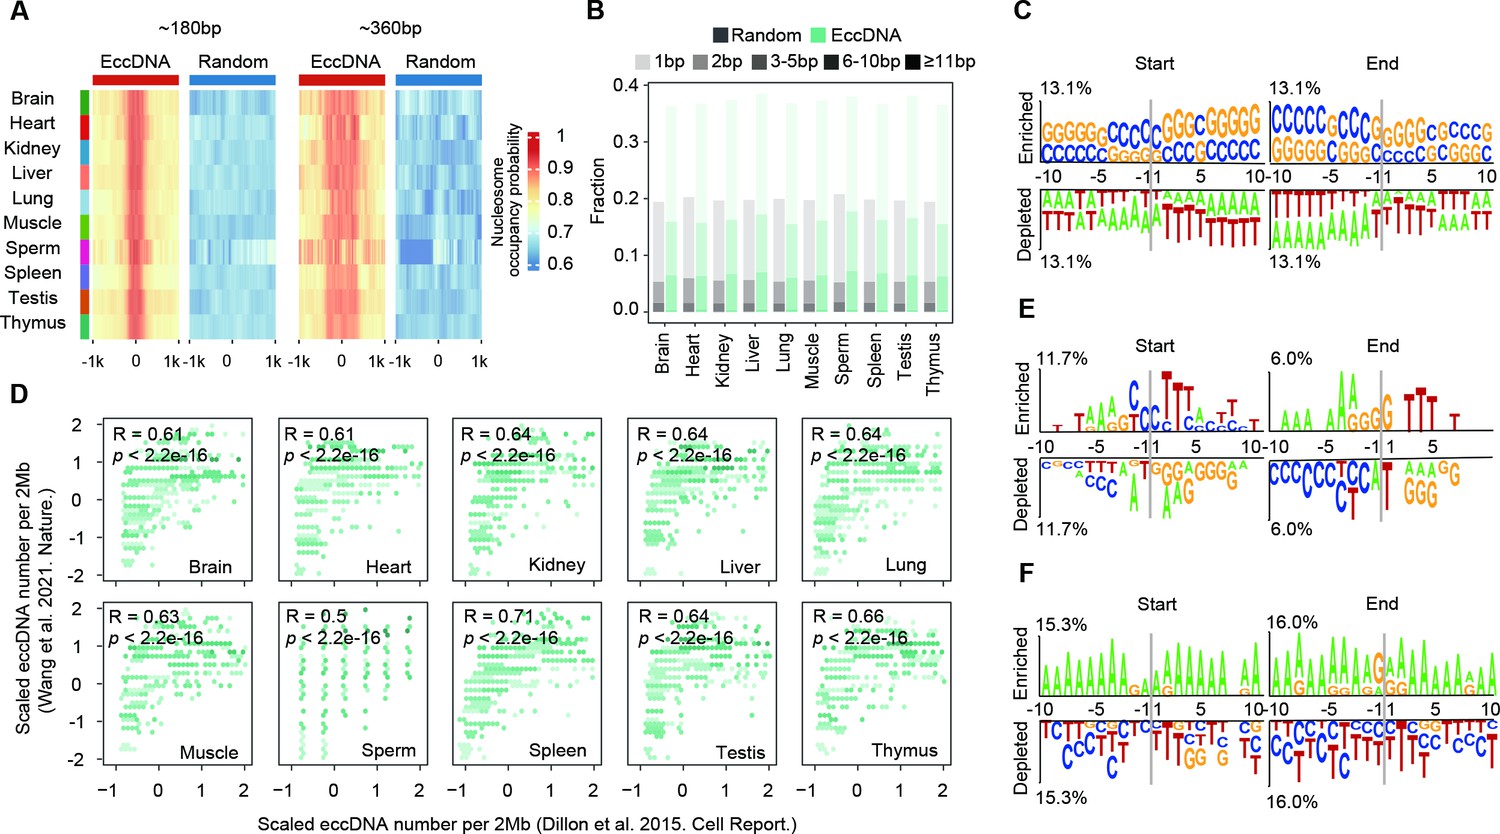
Biogenesis mechanism of extrachromosomal circular DNAs (eccDNAs) in mouse somatic tissues and human sperms.
(A) Predicted probabilities of nucleosome occupancy for ~180 bp and ~360 bp eccDNAs in various mouse tissues. (B) Percentages of homologous sequences of different lengths (coded by different color saturation levels) are shown for eccDNAs and randomly selected control regions. (C) Sequencing motif analysis for ±10 bp leftmost left ends and ±10 bp leftmost right ends of eccDNAs with no perfectly matched homologous sequences observed. (D) eccDNA numbers per 2 Mb region in this study as a function of eccDNA numbers per 2 Mb reported in Wang et al., 2021a. (E, F) Sequencing motif analysis for ±10 bp leftmost left ends and ±10 bp leftmost right ends of eccDNAs reported in Henriksen et al., 2022 (E) and Mouakkad-Montoya et al., 2021 (F).
Additional files
Download links
A two-part list of links to download the article, or parts of the article, in various formats.
Downloads (link to download the article as PDF)
Open citations (links to open the citations from this article in various online reference manager services)
Cite this article (links to download the citations from this article in formats compatible with various reference manager tools)
Microhomology-mediated circular DNA formation from oligonucleosomal fragments during spermatogenesis
eLife 12:RP87115.
https://doi.org/10.7554/eLife.87115.3


