An acute microglial metabolic response controls metabolism and improves memory
- Department of Epigenetics, Van Andel Research Institute, United States
- Max Planck Institute of Immunobiology and Epigenetics, Germany
- Department of Metabolism and Nutritional Programming, Van Andel Research Institute, United States
- Metabolomics and Bioenergetics Core, Van Andel Institute, United States
- Department of Neurodegenerative Sciences, Van Andel Research Institute, United States
- Institute of Neuropathology, Medical Faculty, University of Freiburg, Germany
- Department of Medicine II, University Hospital Freiburg, Germany
- Centre for NeuroModulation (NeuroModBasics), University of Freiburg, Germany
- Signaling Research Centers BIOSS and CIBSS, University of Freiburg, Germany
Figures
Figure 1 with 2 supplements
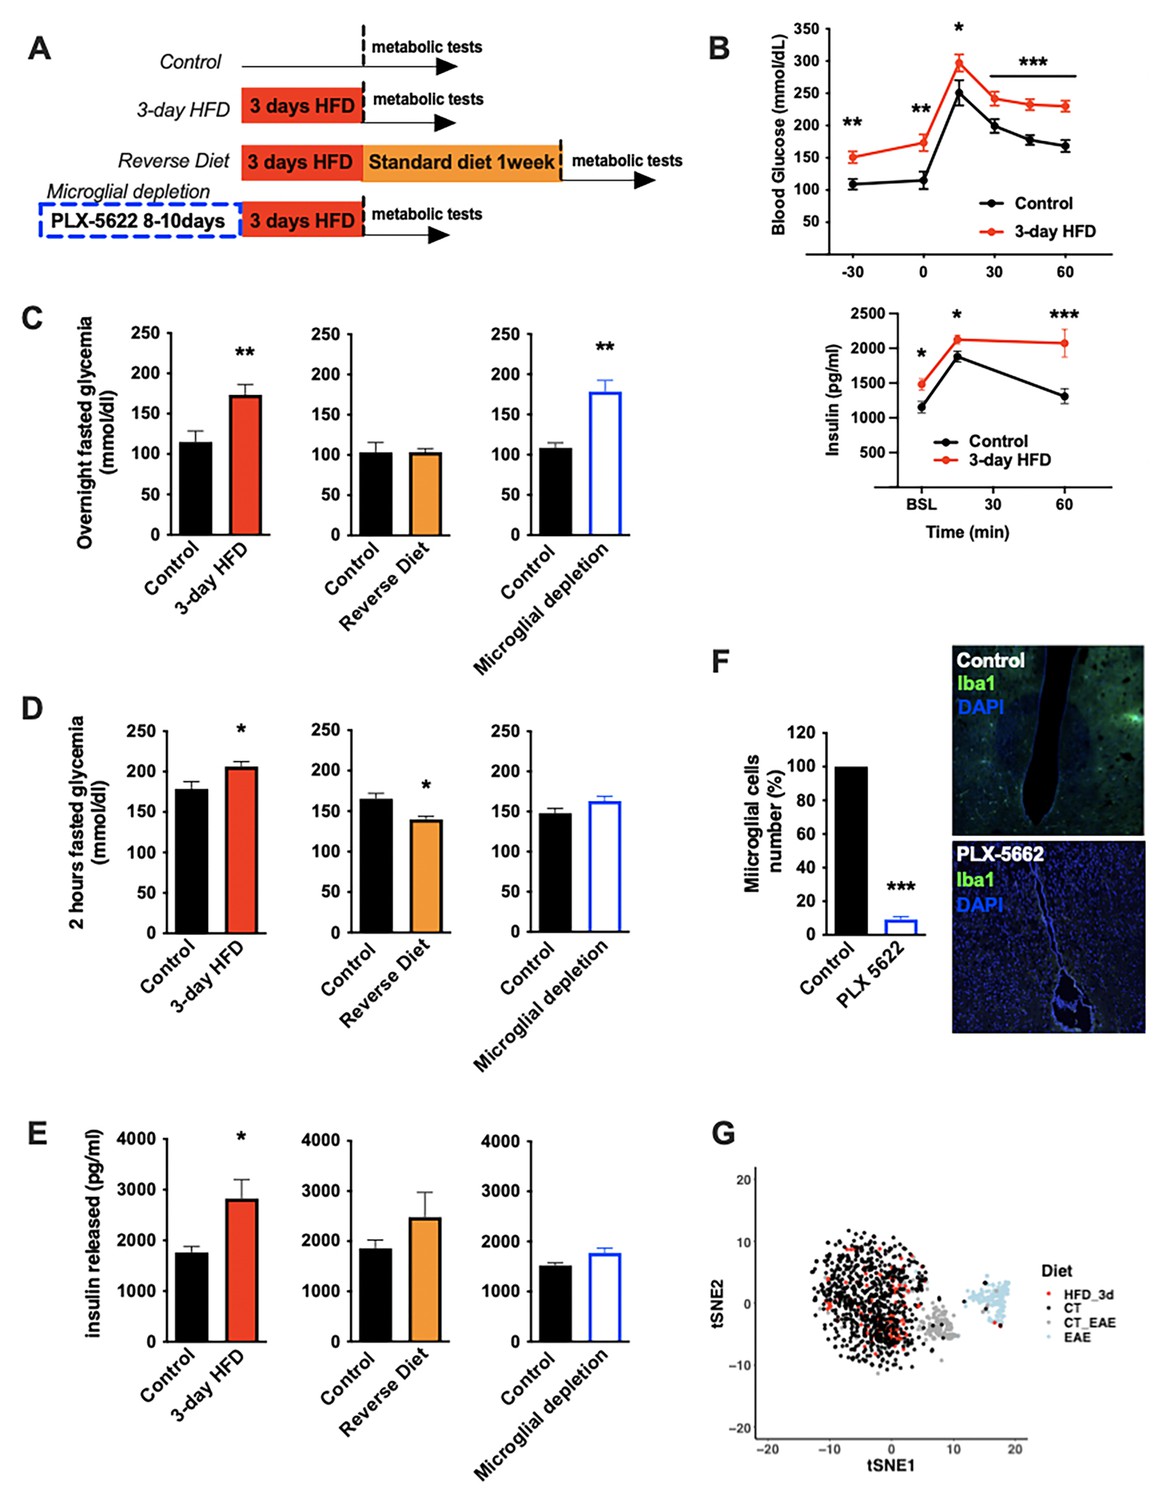
Acute HFD-induced metabolic changes are microglia dependent.
(A) Schematic depicting the different treatments and diets followed by the mice groups. (B) Graphs showing the glucose tolerance test (OGTT) and the associated-insulin kinetic of C57Bl6/J male fed with control diet (Control) or fed with high-fat diet for 3 days (3-day HFD) (n=8). (C) Graph showing the overnight fasted glycemia from the mice groups depicting in (A). Schematic (n=5–11). (D) Graph showing the 2 hr fasted glycemia from the mice groups depicting in (A). Schematic (n=5–11). (E) Graph showing the insulin released after a glucose gavage from the mice groups depicting in (A). Schematic (n=5–11). (F) Microglial cells staining with Iba1 (green) in the brain slices from mice fed with 3 days HFD or mice depleted from their microglial cells with 1 week control diet complexed with PLX-5662 prior the 3 days HFD (PLX-5662) (n=5). (G) Single-cell RNA-sequencing (scRNAseq) data from hypothalamic microglial cells harvested from C57bl6/J male mice fed with control diet (CT) and high-fat diet for 3 days (HFD_3d) (n=5) merged with scRNAseq microglia dataset from mice presenting an experimental autoimmune encephalomyelitis (EAE). Data are presented as mean ± SEM. *p<0.05, **p<0.01, ***p<0.001 as determined by two-tailed Student’s t-test and two-way ANOVA followed by Bonferroni post hoc test.
Figure 1—figure supplement 1
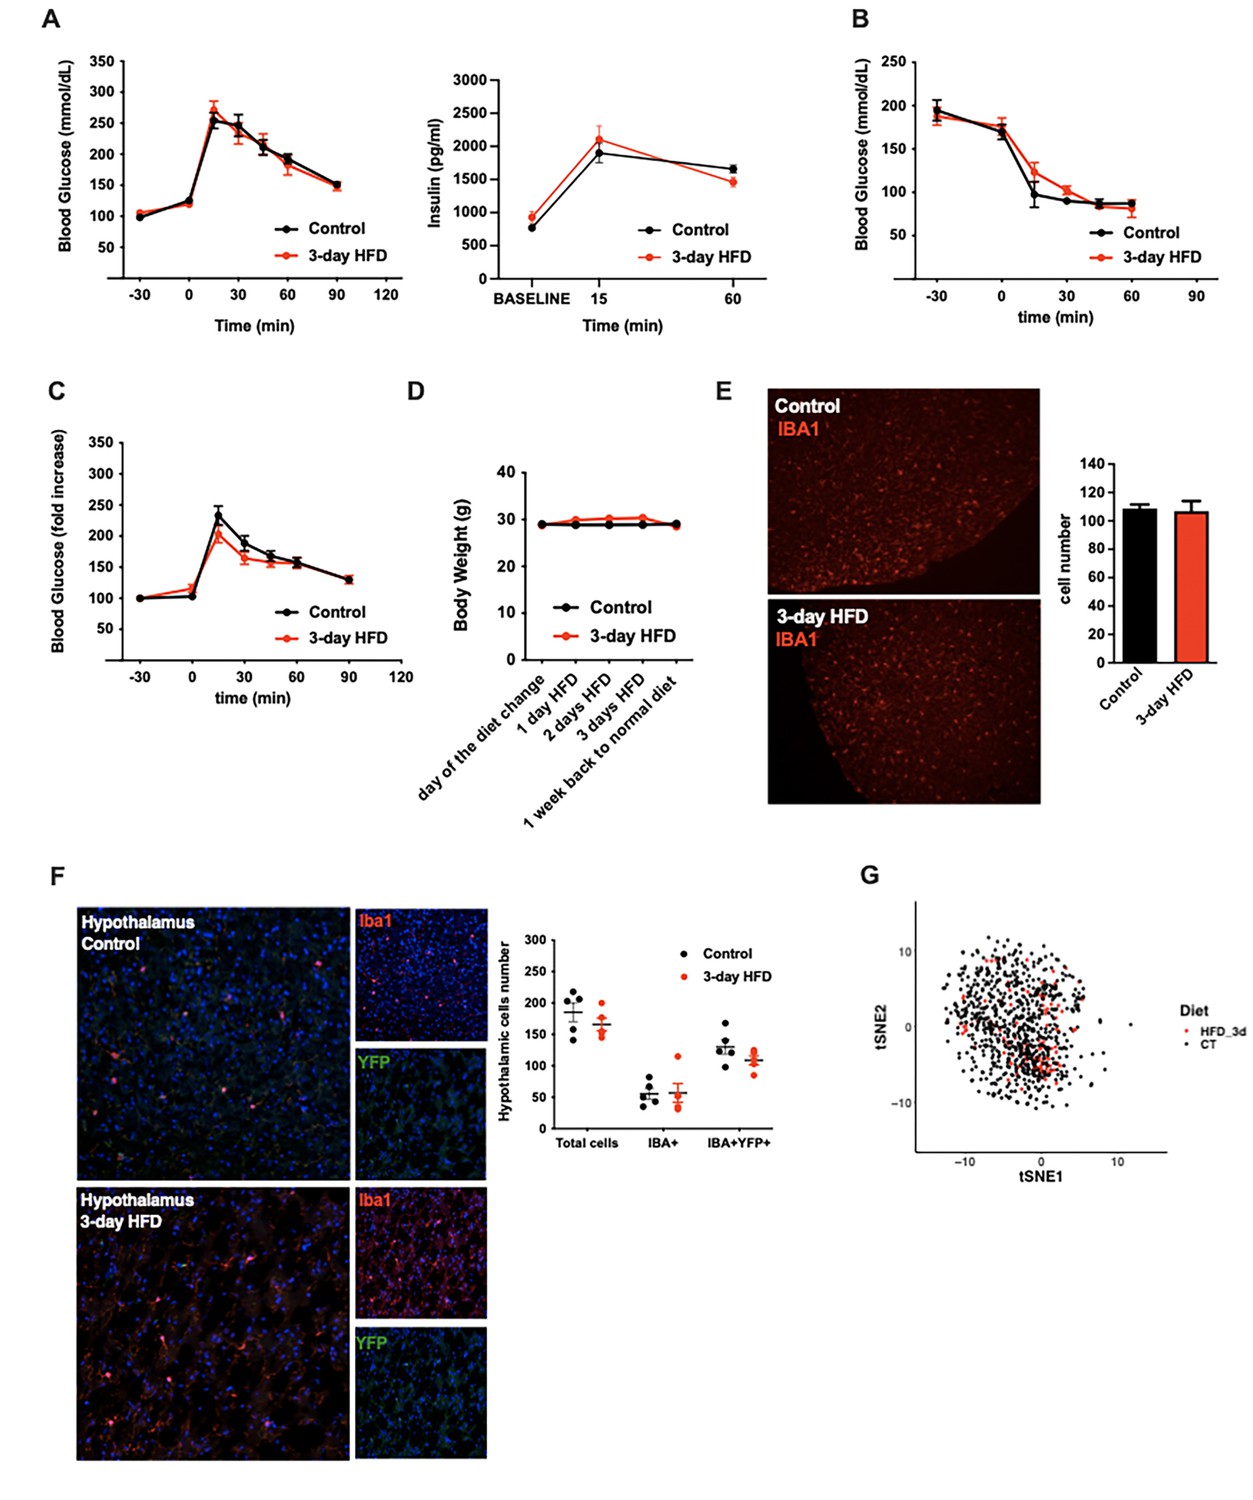
Acute HFD-induced metabolic changes are microglia dependent (supplement).
(A) Graphs showing the glucose tolerance test (OGTT) and the associated-insulin kinetic of C57Bl6/J male before keeping them with a control diet (Control) or before feeding them with high-fat diet for 3 days (3-day HFD) (n=8). (B) Graph showing the insulin tolerance test (ITT) of C57Bl6/J male before keeping them with a control diet (Control) or before feeding them with 3 day HFD (n=5). (C) Graphs showing the glucose tolerance test (OGTT) expressed in percentage from the basal glycemia of C57Bl6/J male fed with a control diet (Control) or fed with 3-day HFD (n=8). (D) Graph showing the body weight evolution between C57Bl6/J male fed with control diet (Control) or fed with 3-day HFD, before and after the diet change (n=7). (E) IBA1 immunostaining on hypothalamic slices from C57Bl6/J male fed with control diet (Control) or fed with 3-day HFD and its quantification (n=10). (F) IBA1 and YFP immunostaining on hypothalamic slices from Cx3cr1creERT2-Rosa26YFP mice fed with control diet or 3 day HFD (n=5). (G) sgRNAseq dataset from hypothalamic microglial cells harvested from C57bl6/J male mice fed with control diet (Control) and high-fat diet for 3 days (HFD_3d) (n=5). Data are presented as mean ± SEM. *p<0.05, **p<0.01, ***p<0.001 as determined by two-tailed Student’s t-test and two-way ANOVA followed by Bonferroni post hoc.
Figure 1—figure supplement 2
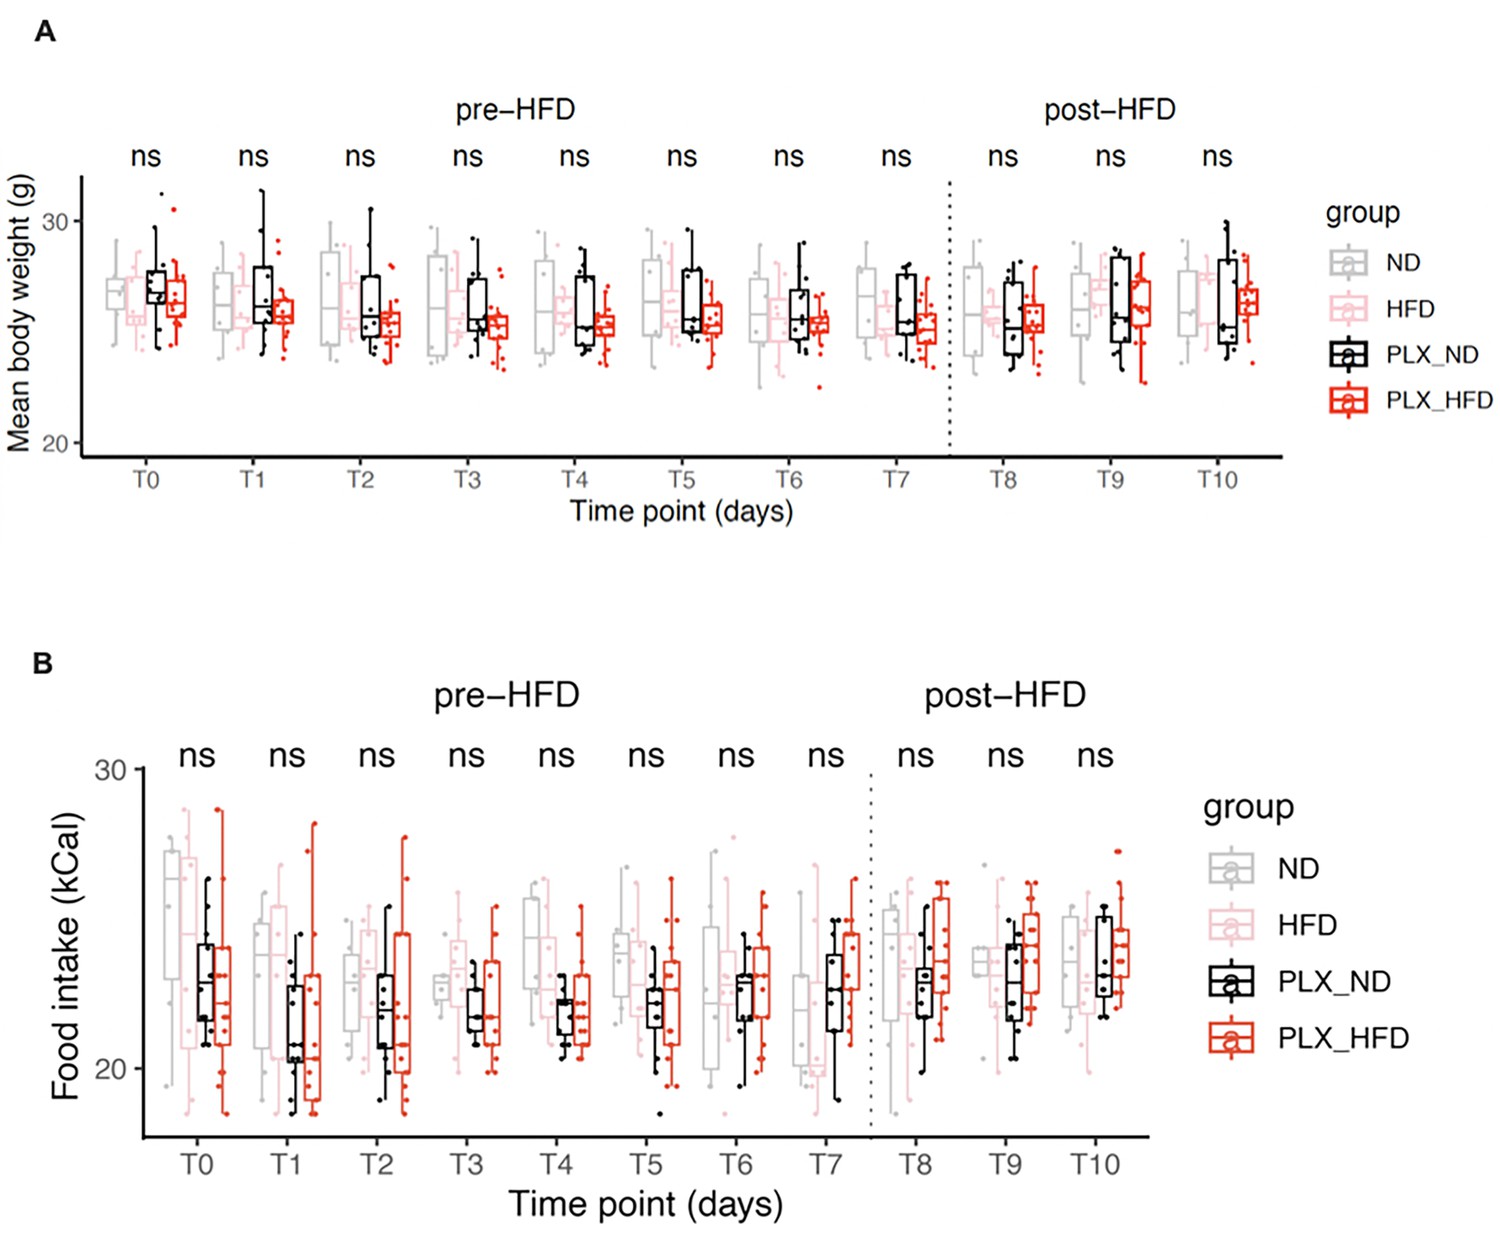
Microglia-ablating drug PLX-5622 treatment doesn't modify body weight gain or food intake.
(A) Graph showing the body weight evolution between mice fed with normal diet or control diet complexed with PLX-5662 for 7 days, prior the 3 days normal diet or 3 days HFD. The four groups are the following: Control diet (ND) (n=6), 3 days HFD (HFD) (n=8), 7-day-PLX-5662 then control diet (PLX-ND) (n=12), 7-day-PLX-5662 then 3-day HFD (PLX-HFD) (n=12). (B) Graph showing the food intake evolution between mice fed with normal diet or control diet complexed with PLX-5662 for 7 days, prior the 3 days normal diet or 3 days HFD. The four groups are the following: Control diet (ND) (n=6), 3 days HFD (HFD) (n=8), 7-day-PLX-5662 then control diet (PLX-ND) (n=12), 7-day-PLX-5662 then 3-day HFD (PLX-HFD) (n=12).
Figure 2 with 1 supplement
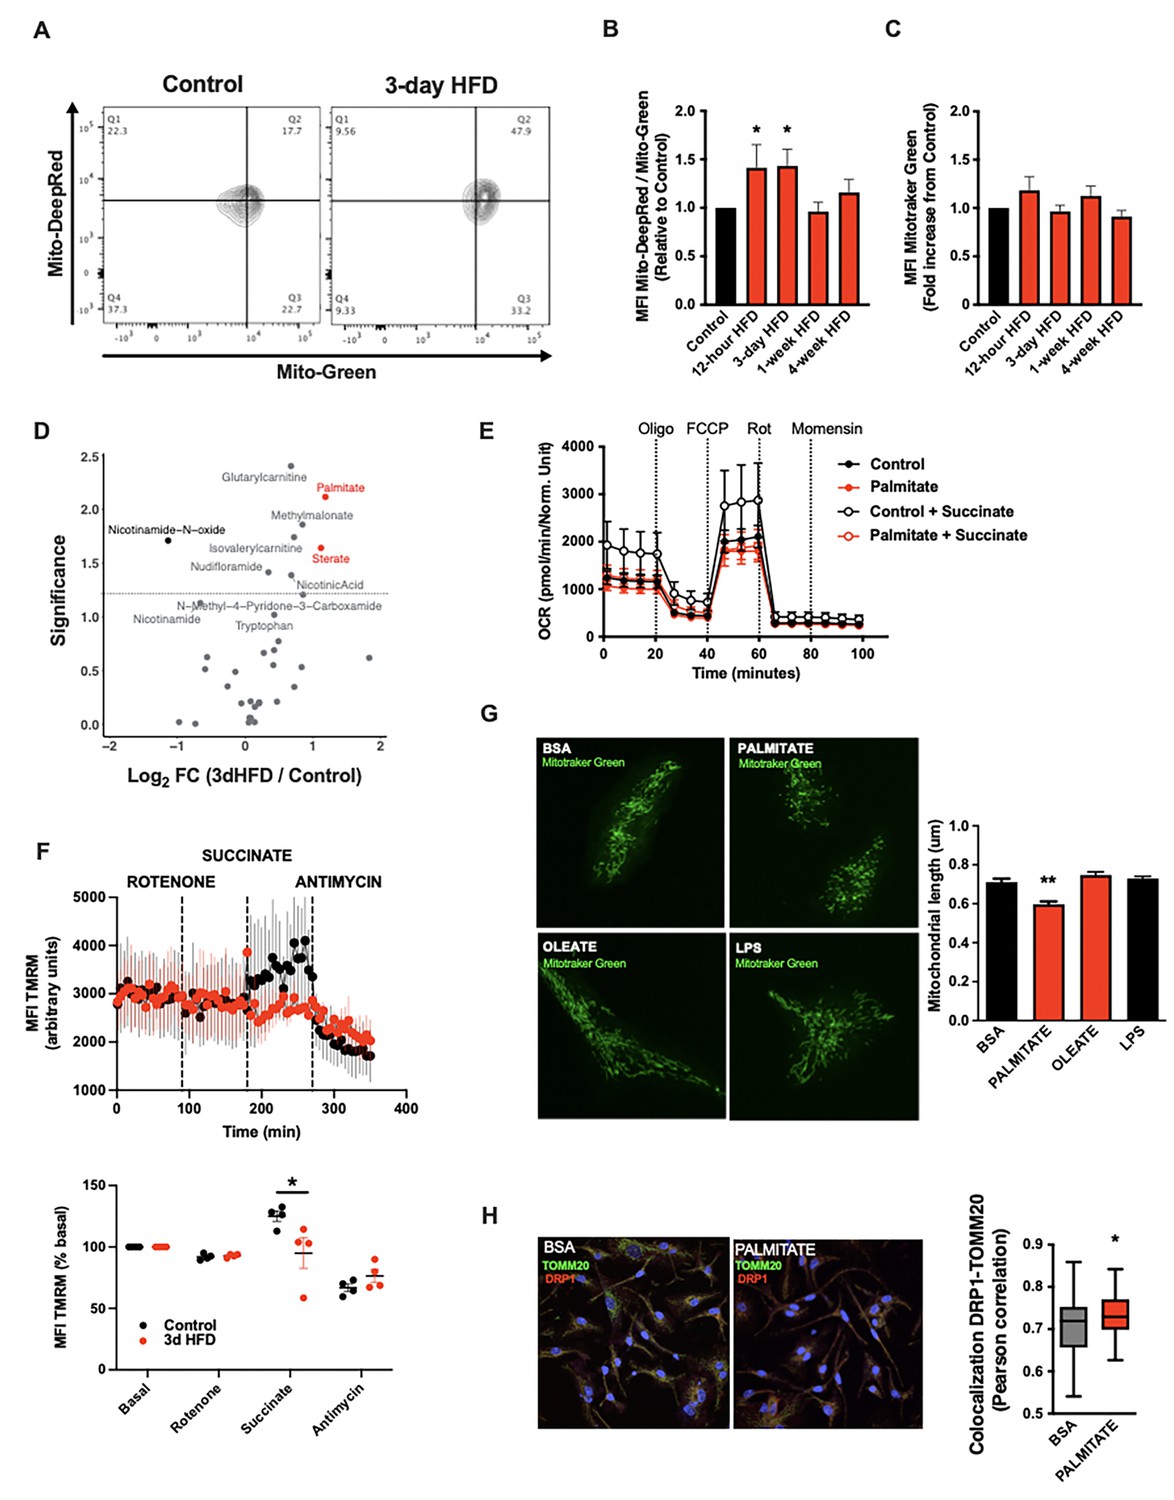
A rapid microglial mitochondria response to high-fat diet.
(A) FACS plots depicting the ratio MitoTracker Deep Red/ MitoTracker Green from sorted microglial cells of C57Bl6/J male fed with a control diet (Control) or fed with high-fat diet for 3 days (3-day HFD). (B) Graph showing the ratio MitoTracker Deep Red/ MitoTracker Green from sorted hypothalamic microglial cells of C57Bl6/J male fed with a control diet (Control) or fed with high-fat diet for 12 hr, 3 days or 1–4 weeks (n=5–12). (C) Graph showing the MitoTracker Green fluorescence from sorted hypothalamic microglial cells of C57Bl6/J male fed with a control diet (Control) or fed with high-fat diet for 12 hr, 3 days or 1–4 weeks (n=5–12). (D) Volcano plot showing the metabolites content of cerebrospinal fluid from C57Bl6/J male fed with a control diet (Control) or fed with high-fat diet for 3 days (n=10). (E) Seahorse (±succinate added in the media during the experiment) on primary microglia challenged for 24 hr with BSA (control) or palmitate (experiment replicated three times). (F) Mitochondrial electron transport chain activity recorded with FACS after TMRM staining from sorted microglial cells of C57Bl6/J male fed with a control diet (Control) or fed with high-fat diet for 3 days (n=5). (G) Mitochondrial networks from primary microglia stained with MitoTracker Green after being challenged for 24 hr with BSA (control), palmitate, oleate, or LPS (n=40) and the mitochondrial length quantification graphs. (H) DRP1 colocalization with the mitochondrial network stained with TOMM20 on primary microglial cell after being challenged for 24 hr with BSA (control) and palmitate (n=40) and the colocalization quantification graphs. Data are presented as mean ± SEM. *p<0.05, **p<0.01, ***p<0.001 as determined by two-tailed Student’s t-test and two-way ANOVA followed by Bonferroni post hoc test.
Figure 2—figure supplement 1
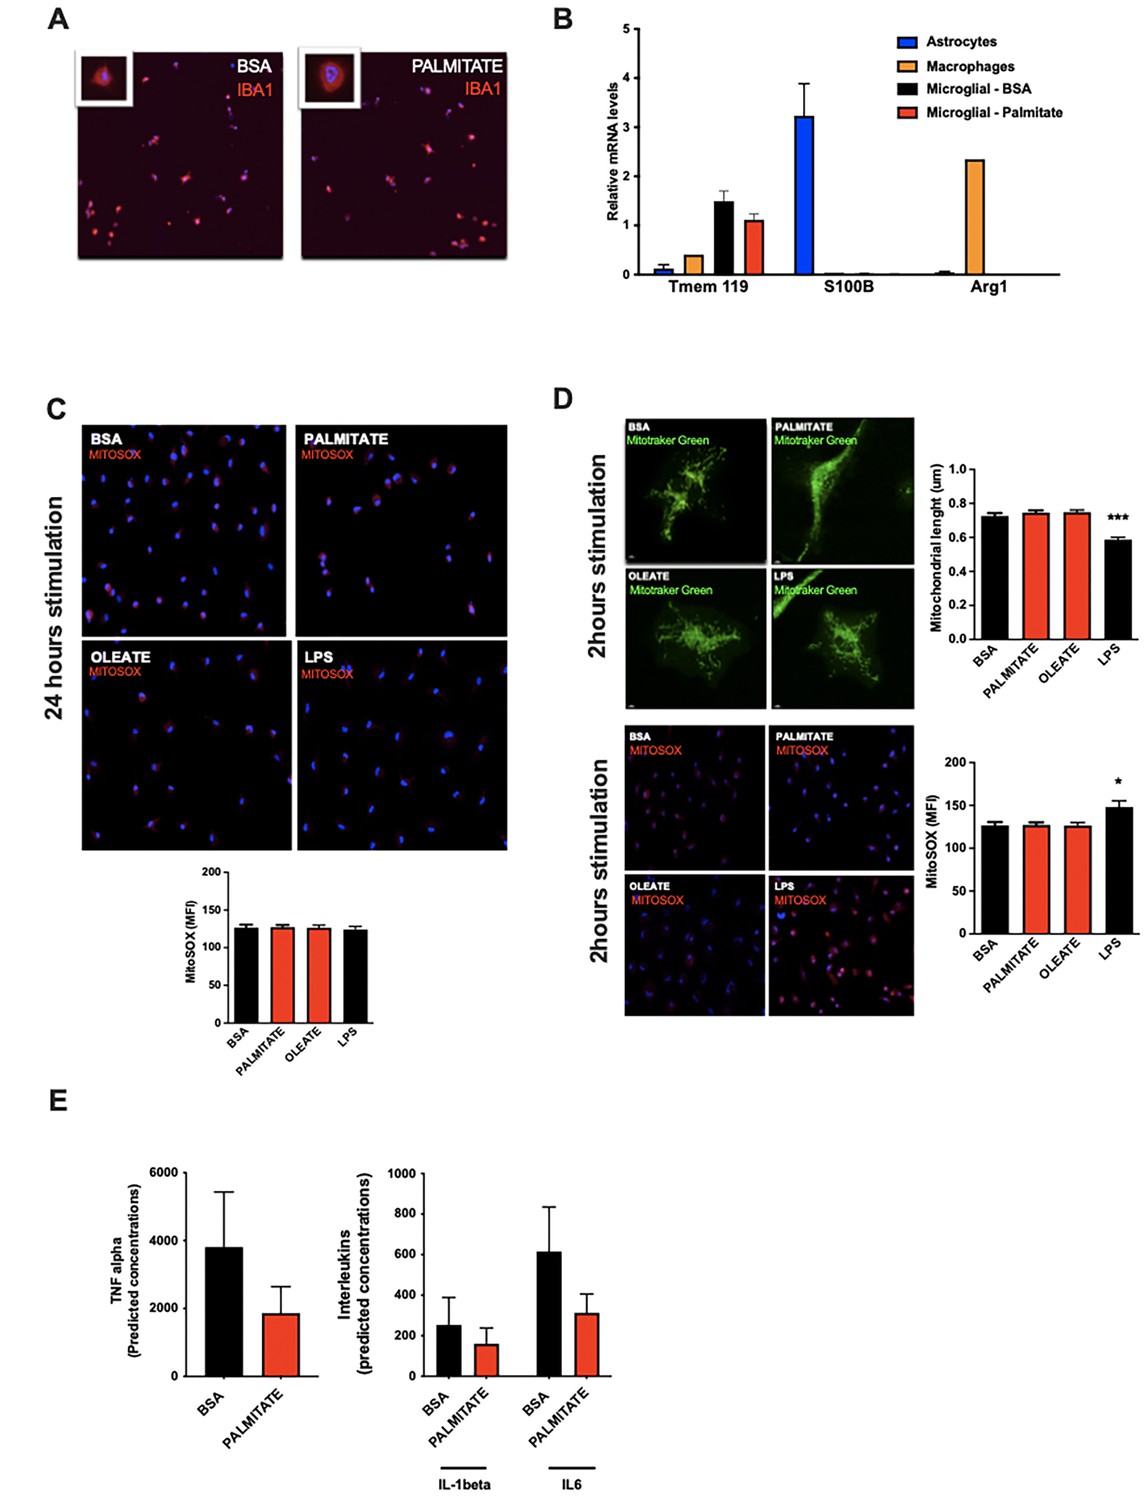
A rapid microglial mitochondria response to high-fat diet (supplement).
(A) IBA1 immunostaining of primary microglial cells treated with BSA (control) or palmitate for 24 hr. (B) Graph showing mRNA expression of microglial marker (TMEM119) or astrocytes marker (S100B) or macrophages marker (Arg1) in primary microglial culture challenged for 24 hr with BSA or palmitate. Primary culture of astrocytes and macrophages were used as positive controls. (C) MitoSOX staining of primary microglial cells after being challenged for 24 hr with BSA (control), palmitate, oleate, or LPS (n=10) and the MitoSOX quantification graph. (D) Mitochondrial networks from primary microglia stained with MitoTracker Green and stained with MitoSOX after being challenged for 2 hr with BSA (control), palmitate, oleate, or LPS (n=40) and the mitochondrial length as well as the MitoSOX quantification graphs. (E) Interleukins concentrations (TNFalpha, IL-1beta, IL6) in the primary microglial cells media after being challenged for 24 hr with BSA or palmitate (n=7). Data are presented as mean ± SEM. *p<0.05, **p<0.01, ***p<0.001 as determined by two-tailed Student’s t-test and two-way ANOVA followed by Bonferroni post hoc.
Figure 3 with 1 supplement
Acute microglial metabolic response (aMMR) is required for diet-induced homeostatic rewiring in vivo.
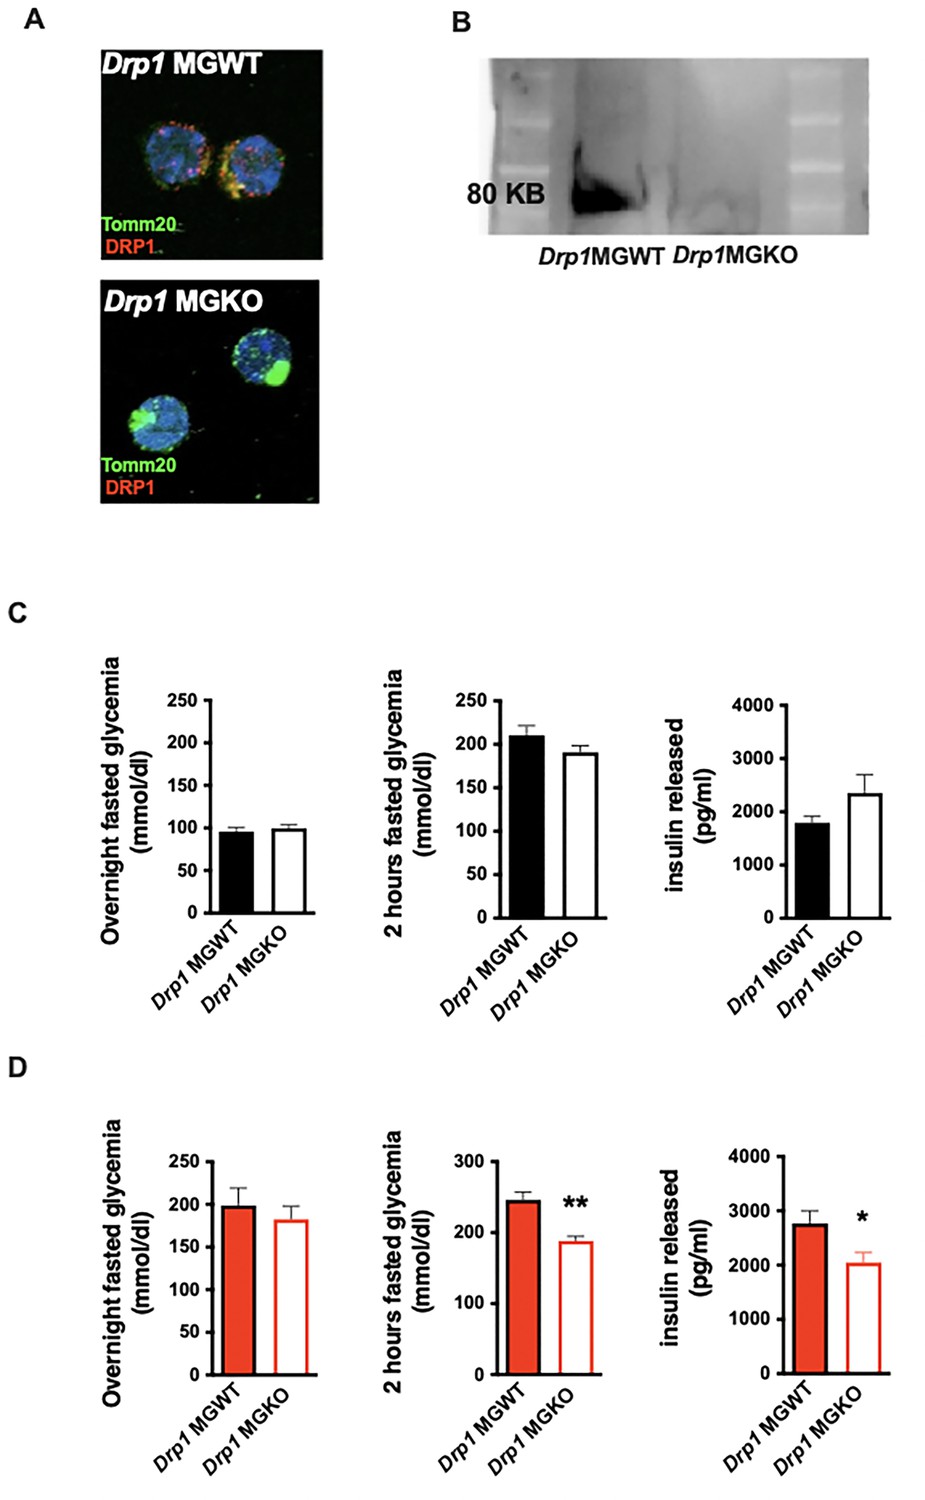
(A) Immunostaining of TOMM20 and DRP1 on sorted microglia from mice Drp1MGWT or Drp1MGKO. (B) Western blot against DRP1 on sorted microglia from mice Drp1MGWT or Drp1MGKO. (C) Graphs showing the overnight fasted glycemia, the 2 hr fasted glycemia, and the insulin released from Drp1MGWT or Drp1MGKO fed with control diet (n=5–11). (D) Graphs showing the overnight fasted glycemia, the 2 hr fasted glycemia, and the insulin released from Drp1MGWT or Drp1MGKO fed with 3-day high-fat diet (n=5–11). Data are presented as mean ± SEM. *p<0.05, **p<0.01, ***p<0.001 as determined by two-tailed Student’s t-test and two-way ANOVA followed by Bonferroni post hoc test.
-
Figure 3—source data 1
Original uncropped image for Figure 3B.
- https://cdn.elifesciences.org/articles/87120/elife-87120-fig3-data1-v1.jpg
-
Figure 3—source data 2
Labelled uncropped image for Figure 3B.
- https://cdn.elifesciences.org/articles/87120/elife-87120-fig3-data2-v1.pdf
Figure 3—figure supplement 1
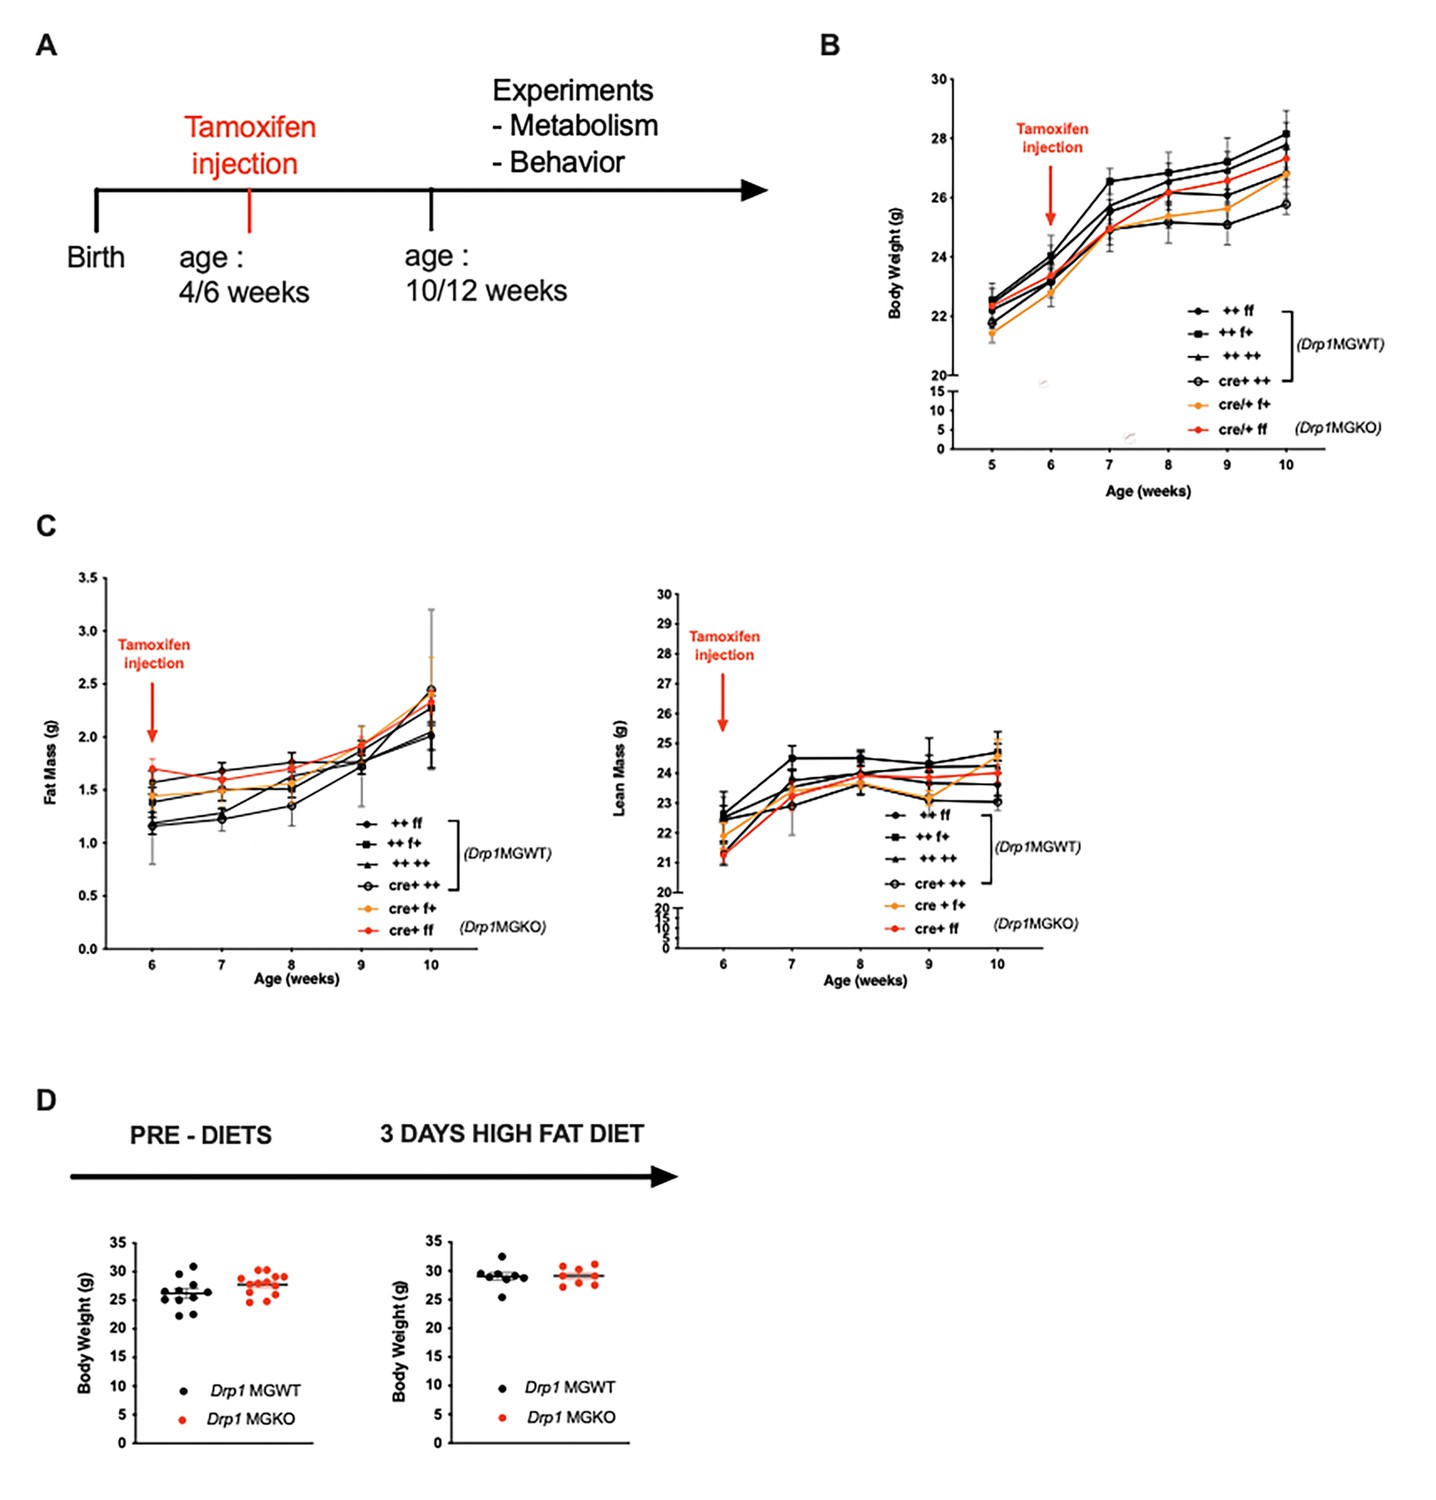
Acute microglial metabolic response (aMMR) is required for diet-induced homeostatic rewiring in vivo (supplement).
(A) Schematic depicting the timeline for the tamoxifen injection and the experiments performed on Drp1MGWT or Drp1MGKO. (B) Graph showing the body weight evolution among all the Drp1MGKO genotypes after the tamoxifen injection (n=6–11). (C) Graphs showing the fat mass and lean mass evolution among all the Drp1MGKO genotypes after the tamoxifen injection (n=6–11). (D) Graphs showing the body weight before and after the 3-day high-fat diet (HFD) for the mice Drp1MGWT and Drp1MGKO (n=11–13). Data are presented as mean ± SEM. *p<0.05, **p<0.01, ***p<0.001 as determined by two-tailed Student’s t-test and two-way ANOVA followed by Bonferroni post hoc.
Figure 4 with 1 supplement
Palmitate induces a novel microglial lactate/succinate/itaconate release pathway.
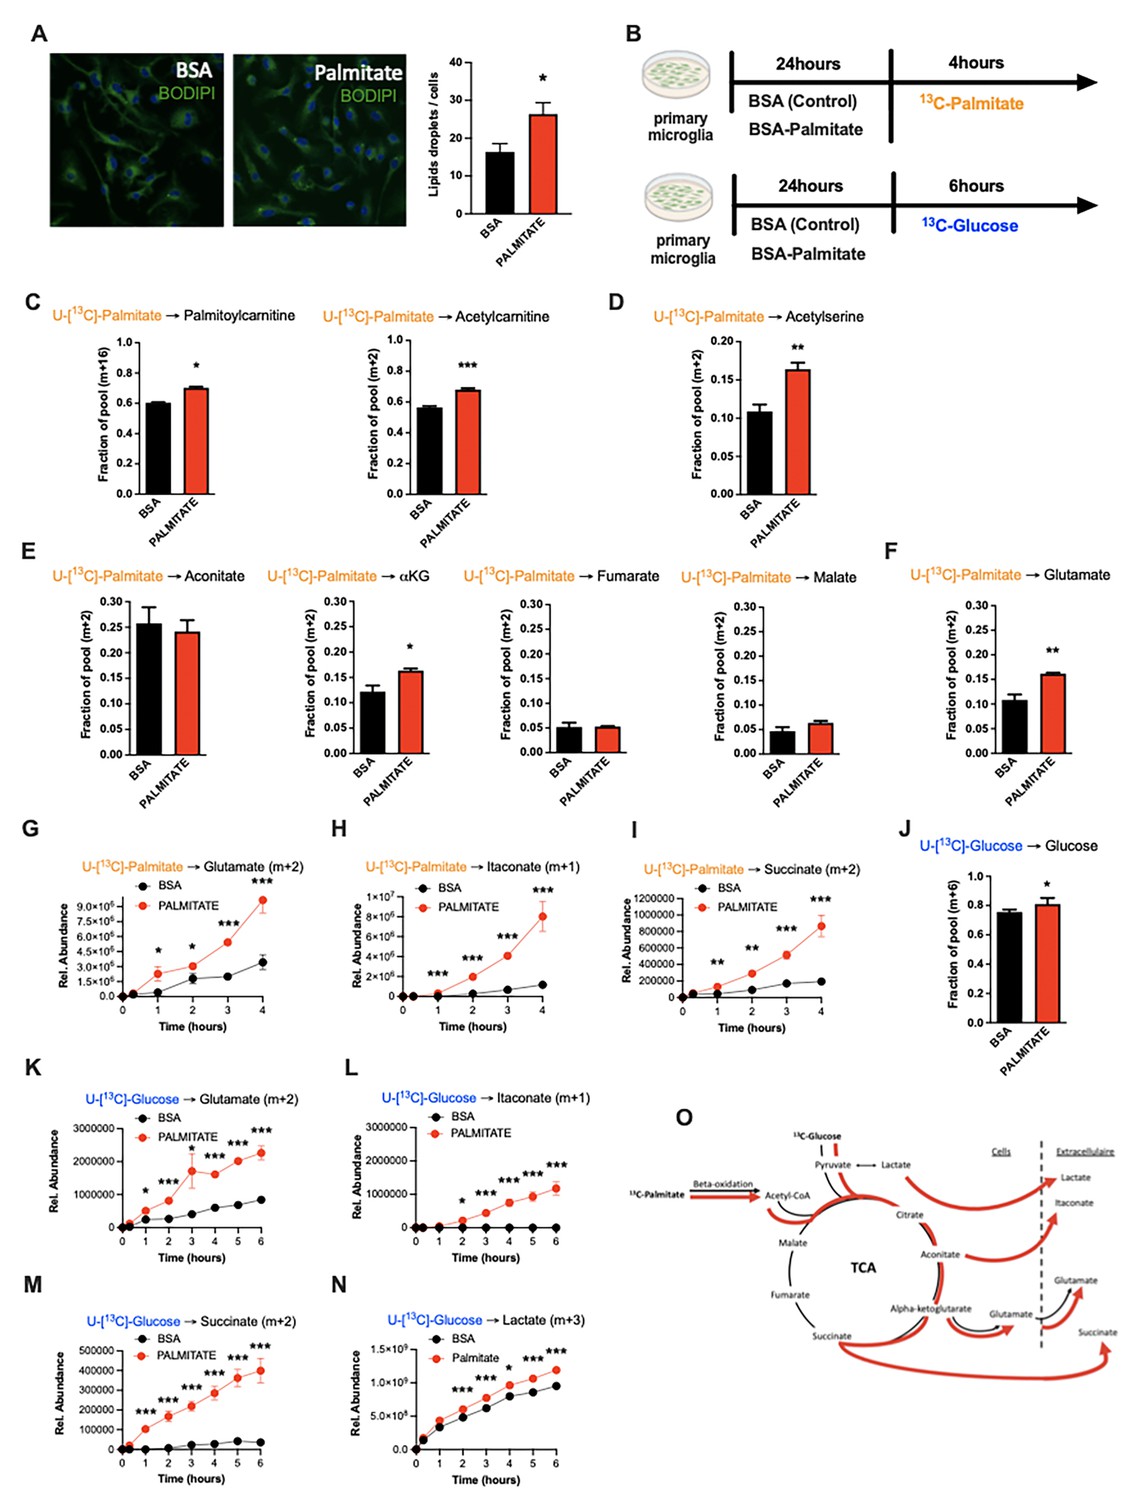
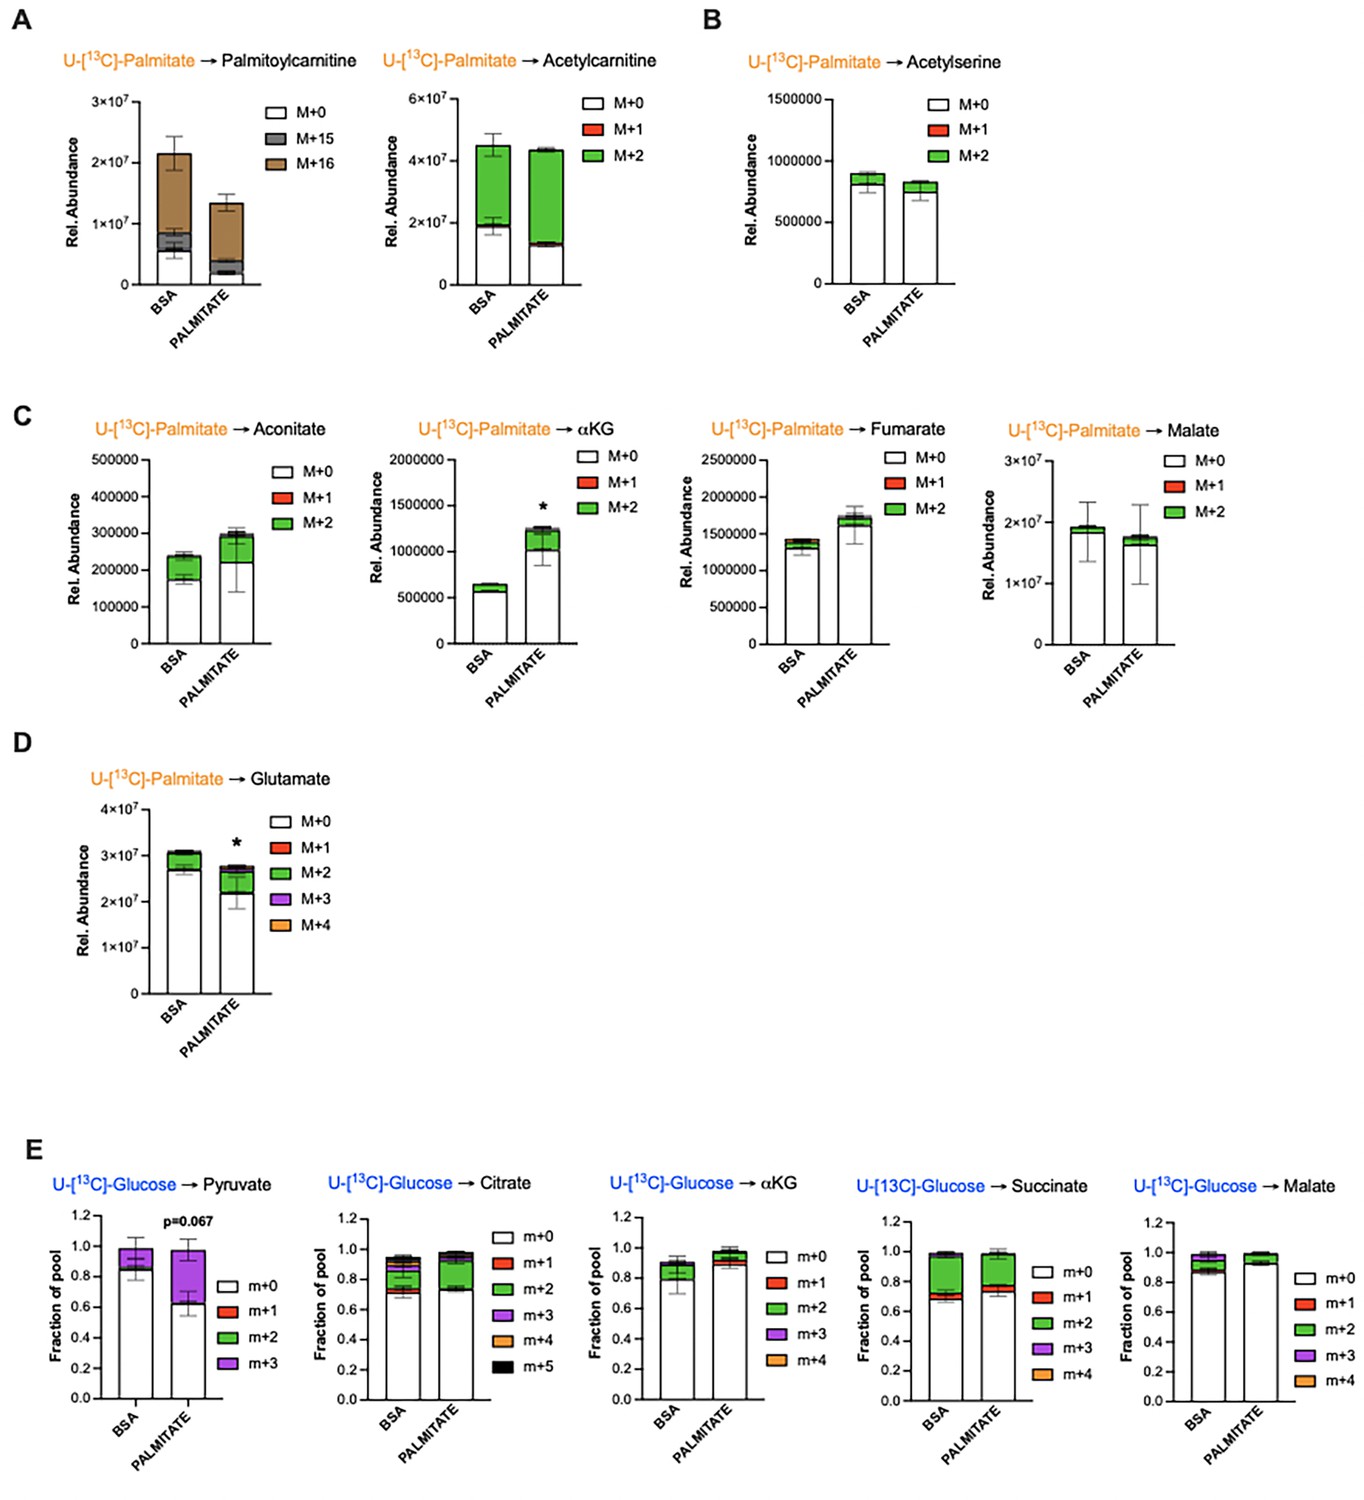
(A) BODIPY staining on primary microglia challenged for 24 hr with BSA or palmitate and the lipid droplets quantification graph (n=20). (B) Schematic depicting the timeline for the tracing experiments (13C-palmitate or 13C-glucose) on primary microglial challenged for 24 hr with BSA or palmitate. (C) 13C-palmitate incorporation into palmitoylcarnitine (m+16) and acetylcarnitine (m+2) after 4 hr tracing experiment on primary microglia pretreated for 24 hr with BSA or palmitate (n=3). (D) 13C-palmitate incorporation into acetyl serine (m+2) after 4 hr tracing experiment on primary microglia pretreated for 24 hr with BSA or palmitate (n=3). (E) 13C-palmitate incorporation into aconitate, alpha-ketoglutarate, fumarate, malate (m+2) after 4 hr tracing experiment on primary microglia pretreated for 24 hr with BSA or palmitate (n=3). (F) 13C-palmitate incorporation into glutamate (m+2) after 4 hr tracing experiment on primary microglia pretreated for 24 hr with BSA or palmitate (n=3). (G) 13C-palmitate incorporation into glutamate (m+2) released during the 4 hr tracing experiment by primary microglia pretreated for 24 hr with BSA or palmitate (n=3). The results are graphed in relative abundance. (H) 13C-palmitate incorporation into itaconate (m+1) released during the 4 hr tracing experiment by primary microglia pretreated for 24 hr with BSA or palmitate (n=3). The results are graphed in relative abundance. (I) 13C-palmitate incorporation into succinate (m+2) released during the 4 hr tracing experiment by primary microglia pretreated for 24 hr with BSA or palmitate (n=3). The results are graphed in relative abundance. (J) 13C-glucose incorporation into the intracellular glucose pool (m+6) after 6 hr tracing experiment on primary microglia pretreated for 24 hr with BSA or palmitate (n=3). (K) 13C-glucose incorporation into glutamate (m+2) released during the 6 hr tracing experiment by primary microglia pretreated for 24 hr with BSA or palmitate (n=3). The results are graphed in relative abundance. (L) 13C-glucose incorporation into itaconate (m+1) released during the 6 hr tracing experiment by primary microglia pretreated for 24 hr with BSA or palmitate (n=3). The results are graphed in relative abundance. (M) 13C-glucose incorporation into succinate (m+2) released during the 6 hr tracing experiment by primary microglia pretreated for 24 hr with BSA or palmitate (n=3). The results are graphed in relative abundance. (N) 13C-glucose incorporation into lactate (m+3) released during the 6 hr tracing experiment by primary microglia pretreated for 24 hr with BSA or palmitate (n=3). The results are graphed in relative abundance. (O) Schematic depicting the metabolic pathways used by the primary microglial challenged for 24 hr with BSA (black arrow) or palmitate (red arrow) during the different tracing (13C-palmitate or 13C-glucose). Data are presented as mean ± SEM. *p<0.05, **p<0.01, ***p<0.001 as determined by two-tailed Student’s t-test and two-way ANOVA followed by Bonferroni post hoc test.
Figure 4—figure supplement 1
Palmitate induces a novel microglial lactate/succinate/itaconate release pathway (supplement).
(A) 13C-palmitate incorporation into palmitoylcarnitine and acetylcarnitine after 4 hr tracing experiment on primary microglia pretreated for 24 hr with BSA or palmitate (n=3). The results are graphed in relative abundance. (B) 13C-palmitate incorporation into acetyl-serine after 4 hr tracing experiment on primary microglia pretreated for 24 hr with BSA or palmitate (n=3). The results are graphed in relative abundance. (C) 13C-palmitate incorporation into aconitate, alpha-ketoglutarate, fumarate, malate after 4 hr tracing experiment on primary microglia pretreated for 24 hr with BSA or palmitate (n=3). The results are graphed in relative abundance. (D) 13C-palmitate incorporation into glutamate after 4 hr tracing experiment on primary microglia pretreated for 24 hr with BSA or palmitate (n=3). The results are graphed in relative abundance. (E) 13C-glucose incorporation into pyruvate, citrate, alpha-ketoglutarate, succinate, and malate after 6 hr tracing experiment on primary microglia pretreated for 24 hr with BSA or palmitate (n=3). The results are graphed in pool size. Data are presented as mean ± SEM. *p<0.05, **p<0.01, ***p<0.001 as determined by two-tailed Student’s t-test and two-way ANOVA followed by Bonferroni post hoc.
Figure 5 with 3 supplements
Acute high-fat diet (HFD) induces widespread microglial metabolic response (MMR) and rapid modulation of spatial and learning memory.
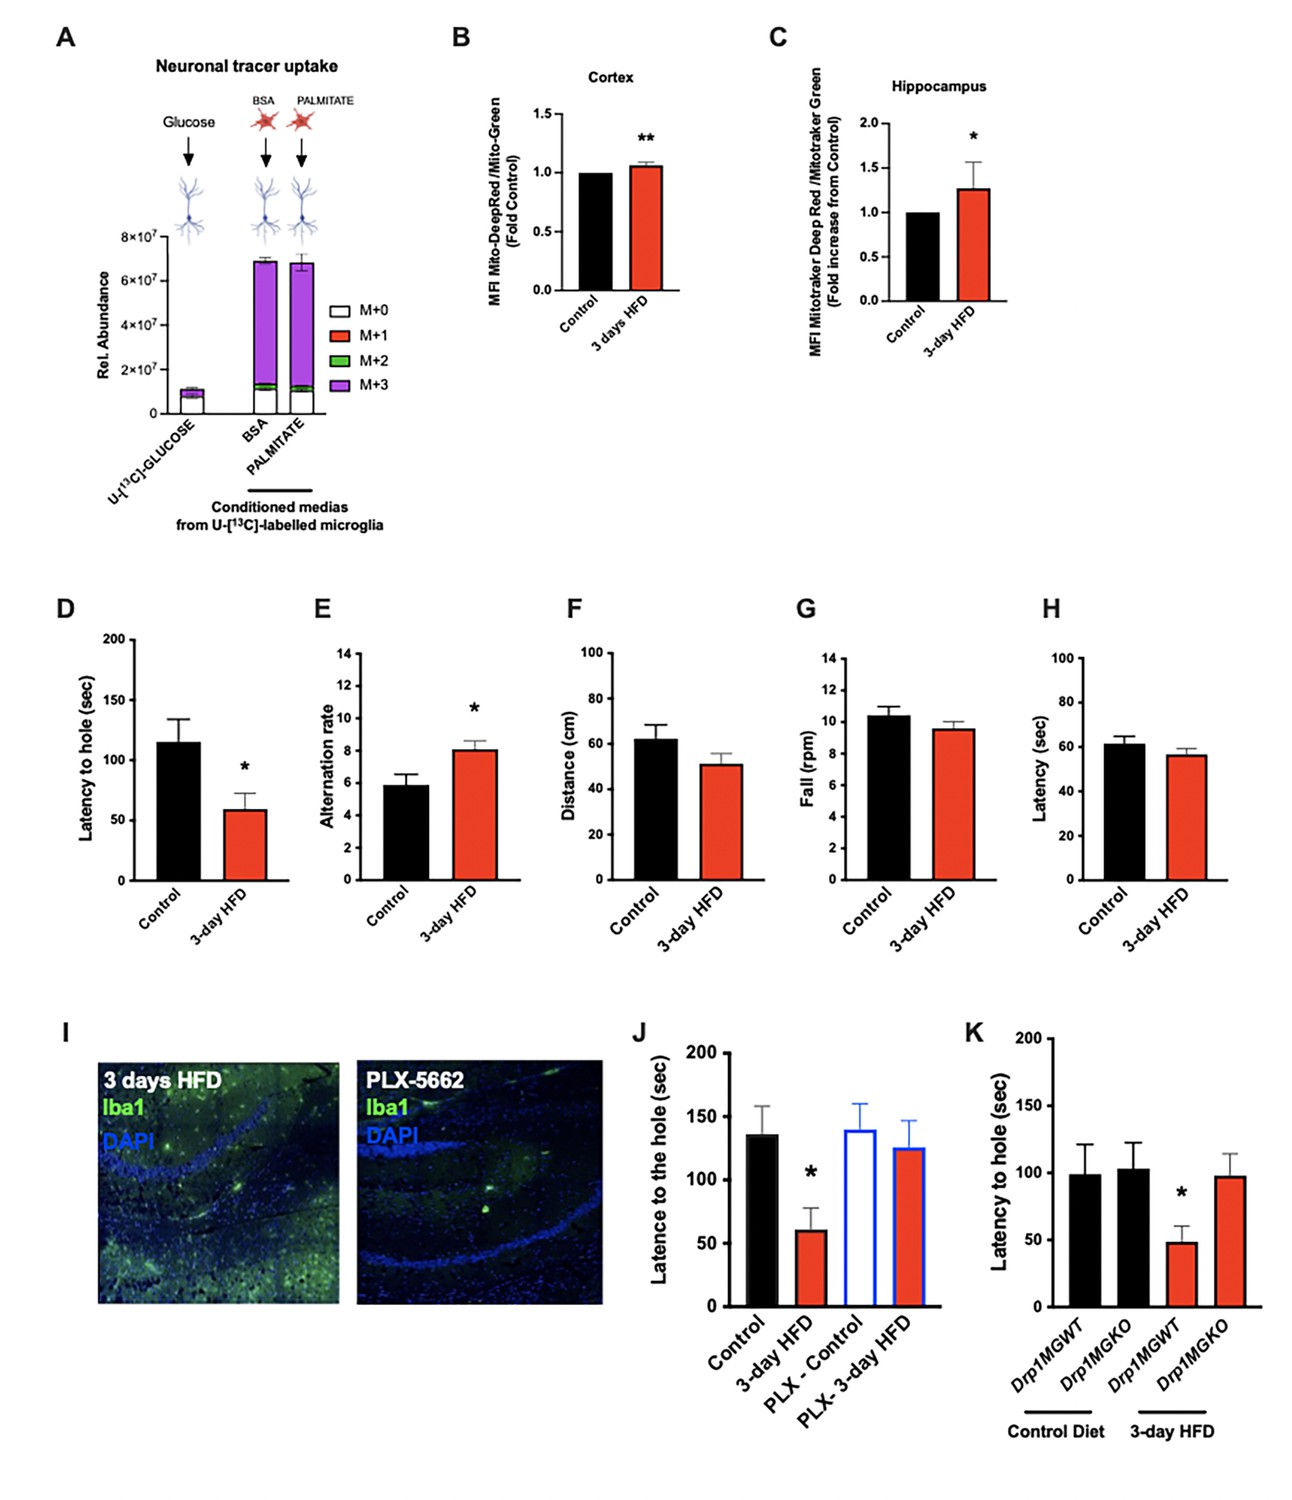
(A) Primary microglial cell media was collected after the 13C-glucose tracing (containing 13C-lactate released by microglia challenged with BSA or palmitate) and incubated for 4 hr with primary neurons, the graph shows the 13C-lactate incorporation in the neurons in relative abundance, as control, primary neurons were incubated directly with 13C-glucose (n=6). (B) Graph showing the ratio MitoTracker Deep Red/ MitoTracker Green from sorted cortical microglial cells of C57Bl6/J male fed with a control diet (Control) or fed with high-fat diet for 3 days (3-day HFD) (n=5–12). (C) Graph showing the ratio MitoTracker Deep Red/ MitoTracker Green from sorted hippocampic microglial cells of C57Bl6/J male fed with a control diet (Control) or fed with 3-day HFD (n=5–12). (D) Graph showing the latency during the Barnes Test from mice fed with normal diet (Control) or 3-day HFD (n=11). The test was performed in the VAI animals facility (USA). (E) Graph showing the alternation during the T Maze Test from mice fed with normal diet (Control) or 3-day HFD (n=11). The test was performed in the VAI animals facility (USA). (F) Graph showing the distance walked during the ROTAROD test from mice fed with normal diet (Control) or 3-day HFD (n=11). (G) Graph showing the number of turn before the mice fall during the ROTAROD test from mice fed with normal diet (Control) or 3-day HFD (n=11). (H) Graph showing the latency during the ROTAROD test from mice fed with normal diet (Control) or 3-day HFD (n=11). (I) Microglial staining with Iba1 (green) in the hippocampus slices from mice fed with 3 days HFD or mice depleted from their microglial cells with 1 week control diet complexed with PLX-5662 prior the 3 days HFD (PLX-5662) (n=5). (J) Graph showing the latency during the Barnes Test from mice fed with normal diet (Control) (n=6), mice fed with 3-day HFD (n=6), mice depleted from their microglial cells with 1 week control diet complexed with PLX-5662 (PLX-Control) (n=8) or mice depleted from their microglial cells with 1 week control diet complexed with PLX-5662 prior the 3 days HFD (PLX-3-day HFD) (n=8). (K) Graph showing the latency during the Barnes Test from Drp1MGWT or Drp1MGKO mice fed with normal diet (Control diet) or with 3-day HFD (n=11). Data are presented as mean ± SEM. *p<0.05, **p<0.01, ***p<0.001 as determined by two-tailed Student’s t-test and two-way ANOVA followed by Bonferroni post hoc test.
Figure 5—figure supplement 1
Acute high-fat diet (HFD) induces widespread microglial metabolic response (MMR) and rapid modulation of spatial and learning memory (supplement).
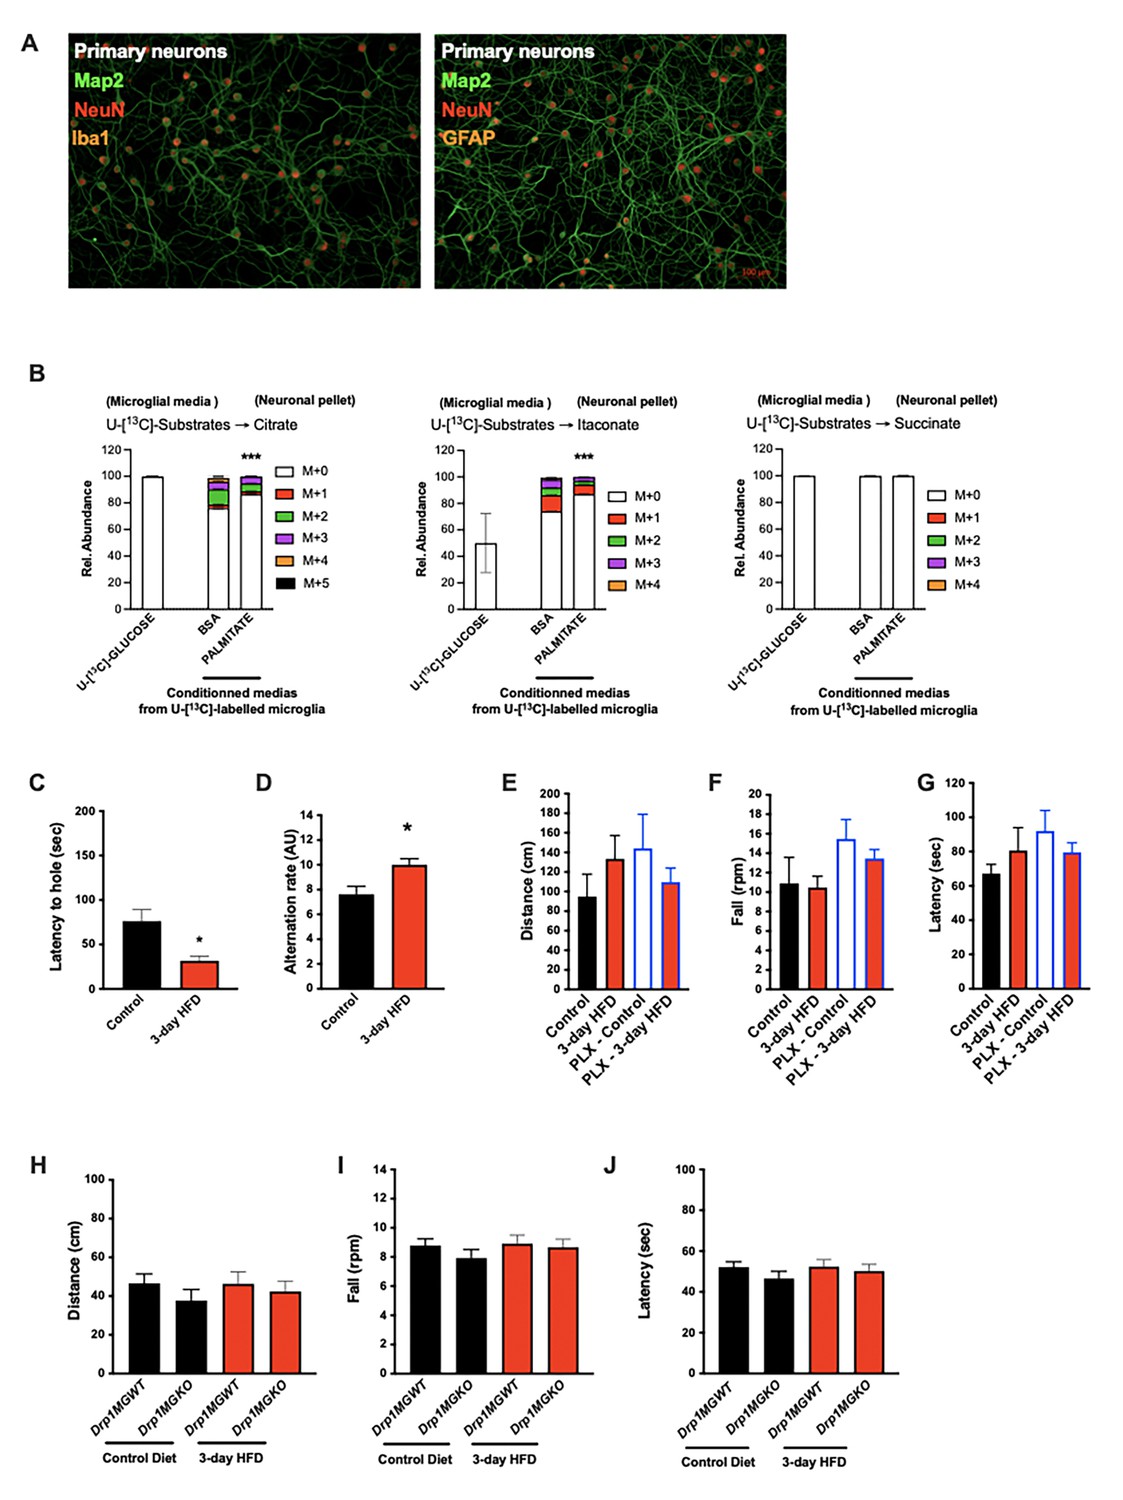
(A) Map2, NeuN, Iba1 and Map2, NeuN, GFAP immunostainings on primary neurons. (B) Primary microglial cell media was collected after the 13C-glucose tracing (containing 13C- metabolites released by microglia challenged with BSA or palmitate) and incubated for 4 hr with primary neurons, the graph shows the 13C-citrate, 13C-itaconate, and 13C-succinate incorporation in the neurons in relative abundance (n=6). (C) Graph showing the latency during the Barnes Test from mice fed with normal diet (Control), or 3 days HFD (3-day HFD) (n=11). The test was performed in the MPI animals facility (Germany). (D) Graph showing the alternation during the T Maze Test from mice fed with normal diet (Control), or 3-day HFD (n=11). The test was performed in the MPI animals facility (Germany). (E) Graph showing the distance walked during the ROTAROD test from mice fed with normal diet (Control) (n=4), mice fed with 3-day HFD (n=6), mice depleted from their microglial cells with 1 week control diet complexed with PLX-5662 (PLX-Control) (n=8) or mice depleted from their microglial cells with 1 week control diet complexed with PLX-5662 prior the 3 days HFD (PLX-3-day HFD) (n=12). (F) Graph showing the number of turns before the mice fall during the ROTAROD test from mice fed with normal diet (Control) (n=4), mice fed with 3-day HFD (n=6), mice depleted from their microglial cells with 1 week control diet complexed with PLX-5662 (PLX-Control) (n=8) or mice depleted from their microglial cells with 1 week control diet complexed with PLX-3-day HFD (n=12). (G) Graph showing the latency during the ROTAROD test from mice fed with normal diet (Control) (n=4), mice fed with3-day HFD (n=6), mice depleted from their microglial cells with 1 week control diet complexed with PLX-5662 (PLX-Control) (n=8) or mice depleted from their microglial cells with 1 week control diet complexed with PLX-3-day HFD (n=12). (H) Graph showing the distance walked during the ROTAROD test from Drp1MGWT or Drp1MGKO mice fed with normal diet (Control diet), or 3-day HFD (n=11). (I) Graph showing the number of turns before the mice fall during the ROTAROD test from Drp1MGWT or Drp1MGKO mice fed with normal diet (Control diet), or 3-day HFD (n=11). (J) Graph showing the latency during the ROTAROD test from Drp1MGWT or Drp1MGKO mice fed with normal diet (Control diet), or 3-day HFD (n=11). Data are presented as mean ± SEM. *p<0.05, **p<0.01, ***p<0.001 as determined by two-tailed Student’s t-test and two-way ANOVA followed by Bonferroni post hoc.
Figure 5—figure supplement 2
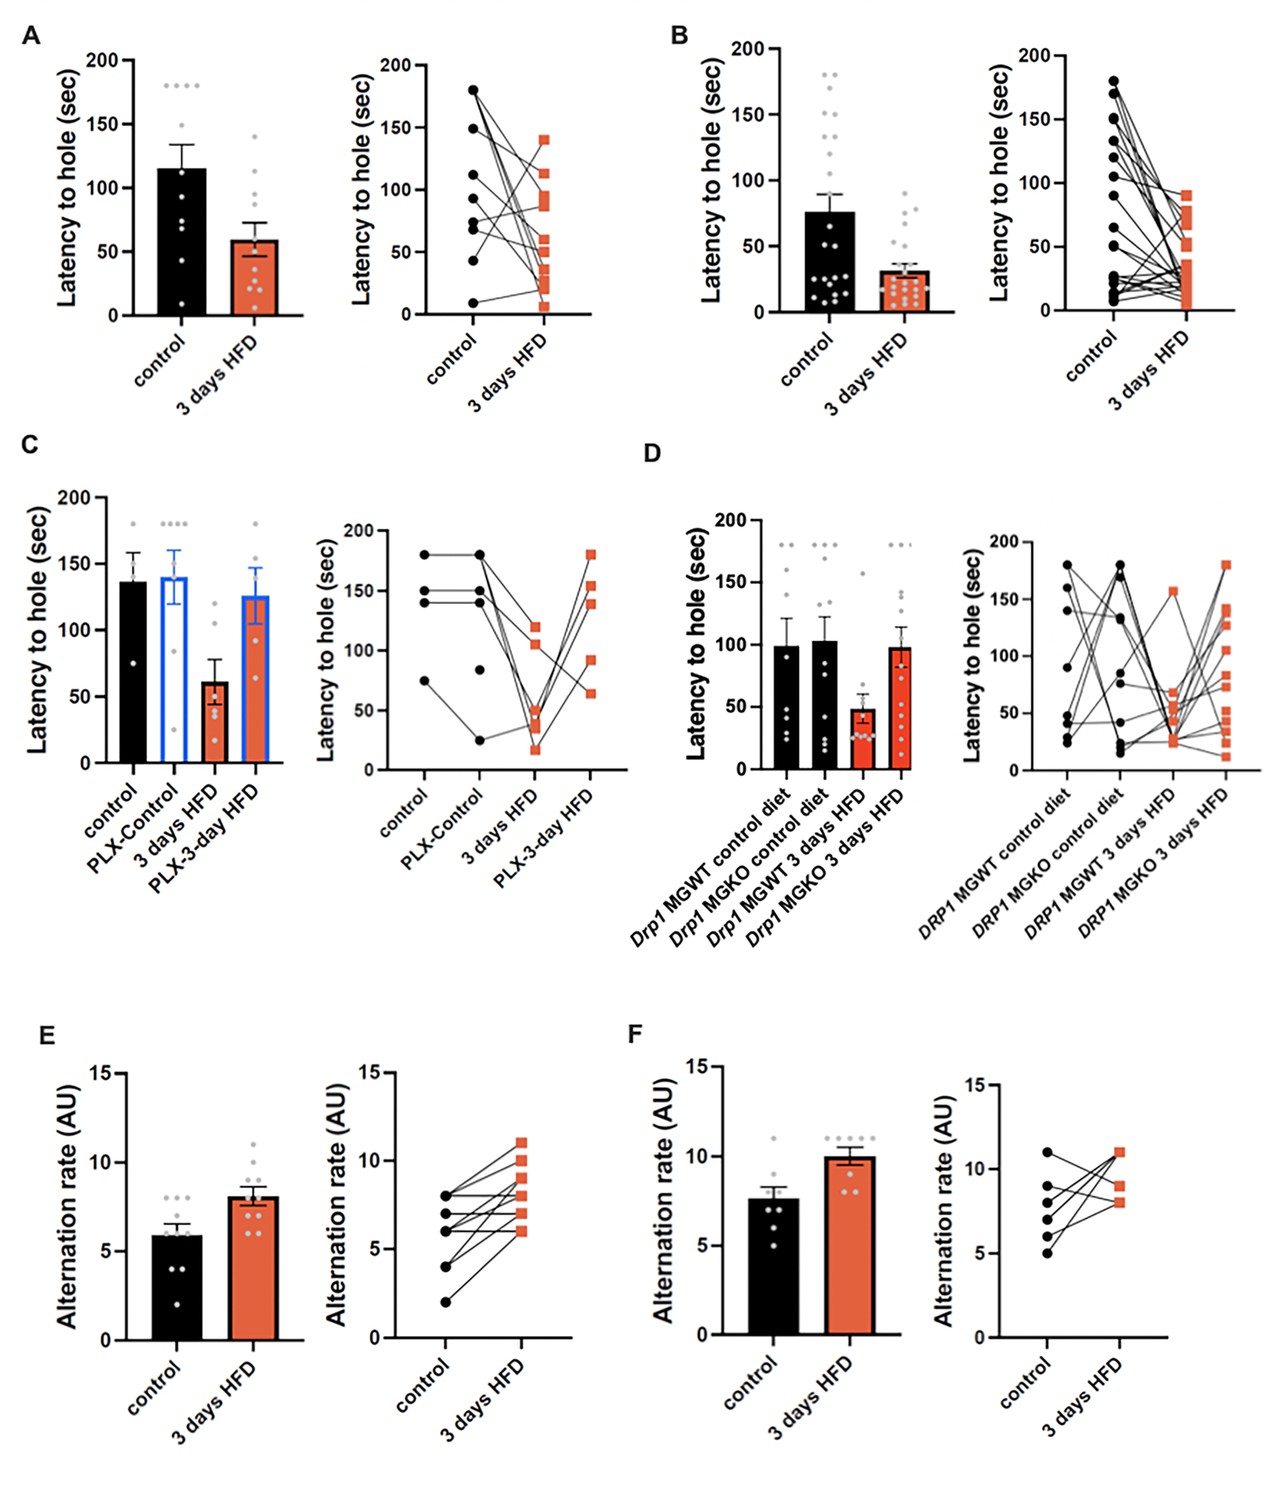
Acute HFD induces widespread microglial metabolic response (MMR) and rapid modulation of spatialand learning memory (supplement — individual replicate data).
(A) Graphs showing the latency during the Barnes Test from Figure 5D with samples distribution and by using the paired comparison method. (B) Graphs showing the latency during the Barnes Test from Figure 5—figure supplement 1C with samples distribution and by using the paired comparison method. (C) Graphs showing the latency during the Barnes Test from Figure 5J with samples distribution and by using the paired comparison method. (D) Graphs showing the latency during the Barnes Test from Figure 5K with samples distribution and by using the paired comparison method. (E) Graphs showing the alternation during the T Maze Test from Figure 5E with samples distribution and by using the paired comparison method. (F) Graphs showing the alternation during the T Maze Test from Figure 5—figure supplement 1D with samples distribution and by using the paired comparison method.
Figure 5—figure supplement 3
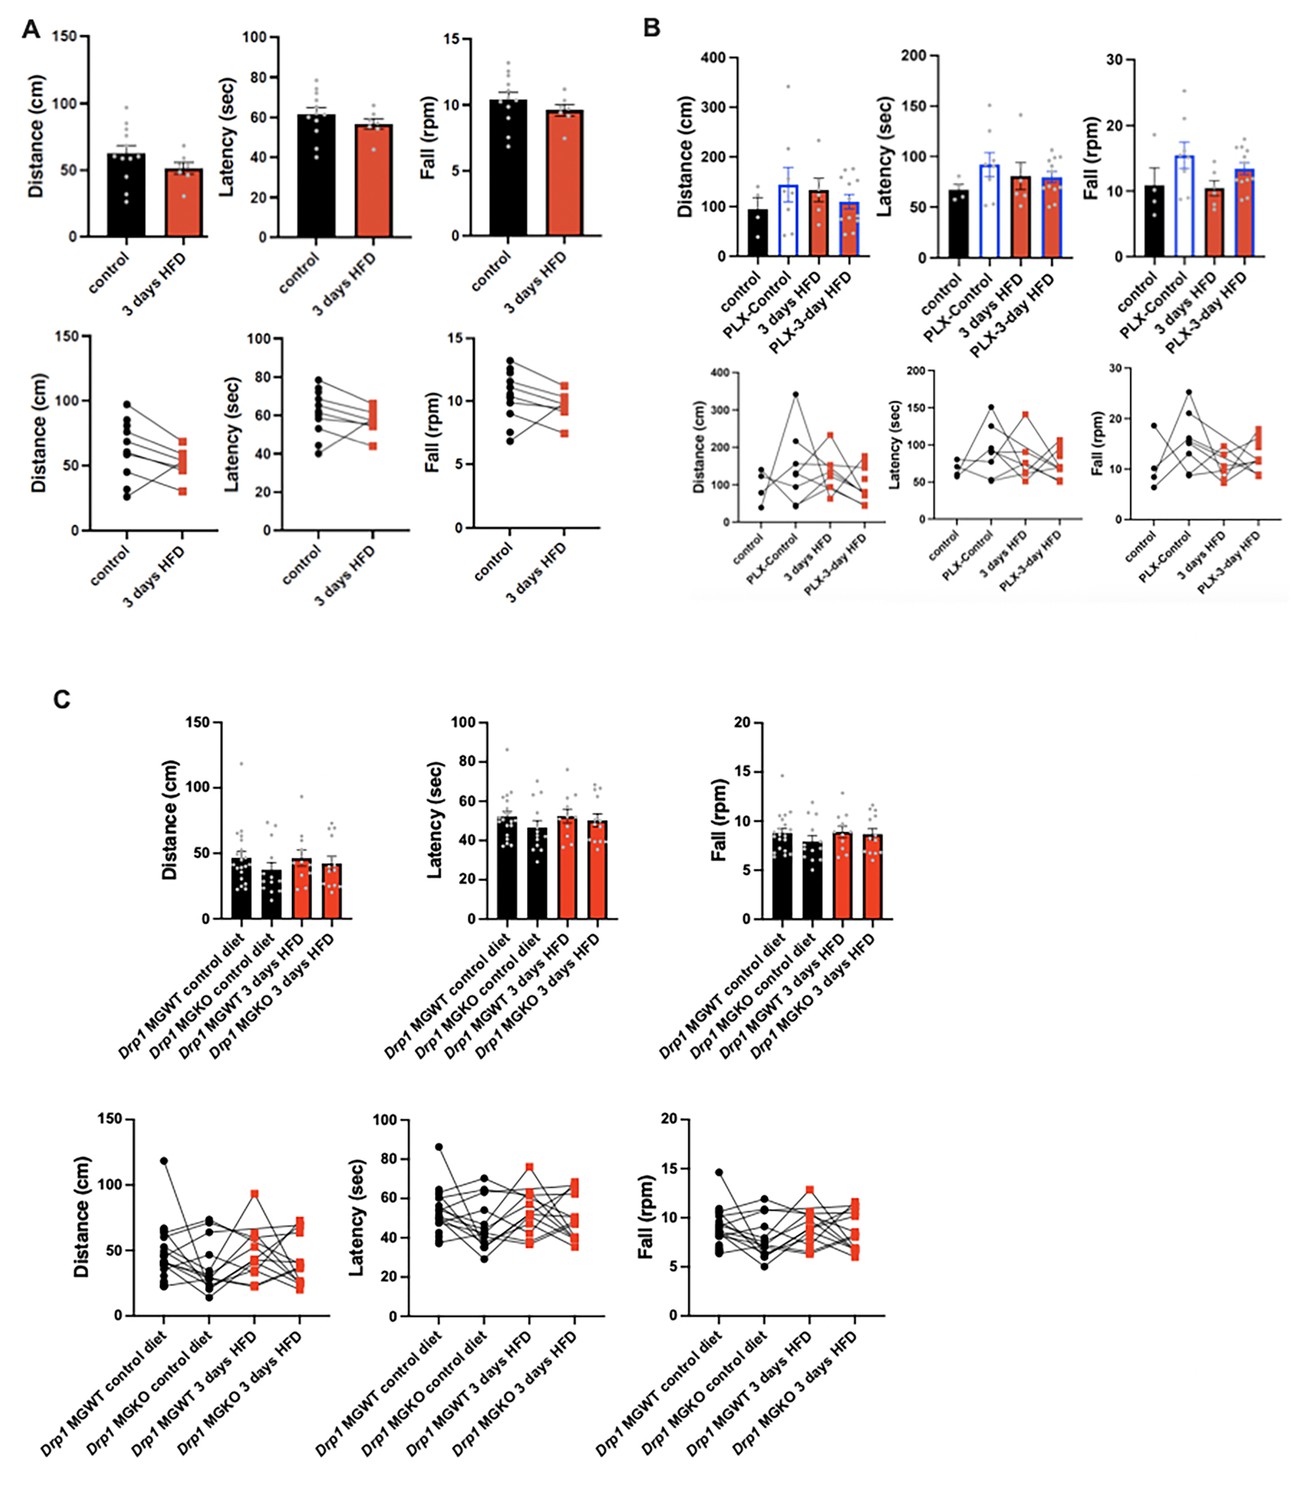
Acute high-fat diet (HFD) doesn't affect the motor coordination.
(A) Graphs showing the ROTAROD results (distance, latency, fall) from Figure 5F–H with samples distribution and by using the paired comparison method. (B) Graphs showing the ROTAROD results (distance, latency, fall) from Figure 5—figure supplement 1E–G with samples distribution and by using the paired comparison method. (C) Graphs showing the ROTAROD results (distance, latency, fall) from Figure 5—figure supplement 1H–J with samples distribution and by using the paired comparison method.
Figure 6
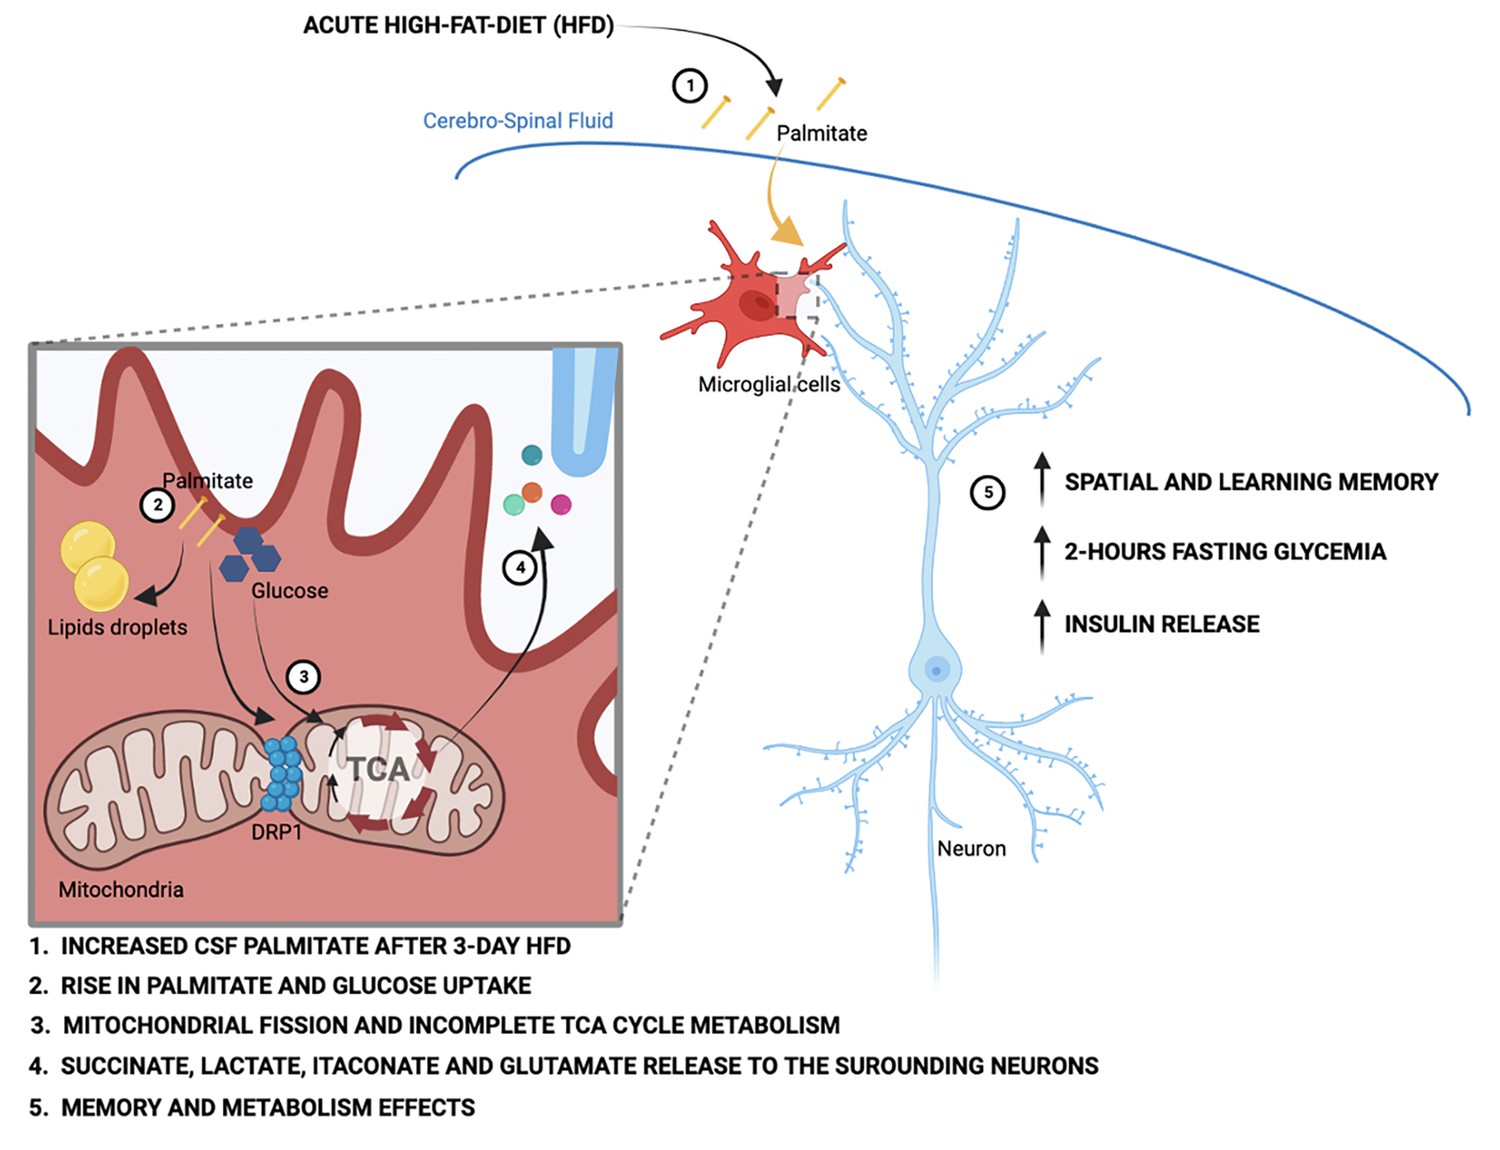
Schematic depicting the acute high-fat diet impact on microglial cells via the metabolic pathways wiring.
Tables
Table 1
Results of targeted metabolomics of cerebrospinal fluid (CSF).
| Metabolite | FC | log2FC | p-Value | log10(p-value) | Enrichment |
|---|---|---|---|---|---|
| Kynurenic acid | 3.56 | 1.83 | 0.24 | 0.62 | Not Sig |
| Hexadecanoic acid | 2.27 | 1.18 | 0.01 | 2.11 | HFD 3d |
| Nicotinamide-N-oxide | 0.45 | –1.14 | 0.02 | 1.71 | CT |
| Octadecanoic acid | 2.17 | 1.12 | 0.02 | 1.64 | HFD 3d |
| Serotonin | 0.51 | –0.98 | 0.95 | 0.02 | Not Sig |
| N-Methyl-4-pyridone-3-carboxamide | 1.81 | 0.85 | 0.06 | 1.21 | Not Sig |
| Methylmalonate | 1.80 | 0.85 | 0.01 | 1.86 | Not Sig |
| Tetradecanoic acid | 1.78 | 0.83 | 0.29 | 0.53 | Not Sig |
| Octanoylcamitine | 0.60 | –0.73 | 0.99 | 0.00 | Not Sig |
| Propionylcarnitine | 1.65 | 0.73 | 0.45 | 0.35 | Not Sig |
| Isovalerylcamitine | 1.65 | 0.72 | 0.02 | 1.74 | Not Sig |
| Nicotinic acid | 1.60 | 0.68 | 0.04 | 1.39 | Not Sig |
| Glutarylearnitine | 1.60 | 0.68 | 0.00 | 2.40 | Not Sig |
| Nicotinamide | 0.63 | –0.66 | 0.07 | 1.13 | Not Sig |
| 1-MethyInicotinamide | 0.66 | –0.59 | 0.31 | 0.51 | Not Sig |
| Ophthalmic acid | 0.68 | –0.56 | 0.24 | 0.62 | Not Sig |
| N-Methylserotonin | 1.41 | 0.49 | 0.17 | 0.77 | Not Sig |
| O-Acetylcarnitine | 1.38 | 0.47 | 0.62 | 0.21 | Not Sig |
| Tryptophan | 1.35 | 0.43 | 0.10 | 1.02 | Not Sig |
| 3-Hydroxyanthranillic acid | 1.34 | 0.43 | 0.20 | 0.69 | Not Sig |
| Butyrylcarnitine | 1.33 | 0.42 | 0.28 | 0.55 | Not Sig |
| Nudifioramide | 1.27 | 0.34 | 0.04 | 1.41 | Not Sig |
| Quinolinic acid | 1.21 | 0.27 | 0.22 | 0.66 | Not Sig |
| S-Adenosyl-L-homocysteine | 0.84 | –0.26 | 0.44 | 0.35 | Not Sig |
| Isobutyrylcarnitine | 1.15 | 0.21 | 0.62 | 0.20 | Not Sig |
| 2-Methylbutyrylcarnitine | 1.15 | 0.20 | 0.64 | 0.19 | Not Sig |
| Nicotinic acid mononucleotide | 0.90 | –0.15 | 0.33 | 0.49 | Not Sig |
| Hexanoylcarnitine | 1.10 | 0.14 | 0.69 | 0.16 | Not Sig |
| Nicotinamide mononucleotide | 1.10 | 0.14 | 0.95 | 0.02 | Not Sig |
| Carnitine | 1.06 | 0.08 | 0.88 | 0.06 | Not Sig |
| S-Adenosyl-L-methionine | 1.06 | 0.08 | 0.61 | 0.21 | Not Sig |
| 3-Hyroxykynurenine | 1.04 | 0.06 | 0.87 | 0.06 | Not Sig |
| Nicotinuric acid | 0.96 | –0.06 | 0.64 | 0.19 | Not Sig |
| Anthranillic acid | 1.04 | 0.05 | 0.96 | 0.02 | Not Sig |
Table 2
Metabolites released in media from BSA- or palmitate (PA)-treated neurons.
| Metabolite | N | Overall, N=12* | BSA, N=6* | PA, N=6* | p-Value† | q-Value ‡ |
|---|---|---|---|---|---|---|
| b_DL.Lactic.Acid | 12 | 7,768,093,932.0 (566,966,988.5) | 7,315,358,105.8 (237,880,097.3) | 8,220,829,758.2 (398,345,524.3) | 0.002 | 0.064 |
| b_D..Glutamine | 12 | 92,514,878.8 (9,477,866.2) | 99,910,567.8 (6,363,882.4) | 85,119,189.7 (5,084,875.9) | 0.002 | 0.064 |
| a_Acetyl.L.carnitine | 12 | 21,534,366.5 (5,136,659.2) | 25,486,005.2 (4,313,399.0) | 17,582,727.8 (1,401,821.0) | 0.004 | 0.085 |
| b_L.Serine | 12 | 8,927,932.4 (1,999,447.4) | 10,439,581.3 (1,620,380.1) | 7,416,283.5 (827,833.2) | 0.009 | 0.13 |
| b_X4.Oxoproline | 12 | 5,158,697.7 (2,093,379.7) | 6,584,223.3 (1,496,000.9) | 3,733,172.0 (1,589,279.7) | 0.026 | 0.3 |
| b_X3.Hydroxy.2.methyl.4.pyrone.tent. | 12 | 112,324,855.5 (18,985,842.0) | 122,558,080.8 (13,194,171.3) | 102,091,630.2 (19,173,036.1) | 0.065 | 0.6 |
| a_Adipic.acid.tent. | 12 | 463,554.3 (1,036,466.7) | 0.0 (0.0) | 927,108.7 (1,359,286.8) | 0.074 | 0.6 |
| a_D..Pyroglutamic.Acid | 12 | 287,577,957.7 (32,240,216.1) | 302,927,531.8 (25,661,286.0) | 272,228,383.5 (32,600,385.7) | 0.093 | 0.6 |
| b_L.Arabinose.or.isomer. | 12 | 427,996,608.9 (18,980,682.8) | 437,653,974.3 (18,029,045.8) | 418,339,243.5 (15,611,025.3) | 0.093 | 0.6 |
| b_L.Tyrosine | 12 | 85,928,933.3 (296,055,668.3) | 345,898.5 (293,093.1) | 171,511,968.0 (418,627,435.0) | 0.13 | 0.7 |
| b_Sodium.lauryl.sulfate | 12 | 22,598.3 (76,220.7) | 0.0 (0.0) | 45,196.5 (107,496.4) | 0.2 | 0.7 |
| b_Tridecanoic.acid | 12 | 113,734.1 (302,240.1) | 0.0 (0.0) | 227,468.2 (412,217.0) | 0.2 | 0.7 |
| a_Leucine | 12 | 27,980,174.9 (7,729,502.5) | 30,862,636.3 (2,851,217.9) | 25,097,713.5 (10,167,075.1) | 0.2 | 0.7 |
| b_Glutaric.acid.tent. | 12 | 440,497,616.4 (19,061,443.4) | 448,877,445.2 (22,010,672.2) | 432,117,787.7 (12,097,256.5) | 0.2 | 0.7 |
| a_PEG.n5.tent. | 12 | 344,189.2 (776,660.6) | 4,541.3 (11,123.9) | 683,837.0 (1,024,721.6) | 0.2 | 0.7 |
| a_L.Serine | 12 | 390,966.4 (346,737.4) | 527,905.0 (409,596.4) | 254,027.8 (227,430.6) | 0.2 | 0.7 |
| b_D..Glucose.or.isomer. | 12 | 5,354,625,351.9 (372,775,074.5) | 5,219,148,234.7 (282,140,339.8) | 5,490,102,469.2 (426,687,091.4) | 0.2 | 0.7 |
| b_AICA.ribonucleotide | 12 | 64,660,392.8 (5,188,450.2) | 63,405,196.7 (3,409,871.4) | 65,915,588.8 (6,619,333.0) | 0.2 | 0.7 |
| b_neuraminic.acid.tent. | 12 | 23,066,967.0 (2,864,562.7) | 24,475,099.5 (3,412,576.8) | 21,658,834.5 (1,283,781.1) | 0.2 | 0.7 |
| a_Betaine | 12 | 3,612,697.5 (2,636,694.6) | 2,762,143.5 (2,827,681.0) | 4,463,251.5 (2,358,539.4) | 0.3 | >0.9 |
| a_DL.Arginine | 12 | 3,821,072.9 (7,222,808.1) | 2,199,664.0 (5,388,054.4) | 5,442,481.8 (8,912,410.1) | 0.3 | >0.9 |
| a_L.Threonine | 12 | 5,270,710.2 (5,478,082.2) | 6,513,108.5 (5,492,782.8) | 4,028,311.8 (5,669,696.2) | 0.4 | >0.9 |
| a_Pantothenic.acid | 12 | 22,359,057.0 (26,015,488.1) | 28,020,428.8 (25,119,049.5) | 16,697,685.2 (27,947,862.2) | 0.4 | >0.9 |
| b_L.Leucine | 12 | 6,646,608.2 (3,705,017.3) | 7,399,027.0 (3,879,174.6) | 5,894,189.3 (3,713,895.4) | 0.4 | >0.9 |
| b_Crotonic.acid | 12 | 16,108,825.9 (23,803,380.1) | 23,947,637.5 (26,242,912.3) | 8,270,014.3 (20,257,315.3) | 0.4 | >0.9 |
| b_Succinic.acid | 12 | 407,804.1 (869,276.7) | 109,080.2 (267,190.7) | 706,528.0 (1,173,394.8) | 0.5 | >0.9 |
| a_L.Lysine | 12 | 24,416,825.1 (28,518,776.0) | 34,566,558.7 (36,434,829.3) | 14,267,091.5 (14,648,122.2) | 0.5 | >0.9 |
| b_Pyridoxal.tent. | 12 | 777,482.7 (1,211,214.3) | 598,171.7 (398,509.7) | 956,793.7 (1,729,598.9) | 0.5 | >0.9 |
| b_X2.C.Methyl.D.erythritol4.phosphate.tent. | 12 | 643,051,857.5 (148,219,463.1) | 606,454,245.0 (172,899,107.7) | 679,649,470.0 (123,382,309.5) | 0.5 | >0.9 |
| b_X2.Methylsuccinic.acid.tent. | 12 | 287,186,644.6 (143,335,650.3) | 264,074,195.0 (155,198,662.0) | 310,299,094.2 (140,821,055.1) | 0.5 | >0.9 |
| b_Pyruvic.acid.tent. | 12 | 150,010,045.5 (9,715,420.7) | 147,364,165.0 (6,350,912.8) | 152,655,926.0 (12,268,697.7) | 0.5 | >0.9 |
| a_Niacinamide | 12 | 1,384,815.1 (2,023,883.3) | 1,614,438.5 (2,373,808.4) | 1,155,191.7 (1,802,752.7) | 0.5 | >0.9 |
| a_X6.Methoxyquinoline.tent. | 12 | 7,956,394.3 (26,119,894.0) | 15,246,370.2 (37,028,395.4) | 666,418.3 (1,516,716.5) | 0.5 | >0.9 |
| a_L..Methionine | 12 | 788,318.3 (1,316,035.4) | 642,601.0 (747,341.7) | 934,035.5 (1,789,080.3) | 0.5 | >0.9 |
| b_X4.Hydroxyquinoline | 12 | 2,294,626.8 (5,198,100.9) | 3,743,521.2 (7,079,171.4) | 845,732.5 (2,071,613.1) | 0.6 | >0.9 |
| a_X2.2.6.6.Tetramethyl.4.piperidinol.tent. | 12 | 3,349,971.7 (5,949,414.1) | 4,474,480.0 (7,959,519.7) | 2,225,463.3 (3,388,416.0) | 0.6 | >0.9 |
| a_N.N.Diethylethanolamine.tent. | 12 | 3,251,751.6 (3,370,326.9) | 2,444,947.7 (2,152,767.5) | 4,058,555.5 (4,335,133.4) | 0.6 | >0.9 |
| b_L.Isoleucine | 12 | 7,328,303.6 (7,854,185.2) | 8,665,141.0 (7,496,666.0) | 5,991,466.2 (8,673,233.1) | 0.7 | >0.9 |
| a_X6.Methylquinoline.tent. | 12 | 385.0 (699.5) | 274.2 (671.6) | 495.8 (772.0) | 0.8 | >0.9 |
| a_Hypoxanthine | 12 | 38,073.7 (83,225.3) | 44,836.3 (109,826.1) | 31,311.0 (55,377.5) | 0.8 | >0.9 |
| b_p.Toluenesulfonic.acid.tent. | 12 | 3,372,499.5 (6,572,551.8) | 3,393,943.8 (5,259,090.6) | 3,351,055.2 (8,208,375.3) | 0.8 | >0.9 |
| b_Urocanic.acid.tent. | 12 | 1,399.0 (2,534.9) | 1,818.7 (2,821.3) | 979.3 (2,398.9) | 0.8 | >0.9 |
| a_Pyridoxal.tent. | 12 | 1,928,431.0 (3,031,562.9) | 2,203,965.7 (3,922,077.7) | 1,652,896.3 (2,157,295.3) | 0.8 | >0.9 |
| b_X3.Methyl.2.oxovaleric.acid | 12 | 1,101,172.5 (3,039,252.9) | 282,158.3 (278,456.3) | 1,920,186.7 (4,316,724.3) | 0.8 | >0.9 |
| b_L.Methionine | 12 | 747,354.3 (822,900.9) | 676,740.7 (845,132.3) | 817,968.0 (873,813.0) | 0.8 | >0.9 |
| b_L.Tryptophan | 12 | 198,603.2 (296,935.2) | 272,248.2 (407,584.4) | 124,958.2 (121,792.6) | 0.8 | >0.9 |
| a_Indole.3.acrylic.acid | 12 | 2,553,283.9 (3,140,722.0) | 2,083,026.7 (2,110,564.8) | 3,023,541.2 (4,088,504.8) | 0.8 | >0.9 |
| b_X4.Dodecylbenzenesulfonic.acid.tent. | 12 | 10,280,591.5 (7,701,423.0) | 8,121,727.2 (4,928,645.2) | 12,439,455.8 (9,747,256.3) | 0.8 | >0.9 |
| a_N.Acetylputrescine | 12 | 386,960.3 (468,563.5) | 391,056.2 (550,659.6) | 382,864.3 (423,966.5) | 0.9 | >0.9 |
| a_D..Proline | 12 | 661,884.2 (1,149,335.2) | 957,007.0 (1,564,926.8) | 366,761.3 (498,103.3) | 0.9 | >0.9 |
| a_X4.Aminonicotinic.acid.or.isomer. | 12 | 126,303.5 (225,453.7) | 94,034.3 (196,574.4) | 158,572.7 (265,864.7) | >0.9 | >0.9 |
| a_Choline | 12 | 174,331,021.6 (21,492,889.5) | 171,722,892.2 (20,170,821.4) | 176,939,151.0 (24,353,435.2) | >0.9 | >0.9 |
| b_Acetoacetic.acid | 12 | 319,609,159.2 (14,397,923.5) | 321,712,028.7 (13,338,036.2) | 317,506,289.7 (16,356,781.0) | >0.9 | >0.9 |
| a_Isoleucine | 12 | 30,943,808.3 (15,505,575.1) | 29,880,732.5 (15,885,905.7) | 32,006,884.2 (16,548,594.4) | >0.9 | >0.9 |
| b_L.Phenylalanine | 12 | 9,511,810.9 (5,608,112.4) | 10,045,803.3 (6,593,135.4) | 8,977,818.5 (5,003,823.0) | >0.9 | >0.9 |
| a_Creatine | 12 | 137,229.8 (326,719.4) | 112,430.3 (275,396.9) | 162,029.2 (396,888.8) | >0.9 | >0.9 |
| b_D..Fructose.or.isomer. | 12 | 1,376,324,172.0 (124,013,739.0) | 1,382,734,756.2 (112,787,783.2) | 1,369,913,587.8 (144,965,454.4) | >0.9 | >0.9 |
| b_Folic.acid | 12 | 3,351,599.5 (3,207,090.2) | 4,052,769.5 (4,167,729.0) | 2,650,429.5 (2,019,416.2) | >0.9 | >0.9 |
| b_Propylparaben.or.isomer. | 12 | 255,003.3 (618,051.8) | 190,425.0 (466,444.1) | 319,581.7 (782,812.0) | >0.9 | >0.9 |
-
*
Mean (SD).
-
†
Wilcoxon rank sum test; Wilcoxon rank sum exact test.
-
‡
False discovery rate correction for multiple testing.
Additional files
Download links
A two-part list of links to download the article, or parts of the article, in various formats.
Downloads (link to download the article as PDF)
Open citations (links to open the citations from this article in various online reference manager services)
Cite this article (links to download the citations from this article in formats compatible with various reference manager tools)
An acute microglial metabolic response controls metabolism and improves memory
eLife 12:RP87120.
https://doi.org/10.7554/eLife.87120.3


