Missense mutations in CRX homeodomain cause dominant retinopathies through two distinct mechanisms
- Molecular Genetic and Genomics Graduate Program, Division of Biological and Biomedical Sciences, Washington University in St Louis, United States
- Department of Ophthalmology and Visual Sciences, Washington University in St Louis, United States
- Department of Genetics, Washington University in St Louis, United States
- Department of Developmental Biology, Washington University in St Louis, United States
Figures
Figure 1 with 2 supplements
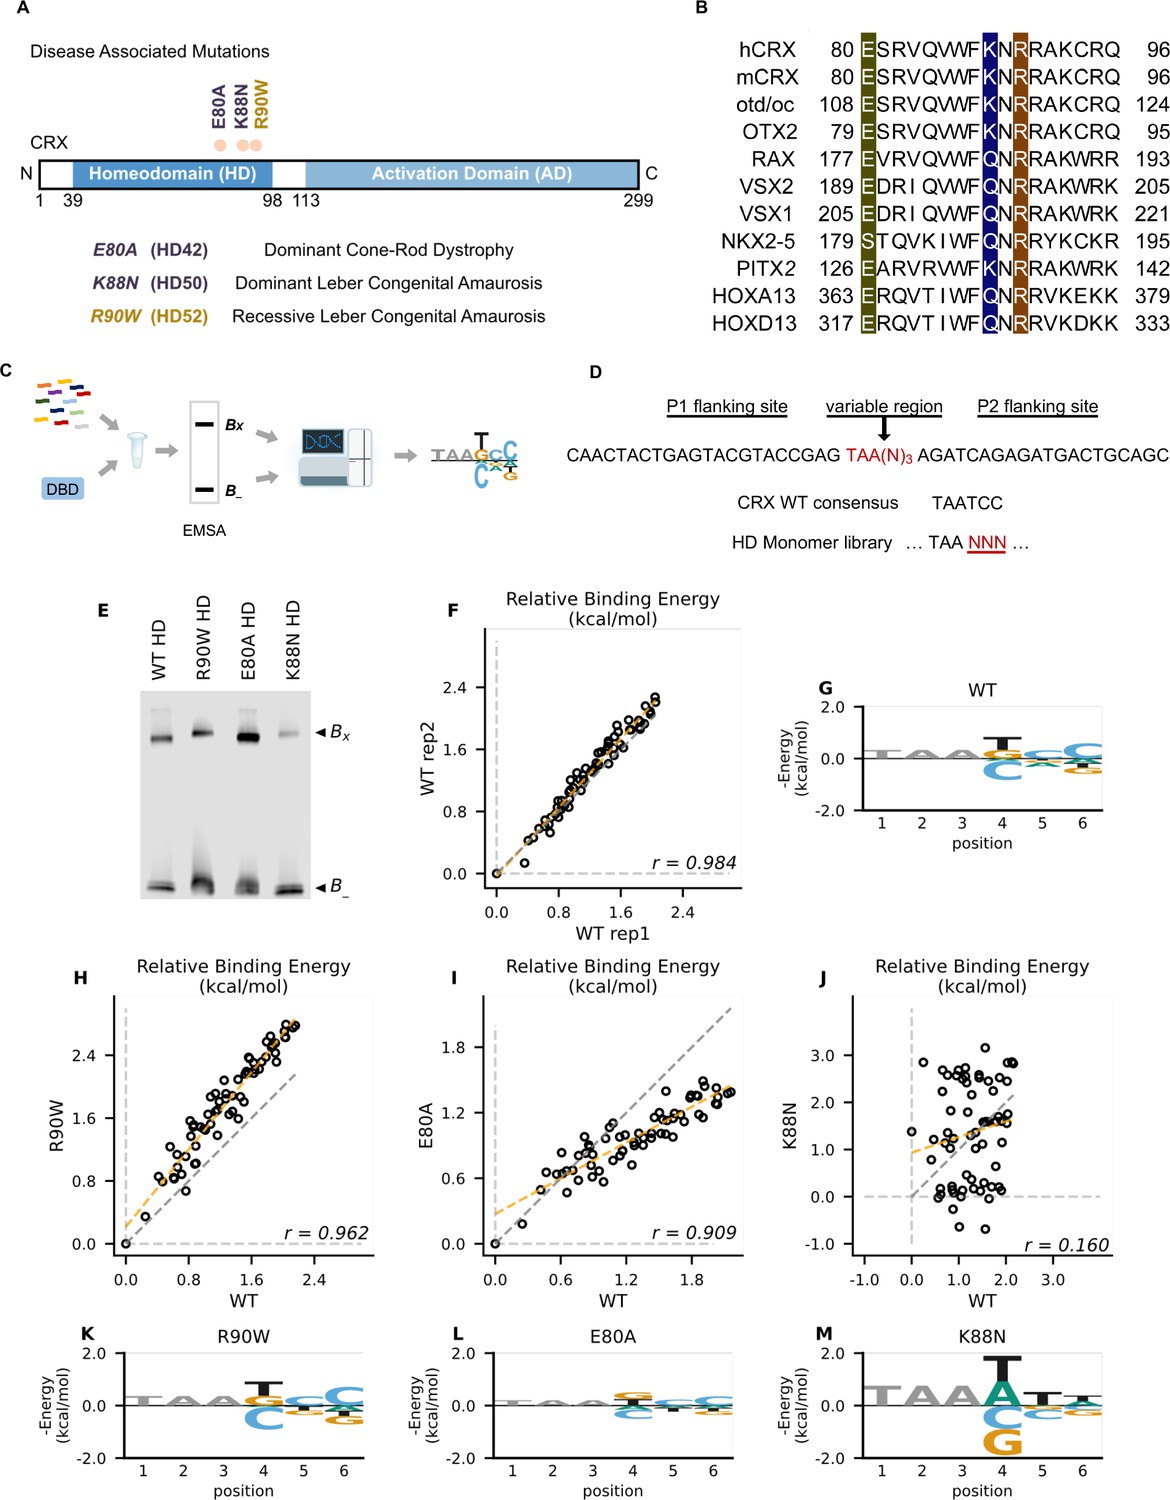
Disease associated missense mutations altered CRX homeodomain (HD) DNA-binding specificity (legend on the next page).
(A) Diagram of CRX functional domains: HD for DNA-binding and activation domain (AD) for target gene transactivation. The three missense mutations in this study are located at the C-terminus of CRX HD and associated with different retinal diseases in human. Number in the parenthesis denotes the CRX HD position of the corresponding mutated residue. (B) Alignments of HD recognition helix sequences for the indicated HD proteins for which HD missense mutations have been associated with inherited diseases. Accession numbers can be found in Supplementary file 1a. Missense variants in this study (highlighted) are located at highly conserved residues across species and different HD transcription factors (TFs). (C) Spec-seq experimental workflow (Methods). (D) Spec-seq library design of monomeric HD-binding sites. (E) Electrophoretic mobility shift assay (EMSA) gel images of Spec-seq experiments with different CRX HD species. Bx: bound. B-: unbound. (F) Relative binding energy comparison from two different experiments with wild-type (WT) HD. (G) Binding energy model for WT CRX HD. Relative binding energy comparison between WT HD and R90W HD (H), E80A HD (I), or K88N HD (J). Consensus sequence is defined to have relative binding energy of 0kT (TAATCC for WT, R90W and E80A, TAATTA for K88N). The identity line is represented in gray dash. The orange dashed line shows the best linear fit to the data. Binding energy models for R90W HD (K), E80A HD (L), and K88N HD (M). Only sequence variants within two mismatches to the corresponding consensus sequences were used to generate binding models. Negative binding energy is plotted such that bases above the x-axis are preferred bases and bases below the x-axis are unfavorable bases. Constant bases (TAA) carried no information are drawn at arbitrary height in gray.
Figure 1—figure supplement 1

Multi-omics approach to investigate the functional consequences of dominant disease mutations on CRX regulatory activities and photoreceptor development.
Human retinopathy associated CRX homeodomain (HD) mutant is first tested in vitro for HD–DNA interactions by Spec-seq. Quantitative binding models are generated for wild-type (WT) and mutant HDs. Each mutation is then introduced into endogenous mCrx locus to generate human mutation knock-in mouse models. ChIP-seq is employed to characterize CRX chromatin binding in WT and mutant mouse retinas. Bulk RNA-seq is then applied to determine transcriptomic changes in developing (P10) and mature (P21) photoreceptors (PRs) in both WT and mutant mouse retinas. Last, phenotypic characterization on retinal morphology and visual functions is carried out to understand the consequences of mutant CRX chromatin binding and associated transcriptomic alterations.
Figure 1—figure supplement 2

Reversed-strand Spec-seq library showed similar changes in mutant CRX homeodomain (HD) DNA-binding specificity.
(A) Native sodium dodecyl sulfate–polyacrylamide gel electrophoresis (SDS–PAGE) gel image of affinity-purified empty GST tag and GST-CRX HDs. Relative binding energy comparison from two different experiments for R90W HD (B), E80A HD (C), and K88N HD (D) on the same Spec-seq library as in Figure 1. (E–L) Spec-seq experiments of a second library with the TAANNN sites on the reverse strand show similar results. Relative binding energy comparison from two different experiments for wild-type (WT) HD (E), R90W HD (F), E80A HD (G), and K88N HD (H) on the reversed monomeric library. The identity line is represented in gray dash. The orange dashed line shows the best linear fit to the data. Binding energy models for WT HD (I), R90W HD (J), E80A HD (K), and K88N HD (L) obtained from the reversed monomeric library. Quantitative difference with models obtained from forward-oriented library likely comes from difference in sequences immediately flanking the TAANNN variable region.
-
Figure 1—figure supplement 2—source data 1
- https://cdn.elifesciences.org/articles/87147/elife-87147-fig1-figsupp2-data1-v1.pdf
Figure 2 with 1 supplement
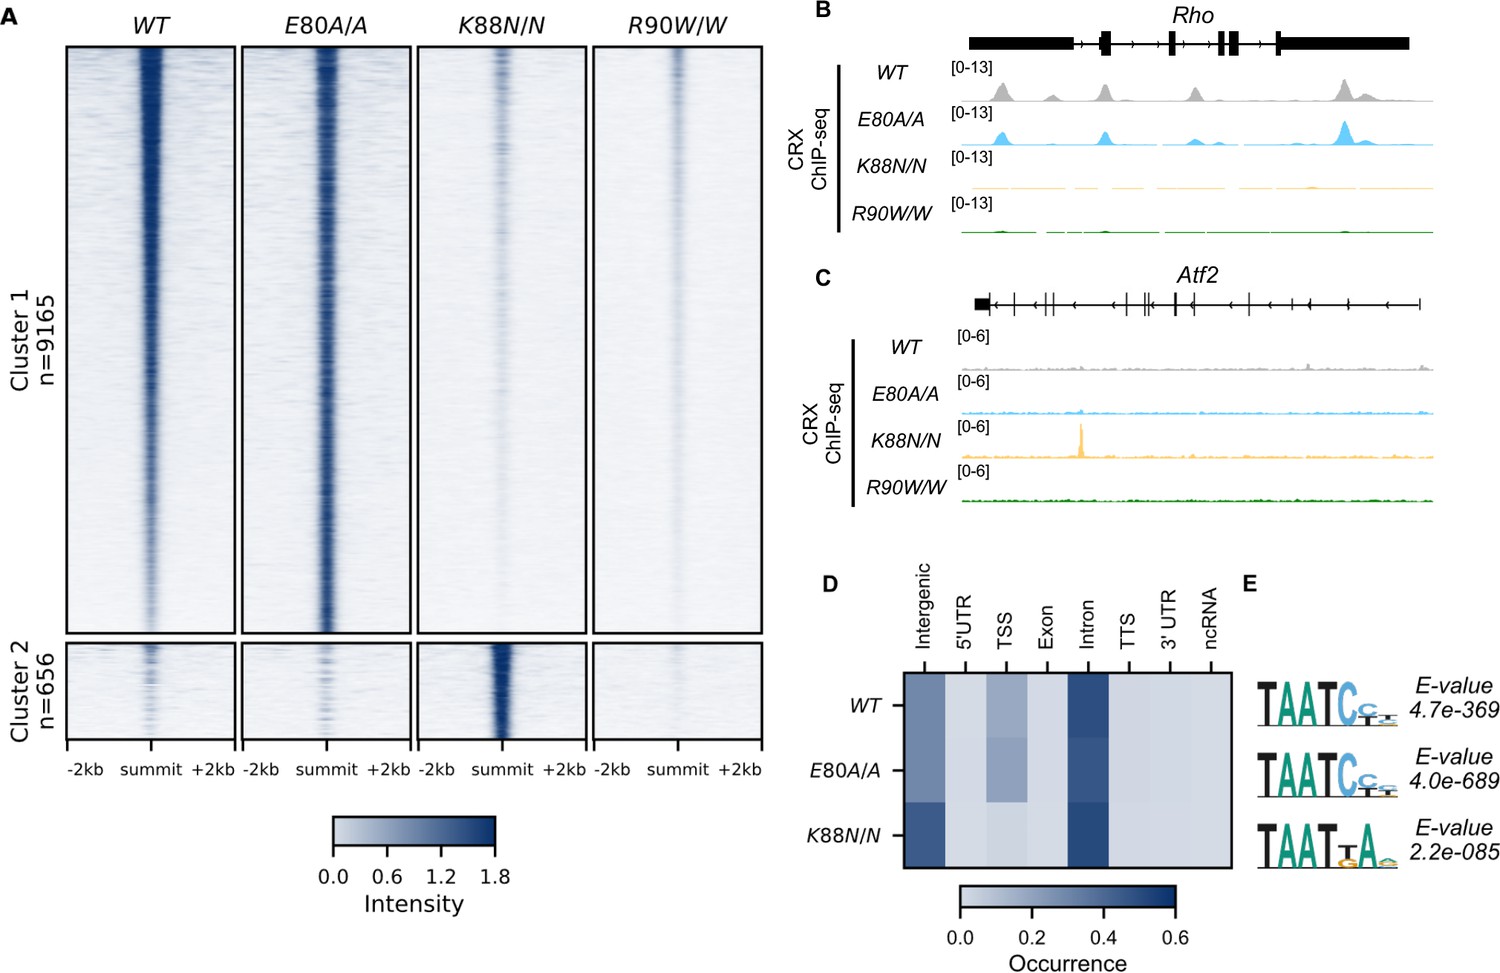
CRX E80A binds to wild-type (WT) sites while CRX K88N occupies novel genomic regions enriched for N88 homeodomain (HD) motif in vivo.
(A) Enrichment heatmap depicting CRX ChIP-seq normalized reads centered at all possible CRX peaks ±2 kb, sorted by binding intensity in WT samples. Clusters were defined by hierarchical clustering of CRX-binding intensity matrix from all genotypes (Materials and methods). (B, C) Genome browser representations of ChIP-seq normalized reads for different CRX species in P14 WT and mutant mouse retinas at Rho and Atf2. (D) Enrichment heatmap showing fraction of CRX ChIP-seq peaks fall in different genomic environments. (E) Logo representations of de novo found short HD motifs under CRX ChIP-seq peaks in WT and mutant mouse retinas with DREME E-value on the right.
Figure 2—figure supplement 1
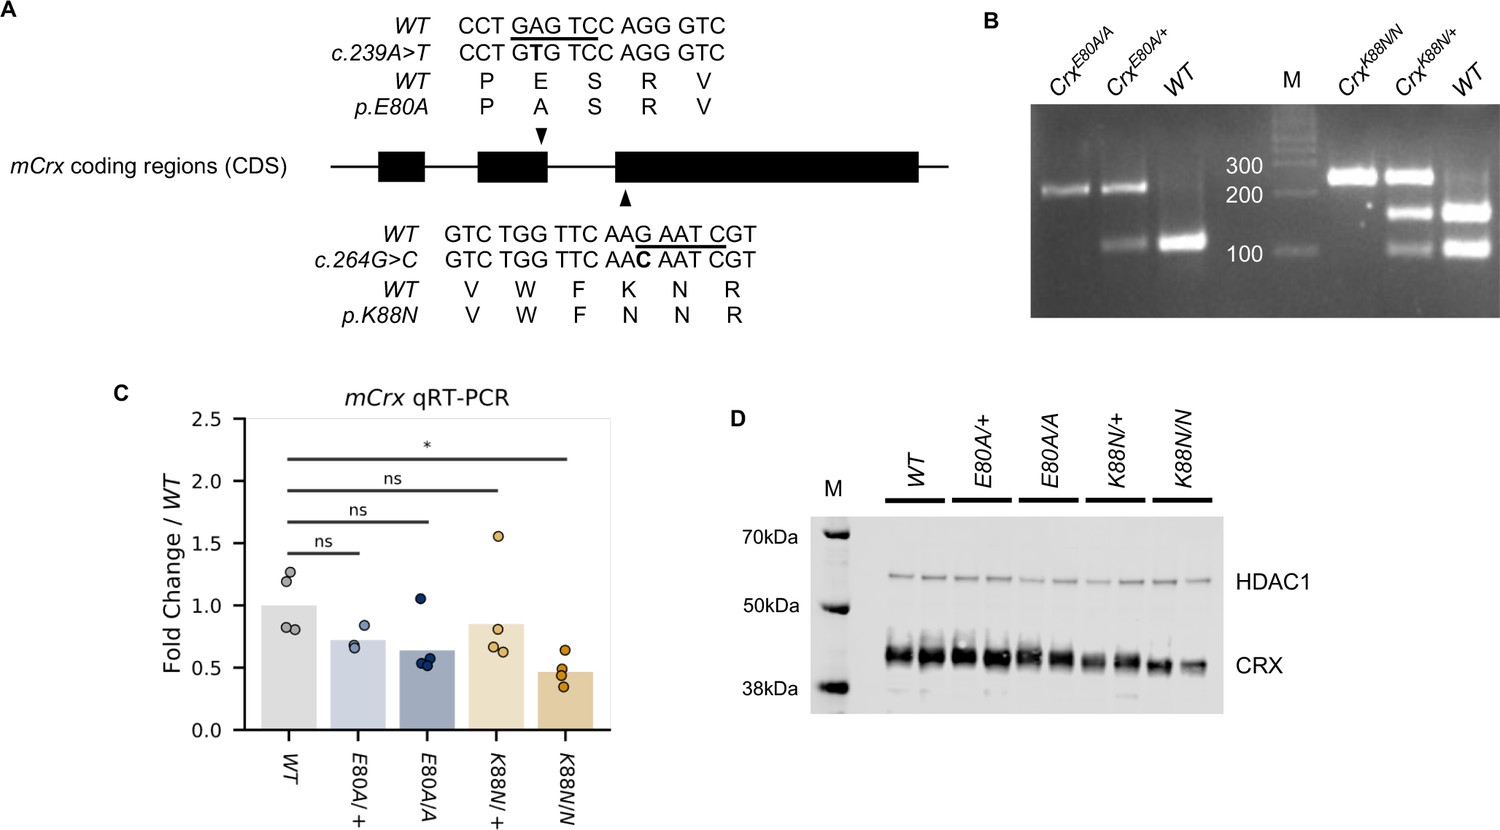
Wild-type (WT) and mutation knock-in mouse CRX sequences and genotyping identifications.
(A) Alignment of mCrx cDNA and protein sequences showing the nucleotide substitutions and amino acid changes of CrxE80A (top) and CrxK88N (bottom) alleles. Only coding regions of mCrx exons are shown and the diagram is not to scale. Underlined bases in WT sequences indicate the restriction enzyme HinfI cut sites used in the genotyping PCR. (B) Representative mutation knock-in mouse genotyping gel image. (C) Barchart and stripplot showing mCrx mRNA expression levels in P14 WT and mutant mouse retinas. p-values for one-way analysis of variance (ANOVA) with Turkey honestly significant difference (HSD) test are indicated. (D) Immunoblots of nuclear extracts obtained from P14 WT and mutant mouse retinas showing that full-length CRX protein are produced and localized to the nucleus fraction in all mutant mouse retinas. HDAC1 was used as a loading control.
-
Figure 2—figure supplement 1—source data 1
- https://cdn.elifesciences.org/articles/87147/elife-87147-fig2-figsupp1-data1-v1.pdf
Figure 3 with 2 supplements
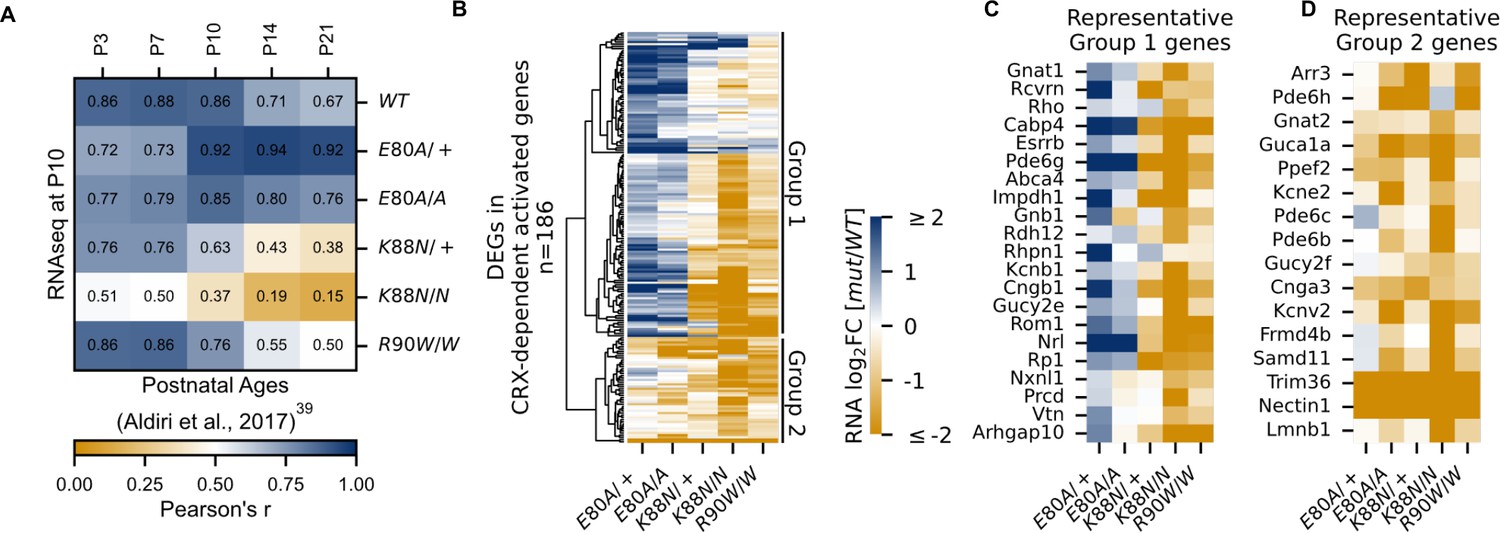
CRX-dependent activated genes affected in opposite directions in developing CrxE80A and CrxK88N mutant retinas.
(A) Heatmap showing sample-wise Pearson correlations of the expression of all CRX-dependent activated genes between P10 wild-type (WT) and homeodomain (HD) mutant mouse retinas in this study (rows) with postnatal WT retinas from age P3 to P21 (columns, data from GSE87064). (B) Heatmap showing the expression changes of DEGs in CRX-dependent activated gene set in HD mutant mouse retinas at P10. (C, D) Heatmaps showing expression changes of selected photoreceptor genes from Groups 1 and 2. Color scale identical to (B).
Figure 3—figure supplement 1
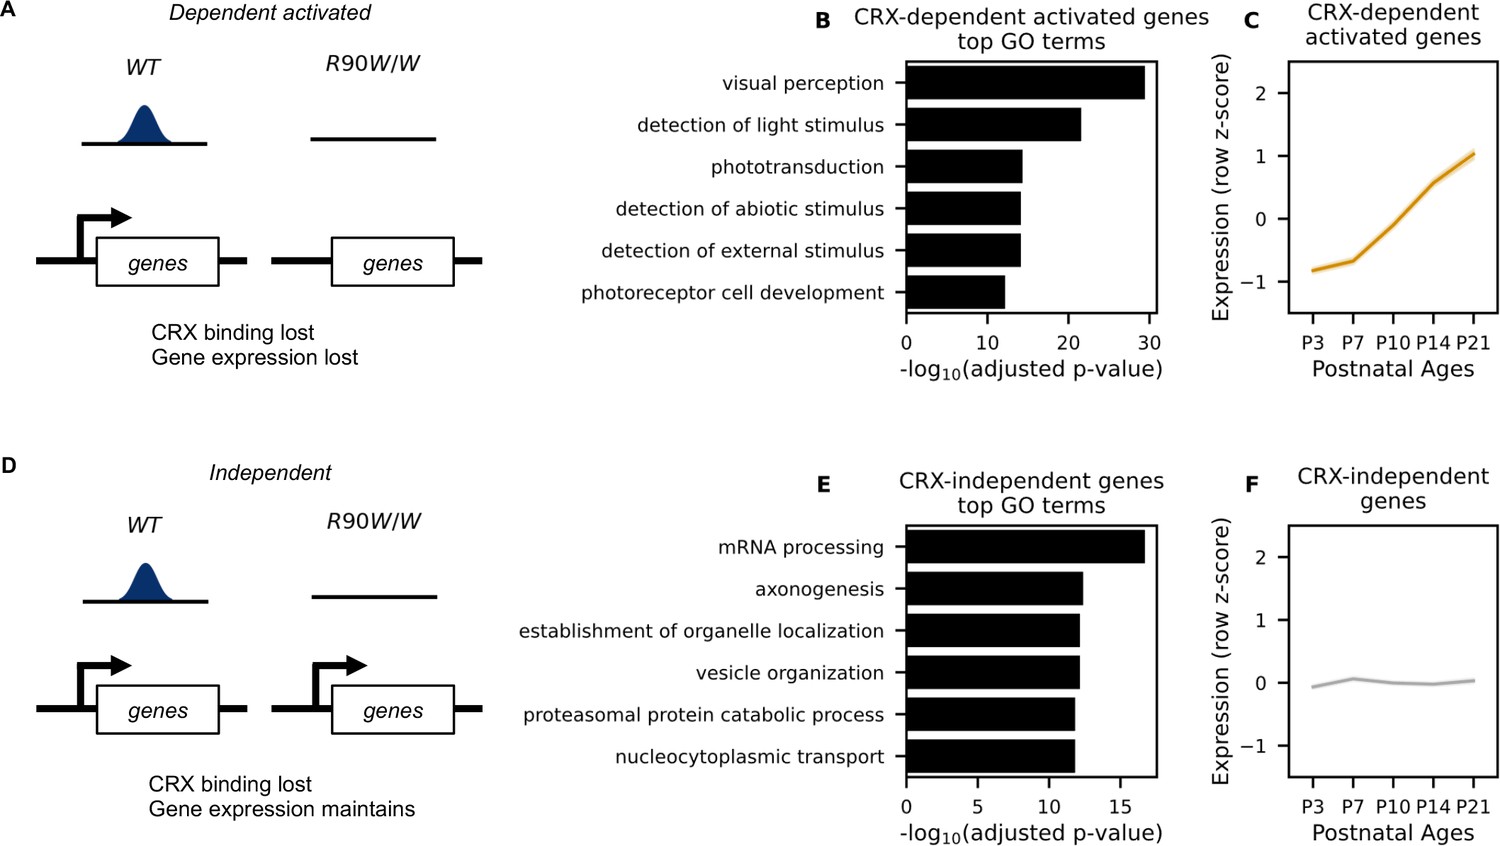
Definition of CRX-dependent activated and CRX-independent gene sets.
(A) Schematic representation of CRX-dependent activated genes where CRX binding nearby is required for the expression of these genes in mature wild-type (WT) retinas. (B) Top gene ontology (GO) terms associated with CRX-dependent activated genes. Benjamini–Hochberg adjusted p-values are shown. (C) Line plot showing average expression pattern of CRX-dependent activated genes during normal postnatal retina. (D) Definition of CRX-independent genes where CRX binding nearby is dispensable for the expression of these genes in mature WT retinas. (E) Top GO terms associated with CRX-independent genes. (F) Line plot showing average expression pattern of CRX-independent genes during normal retina development. RNA-seq data in (C) and (F) were retrieved from Aldiri et al., 2017 (GEO accession: GSE87064).
Figure 3—figure supplement 2

E80A and K88N mutation each causes novel gene expression changes in the CRX-independent category.
(A) Strip plots showing normalized CRX ChIP-seq intensity at peaks associated with Group 1 or 2 genes in wild-type (WT) and CRX mutant mouse retinas. p-values for two-sided Mann–Whitney U-test are indicated. (B) Venn diagram showing the overlap of genes differentially expressed (DEGs) in CrxE80A (pale blue) and CrxK88N (pale yellow) but not in CrxR90W/W (gray) mutant retinas. For DEGs in CrxE80A and CrxK88N mutants, genes that were differentially expressed in either heterozygotes or homozygotes, or both were counted. (C) Heatmap showing the expression changes of CRX-independent genes that are DEGs in at least one of the CrxE80A mutants (n = 244, left). Heatmap on the right shows the expression pattern of these genes during normal postnatal development (data from GEO: GSE87064). (D) Table showing selected genes downregulated in CrxE80A mutants that have been implicated in cell differentiation or photoreceptor development. (E) Heatmap showing the expression changes of CRX-independent genes that are DEGs in at least one of the CrxK88N mutants (n = 351, left). Heatmap on the right shows the expression pattern of these genes during normal postnatal development (data from GEO: GSE87064). (F) Barchart showing gene ontology (GO) term enrichment of DEGs in CrxK88N mutants.
Figure 4 with 1 supplement
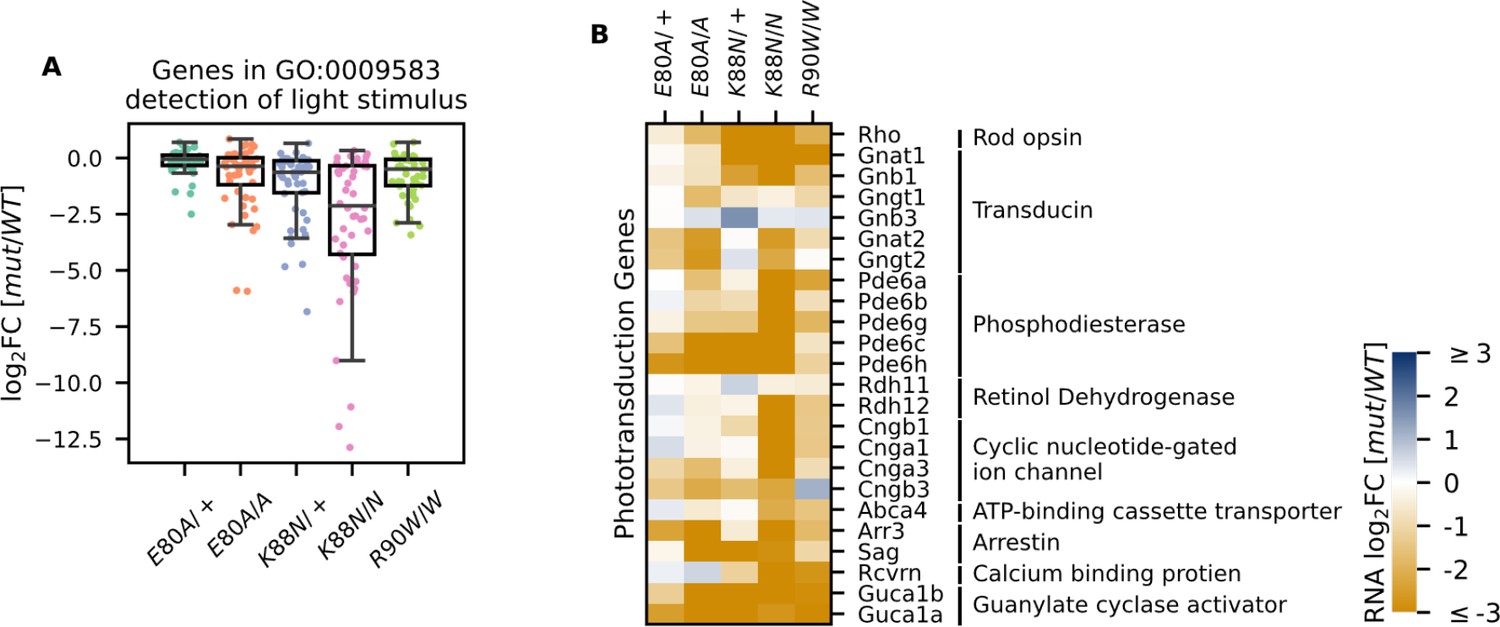
Photoreceptor genes important for phototransduction are downregulated in all homeodomain (HD) mutants.
(A) Box plot showing that genes in the detection of light stimulus gene ontology (GO) term were downregulated and affected to various degrees in different adult (P21) HD mutant mouse retinas. (B) Heatmap showing that expression of both cone and rod phototransduction genes were downregulated in adult (P21) HD mutant mouse retinas. Annotation of rod and cone enrichment of each gene is in Supplementary file 1f. See Figure 4—figure supplement 1 for the developmental expression dynamics of these genes.
Figure 4—figure supplement 1

Developmental expression pattern of phototransduction genes in WT animals.
(A) Parallel coordinates plot showing expression pattern of genes in GO:0009583 during normal postnatal retina development (data from GEO: GSE87064). Row z-score is shown. (B) Heatmap showing expression patterns of phototransduction genes during normal postnatal retina development (data from GEO: GSE87064). Row z-score is shown.
Figure 5
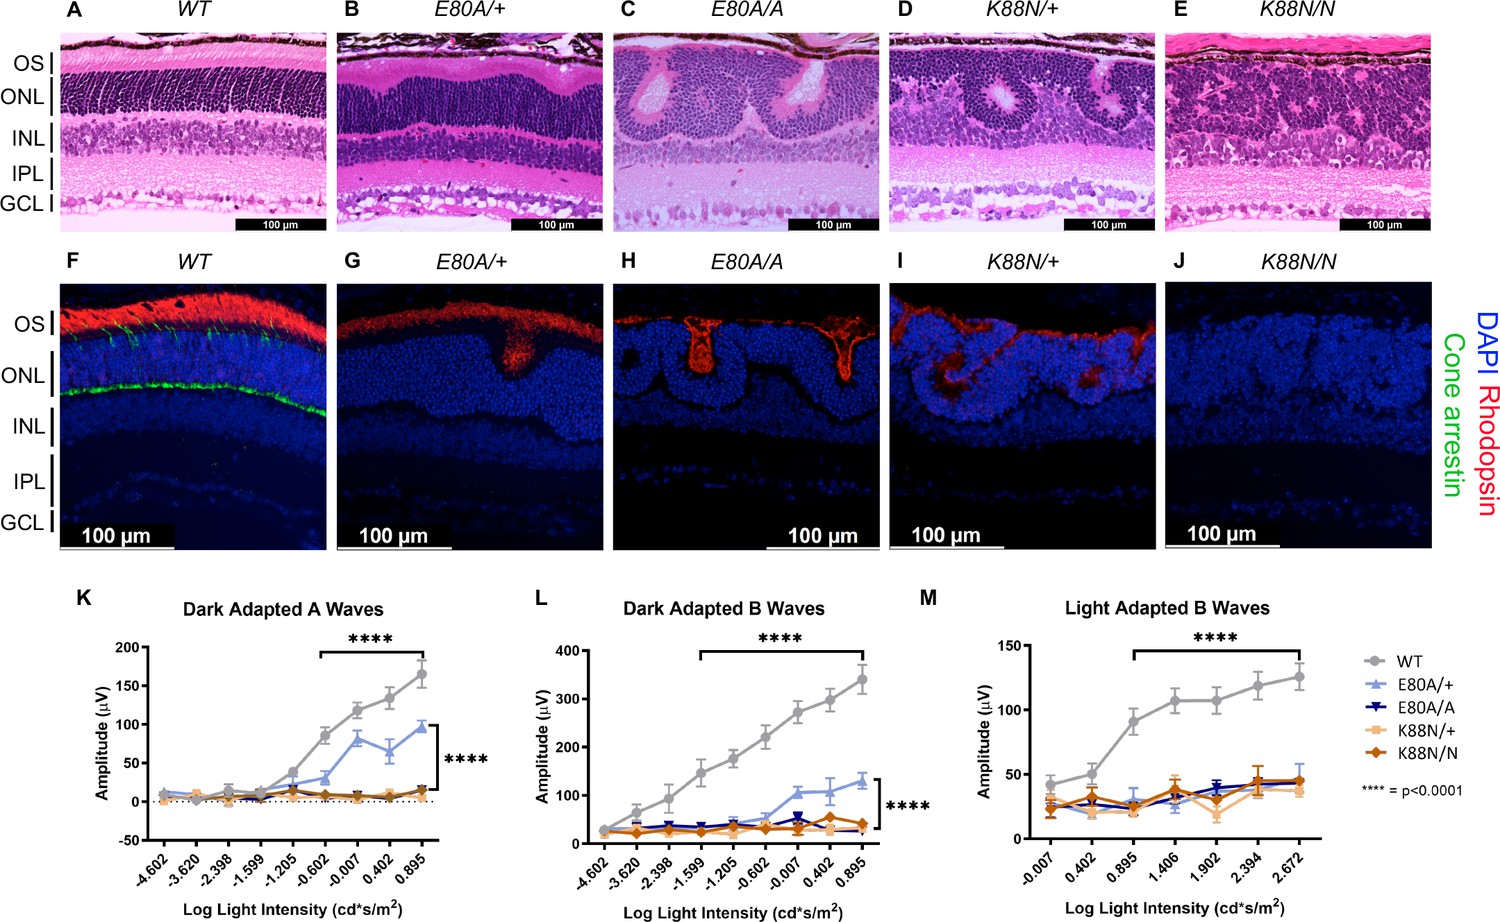
Only CrxE80A/+ retinas maintain photoreceptor OS and residual rod electroretinogram (ERG) response.
(A–E) Hematoxylin–eosin (H&E) staining of P21 retina sections show that photoreceptor OS layer is absent in all mutant retinas except CrxE80A/+. OS: outer segment; ONL: outer nuclear layer; INL: inner nuclear layer; IPL: inner plexiform layer; GCL: ganglion cell layer. Scale bar, 100 µm. (F–J) Rhodopsin (RHO, red) immunostaining is present in CrxE80A/+, CrxE80A/A, and CrxK88N/+ retinas and absent in CrxK88N/N retina. Cone arrestin (mCAR, green) immunostaining is absent in all mutant retinas. Nuclei were visualized by (4',6-diamidino-2-phenylindole) DAPI staining (blue). Scale bar, 100 µm. (K–M) The ERG responses recorded from 1 month mice. Error bars represent the standard error of the mean (SEM, n ≥ 4). p-value: Two-way analysis of variance (ANOVA) and Tukey’s multiple comparisons. ****p ≤ 0.0001. ns: >0.05.
Figure 6 with 1 supplement
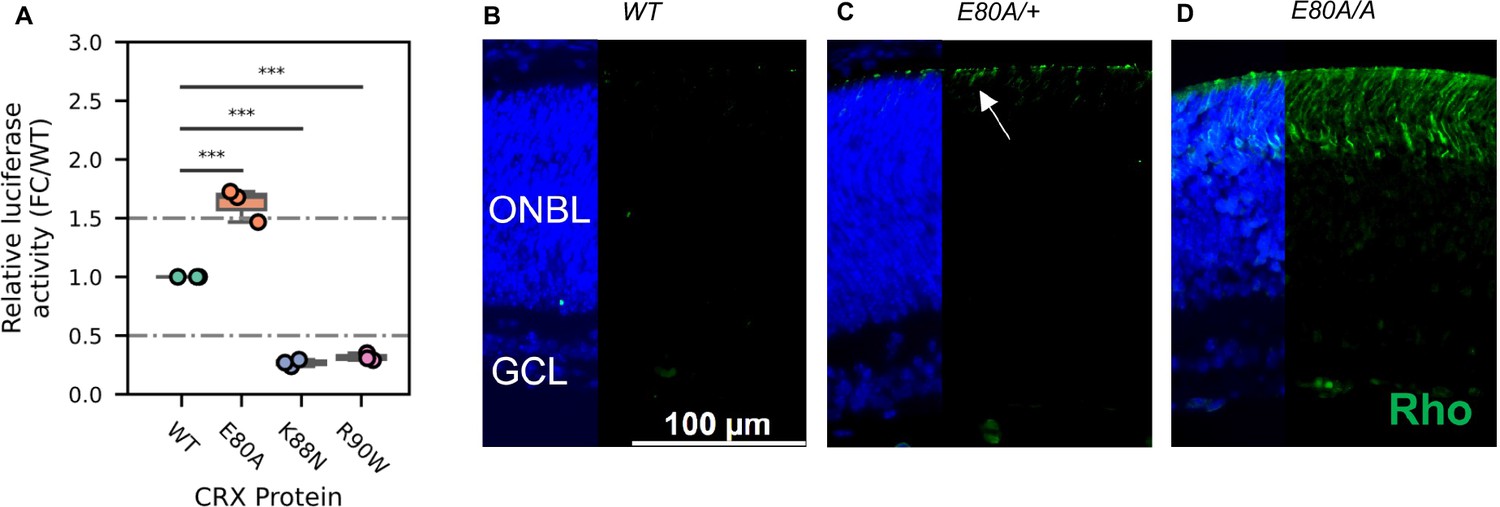
CRX E80A hyperactivity underlies precocious photoreceptor differentiation in CrxE80A retinas.
(A) Boxplot showing luciferase reporter activities of different CRX variants. p-values for one-way analysis of variance (ANOVA) with Turkey honestly significant difference (HSD) test are indicated. (B–D) Rhodopsin (RHO, green) immunostaining is absent in P3 wild-type (WT) retina but detected in CrxE80A/+ and CrxE80A/A retinas. Nuclei are visualized by DAPI staining (blue). Arrow indicates the sporadic RHO staining in CrxE80A/+ sample. ONBL: outer neuroblast layer; GCL: ganglion cell layer. Scale bar, 100 µm.
Figure 6—figure supplement 1
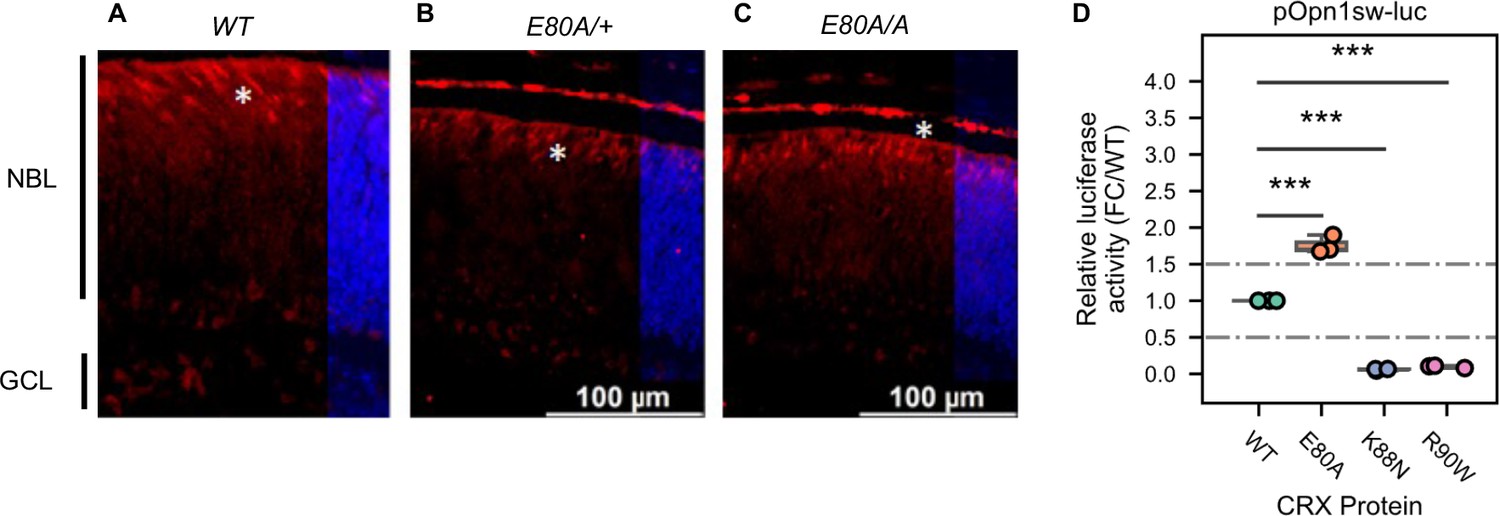
Cone photoreceptors born in CrxE80A retinas and hyperactivity of CRX E80A at S-opsin promoter.
(A–C) Immunostaining shows that Retinoid X receptor gamma (RXRγ, red), a fated cone photoreceptor marker, is present in P0 WT, CrxE80A/+, and CrxE80A/A retinas. Nuclei are visualized by DAPI staining (blue). Asterisks indicate examples of RXRG+ cells. NBL: neuroblast layer; GCL: ganglion cell layer. Scale bar, 100 µm. (D) Boxplot showing luciferase reporter activities of different CRX variants at the Opn1sw promoter sequences. p-values for one-way analysis of variance (ANOVA) with Turkey honestly significant difference (HSD) test are indicated.
Figure 7
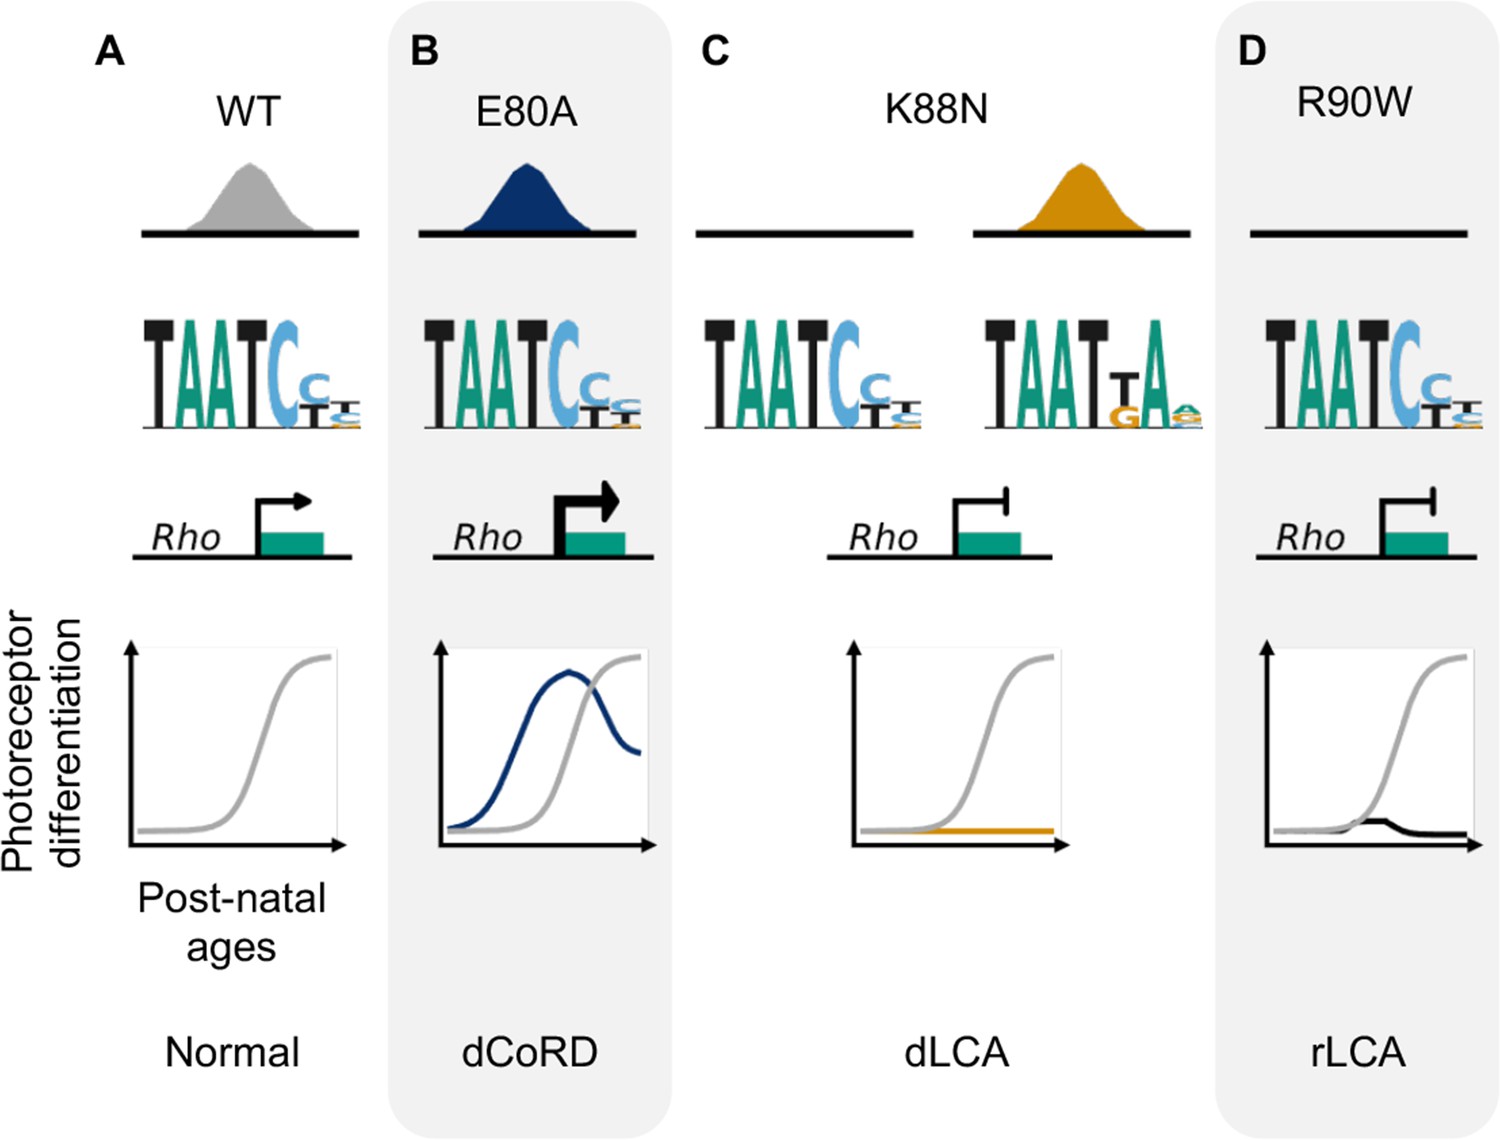
Missense mutations in CRX homeodomain (HD) affect photoreceptor gene expression and lead to distinct retinal disease phenotypes through gain- and loss-of-function mechanisms.
dCoRD: dominant cone–rod dystrophy; dLCA/rLCA: dominant/recessive Leber congenital amaurosis.
Tables
Key resources table
| Reagent type (species) or resource | Designation | Source or reference | Identifiers | Additional information |
|---|---|---|---|---|
| Gene (Homo sapiens) | CRX | HGNC | HGNC:2383 | |
| Gene (M. musculus) | Crx | MGI | MGI:1194883 | |
| Strain, strain background (Escherichia coli) | BL21 (DE3) | MilliporeSigma | CMC0016 | Electrocompetent cells |
| Genetic reagent (M. musculus) | WT (C57BL/6J) | The Jackson Laboratory | Cat #000664 | |
| Genetic reagent (M. musculus) | CrxE80A (C57BL/6J) | This paper | See Materials and methods | |
| Genetic reagent (M. musculus) | CrxK88N (C57BL/6J) | This paper | See Materials and methods | |
| Genetic reagent (M. musculus) | CrxR90W (C57BL/6J) | Tran et al., 2014 | ||
| Cell line (Homo sapiens) | HEK293T | ATCC | CRL-3216 | |
| Antibody | anti-CRX A-9 (mouse monoclonal) | Santa Cruz Biotechnology | sc-377138 | ChIP: 6 µg per 400 µl reaction |
| Antibody | anti-CRX M02 (mouse monoclonal) | Abnova Corp. | H00001406-M02 | WB: 1:1000 |
| Antibody | anti-HDAC1 H51 (rabbit polyclonal) | Santa Cruz Biotechnology | sc-7872 | WB: 1:1000 |
| Antibody | anti-mCAR (rabbit polyclonal) | MilliporeSigma | AB15282 | IH: 1:200 |
| Antibody | anti-RHO (mouse monoclonal) | MilliporeSigma | O4886 | IH: 1:200 |
| Antibody | Anti-RXRγ Y-20 (rabbit polyclonal) | Santa Cruz Biotechnology | sc-555 | IH: 1:100 |
| Antibody | IRDye 680RD Goat anti-Rabbit IgG Secondary Antibody (mouse polyclonal) | LI-COR | 926-68071 | WB: 1:10,000 |
| Antibody | IRDye 800CW Goat anti-Mouse IgG Secondary Antibody (mouse polyclonal) | LI-COR | 926-32210 | WB: 1:10,000 |
| Commercial assay or kit | Amicon Ultra-0.5 Centrifugal Filter Unit | Millipore | UFC500324 | |
| Commercial assay or kit | Dual-Luciferase Reporter Assay System | Promega | E1910 | |
| Commercial assay or kit | GST SpinTrap | Cytiva | 28952359 | |
| Commercial assay or kit | iScript Reverse Transcription Supermix | Bio-Rad Laboratories | 1708841 | |
| Commercial assay or kit | MEGAshortscript T7 Transcription Kit | Thermo Fisher Scientific | AM1354 | |
| Commercial assay or kit | MinElute PCR Purification Kit | QIAGEN | 28006 | |
| Commercial assay or kit | NE-PER Nuclear and Cytoplasmic Extraction Reagents | Thermo Scientific | 78833 | |
| Commercial assay or kit | Novex WedgeWell 12% Tris-Glycine Mini Protein Gels | Invitrogen | XP00122BOX | |
| Commercial assay or kit | NuPAGE 4 to 12%, Bis-Tris Mini Protein Gels | Invitrogen | NP0322BOX | |
| Commercial assay or kit | Phusion High-Fidelity PCR Master Mix with HF Buffer | New England Biolabs | M0531S | |
| Commercial assay or kit | SsoFast EvaGreen Supermix with Low ROX | Bio-Rad Laboratories | 1725211 | |
| Chemical compound, drug | Atropine sulfate solution | Bausch and Lomb | NDC 24208-825-55 | |
| Chemical compound, drug | Chameleon Duo Pre-stained Protein Ladder | LI-COR | 928-60000 | |
| Chemical compound, drug | Dithiothreitol (DTT) | Bio-Rad Laboratories | 1610611 | |
| Chemical compound, drug | Exonuclease I (E. coli) | New England Biolabs | M0293S | |
| Chemical compound, drug | Gibco Dulbecco’s modified Eagle medium | Thermo Fisher Scientific | 11965084 | |
| Chemical compound, drug | Gibco fetal bovine serum | Thermo Fisher Scientific | 16000044 | |
| Chemical compound, drug | Glutathione Sepharose 4B resin | Cytiva | 17075601 | |
| Chemical compound, drug | Isopropyl-β-D-thiogalactopyranoside (IPTG) | Thermo Fisher Scientific | BP1755-10 | |
| Chemical compound, drug | Molecular Biology Grade Water | Corning | 46-000-CM | |
| Chemical compound, drug | Penicillin–streptomycin | Thermo Fisher Scientific | 15140122 | |
| Chemical compound, drug | Phosphate-buffered saline | Corning | 46-013-CM | |
| Chemical compound, drug | Roche cOmplete, Mini Protease Inhibitor Cocktail | MilliporeSigma | 11836153001 | |
| Chemical compound, drug | SeeBlue Plus2 Pre-stained Protein Standard | Invitrogen | LC5925 | |
| Chemical compound, drug | Triton X-100 | Sigma-Aldrich | T9284 | |
| Chemical compound, drug | TRIzol Reagent | Invitrogen | 15596026 | |
| Chemical compound, drug | VECTASHIELD HardSet Antifade Mounting Medium with DAPI | Vector Laboratories | H-1500-10 | |
| Software and algorithms | bedtools (v2.27.1) | Quinlan and Hall, 2010 | https://bedtools.readthedocs.io/en/latest/ | |
| Software and algorithms | Bowtie2 (v 2.3.4.1) | Langmead and Salzberg, 2012 | https://bowtie-bio.sourceforge.net/bowtie2/index.shtml | |
| Software and algorithms | BSgenome (v 1.58.0) | Pagès, 2020 | https://bioconductor.org/packages/BSgenome | |
| Software and algorithms | Clustal Omega | Goujon et al., 2010; Sievers et al., 2011 | https://www.ebi.ac.uk/Tools/msa/clustalo/ | |
| Software and algorithms | DAVID (v6.8) | Sherman et al., 2022 | https://david.ncifcrf.gov/ | |
| Software and algorithms | deeptools (v3.0.0) | Ramírez et al., 2016 | https://deeptools.readthedocs.io/en/develop/ | |
| Software and algorithms | DEseq2 (v1.30.1) | Love et al., 2014 | https://bioconductor.org/packages/DESeq2 | |
| Software and algorithms | DiffBind (v3.0.15) | Stark and Brown, 2012; Ross-Innes et al., 2012 | https://bioconductor.org/packages/DiffBind | |
| Software and algorithms | fastcluster (v1.1.26) | Müllner, 2013 | http://danifold.net/fastcluster.html | |
| Software and algorithms | FastQC (v0.11.5) | Andrews, 2010 | http://www.bioinformatics.babraham.ac.uk/projects/fastqc/ | |
| Software and algorithms | GraphPad Prism 8 | GraphPad Software | https://www.graphpad.com/scientific-software/prism/ | |
| Software and algorithms | GREAT (v4.0.4) | McLean et al., 2010 | http://great.stanford.edu/public/html/ | |
| Software and algorithms | HOMER (v4.8) | Software and algorithms | http://homer.ucsd.edu/homer/motif/ | |
| Software and algorithms | IDR framework (v2.0.4) | Li et al., 2011 | https://github.com/nboley/idr; Boley, 2017 | |
| Software and algorithms | IGV Web App | Robinson et al., 2011 | https://igv.org/ | |
| Software and algorithms | Jalview (v2.11.1.7) | Waterhouse et al., 2009 | https://www.jalview.org/ | |
| Software and algorithms | kallisto (v0.46.2) | Bray et al., 2016 | https://github.com/pachterlab/kallisto; Pachter Lab, 2023 | |
| Software and algorithms | logomaker (v0.8) | Tareen et al., 2020 | https://logomaker.readthedocs.io/en/latest/ | |
| Software and algorithms | MACS2 (v2.1.1.20160309) | Zhang et al., 2008 | https://github.com/macs3-project/MACS; MACS3 project team, 2012 | |
| Software and algorithms | matplotlib (v3.5.1) | Hunter, 2007 | https://matplotlib.org/ | |
| Software and algorithms | MEME Suite (v5.0.4) | Bailey et al., 2015 | https://meme-suite.org/meme/index.html | |
| Software and algorithms | rg.Mm.eg.db (v3.12.0) | Carlson, 2019 | https://bioconductor.org/packages/org.Mm.eg.db | |
| Software and algorithms | pandas (v1.4.2) | Reback et al., 2022 | https://pandas.pydata.org/ | |
| Software and algorithms | Picard (v2.21.4) | Broad Institute, 2019 | http://broadinstitute.github.io/picard/ | |
| Software and algorithms | python (v3.9.12) | Van Rossum and Fred, 1995 | https://docs.python.org/3/reference/ | |
| Software and algorithms | R (v4.0.3) | R Core Team, 2020 | ||
| Software and algorithms | rGREAT (v1.19.2) | Gu et al., 2023 | https://bioconductor.org/packages/rGREAT | |
| Software and algorithms | samtools (v1.9) | Li et al., 2009 | http://www.htslib.org/ | |
| Software and algorithms | scikit_posthocs (v0.7.0) | Terpilowski, 2019 | https://scikit-posthocs.readthedocs.io/en/latest/ | |
| Software and algorithms | scipy (v1.8.1) | Virtanen et al., 2020 | https://scipy.org/ | |
| Software and algorithms | seaborn (v0.11.2) | Waskom, 2021 | https://seaborn.pydata.org/ | |
| Software and algorithms | Trim Galore (v0.6.1) | Felix Krueger et al., 2023 | https://github.com/FelixKrueger/TrimGalore/blob/master/Docs/Trim_Galore_User_Guide.md | |
| Software and algorithms | tximport (v1.18.0) | Soneson et al., 2015 | https://bioconductor.org/packages/tximport |
Additional files
-
Supplementary file 1
Supplementary materials.
(a) Homeodomain transcription factor (HD TF) accession numbers (related to Figure 1B). (b) Plasmids and primers for biochemistry experiments. (c) Spec-seq ePWMs (related to Figure 1G, K–M, and Figure 1—figure supplement 2I–L). (d) DNA sequences for mutation knock-in mice generation. (e) CRX-dependent activated genes differentially expressed in at least one mutant mouse model (ordered as in Figure 3B). (f) CRX-independent genes mis-regulated in CrxE80A mutants (ordered as in Figure 3—figure supplement 2C). (g) CRX-independent genes mis-regulated in CrxK88N mutants (ordered as in Figure 3—figure supplement 2E). (h) Annotation for phototransduction genes in Figure 4B. (i) Quantification and statistical analysis (related Figure 2—figure supplement 1C and Figure 3—figure supplement 2A)
- https://cdn.elifesciences.org/articles/87147/elife-87147-supp1-v1.xlsx
-
MDAR checklist
- https://cdn.elifesciences.org/articles/87147/elife-87147-mdarchecklist1-v1.pdf
Download links
A two-part list of links to download the article, or parts of the article, in various formats.
Downloads (link to download the article as PDF)
Open citations (links to open the citations from this article in various online reference manager services)
Cite this article (links to download the citations from this article in formats compatible with various reference manager tools)
Missense mutations in CRX homeodomain cause dominant retinopathies through two distinct mechanisms
eLife 12:RP87147.
https://doi.org/10.7554/eLife.87147.4


