Chromosome-level genome assembly of hadal snailfish reveals mechanisms of deep-sea adaptation in vertebrates
- School of Ecology and Environment, Northwestern Polytechnical University, China
- Institute of Deep-Sea Science and Engineering, Chinese Academy of Sciences, China
- Key Laboratory of Aquatic Biodiversity and Conservation, Institute of Hydrobiology, Chinese Academy of Sciences, China
Figures
Figure 1 with 8 supplements
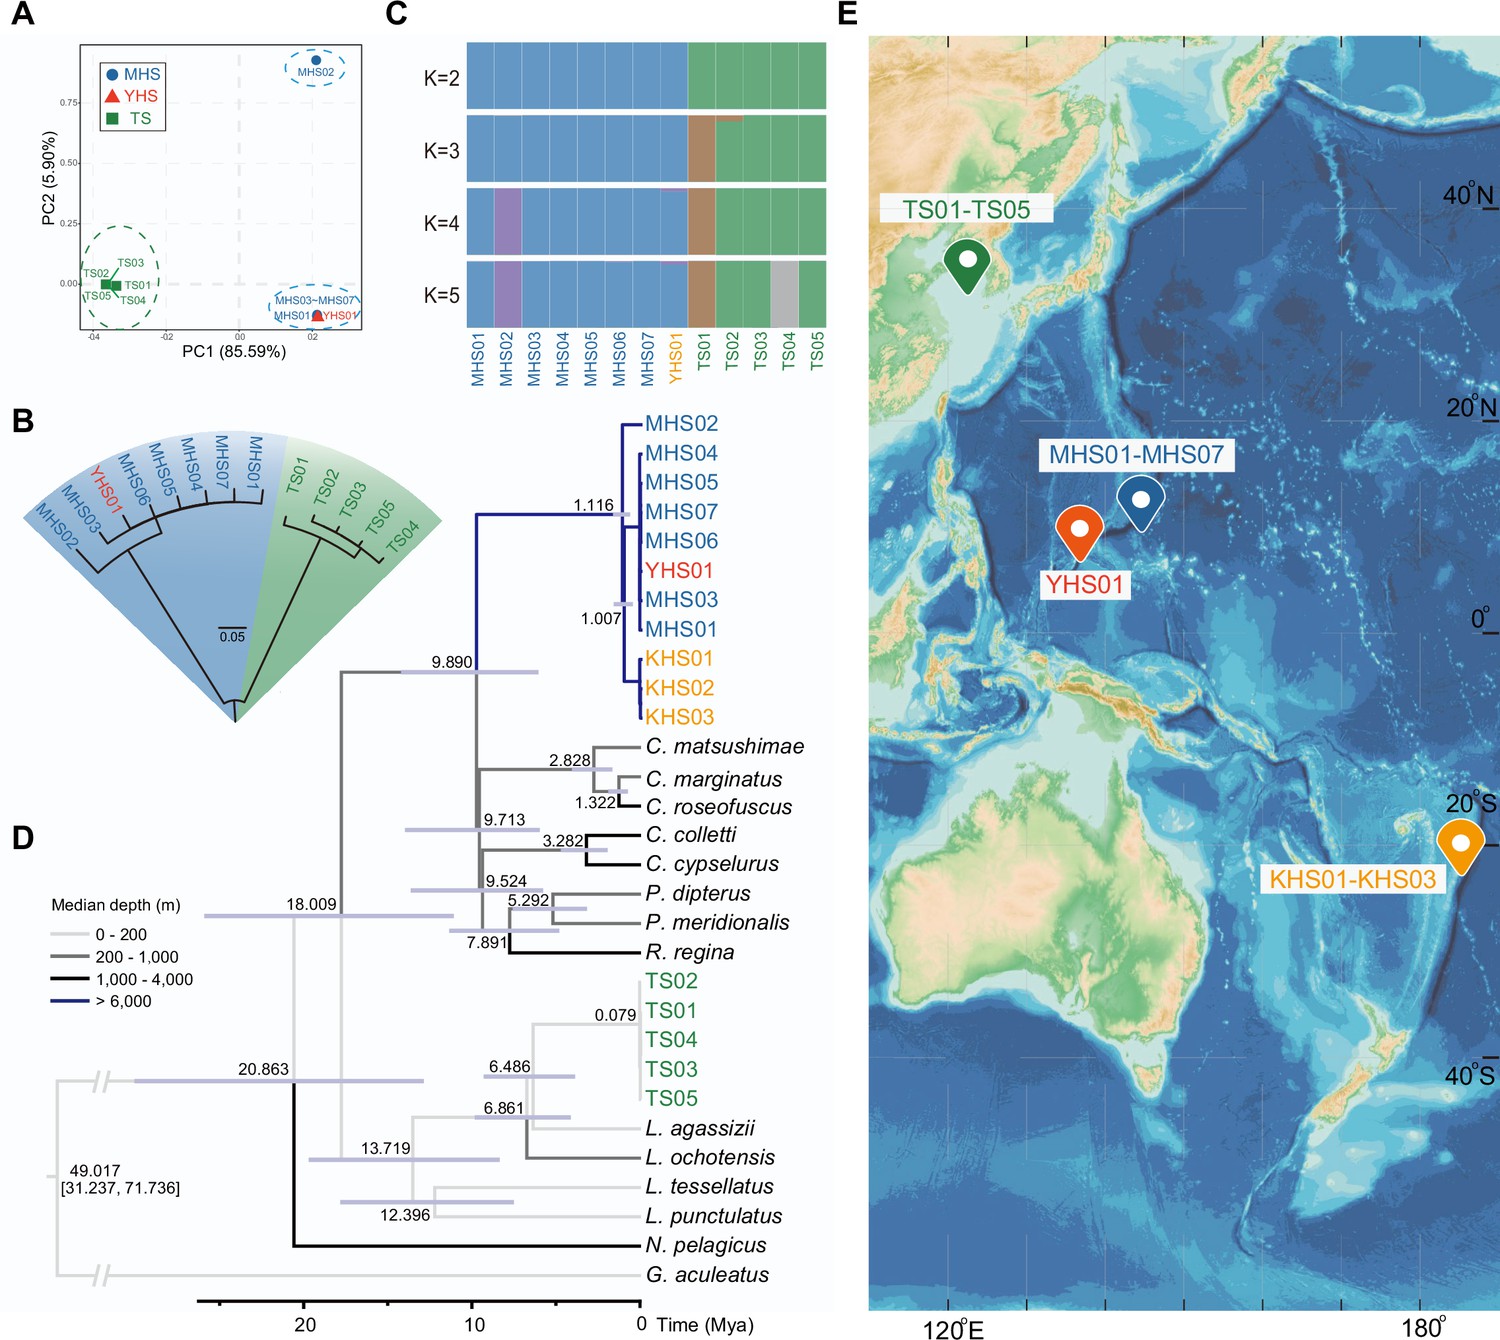
Sampling information of hadal snailfish, and phylogenetic relationships and population structure of resequenced individuals.
(A) Principal component analysis (PCA) of eight hadal snailfish and five Tanaka’s snailfish. PC, principal component; MHS, Mariana hadal snailfish; YHS, Yap hadal snailfish; TS, Tanaka’s snailfish. (B) Neighbor-joining tree analysis of eight hadal snailfish and five Tanaka’s snailfish using SNPs detected in whole-genome resequencing data. (C) Ancestry results from Admixture under the k = 5 model. (D) Maximum likelihood trees constructed with 13 genes encoding mitochondria in these species, where KHS01-KHS03 were constructed using two mitochondrial genes (co1 and cytb) and manually merged with other species. Divergence times are shown in each node, and the color of each branch represents the survival depth of the species. KHS, Notoliparis kermadecensis. (E) Sampling information of hadal snailfish and Tanaka’s snailfish. Blue represents the ocean, the darker the color, the deeper the depth, depth data from GEBCO Compilation Group (2020) GEBCO 2020 Grid (doi:10.5285/a29c5465-b138-234d-e053-6c86abc040b9).
Figure 1—figure supplement 1
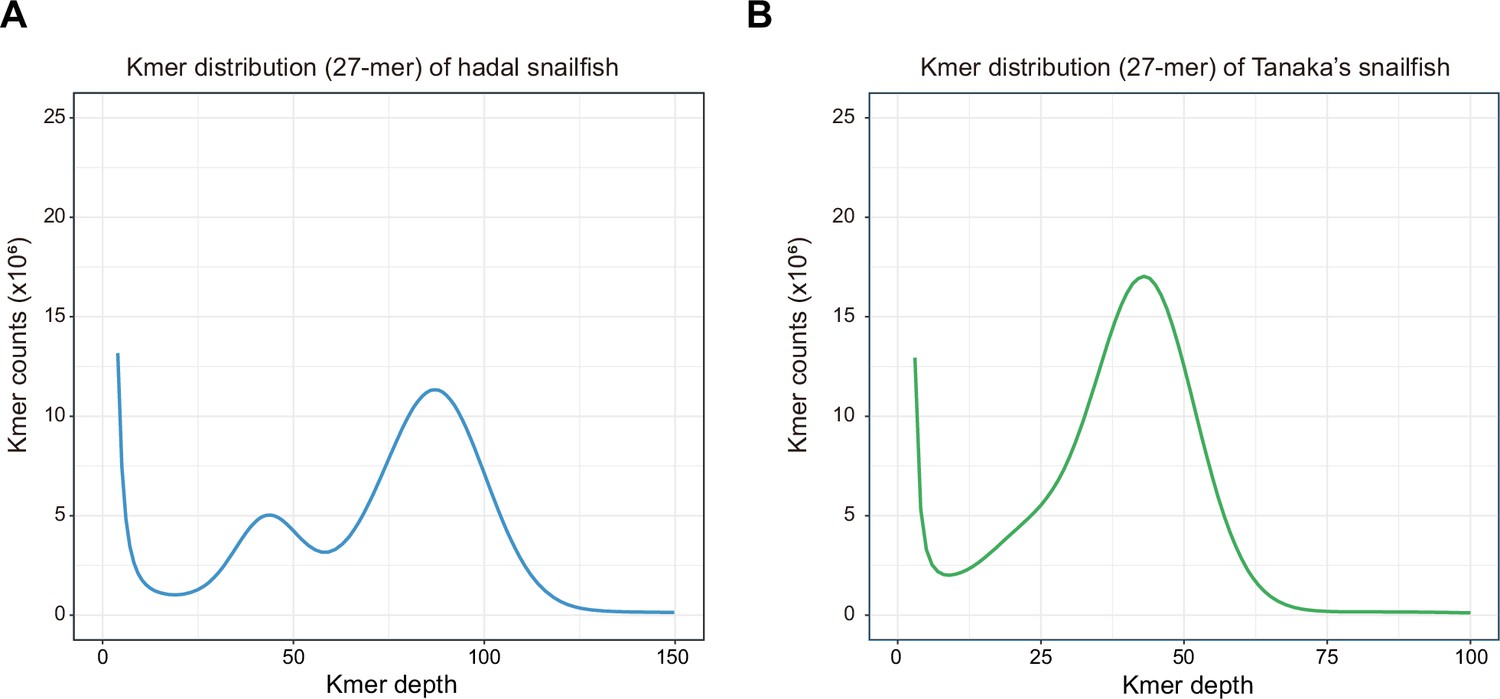
K-mer (k = 27) distribution of the hadal snailfish (A) and Tanaka’s snailfish (B).
Genome size was estimated by: Genome Size = knum/kdepth. The estimated genome size 633.2 Mb for hadal snailfish and 539.9 Mb for Tanaka’s snailfish, respectively.
Figure 1—figure supplement 2

Genome assembly of hadal snailfish (A) and Tanaka’s snailfish (B), both of them assembled 24 chromosomes.
Figure 1—figure supplement 3

Improved genome assembly for hadal snailfish.
(A) Comparison of assembly contiguity in hadal snailfish. The x-axis is the number of scaffolds, and the y-axis is the length of the scaffold as a percentage of the total genome length. HS: the hadal snailfish genome assembled in this work, MHS2019: https://figshare.com/articles/dataset/Genome_assembly_of_Mariana_hadal_snailfish/9782414?file=17520179, YHS: GCA_004335475.1. (B) Length of the gaps and BUSCO genome assessment in each genome assembly. (C) Assessment of heterozygous sequences in different versions of hadal snailfish genome. These sequences largely resulted from assembly redundancy. The horizontal coordinate refers to the read depth, and the vertical coordinate refers to the read occurrence frequency.
Figure 1—figure supplement 4
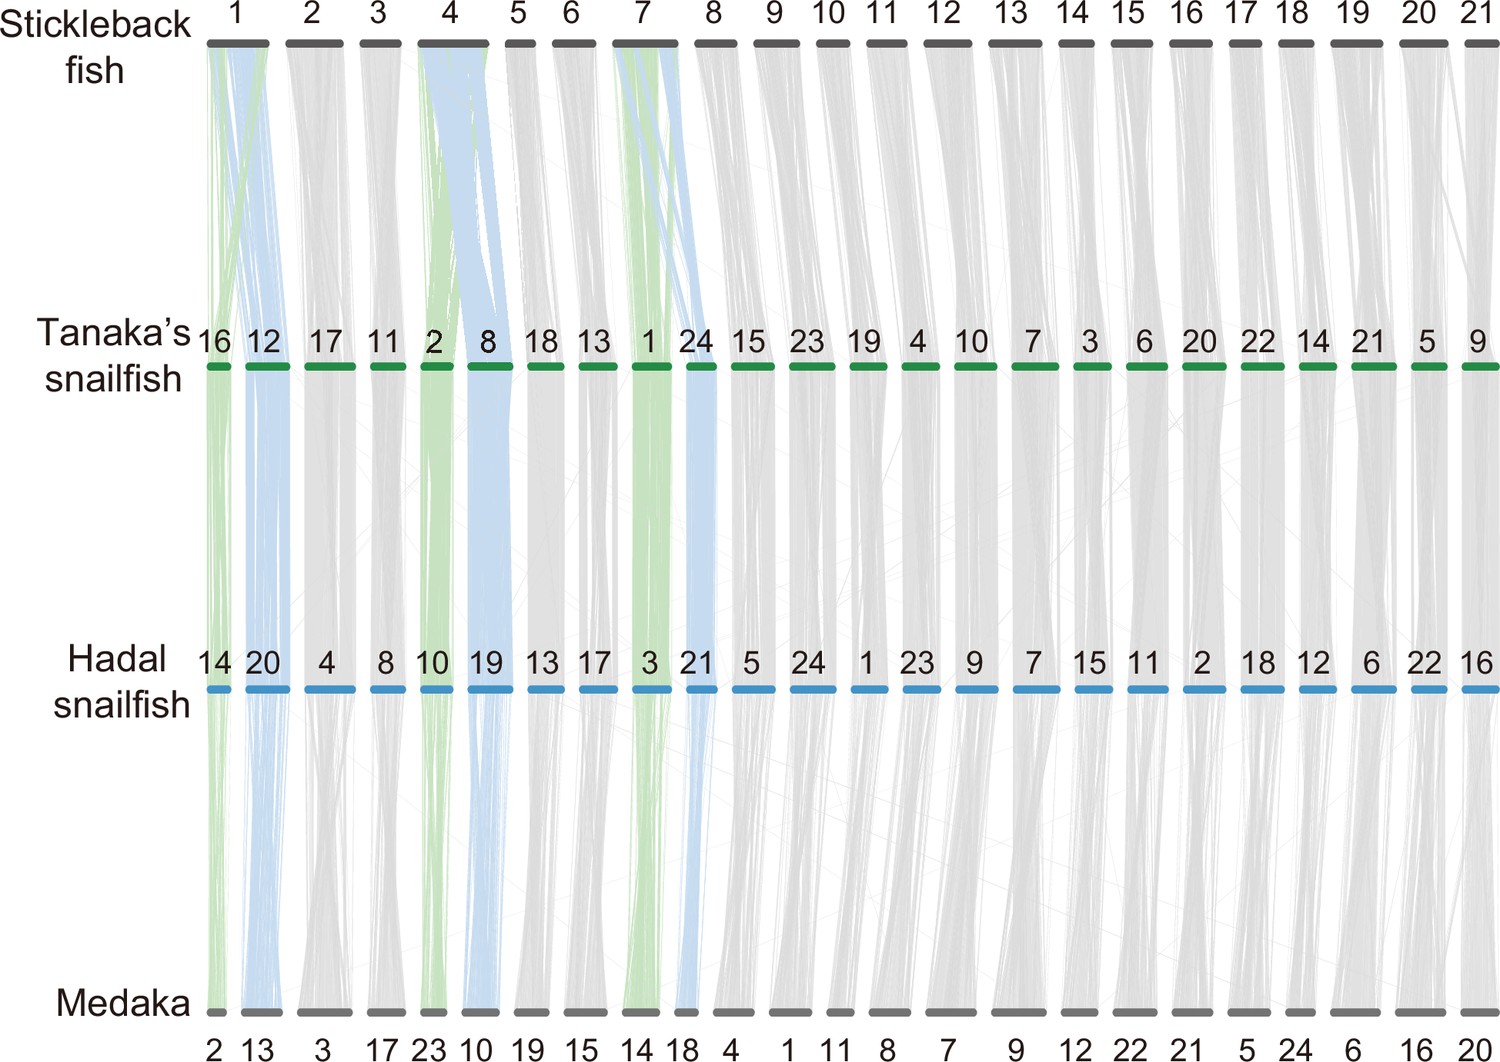
Chromosomal syntenic relationship of hadal snailfish, Tanaka’s snailfish, medaka, and stickleback.
Each line represents a syntenic block of 10 or more zones from the results of LAST with a similarity of 75% or more and length >1000 bp.
Figure 1—figure supplement 5
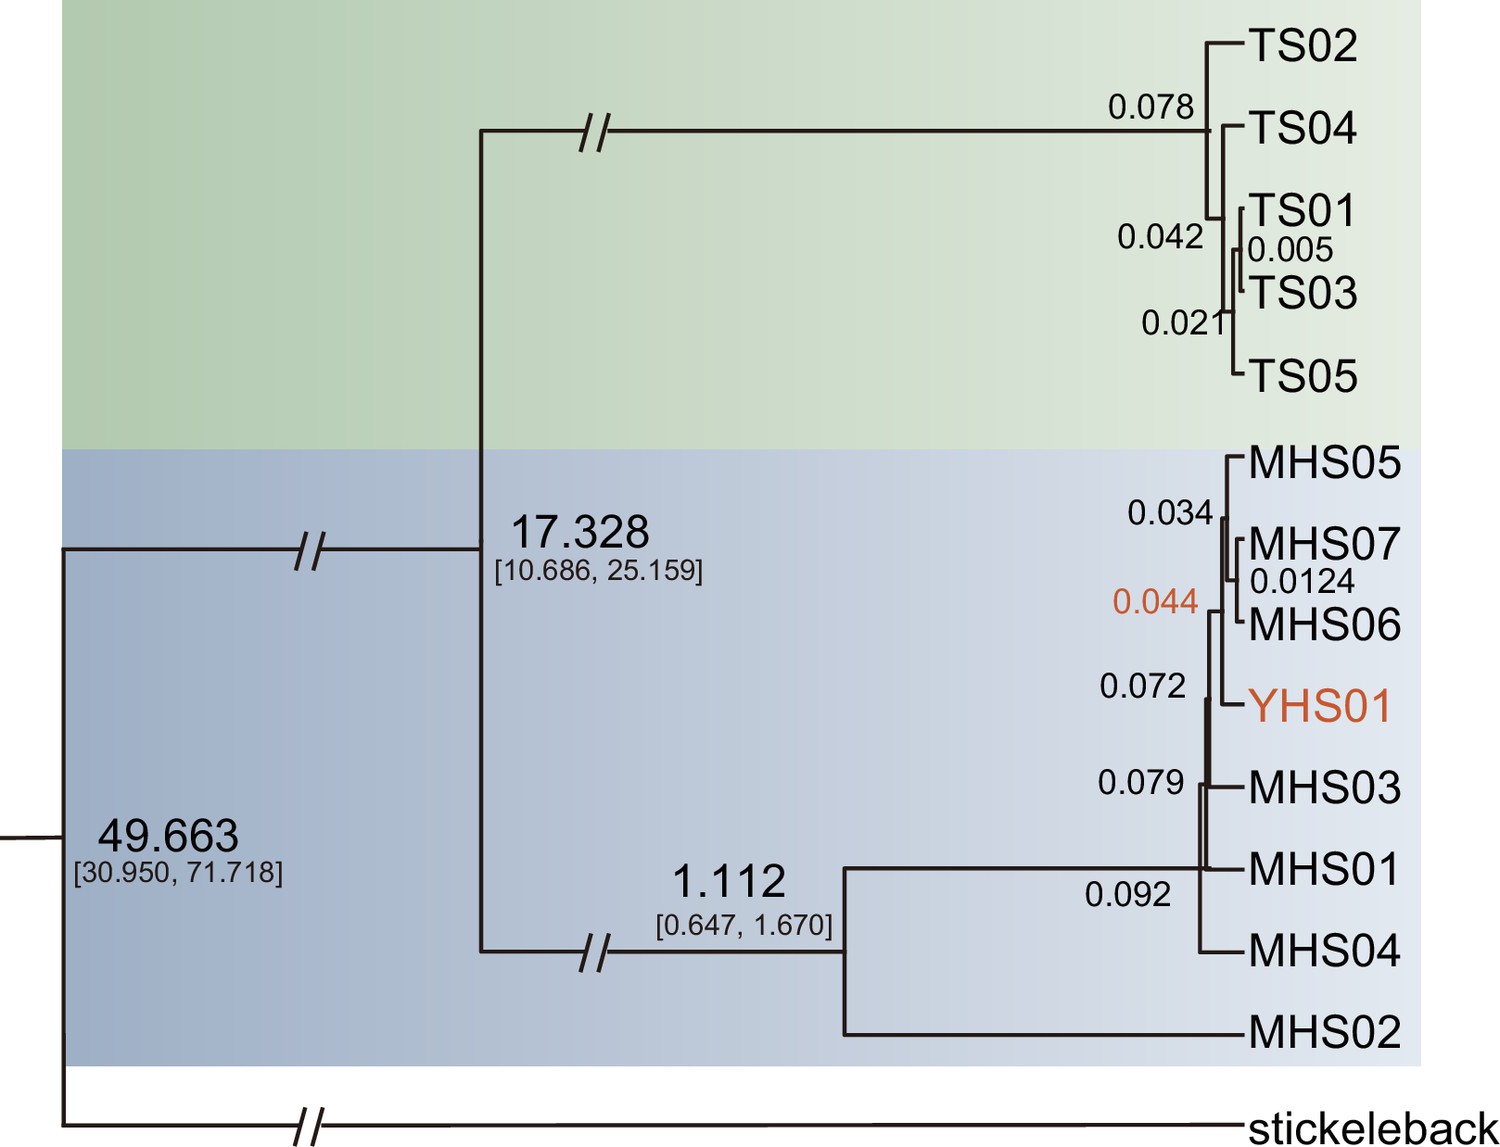
The divergence time between Yap hadal snailfish (YHS) and Mariana hadal snailfish (MHS).
Phylogenetic tree constructed using the coding sequences of 13 mitochondrial genes (atp6, atp8, co1, co2, co3, cytb, nd1, nd2, nd3, nd4, nd4l, nd5, nd6), in which the divergence time between YHS and MHS was 0.044 million years ago.
Figure 1—figure supplement 6

Phylogenetic relationships of the family Liparidae.
(A) Phylogenetic tree constructed using RAxML with the selected parameter ‘-N 100’ based on the coding sequences of co1 and cytb, where the support of Notoliparis kermadecensis (KHS) and Mariana hadal snailfish (MHS) divergence nodes was 95. (B) Phylogenetic tree constructed with the coding sequences of two mitochondrial genes (co1 and cytb), where the divergence between KHS and MHS was 1.0067 million years ago.
Figure 1—figure supplement 7
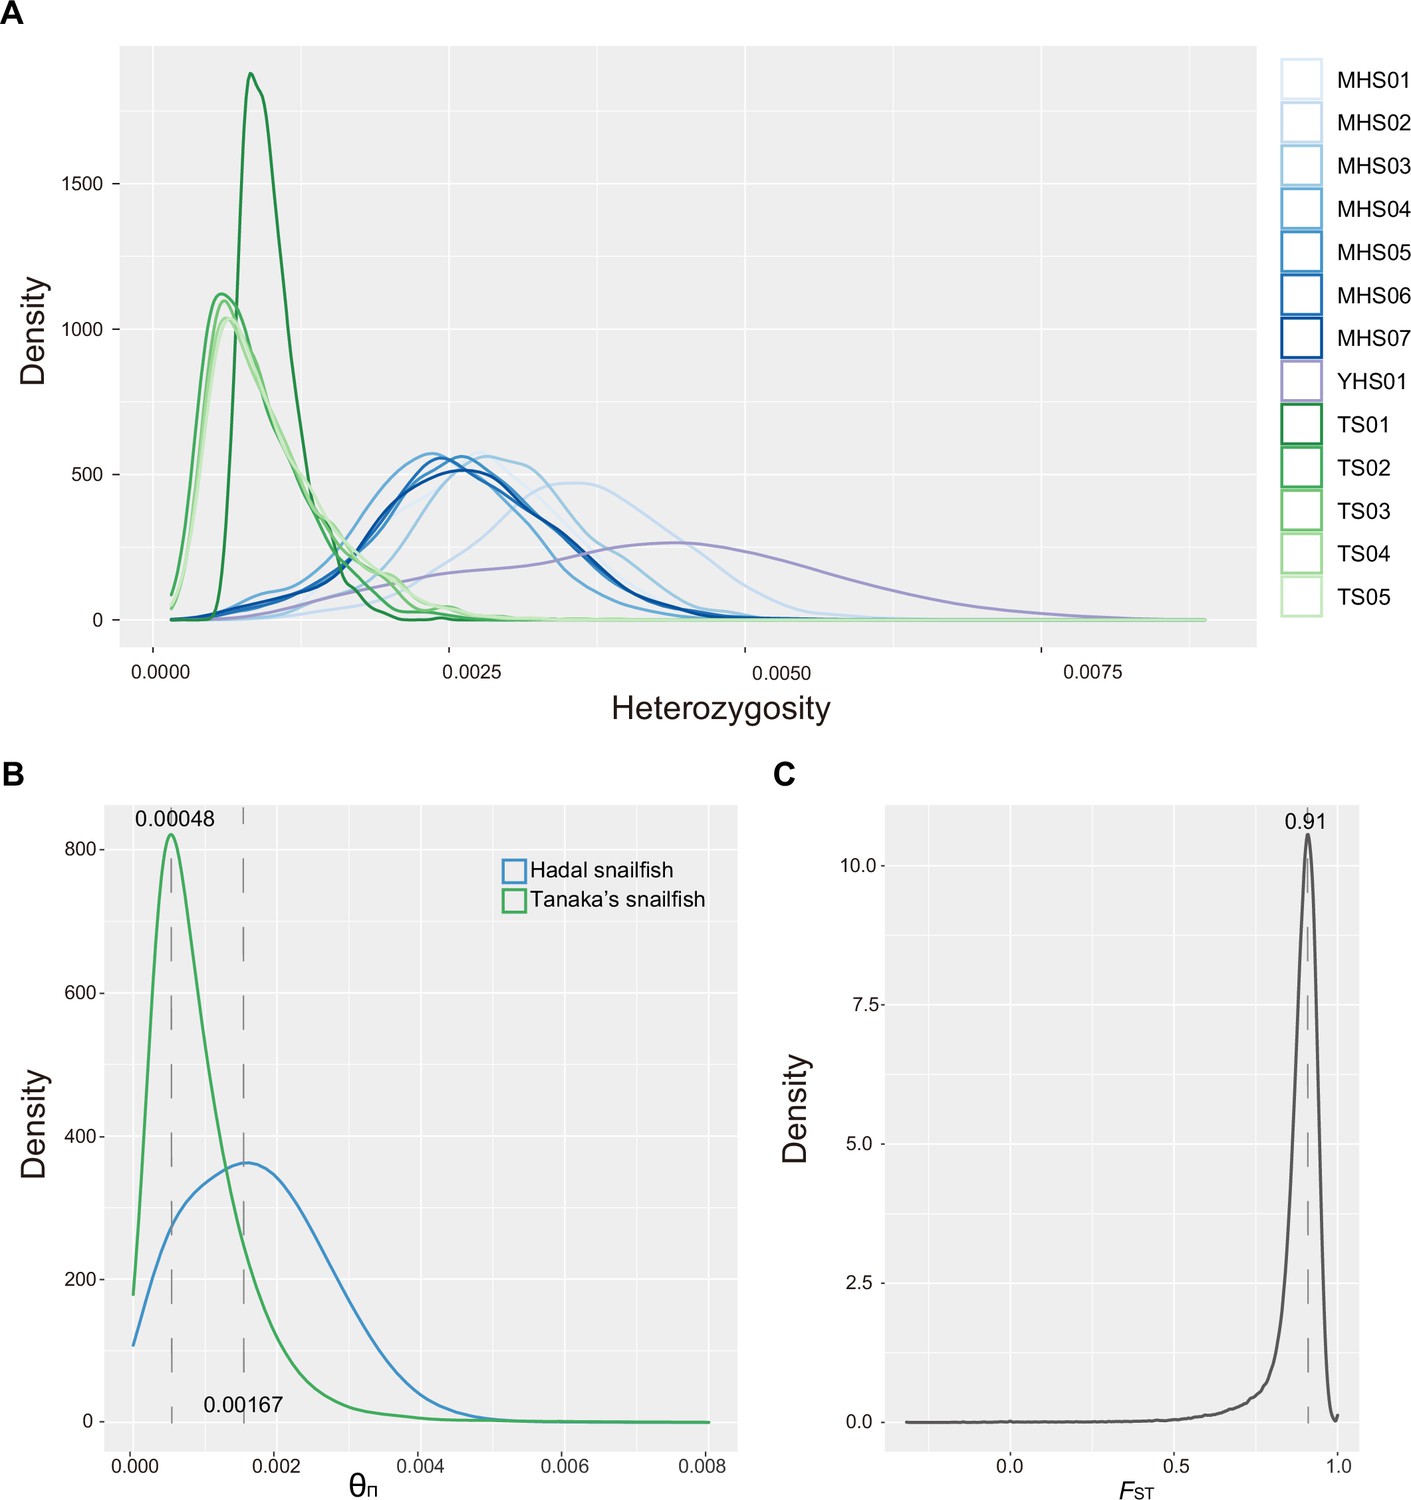
Diversity statistics.
(A) Heterozygosity ratio per 500 kb in different individuals of hadal snailfish and Tanaka’s snailfish. Distribution of Π of 10 kb windows (B) and FST of 10 kb windows with 1 kb steps (C).
Figure 1—figure supplement 8
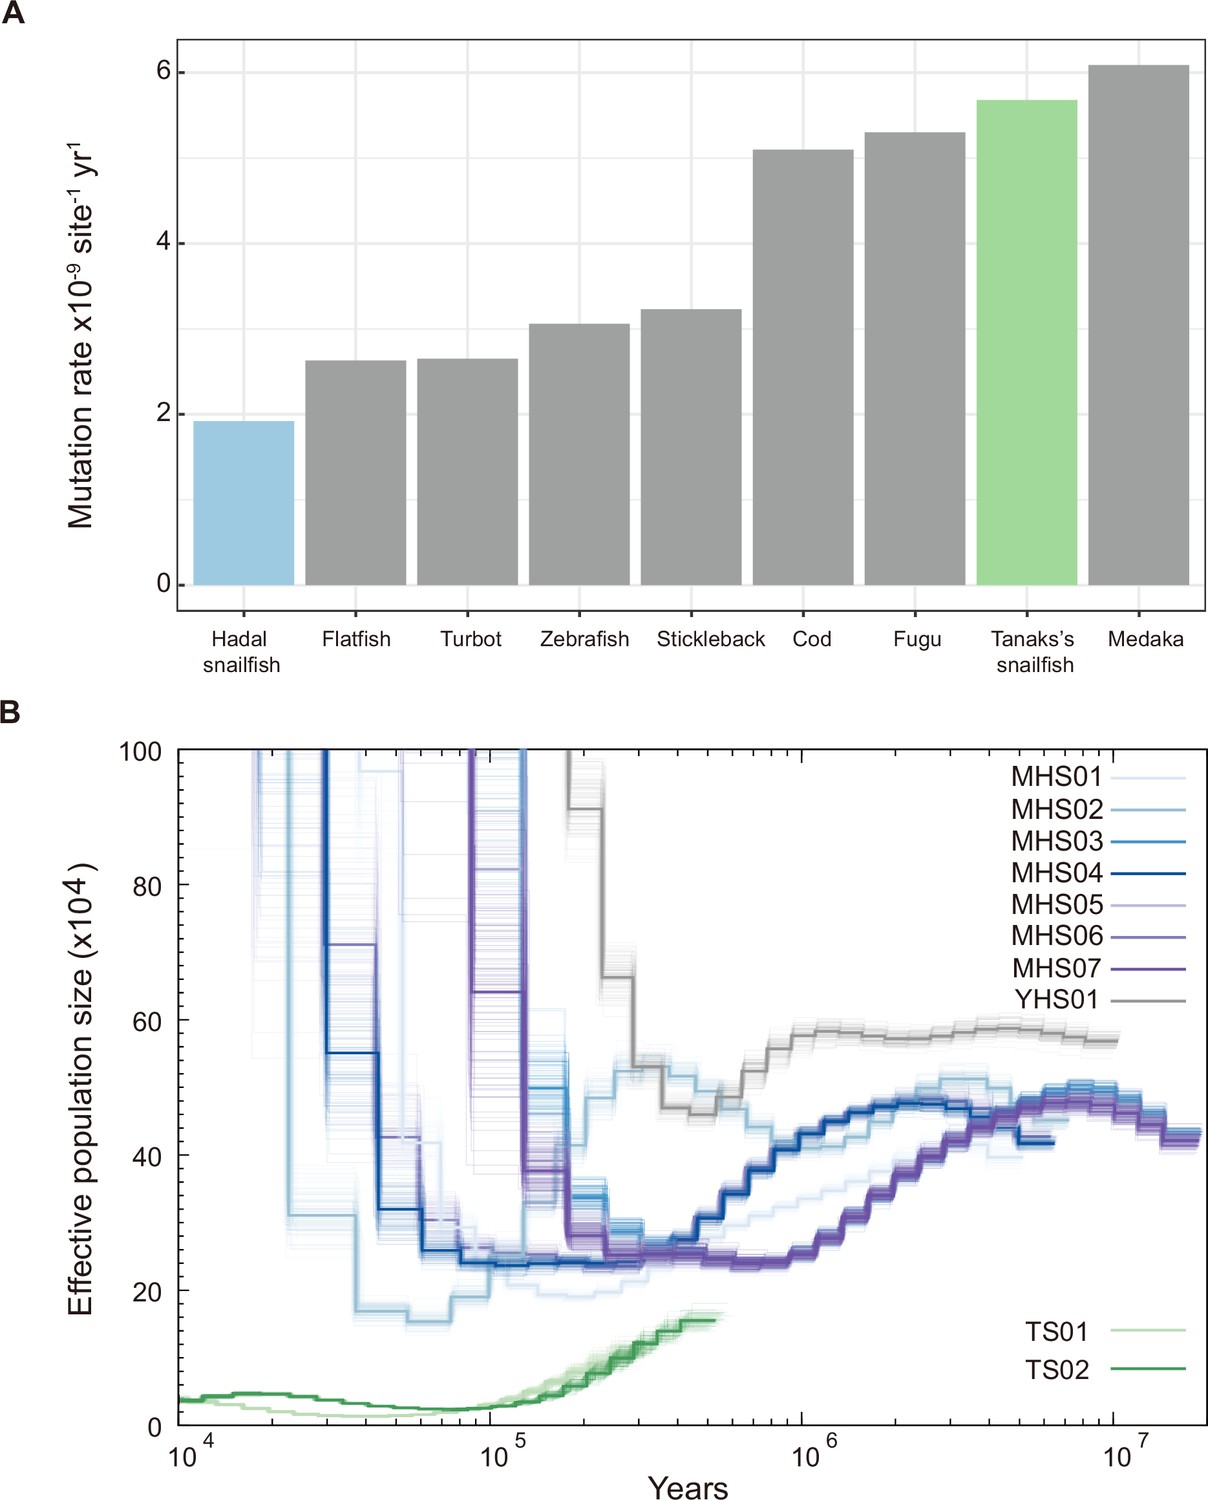
Demographic analysis.
The mutation ratio among nine teleosts and the demographic history for hadal snailfish and Tanaka’s snailfish. (A) The mutation ratio is inferred by the fourfold degenerate synonymous site (4D). (B) Demographic history for five hadal snailfish individuals and two Tanaka’s snailfish individuals inferred by pairwise sequential Markovian coalescent (PSMC). The generation time is 1 y for Tanaka snailfish and 3 y for hadal snailfish.
Figure 2 with 1 supplement
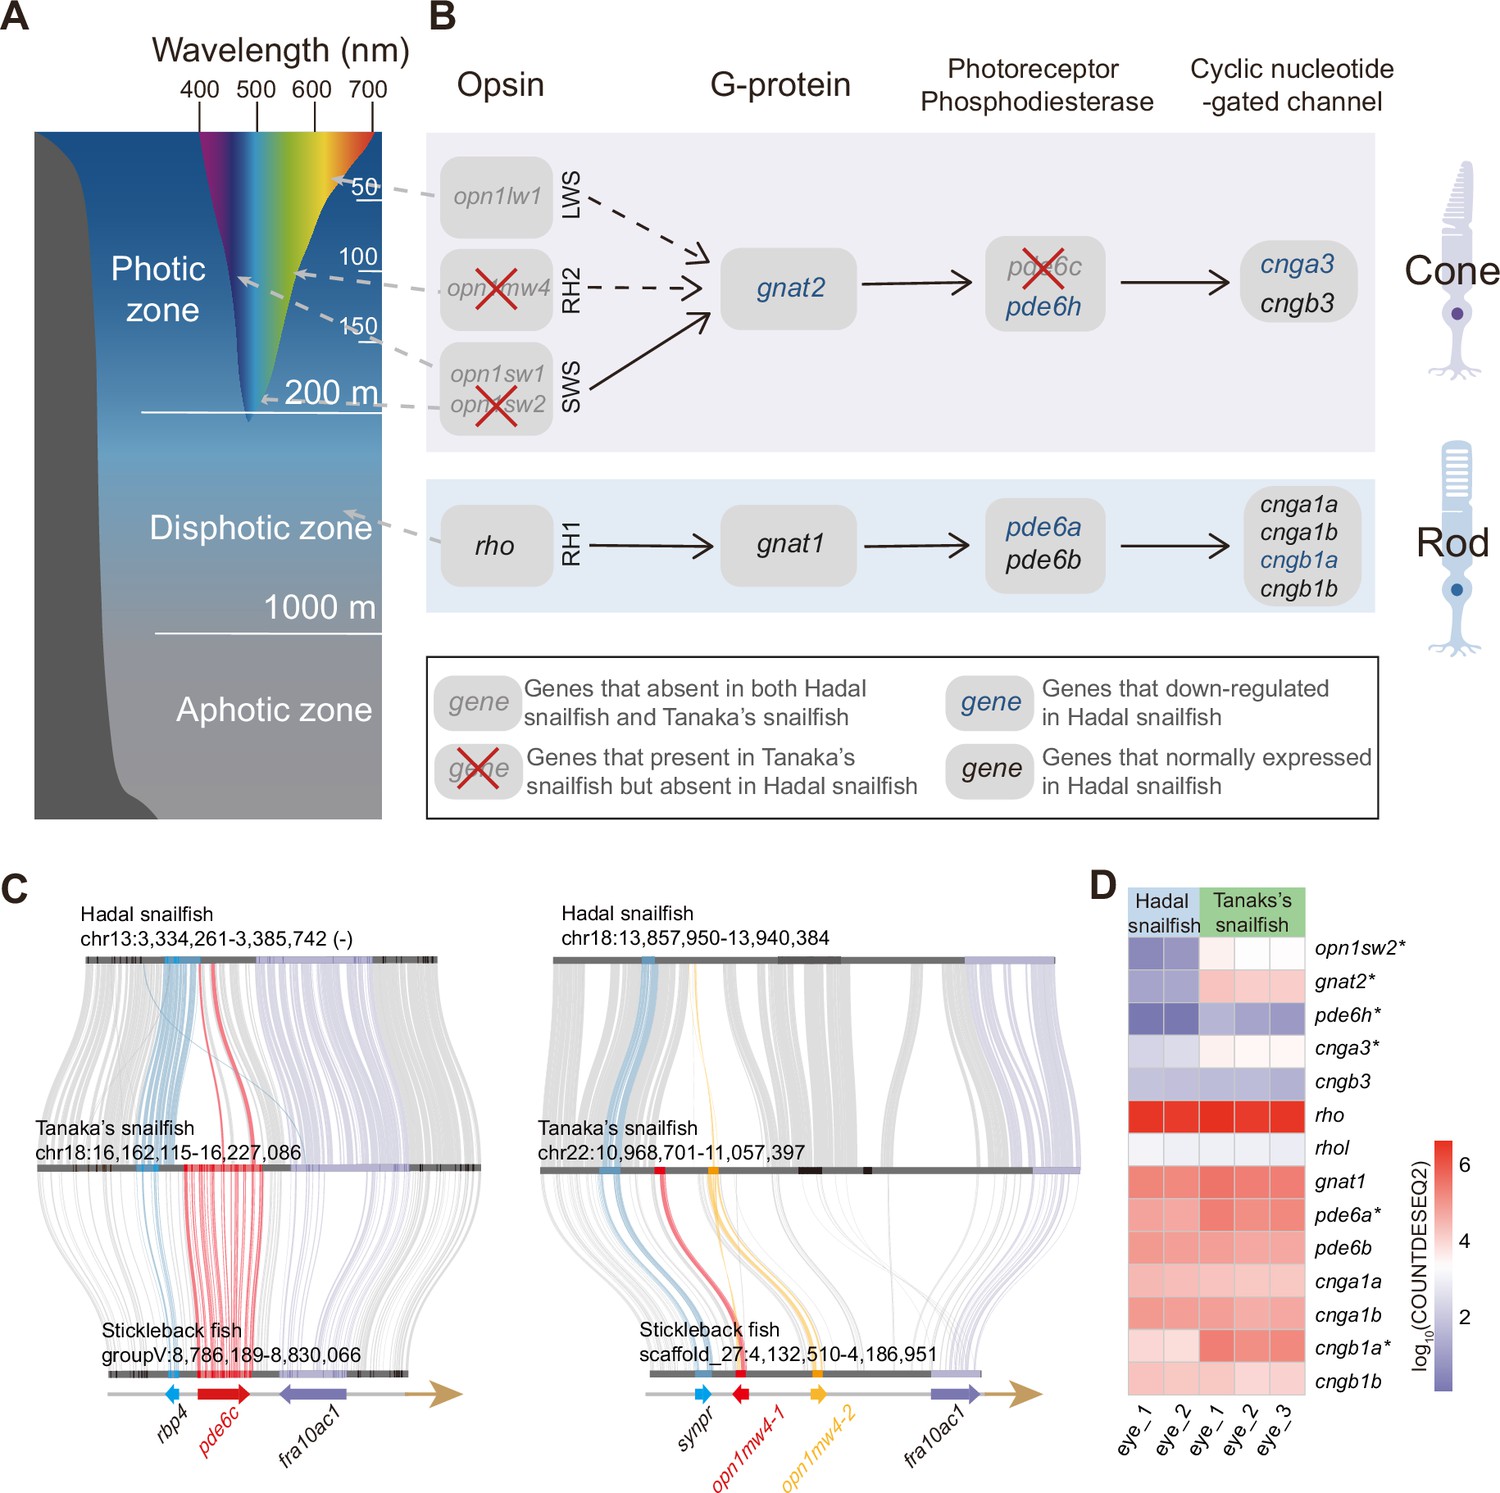
Alterations in vision-related genes in hadal snailfish.
(A) Different colors of light penetrate the depth of the open ocean. Longer wavelengths (such as red) are absorbed at shallower depths, while shorter wavelengths (such as blue) can penetrate to deeper depths. (B) Genetic alterations in the genes encoding the four major proteins involved in activating the photoresponse of vertebrate photoreceptors in the cone cell and rod cell of hadal snailfish. Opsion: rhodopsin, or its cone equivalent. G-protein: heterotrimeric G-protein, transducin. (C) Gene loss of pde6c and opn1mw4 in hadal snailfish. (D) Log10-transformation normalized counts for DESeq2 (COUNTDESEQ2) of vision-related genes in the eyes of hadal snailfish and Tanaka’s snailfish. * represents genes significantly downregulated in hadal snailfish (corrected p<0.05).
Figure 2—figure supplement 1
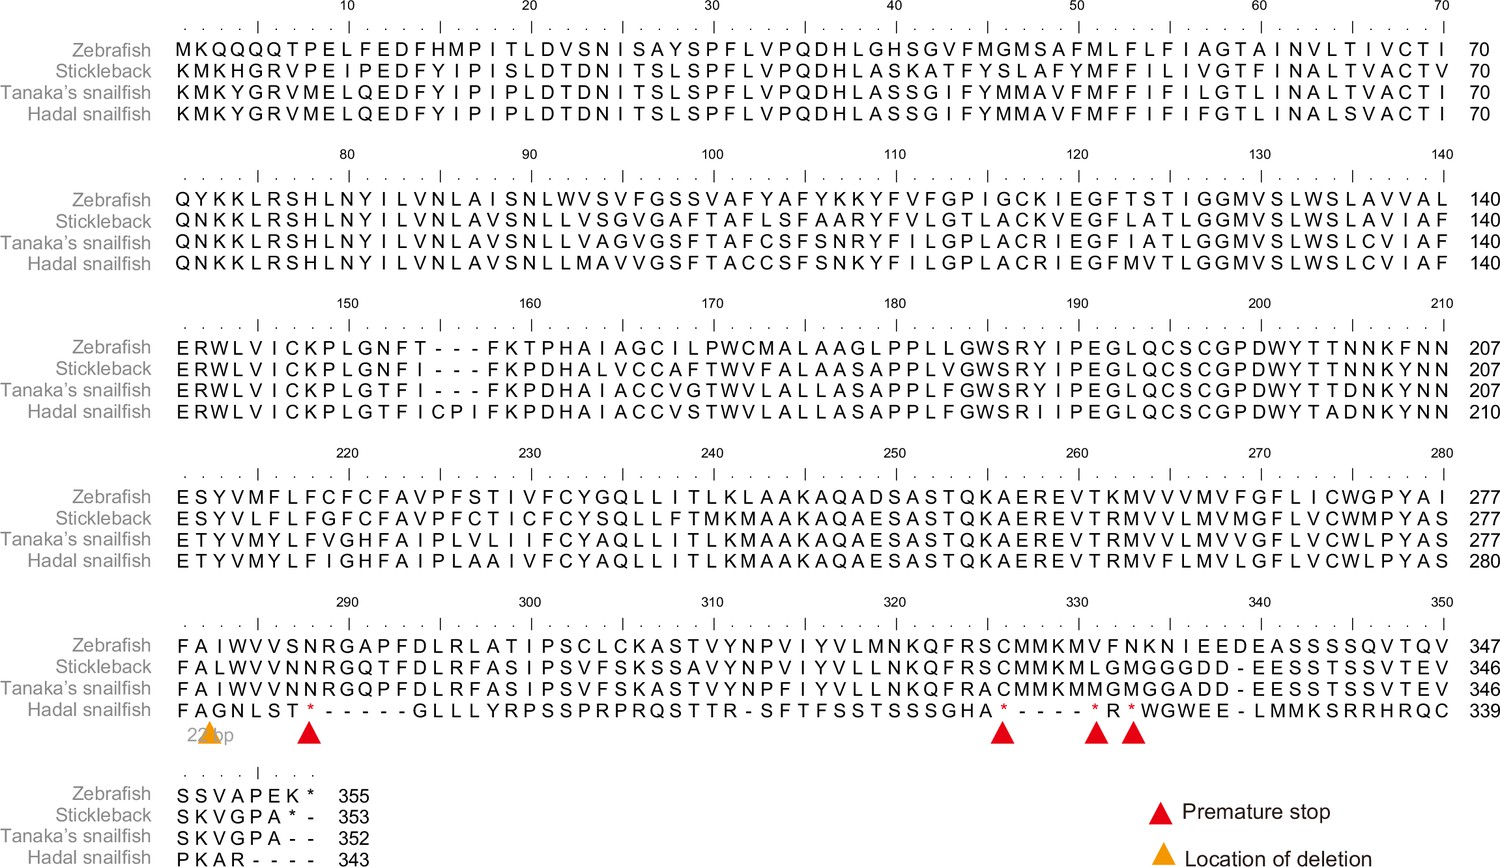
Pseudogenization of opn1sw2 in hadal snailfish.
The deletion changed the protein’s sequence, causing its premature termination.
Figure 3 with 2 supplements
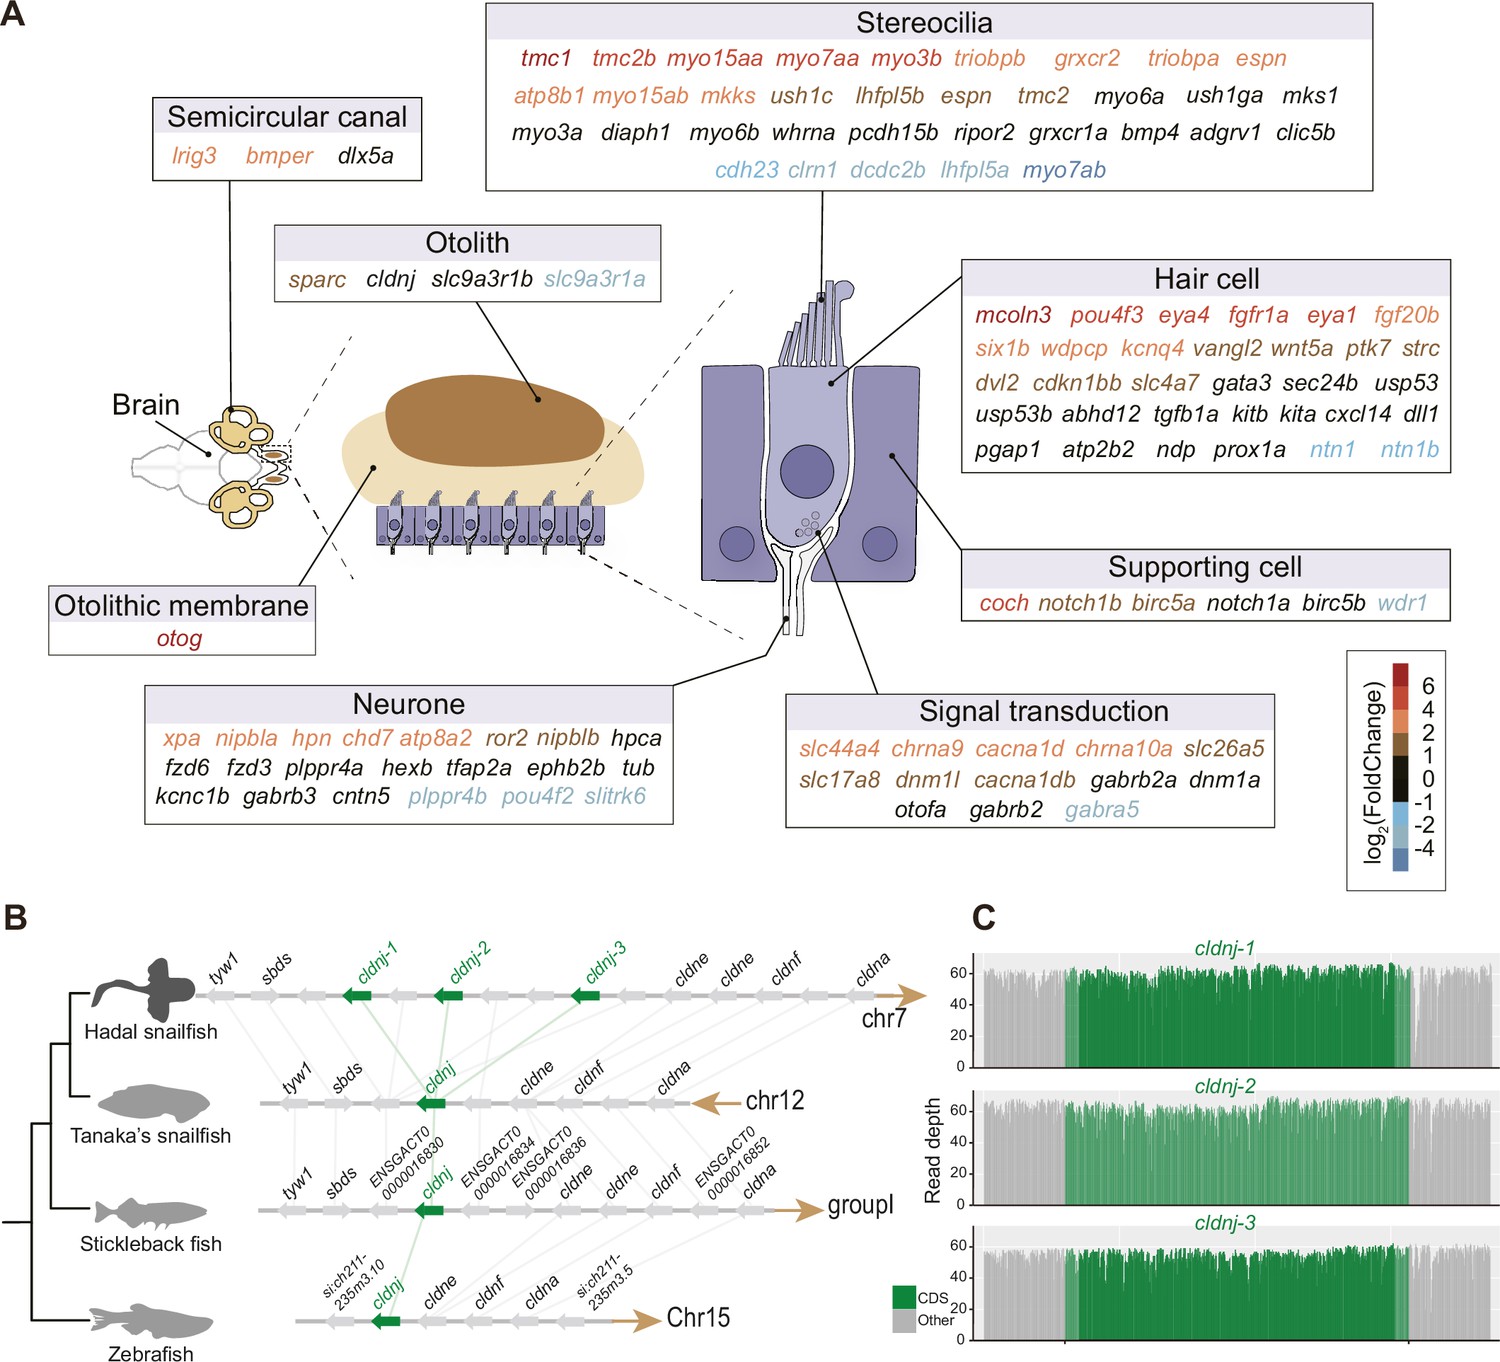
High expression and gene expansion of hearing-related genes in hadal snailfish.
(A) Upregulation of auditory-related genes in hadal snailfish brain. Red represents upregulated genes in hadal snailfish. (B) Increased copy number of cldnj in hadal snailfish. The relative positions of genes on chromosomes are indicated by arrows, with arrows to the right representing the forward strand and arrows to the left representing the reverse strand. (C) Nanopore sequencing read depth for all cldnj in hadal snailfish.
Figure 3—figure supplement 1

The number of olfactory receptors in eight species.
‘Air’ (yellow circles) and ‘water’ (blue circles) refer to the detection of airborne and water-soluble odorants, respectively. The size of the circles indicates the number of intact OR genes.
Figure 3—figure supplement 2
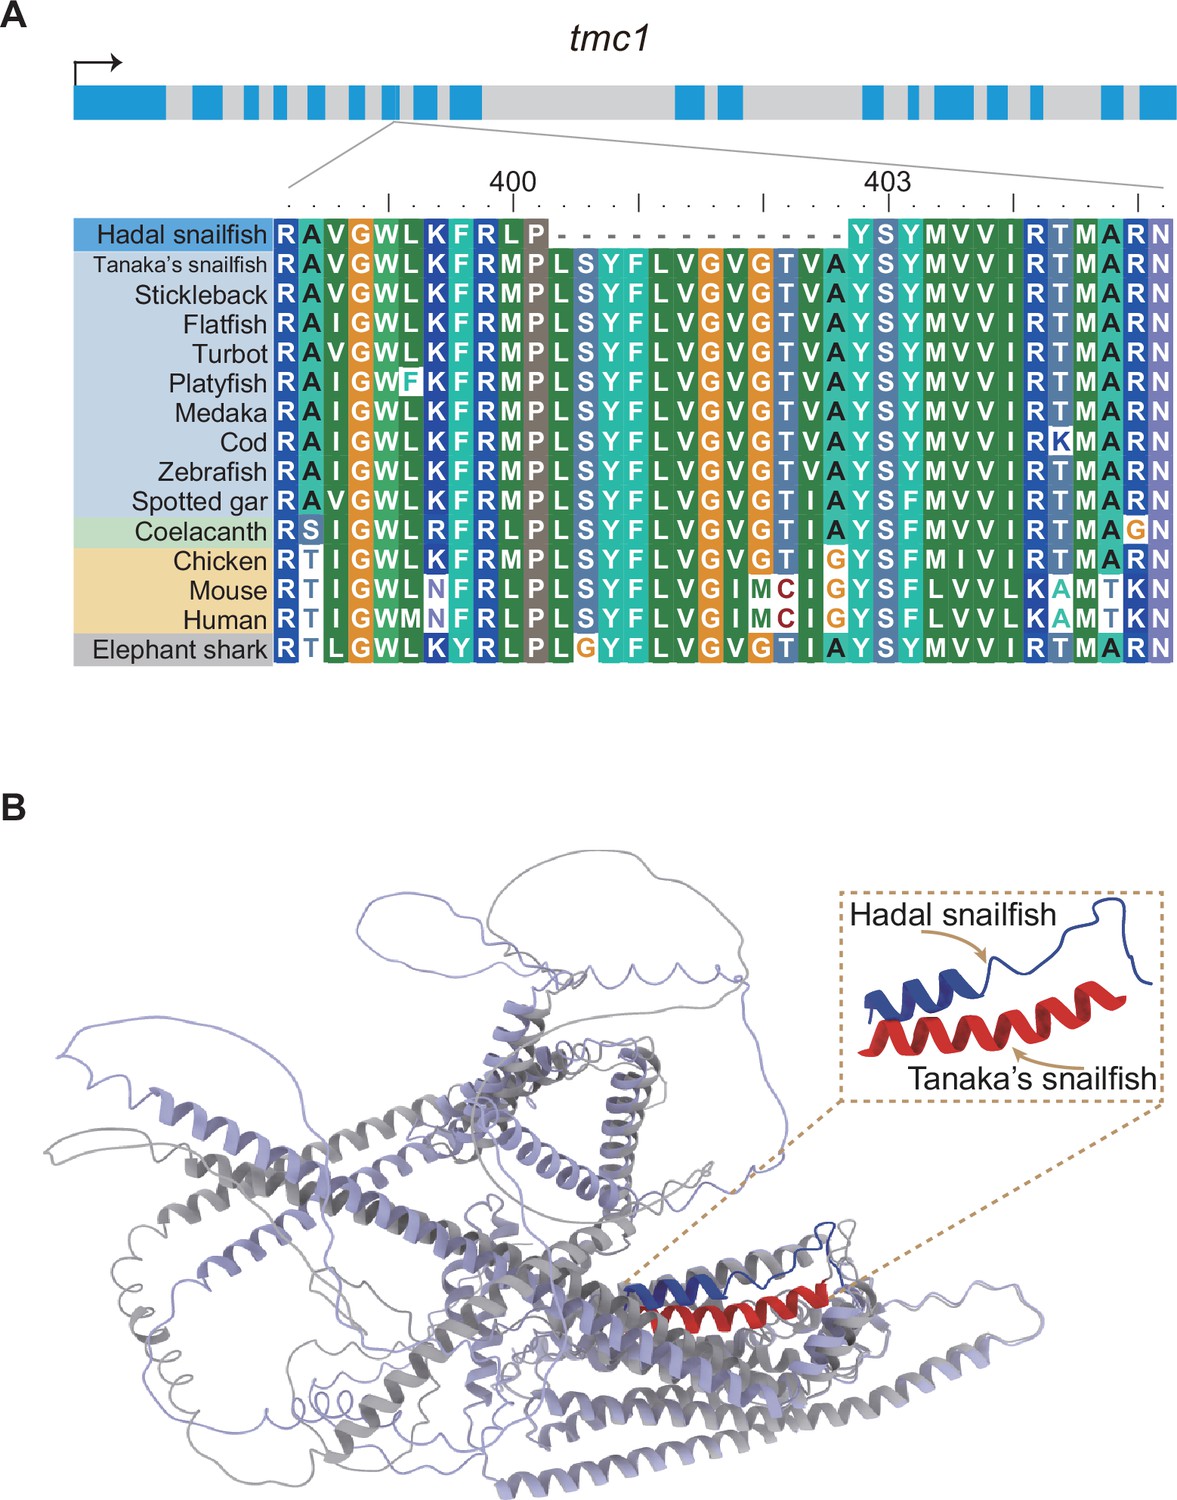
Specific changes of tmc1 in hadal snailfish.
(A) Sequence alignment revealed that the amino acid sequence of tmc1 was specifically deletion in hadal snailfish. The gray bar with blue stripes shows the exon–intron structure of tmc1. (B) Structural modeling by AlphaFold2 suggests that amino acid deletions specific to the tmc1 sequence in hadal snailfish have resulted in structural alterations.
Figure 4 with 5 supplements
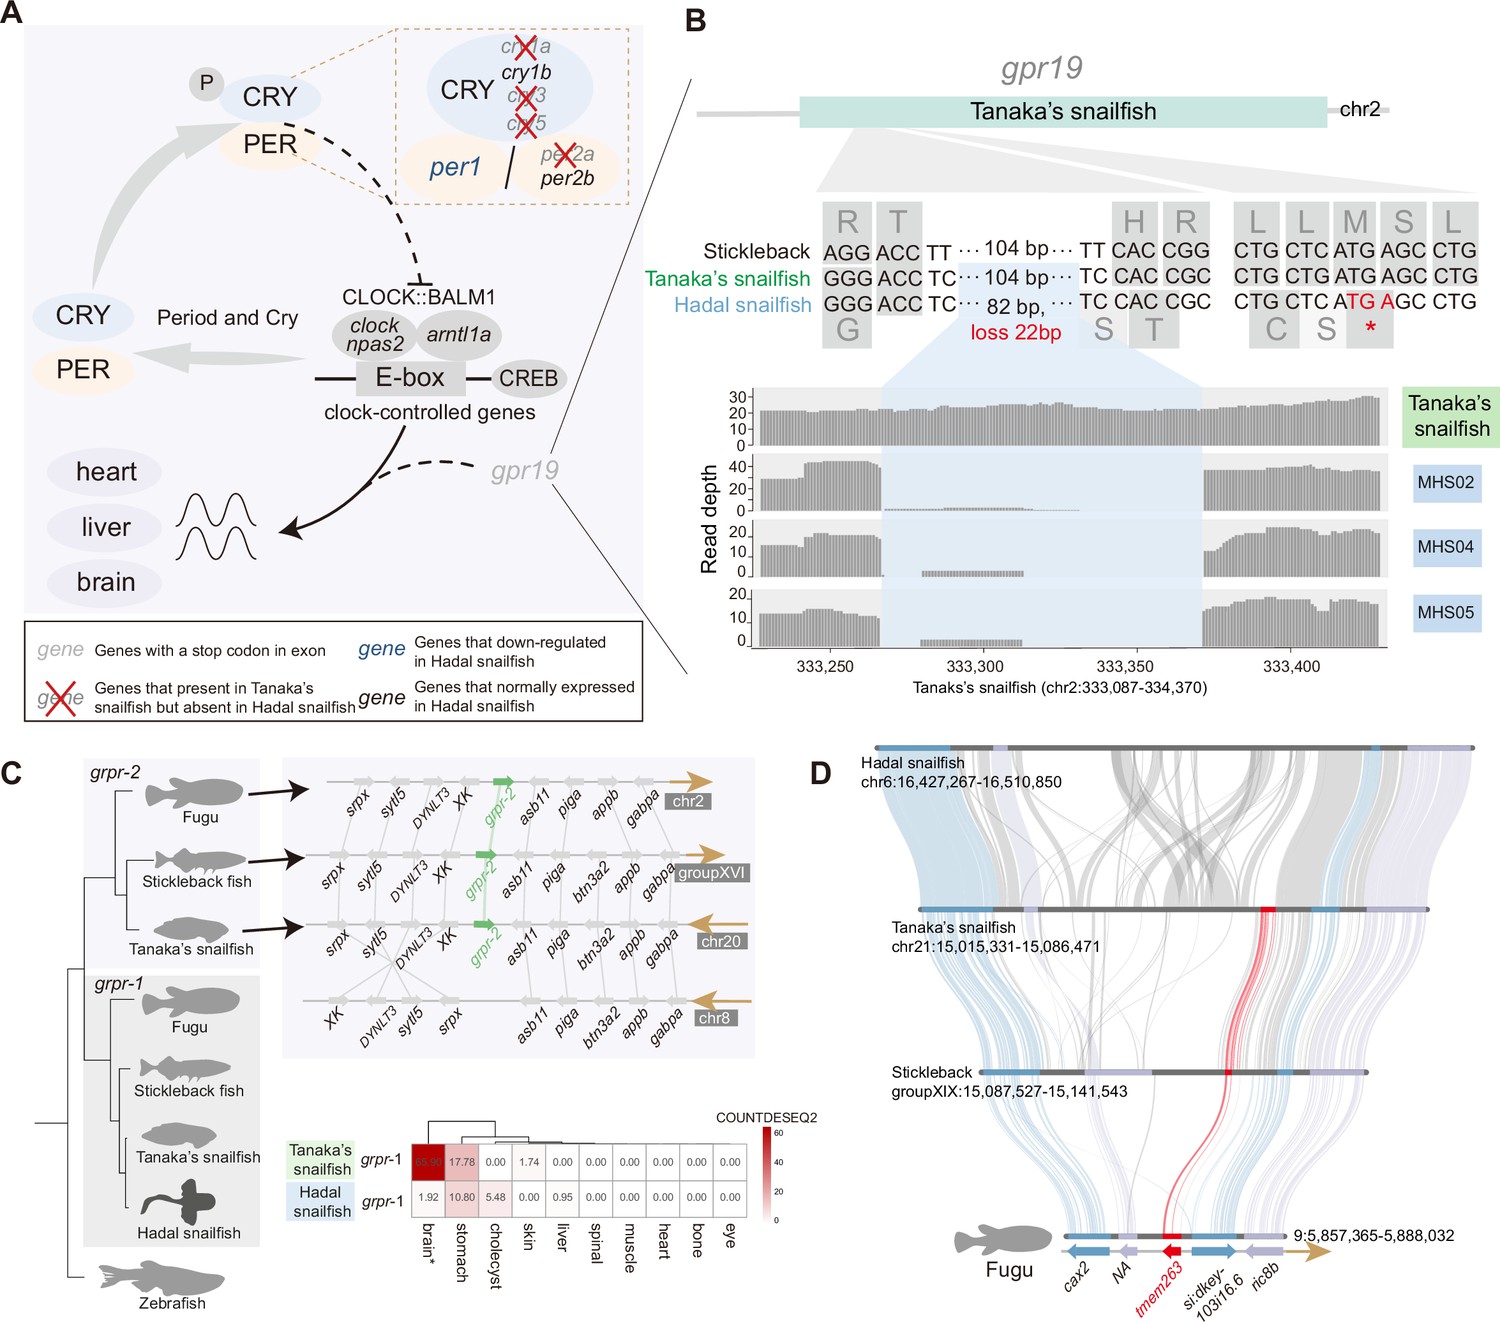
Genetic variation of dark adaptation in hadal snailfish.
(A) Genetic changes involved in light-mediated regulation of the molecular clock in hadal snailfish suprachiasmatic nucleus (SCN) neurons. (B) Pseudogenization of gpr19 (gray) in hadal snailfish. Gene structure (top), alignment of nucleotide and amino acid sequences (middle), and sequencing read depth (bottom; the numbers along the x-axis represent the position of the base at the scaffold) for the gpr19 gene. The premature termination (colored red) of gpr19 is due to 82 nucleotide variants and 22 nucleotide deletions (blue). (C) The deletion of one copy of grpr and another copy of downregulated expression in hadal snailfish. The relative positions of genes on chromosomes are indicated by arrows, with arrows to the right representing the forward strand and arrows to the left representing the reverse strand. The heatmap presented is the average of the normalized counts for DESeq2 (COUNTDESEQ2) in all replicate samples from each tissue. * represents tissue in which the grpr-1 was significantly downregulated in hadal snailfish (corrected p<0.05). (D) Gene loss of tmem263 in hadal snailfish.
Figure 4—figure supplement 1
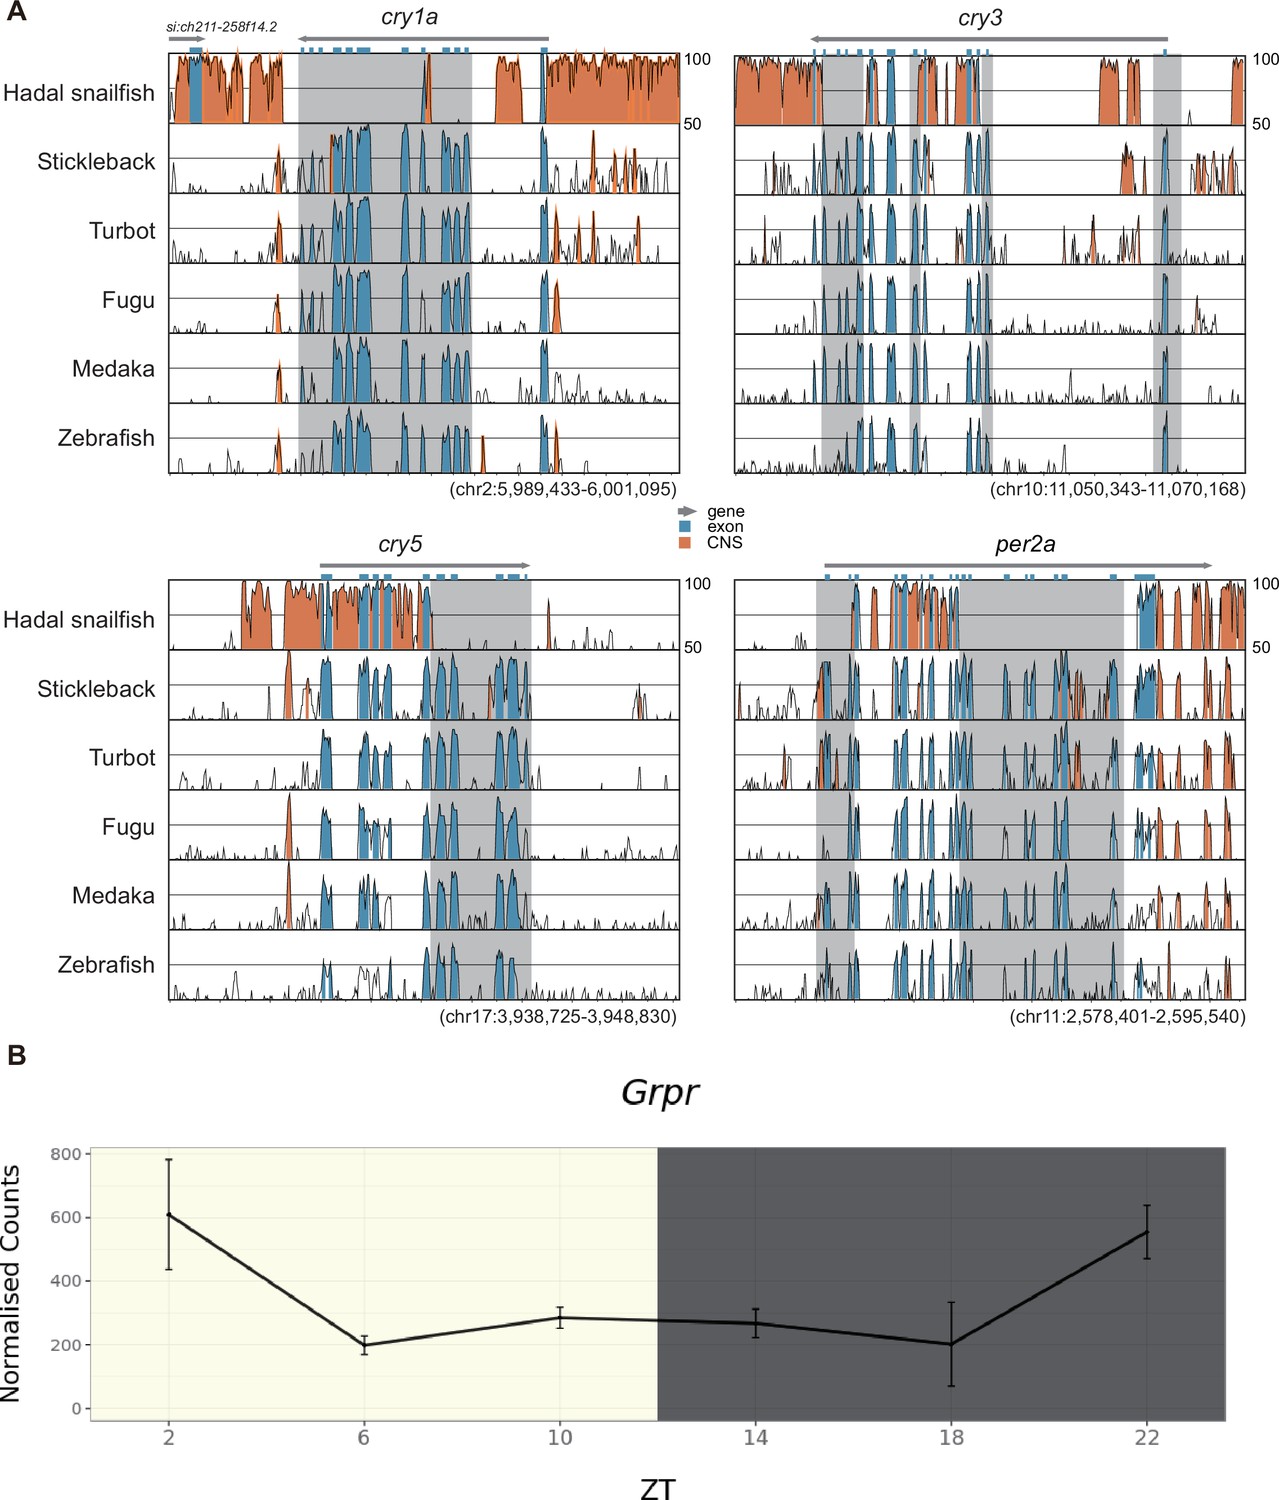
Rhythm-related gene alterations in hadal snailfish.
(A) Genetic changes involved in light-mediated regulation of the molecular clock in hadal snailfish suprachiasmatic nucleus (SCN) neurons using Tanaka’s snailfish (this work) as references. (B) Expression of the grpr in a 24 hr light/dark cycle in the mouse SCN. Data source at http://www.wgpembroke.com/shiny/SCNseq.
Figure 4—figure supplement 2
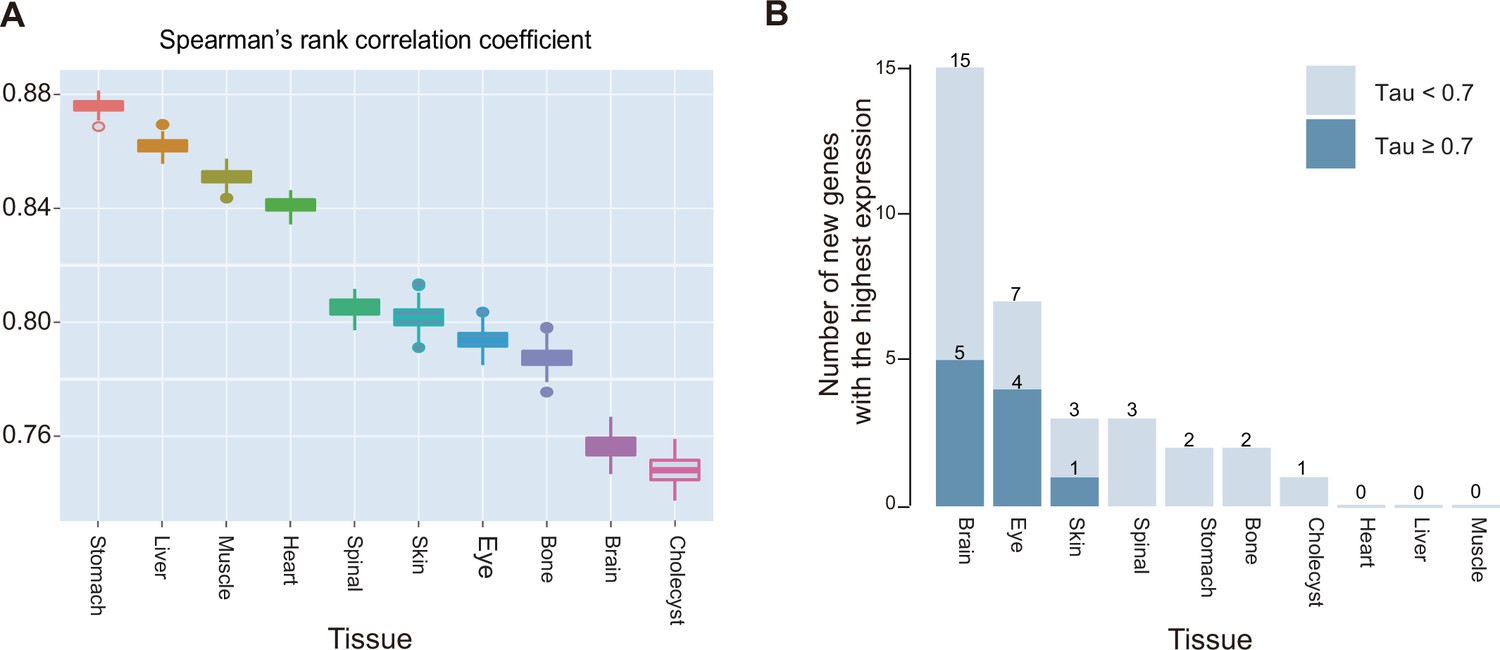
Tissue-specific changes in hadal snailfish.
(A) Differences in gene expression between species for each organ. Box plots of Spearman’s rank correlation coefficients for each organ of hadal snailfish and Tanaka’s snailfish based on 1000 bootstrap replicates. (B) Expression of new genes in hadal snailfish in various tissues.
Figure 4—figure supplement 3

Pseudogenization of gpr27 in hadal snailfish.
(A) Multiple genes associated with fatty acid entry into mitochondria were upregulated in hadal snailfish compared to Tanaka’s snailfish (red). (B) The insertion changed the protein’s sequence, causing its premature termination. The numbers above the alignment represent sequence positions including gaps.
Figure 4—figure supplement 4

Expression of the vitamin D-related genes in various tissues of hadal snailfish and Tanaka’s snailfish.
The heatmap presented is the average of the normalized counts for DESeq2 (COUNTDESEQ2) in all replicate samples from each tissue.
Figure 4—figure supplement 5

Loss of skeletal formation-related genes and site-specific mutations in hadal snailfish.
(A) Short reads from seven hadal snailfish individuals (MHS01–MHS07) and five Tanaka’s snailfish individuals (TS01–TS05) were mapped with stickleback’s genome sequence, in which tmem251 and tmem263 genes were lost in hadal snailfish. (B) Site-specific amino acid site alterations of sox6. Amino acids unique to hadal snailfish are highlighted in red; positions within each sequence are given above.
Figure 5 with 5 supplements
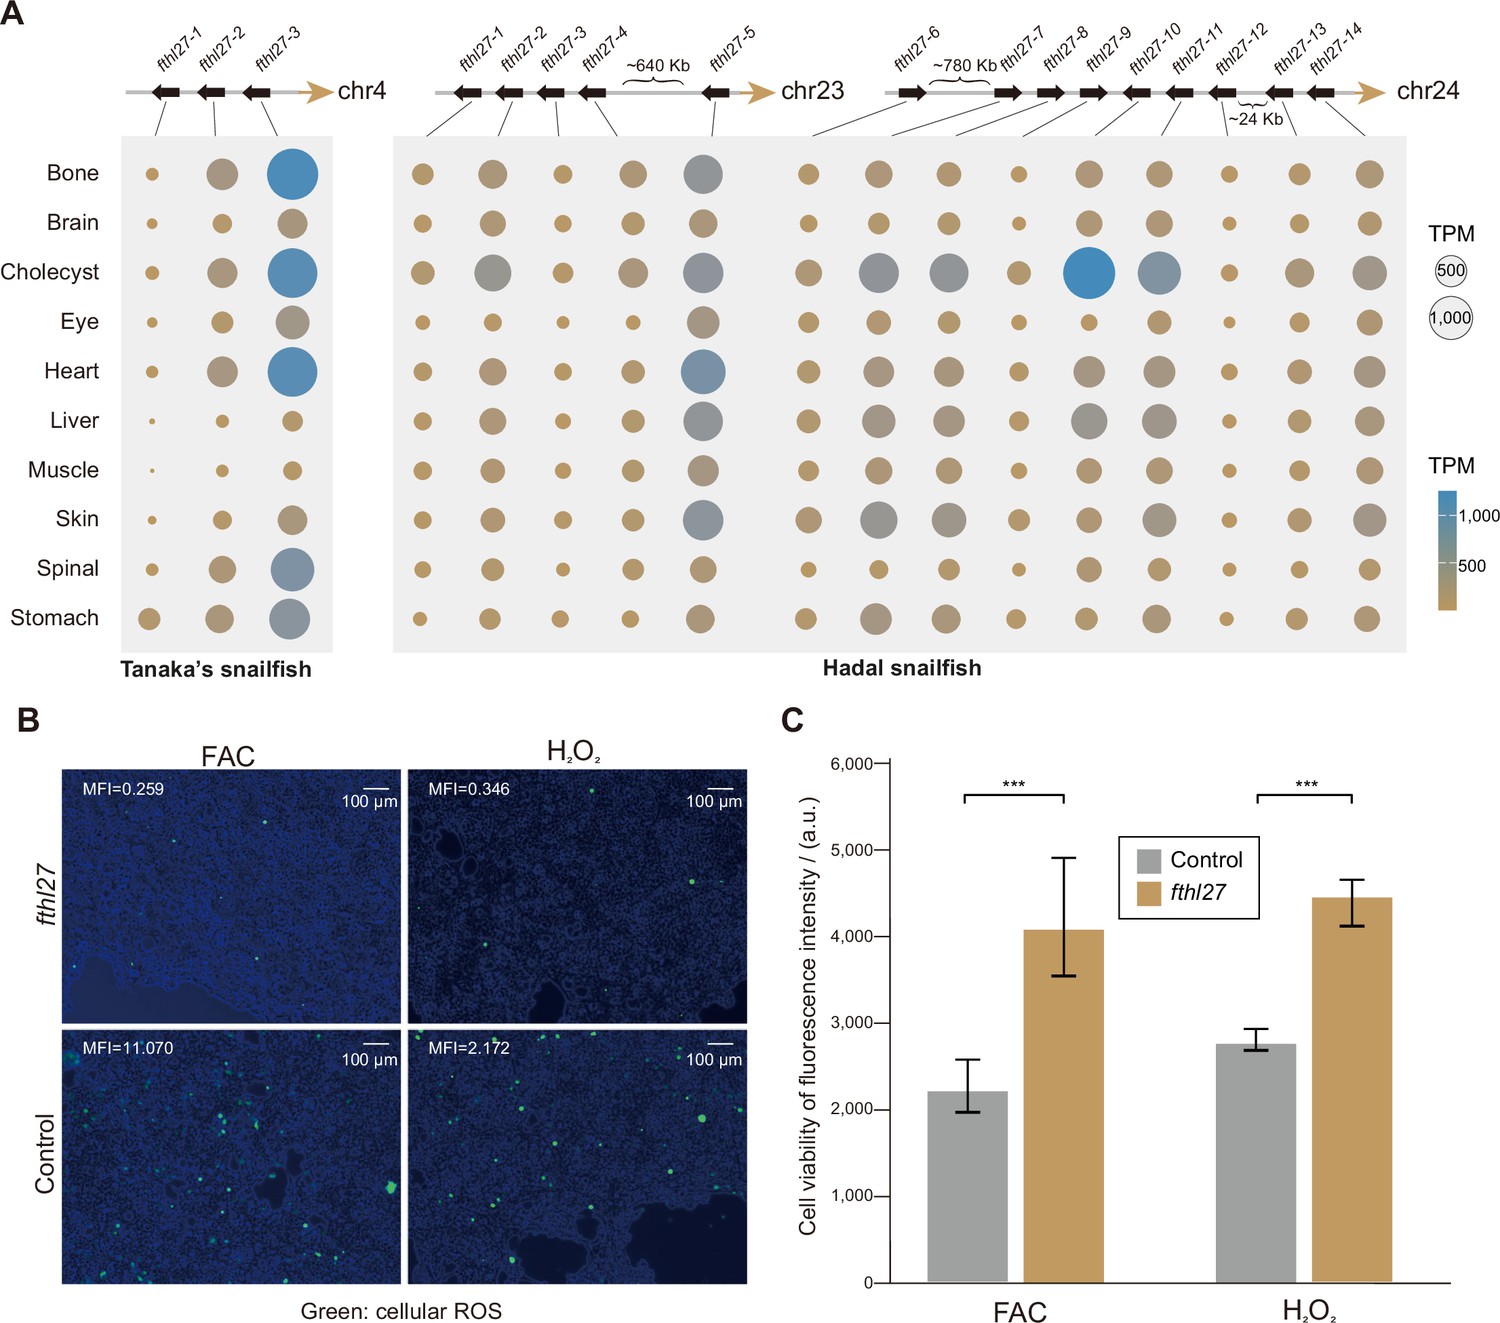
High-hydrostatic pressure adaptation of molecules and cells in hadal snailfish.
(A) The position of the gene copies of fthl27 in Tanaka’s snailfish and hadal snailfish, and the expression of each gene copy in each tissue. The gene expression presented is the average of transcripts per million (TPM) in all replicate samples from each tissue. (B) Reactive oxygen species (ROS) levels were confirmed by redox-sensitive fluorescent probe using DCFH-DA molecular probe in 293T cell culture medium with or without fthl27-overexpression plasmid added with H2O2 or ferric ammonium citrate (FAC) for 4 hr. Images are merged from bright-field images with fluorescent images using ImageJ, while the mean fluorescence intensity (MFI) is also calculated using ImageJ. Green, cellular ROS. Scale bars = 100 μm. (C) Fluorescence intensities of AlamarBlue for 293T cells with or without the fthl27-overexpression plasmid in cell culture medium supplemented with H2O2 or FAC for 4 hr (n=5). Vertical coordinates are relative fluorescence units, and higher relative fluorescence units indicate stronger cell viability. Significantly higher AlamarBlue fluorescence for treated cells compared to control cells (p<0.001) is indicated by an asterisk (***).
Figure 5—figure supplement 1
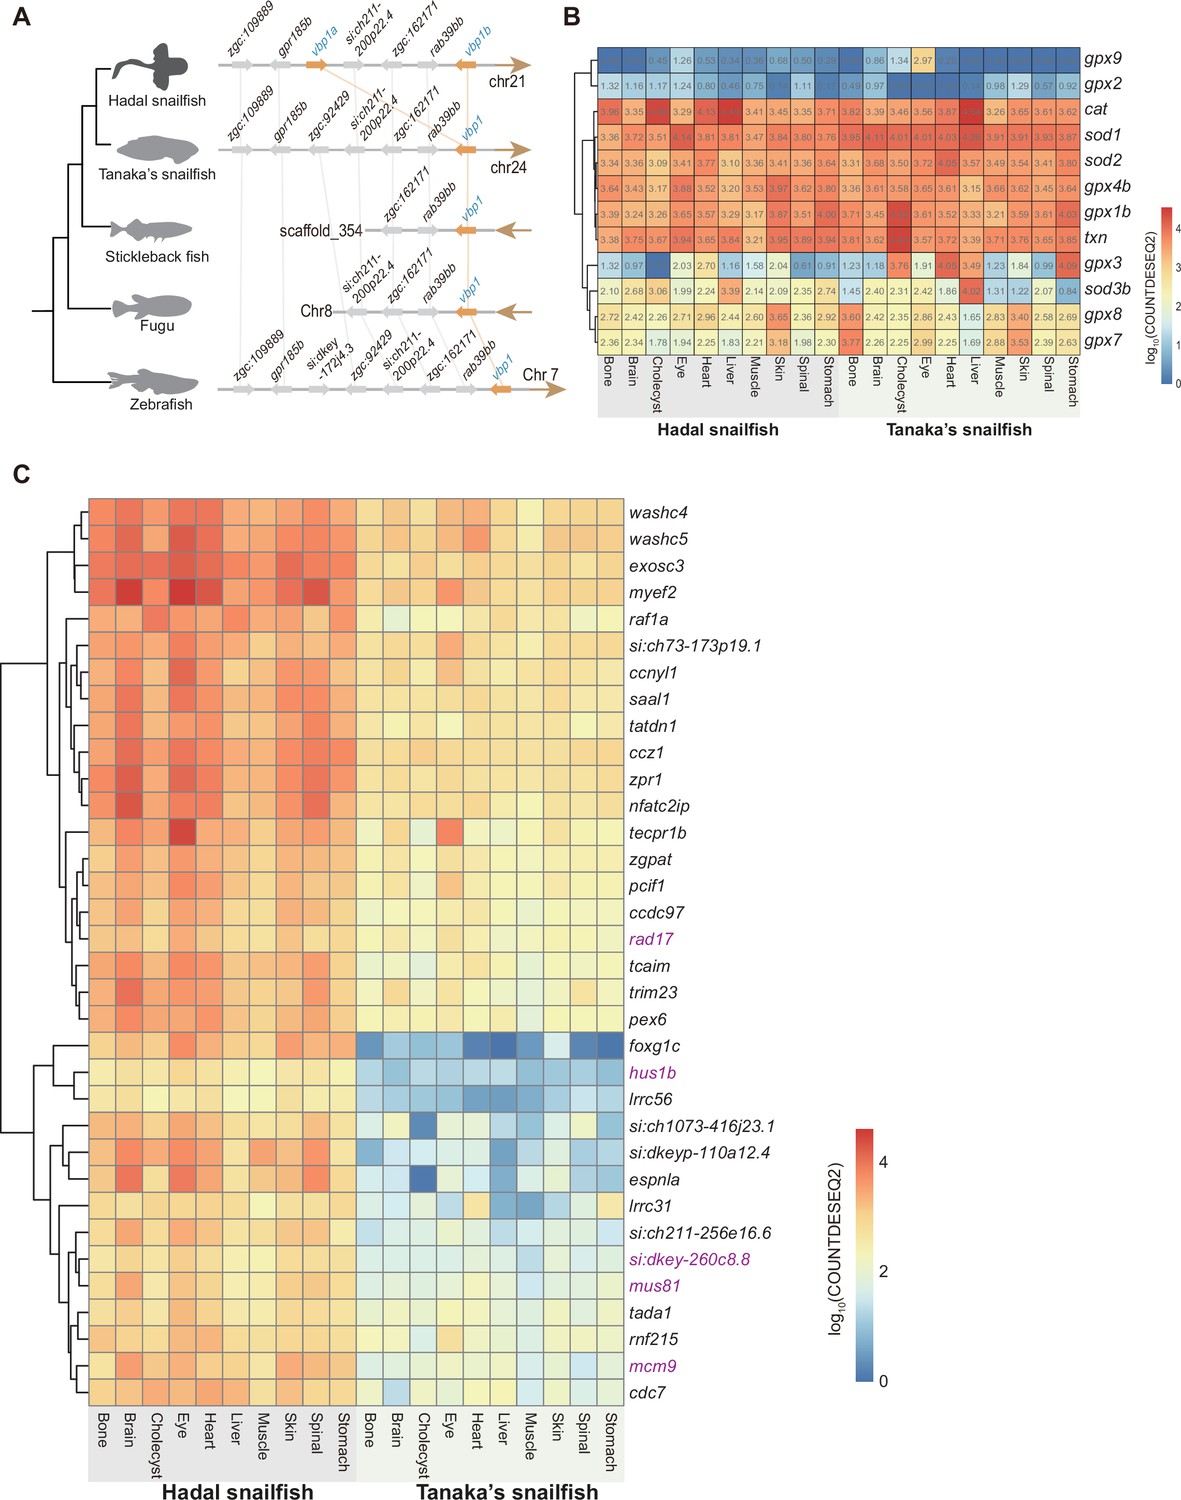
Genetic mechanisms of adaptation to high hydrostatic pressure in hadal snailfish.
(A) Increased gene copy number of vpb1. The relative positions of genes on chromosomes are indicated by arrows, with arrows to the right representing the forward strand and arrows to the left representing the reverse strand. (B) Expression of the reactive oxygen species (ROS)-related genes in different tissues of hadal snailfish and Tanaka’s snailfish. The heatmap presented is the average of the normalized counts for DESeq2 (COUNTDESEQ2) in all replicate samples from each tissue. (C) Genes were significantly more highly expressed in all tissues of the hadal snailfish compared to Tanaka’s snailfish, and five genes (purple) were associated with DNA repair.
Figure 5—figure supplement 2
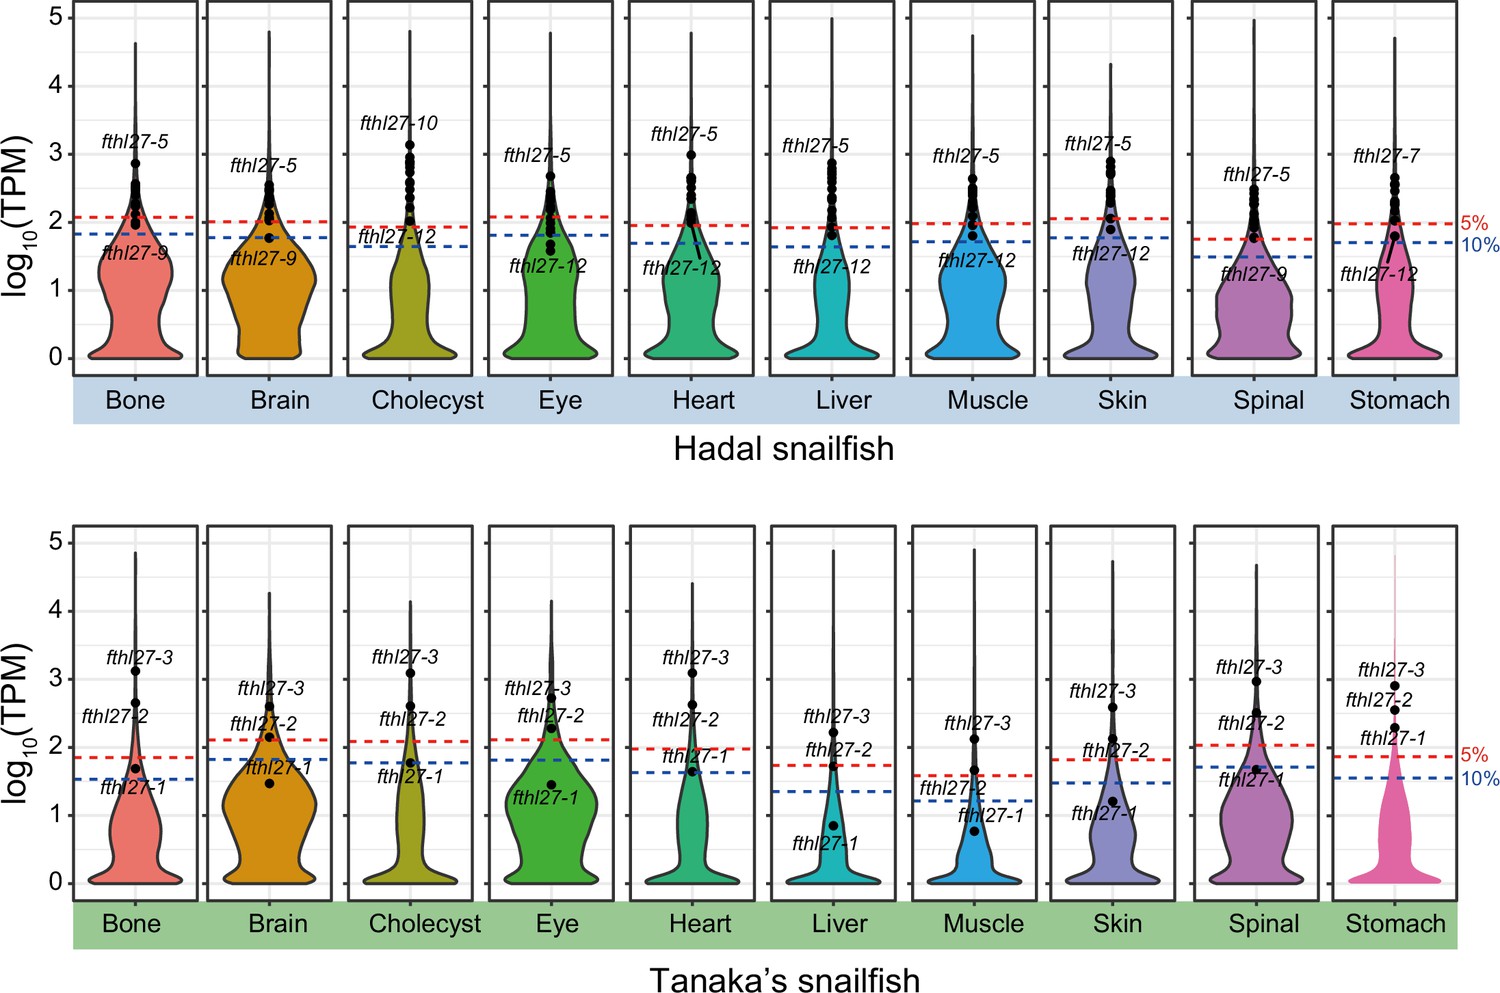
Ranking of the expression of individual copies of fthl27 gene in hadal snailfish and Tanaka’s snailfish in various tissues showed that all copies of fthl27 in hadal snailfish have high expression.
The gene expression presented is the average of ferric ammonium citrate (TPM) in all replicate samples from each tissue.
Figure 5—figure supplement 3
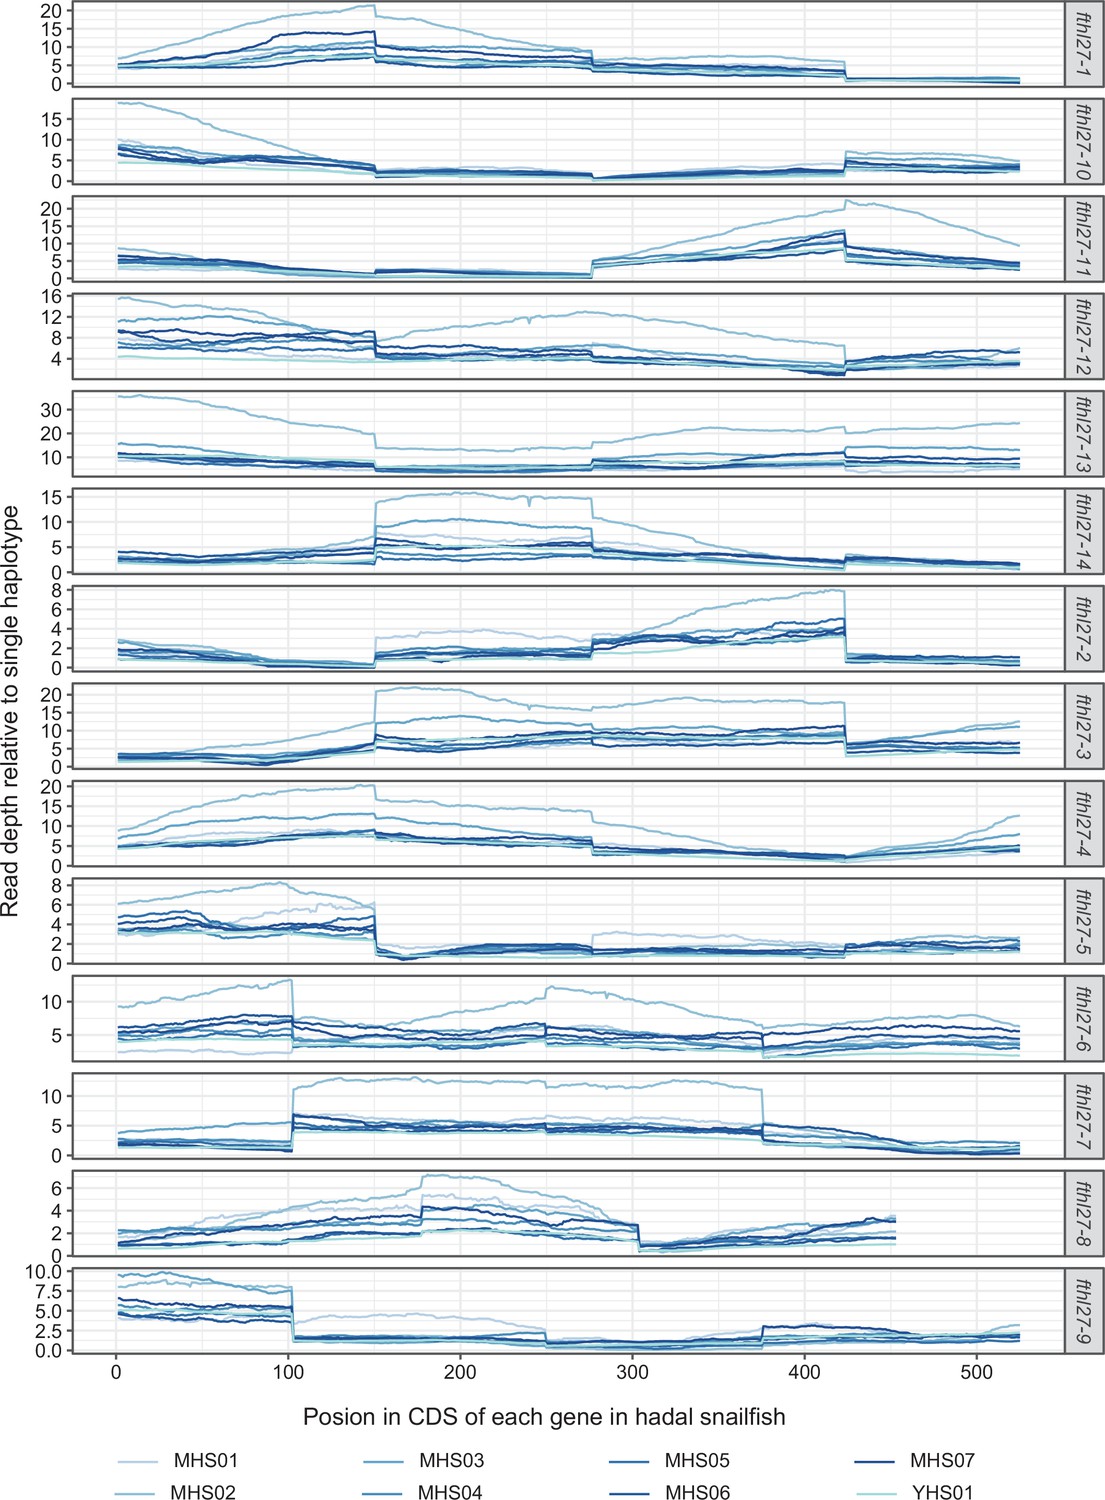
Reads depth of copy number expansion of fthl27 in eight hadal snailfish resequenced individuals.
Short reads from eight hadal snailfish individuals (MHS01–MHS07, YHS01) were mapped with hadal snailfish’s genome sequence.
Figure 5—figure supplement 4

Analysis of reactive oxygen species (ROS) intracellular amounts and fthl27 antioxidant protein levels in 293T cells.
(A) Immunofluorescence analysis of ROS levels in 293T cells with or without the fthl27-overexpression plasmid in cell culture medium supplemented with H2O2 or ferric ammonium citrate (FAC) for 4 hr using the DCFH-DA molecular probes. Images were created by merging bright-field images with fluorescent images using ImageJ. Green, cellular ROS. Scale bars = 100 μm. (B) Reads depth of fthl27 gene in fthl27-transfected HEK293T cells and two untreated HEK293T cells (SRR24835259 and SRR24835265) transcriptome data. (C) Expression of each gene in the transcriptome data of fthl27-transfected HEK293T cells and two untreated HEK293T cells (SRR24835259 and SRR24835265), where the genes shown are the four most highly expressed genes in each sample.
Figure 5—figure supplement 5
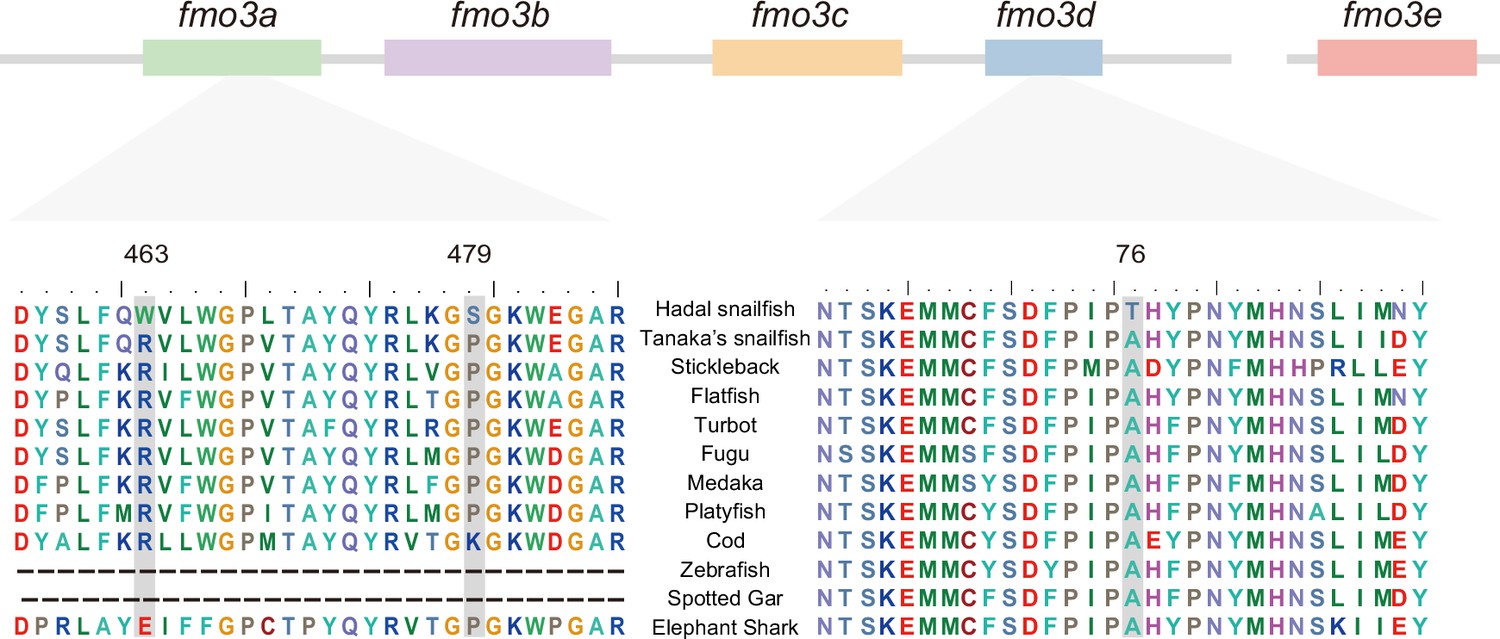
Specific amino acid sites in the fmo3 protein sequence in hadal snailfish.
Partial alignment of the fmo3a and fmo3d amino acid sequences from various representative teleosts, spotted gar and elephant shark. Amino acids unique to hadal snailfish are highlighted in gray; positions within each sequence are given above.
Author response image 1

Demographic history for 5 hadal snailfish individuals and 2 Tanaka’s snailfish individuals inferred by PSMC.
The generation time of one year for Tanaka snailfish and three years for hadal snailfish.
Author response image 2

Log10-transformation normalized counts for DESeq2 (COUNTDESEQ2) of vision-related genes in the eyes of hadal snailfish and Tanka's snailfish.
* represents genes significantly downregulated in hadal snailfish (corrected P < 0.05).
Author response image 3

The deletion of one copy of grpr and another copy of down-regulated expression in hadal snailfish.
The relative positions of genes on chromosomes are indicated by arrows, with arrows to the right representing the forward strand and arrows to the left representing the reverse strand. The heatmap presented is the average of the normalized counts for DESeq2 (COUNTDESEQ2) in all replicate samples from each tissue. * represents tissue in which the grpr-1 was significantly down-regulated in hadal snailfish (corrected P < 0.05).
Author response image 4

Expression of the vitamin D related genes in various tissues of hadal snailfish and Tanaka's snailfish.
The heatmap presented is the average of the normalized counts for DESeq2 (COUNTDESEQ2) in all replicate samples from each tissue.
Author response image 5

Expression of the ROS-related genes in different tissues of hadal snailfish and Tanaka's snailfish.
The heatmap presented is the average of the normalized counts for DESeq2 (COUNTDESEQ2) in all replicate samples from each tissue.
Author response image 6

Ranking of the expression of individual copies of fthl27 gene in hadal snailfish and Tanaka's snailfish in various tissues showed that all copies of fthl27 in hadal snailfish have high expression.
The gene expression presented is the average of TPM in all replicate samples from each tissue.
Author response image 7

Pseudogenization of opn1sw2 in hadal snailfish.
The deletion changed the protein’s sequence, causing its premature termination.
Author response image 8

Expression of the grpr in a 24-hour light/dark cycle in the mouse suprachiasmatic nucleus (SCN).
Data source with http://www.wgpembroke.com/shiny/SCNseq.
Author response image 9

ROS levels were confirmed by redox-sensitive fluorescent probe using DCFH-DA molecular probe in 293T cell culture medium with or without fthl27-overexpression plasmid added with H2O2 or FAC for 4 hours.
Images are merged from bright field images with fluorescent images using ImageJ, while the mean fluorescence intensity (MFI) is also calculated using ImageJ. Green, cellular ROS. Scale bars equal 100 μm.
Author response image 10

(B) Reads depth of fthl27 gene in fthl27-transfected HEK293T cells and 2 untreated HEK293T cells (SRR24835259 and SRR24835265) transcriptome data.
(C) Expression of each gene in the transcriptome data of fthl27-transfected HEK293T cells and 2 untreated HEK293T cells (SRR24835259 and SRR24835265), where the genes shown are the 4 most highly expressed genes in each sample.
Author response image 11

Genes were significantly more highly expressed in all tissues of the hadal snailfish compared to Tanaka's snailfish, and 5 genes (purple) were associated with DNA repair.
Tables
Author response table 1
GO enrichment of expression up-regulated and down-regulated genes in hadal snailfish brain.
| GO term | Type | Function | Adjusted p-value | |
|---|---|---|---|---|
| Up_-_ regulated | GO:0005929 | Cellular Component | cilium | 2.162E-04 |
| GO:0006281 | Biological Process | DNA repair | 0.001 | |
| GO:0005515 | Molecular Function | protein binding | 0.002 | |
| GO:0005524 | Molecular Function | ATP binding | 0.005 | |
| GO:0007018 | Biological Process | microtubule-based movement | 0.029 | |
| Down- regulated | GO:0016020 | Cellular Component | membrane | 8.799E-13 |
| GO:0016021 | Cellular Component | integral component of membrane | 2.504E-06 | |
| GO:0005886 | Cellular Component | plasma membrane | 3.248E-05 | |
| GO:0005525 | Molecular Function | GTP binding | 1.089E-03 | |
| GO:0003924 | Molecular Function | GTPase activity | 0.001 | |
| GO: 1902600 | Biological Process | proton transmembrane transport | 0.003 | |
| GO:0005739 | Cellular Component | mitochondrion | 0.009 | |
| GO:0005743 | Cellular Component | mitochondrial inner membrane | 0.010 | |
| GO:0008021 | Cellular Component | synaptic vesicle | 0.049 | |
| GO:0007399 | Biological Process | nervous system development | 0.049 |
Additional files
-
Supplementary file 1
Details of the samples used in this study.
- https://cdn.elifesciences.org/articles/87198/elife-87198-supp1-v1.xlsx
-
Supplementary file 2
Sequencing reads of hadal snailfish and Tanaka’s snailfish.
- https://cdn.elifesciences.org/articles/87198/elife-87198-supp2-v1.xlsx
-
Supplementary file 3
Genome assembly statistics for hadal snailfish and Tanaka’s snailfish.
- https://cdn.elifesciences.org/articles/87198/elife-87198-supp3-v1.xlsx
-
Supplementary file 4
Results of BUSCO evaluations of hadal snailfish and Tanaka’s snailfish.
- https://cdn.elifesciences.org/articles/87198/elife-87198-supp4-v1.xlsx
-
Supplementary file 5
Transcriptome for hadal snailfish, Tanaka’s snailfish, and zebrafish.
- https://cdn.elifesciences.org/articles/87198/elife-87198-supp5-v1.xlsx
-
Supplementary file 6
The genome information of the species used in this work.
- https://cdn.elifesciences.org/articles/87198/elife-87198-supp6-v1.xlsx
-
Supplementary file 7
Summary of repetitive sequences in hadal snailfish and Tanaka’s snailfish.
- https://cdn.elifesciences.org/articles/87198/elife-87198-supp7-v1.xlsx
-
Supplementary file 8
The genes specifically lost in hadal snailfish.
- https://cdn.elifesciences.org/articles/87198/elife-87198-supp8-v1.xlsx
-
Supplementary file 9
The unitary pseudogenes identified in hadal snailfish.
- https://cdn.elifesciences.org/articles/87198/elife-87198-supp9-v1.xlsx
-
Supplementary file 10
List of genes with more copies in hadal snailfish compared to Tanaka’s snailfish.
- https://cdn.elifesciences.org/articles/87198/elife-87198-supp10-v1.xlsx
-
Supplementary file 11
The genes with site-specific amino acid mutations (with a length ≥3 amino acids) in hadal snailfish.
- https://cdn.elifesciences.org/articles/87198/elife-87198-supp11-v1.xlsx
-
Supplementary file 12
Expression of 33 de novo-originated new genes in hadal snailfish in various tissues.
- https://cdn.elifesciences.org/articles/87198/elife-87198-supp12-v1.xlsx
-
Supplementary file 13
Depth of survival of some fishes of the Liparidae.
- https://cdn.elifesciences.org/articles/87198/elife-87198-supp13-v1.xlsx
-
Supplementary file 14
Expression of auditory-related genes in hadal snailfish.
- https://cdn.elifesciences.org/articles/87198/elife-87198-supp14-v1.xlsx
-
Supplementary file 15
GO enrichment of expression upregulated and downregulated genes in hadal snailfish brain.
- https://cdn.elifesciences.org/articles/87198/elife-87198-supp15-v1.xlsx
-
Supplementary file 16
The TPM of fmo3 gene copies in hadal snailfish and Tanaka’s snailfish.
- https://cdn.elifesciences.org/articles/87198/elife-87198-supp16-v1.xlsx
-
MDAR checklist
- https://cdn.elifesciences.org/articles/87198/elife-87198-mdarchecklist1-v1.docx
Download links
A two-part list of links to download the article, or parts of the article, in various formats.
Downloads (link to download the article as PDF)
Open citations (links to open the citations from this article in various online reference manager services)
Cite this article (links to download the citations from this article in formats compatible with various reference manager tools)
Chromosome-level genome assembly of hadal snailfish reveals mechanisms of deep-sea adaptation in vertebrates
eLife 12:RP87198.
https://doi.org/10.7554/eLife.87198.3


