Differential translation of mRNA isoforms underlies oncogenic activation of cell cycle kinase Aurora A
- Department of Pharmacology, University of Cambridge, United Kingdom
- Department of Biological Sciences, Orta Dogu Teknik Universitesi, Turkey
- Department of Biology, Ondokuz Mayis Universitesi, Turkey
Figures
Figure 1
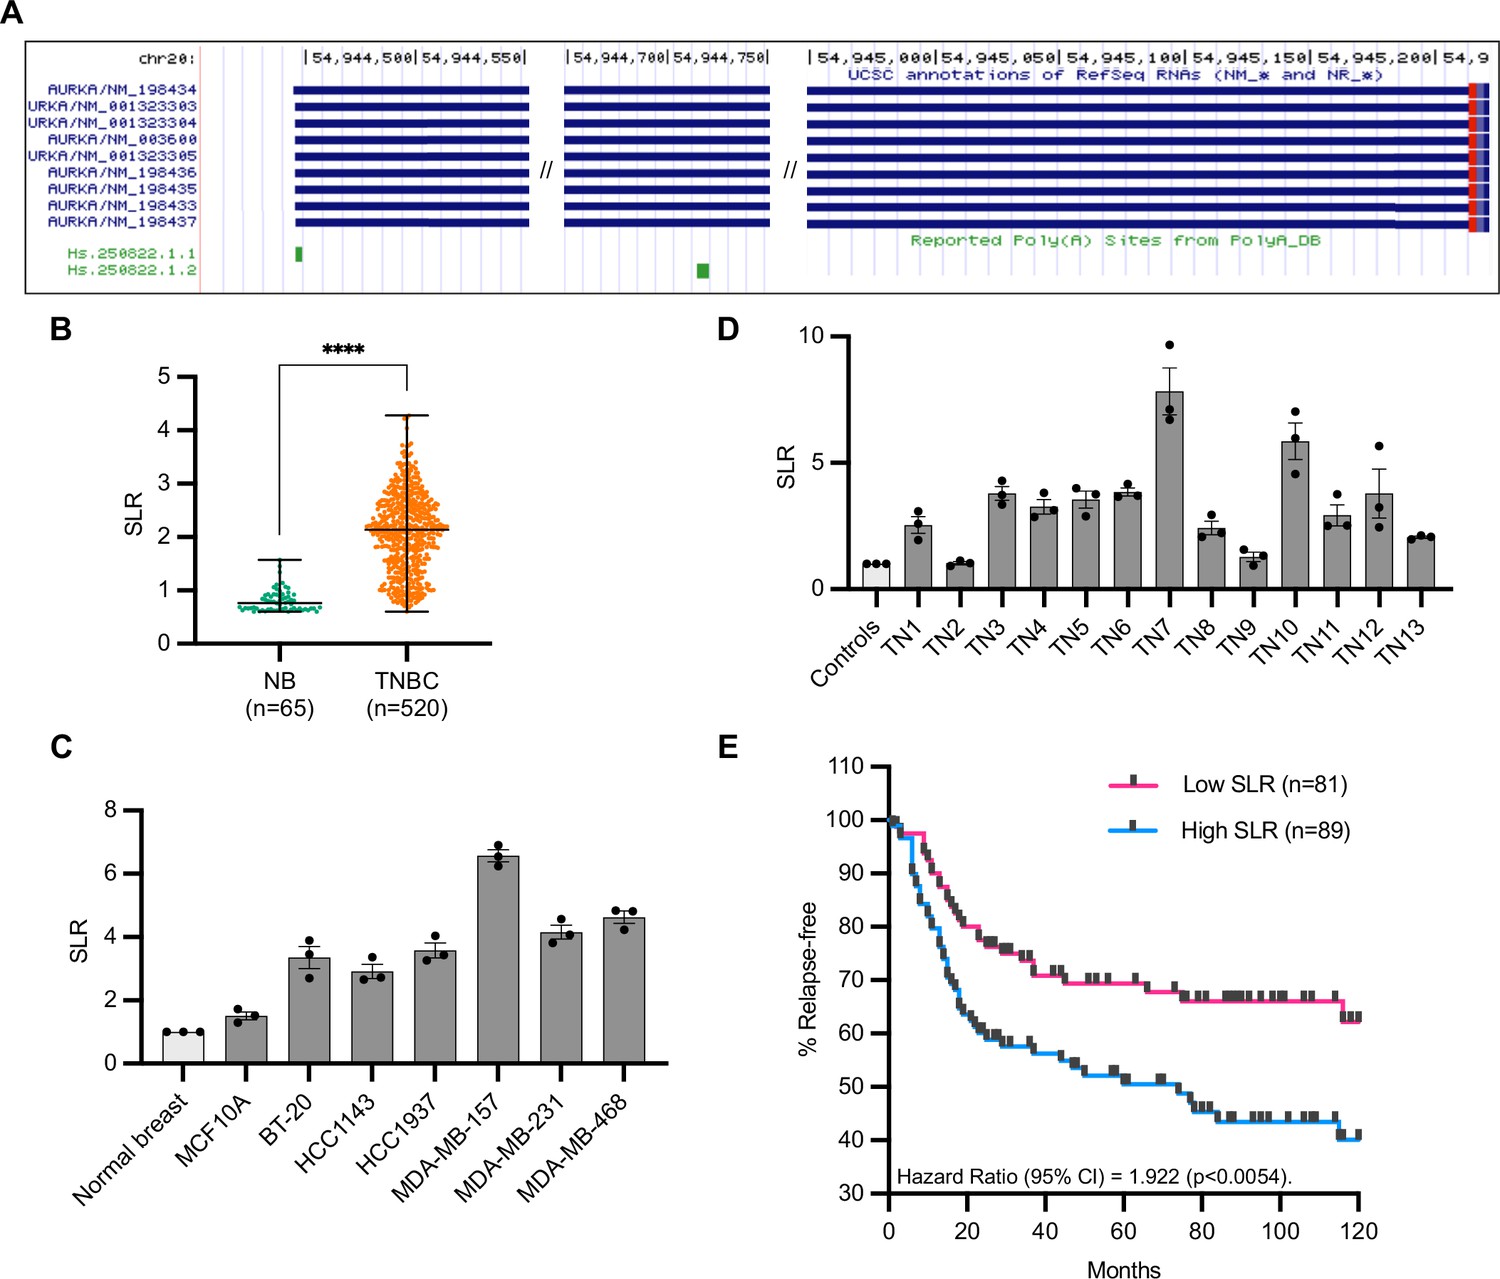
Increased short/long ratio (SLR) of Aurora Kinase A (AURKA) alternative polyadenylation (APA) isoforms in triple-negative breast cancer (TNBC).
(A) AURKA transcript isoforms (USCS Genome Browser). AURKA gene is located on (-) strand. (B) Median and range of SLR values for AURKA 3′UTR obtained using APADetect. Mann–Whitney test; ****p<0.0001. (C), (D) RT-qPCR analysis of SLR of AURKA 3′UTR in TNBC cell lines (C) and patient samples (D). SDHA used as reference gene. TN, tissue number. (E) Relapse-free survival rates of TNBC patients with high (highest 25%) or low (lowest 25%) AURKA SLRs. p-value determined by log-rank test.
-
Figure 1—source data 1
Numerical data for graphs.
- https://cdn.elifesciences.org/articles/87253/elife-87253-fig1-data1-v1.xlsx
Figure 2 with 1 supplement
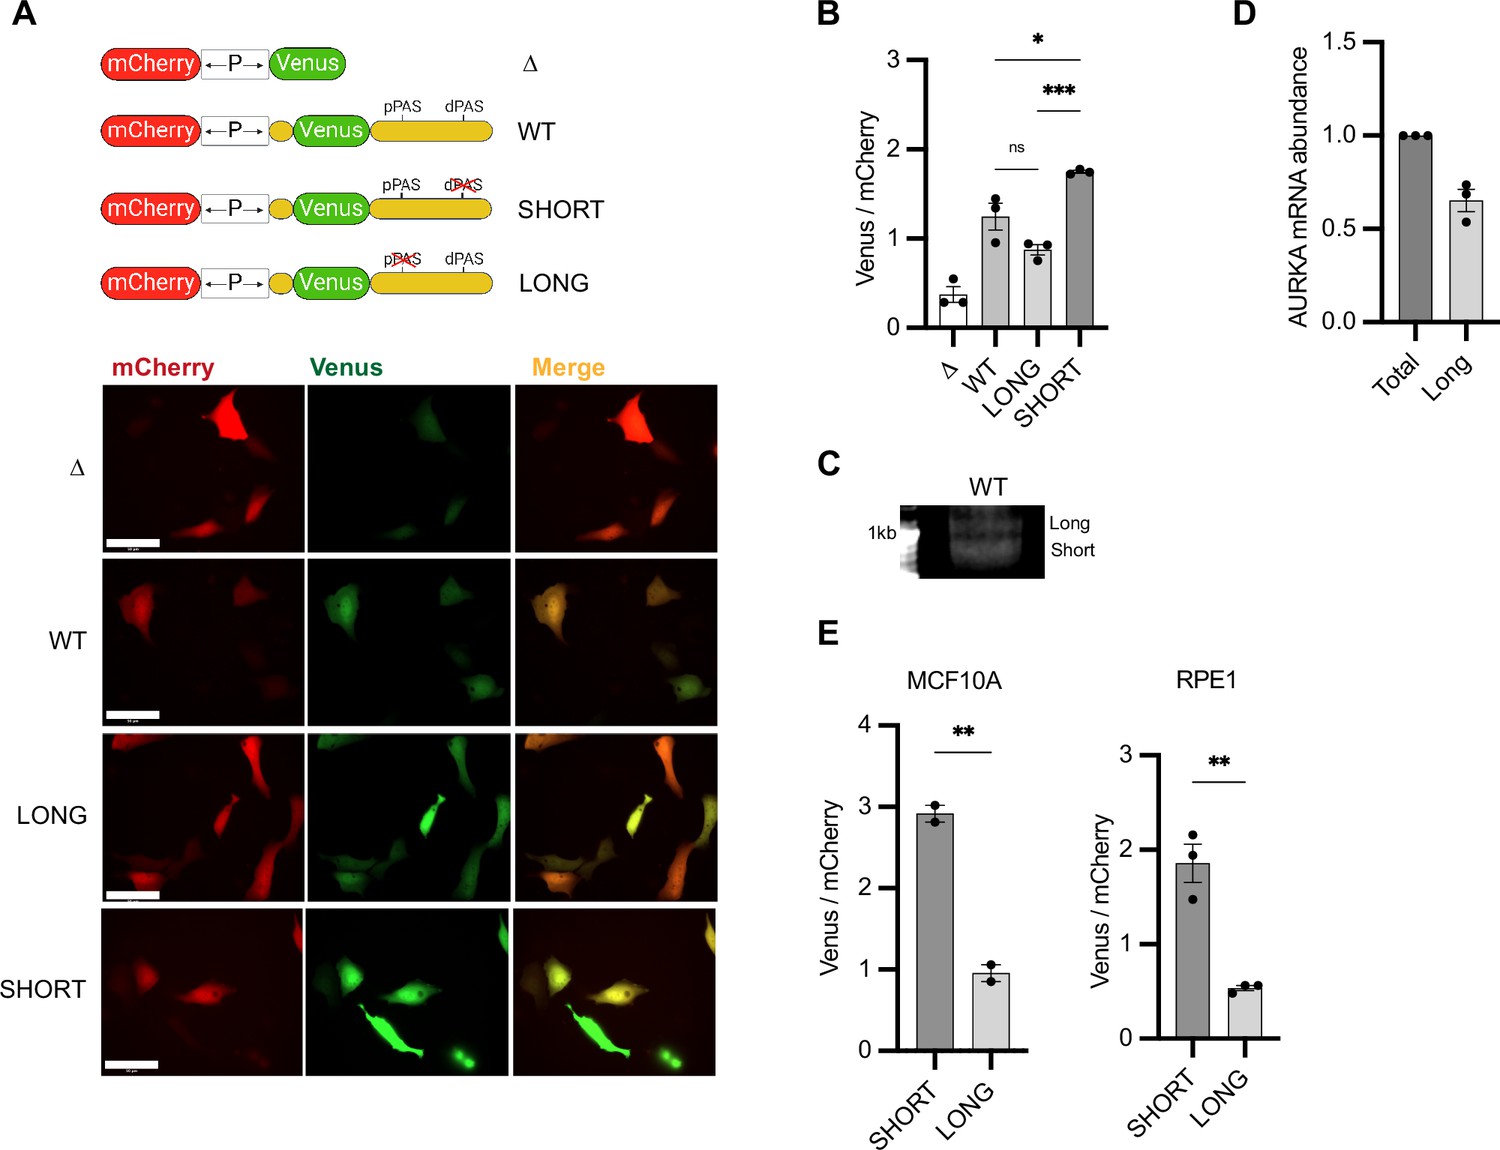
Aurora Kinase A (AURKA) shows 3′UTR isoform-dependent protein expression.
(A) Top: UTR-dependent protein expression reporters. Venus coding sequence (CDS) is flanked by AURKA 5′UTR and 3′UTR, WT or polyadenylation signal (PAS)-mutated. Bottom: representative snapshots of transfected U2OS cells. Scale bar 50 µm. (B) Mean and SEM of median Venus/mCherry mean fluorescence intensity (MFI) ratios from transfected U2OS cells from three biological replicates. n ≥ 129 cells per condition. Ordinary one-way ANOVA with Tukeys multiple-comparisons test. (C) 3′RACE of endogenous AURKA APA isoforms. (D) RT-qPCR of endogenous AURKA short/long ratio (SLR) in U2OS cells. Long isoform abundance plotted as fold change over total AURKA mRNA. 18S rRNA used as reference target. (E) Same as (B) but in MCF10A (left) and RPE1 (right) cells. n ≥ 55 cells per condition. Unpaired t-test. ns, not significant; *p<0.05; **p<0.01; ***p<0.001.
-
Figure 2—source data 1
Raw gel/blot images.
- https://cdn.elifesciences.org/articles/87253/elife-87253-fig2-data1-v1.zip
-
Figure 2—source data 2
Numerical data for graphs.
- https://cdn.elifesciences.org/articles/87253/elife-87253-fig2-data2-v1.xlsx
Figure 2—figure supplement 1
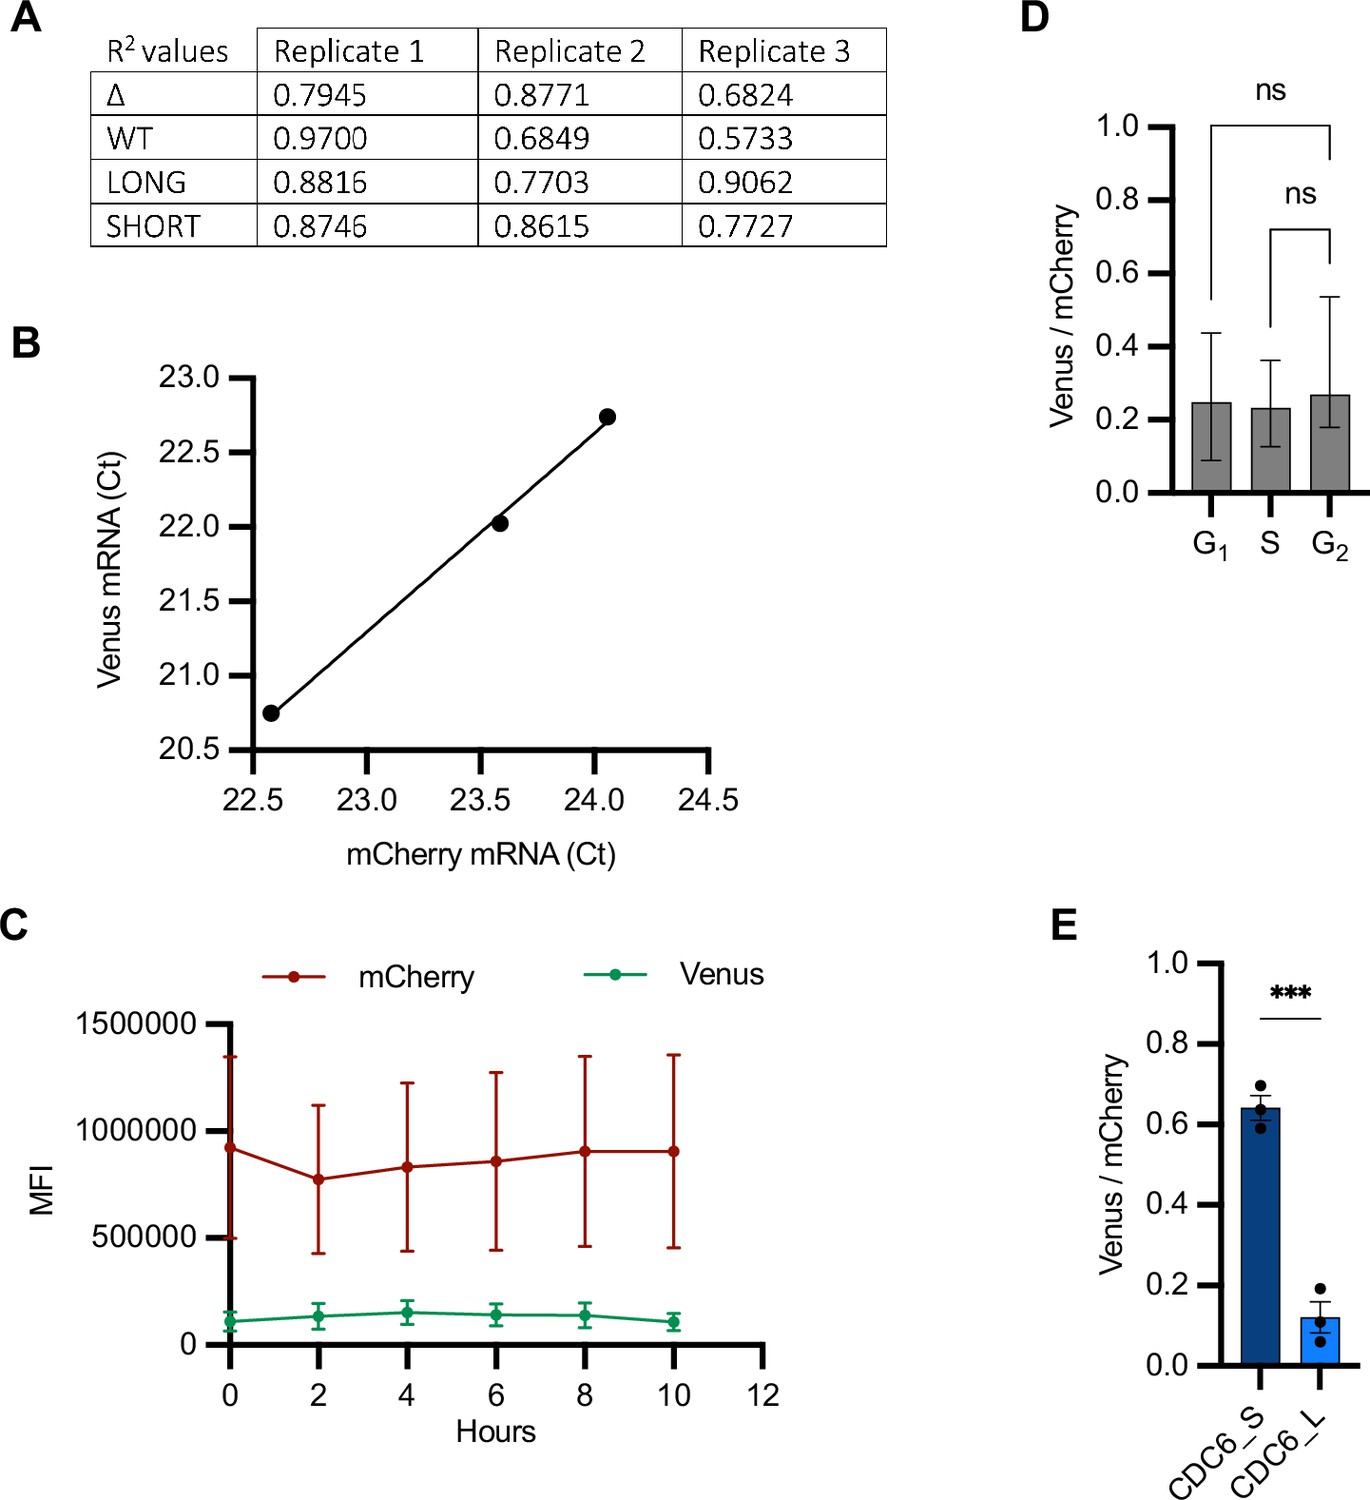
Validation of bidirectional reporter.
(A) R2 (coefficient of determination) values to indicate goodness of fit of a simple linear regression between mCherry and Venus single-cell mean fluorescence intensity (MFI) values. Data relative to Figure 2B. (B) RT-qPCR of mCherry and Venus mRNAs from three RNA extracts of U2OS cells transfected with Δ reporter. Ct values are mean between three technical replicates of the amplification reaction. (C) Quantification of mCherry and Venus MFI from U2OS cells transfected with the Δ reporter and imaged at the indicated time points. Mean and SEM (n = 8 cells) shown at each time point. (D) Single-cell Venus/mCherry MFI values from U2OSCDK2 cells transfected with Δ reporter grouped by intervals of CDK2 activity (Figure 4A, right) and plotted as median and 95% CI. n = 43 cells analyzed. Kruskal–Wallis with Dunnett’s multiple-comparisons test; ns, not significant. (E) Mean and SEM of median Venus/mCherry MFI ratios from U2OS cells transfected with constructs containing long or short CDC6 3′UTR from three biological replicates. n ≥ 119 cells per condition. Unpaired t-test; ***p=0.0005.
-
Figure 2—figure supplement 1—source data 1
Numerical data for graphs.
- https://cdn.elifesciences.org/articles/87253/elife-87253-fig2-figsupp1-data1-v1.xlsx
Figure 3
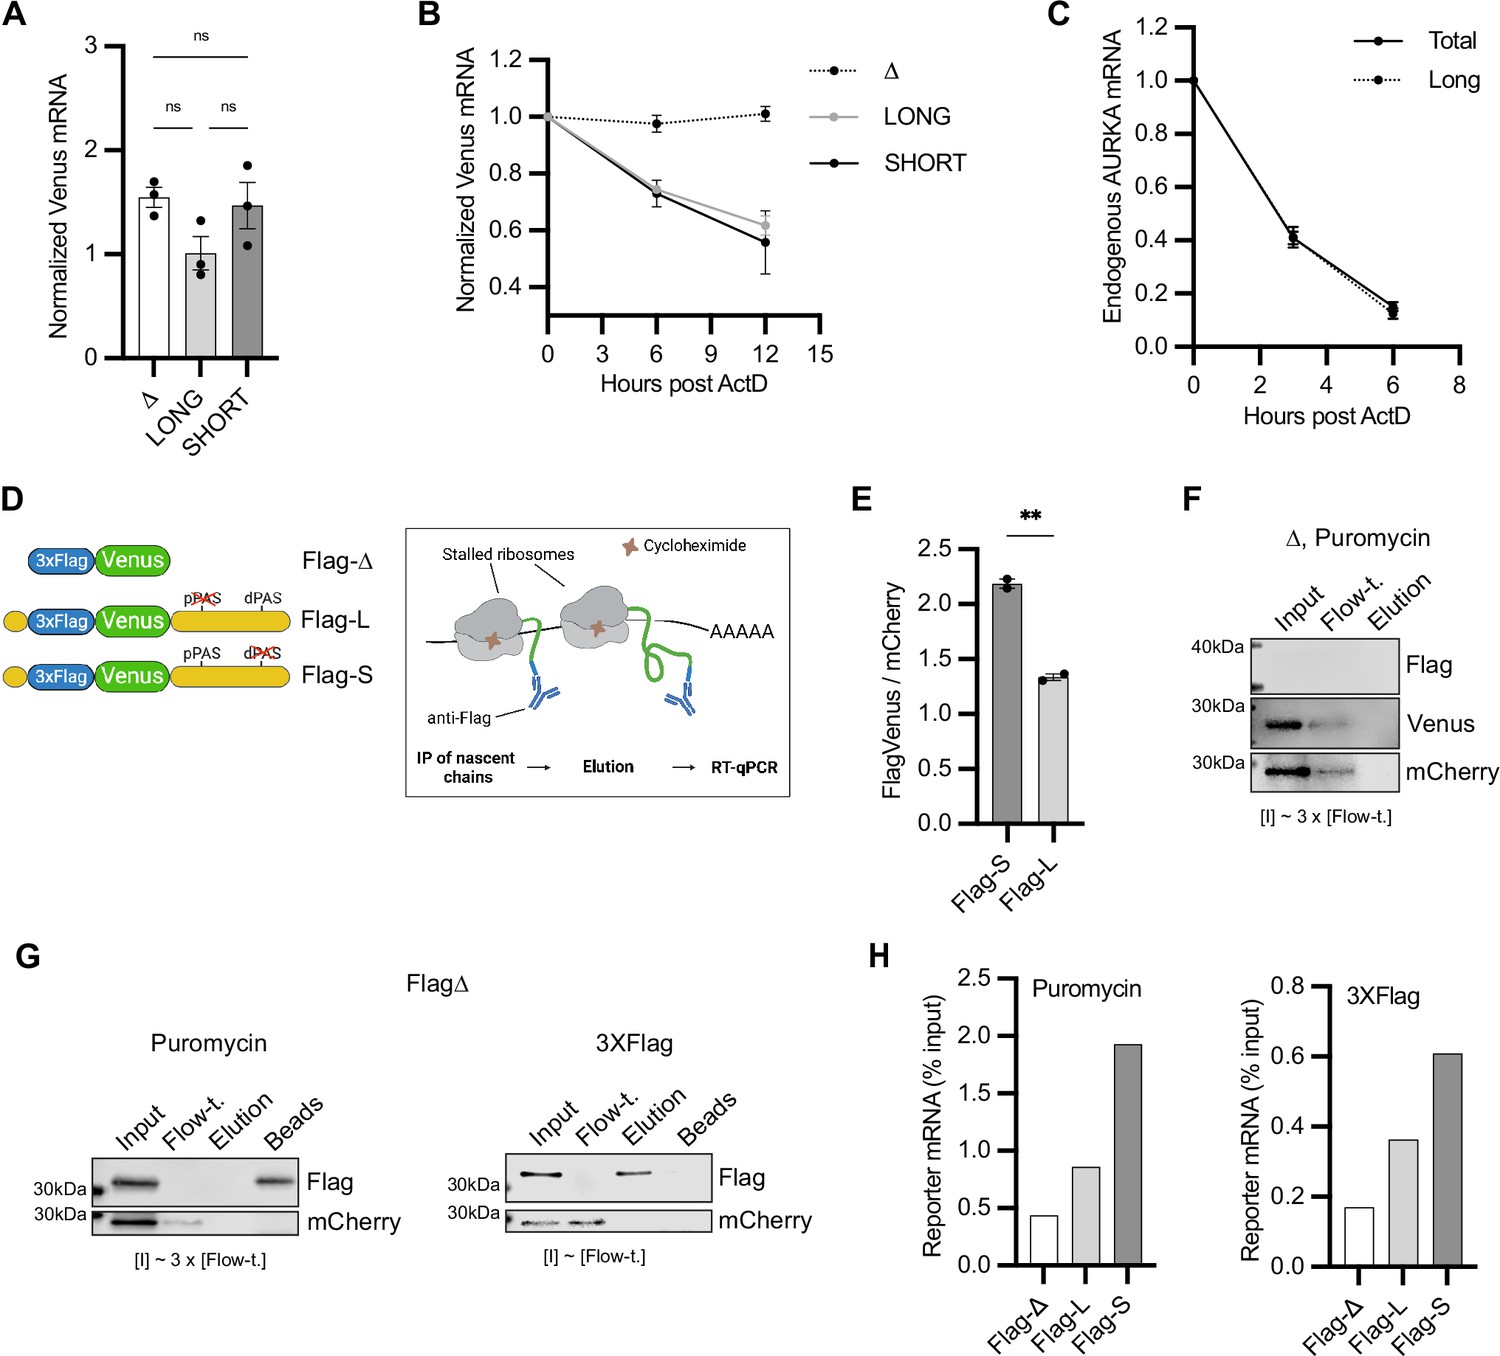
Aurora Kinase A (AURKA) alternative polyadenylation (APA) isoforms are translated with different efficiency.
(A, B) RT-qPCR of reporter mRNAs abundance (A) and decay rate (B) from transfected U2OS cells. mCherry mRNA used as reference target. Ordinary one-way ANOVA with Tukey’s multiple-comparisons test; ns, not significant. (C) Decay rate of endogenous AURKA mRNA as in (B). 18S rRNA used as reference target. Abundance of long isoform plotted as fold change over total AURKA mRNA. (D) Design of the nascent chain immunoprecipitation (NC IP) reporters and assay. (E) Mean and SEM of median FlagVenus/mCherry mean fluorescence intensity (MFI) ratios from transfected U2OS cells from two biological replicates. n ≥ 160 cells per condition. Unpaired t-test; **p<0.005. (F), (G) Immunoblots of NC IP fractions using Δ (F) or Flag-Δ (G) reporter. mCherry used as negative control. (H) RT-qPCR of eluted reporter mRNAs. Results representative of three biological replicates.
-
Figure 3—source data 1
Numerical data for graphs.
- https://cdn.elifesciences.org/articles/87253/elife-87253-fig3-data1-v1.xlsx
-
Figure 3—source data 2
Raw gel/blot images.
- https://cdn.elifesciences.org/articles/87253/elife-87253-fig3-data2-v1.zip
Figure 4 with 1 supplement

Translation rate of Aurora Kinase A (AURKA) alternative polyadenylation (APA) isoforms follows different cell cycle periodicity.
(A) Design of the translation rate imaging by rate of protein stabilization (TRIPS) reporters and assay (left) and CDK2 activity sensor (right). (B) Mean and SEM of median sfGFP/mCherry mean fluorescence intensity (MFI) ratios from U2OS cells transfected with TRIPS-Δ and imaged at 0 hr and 2 hr of 50 µM trimethoprim (TMP) treatment, with or without 0.1 mg/ml cycloheximide (CHX), from three biological replicates. Baseline at 0 hr. n ≥ 55 cells per condition. (C) RT-qPCR of sfGFP mRNA from U2OS cells transfected with TRIPS-Δ, at 0 hr and 2 hr of 50 µM TMP treatment. mCherry mRNA used as reference target. RNA extracts at 0 hr of treatment used as reference sample. (D) TRIPS (left) and C-TRIPS (right) assays in transfected U2OSCDK2 cells. n ≥ 200 cells per condition. Left: mean and SEM from three biological replicates. Right: median and 95% CI of pooled data from left. Kruskal–Wallis with Dunnett’s multiple-comparisons test. (E) RT-qPCR of endogenous AURKA mRNA in U2OS cells. 18S rRNA used as reference target. Baseline at G1/S. (F) Endogenous AURKA long isoform as in (E) plotted as percentage of total AURKA mRNA. (D) Left, (E, F) Ordinary one-way ANOVA with Tukey’s multiple-comparisons test. ns, not significant; *p<0.05; **p<0.01; ***p<0.0005; ****p<0.0001.
-
Figure 4—source data 1
Numerical data for graphs.
- https://cdn.elifesciences.org/articles/87253/elife-87253-fig4-data1-v1.xlsx
Figure 4—figure supplement 1
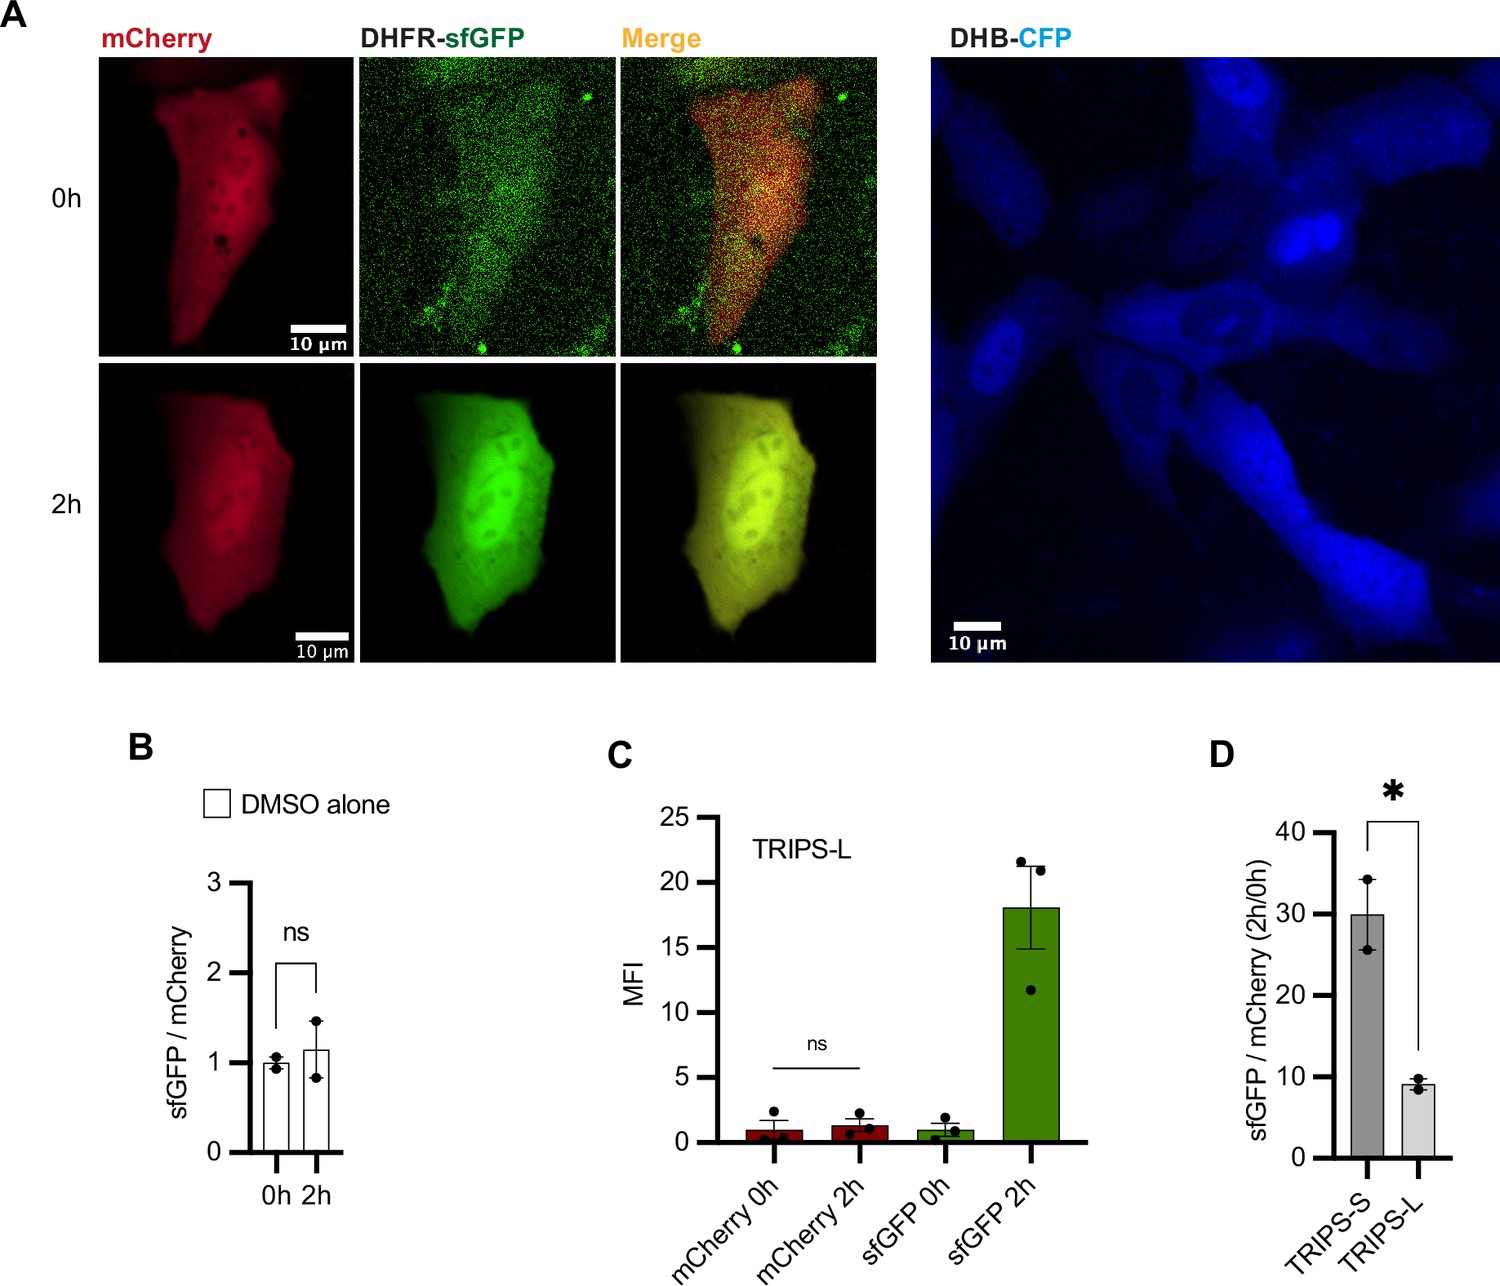
Validation of TRIPS assay.
(A) Left: representative U2OS cells transfected with TRIPS-S and imaged at 0 hr and 2 hr of 50 µM trimethoprim (TMP) treatment. Right: representative U2OSCDK2 cells. (B) TRIPS assay performed in U2OS cells transfected with TRIPS-Δ and treated with DMSO for 2 hr. Mean and SEM of median sfGFP/mCherry ratios from two biological replicates, with baseline at 0 hr. n = 95 cells analyzed. (C) Graph using data from Figure 4D showing mean fluorescence intensity (MFI) of mCherry and sfGFP at 0 hr and 2 hr of TMP treatment. Mean and SEM of median MFI values from three biological replicates. (D) TRIPS assay performed in transfected U2OS cells and imaged at 0 hr and 2 hr of 50 µM TMP treatment. Ratios between the median of single-cell sfGFP/mCherry ratios at 2 hr and that at 0 hr of TMP treatment were calculated for two biological replicates and are shown as mean and s.e.mSEM. n ≥ 343 cells analyzed per condition. (B–D) Unpaired t-test. ns, not significant; *p<0.05.
-
Figure 4—figure supplement 1—source data 1
Numerical data for graphs.
- https://cdn.elifesciences.org/articles/87253/elife-87253-fig4-figsupp1-data1-v1.xlsx
Figure 5
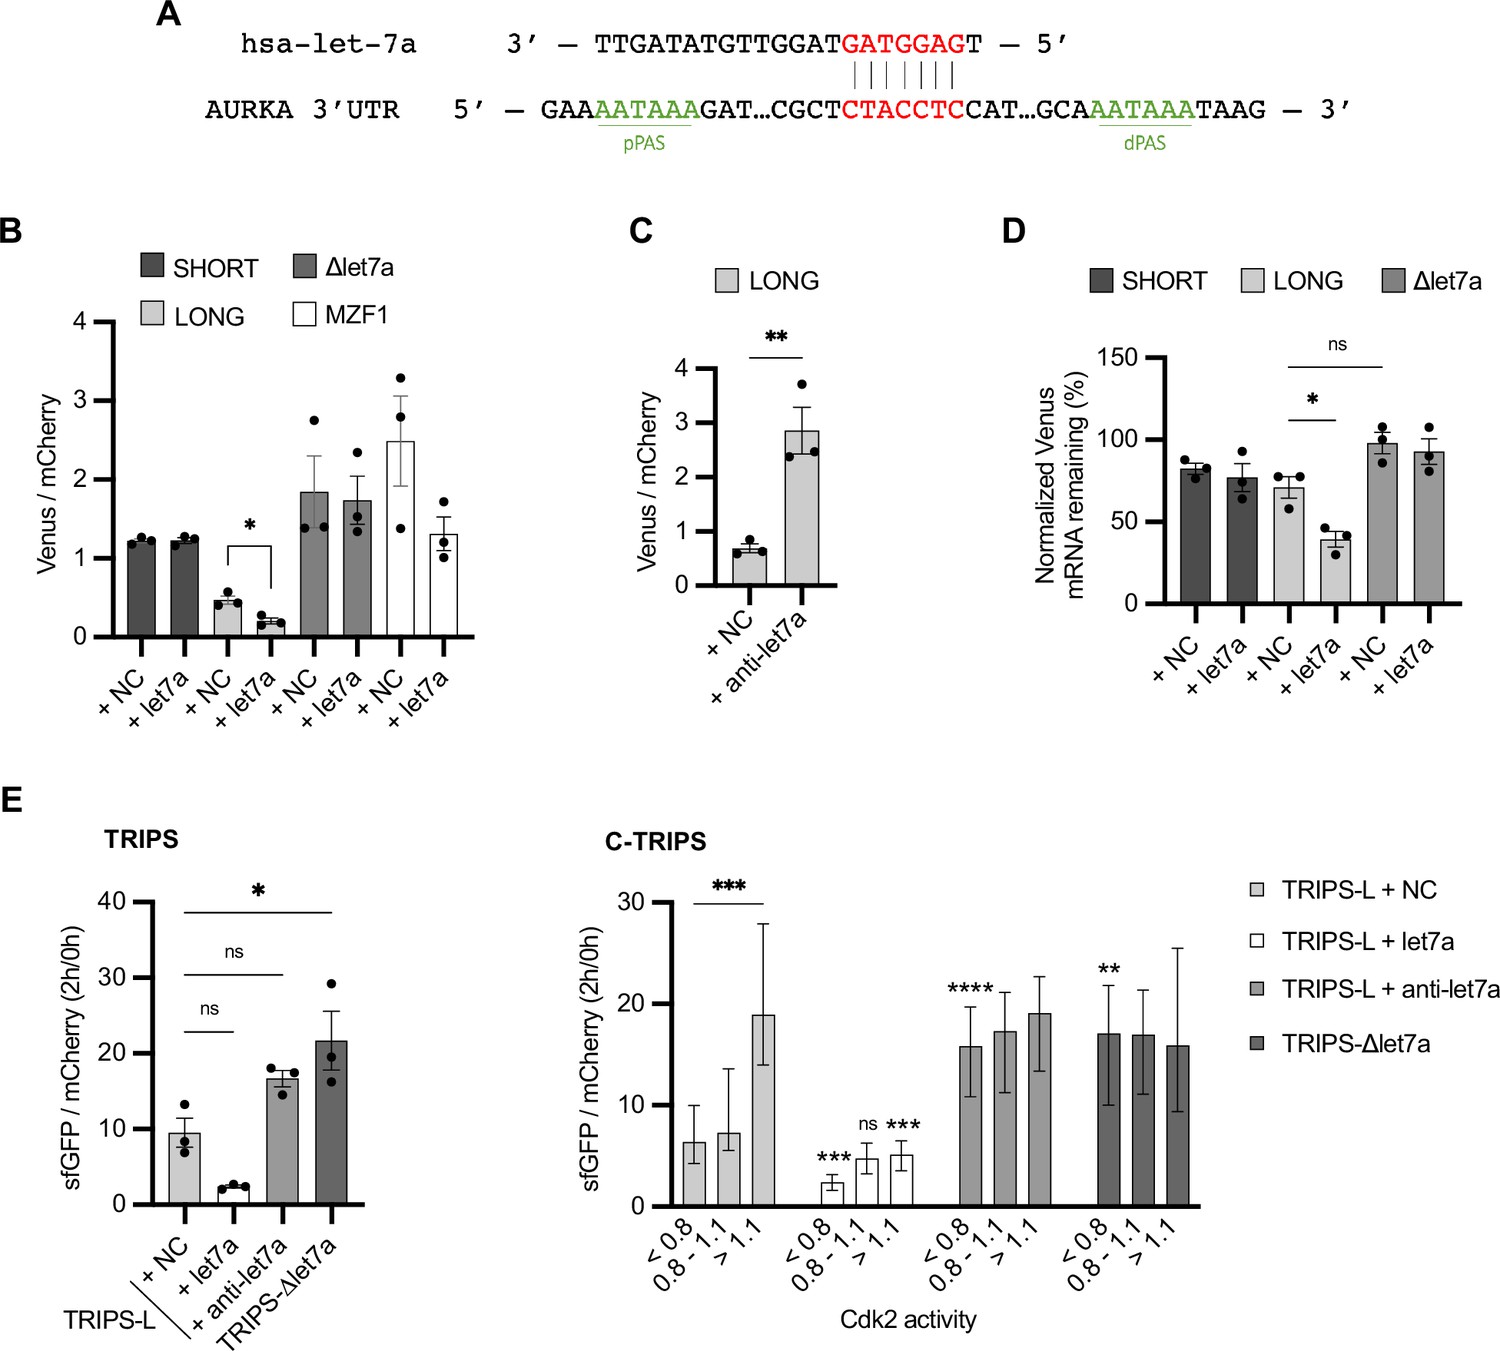
Translational periodicity of long 3′UTR isoform is regulated by hsa-let-7a miRNA.
(A) Complementarity of hsa-let-7a binding to Aurora Kinase A (AURKA) 3′UTR. (B) Mean and SEM of median Venus/mCherry mean fluorescence intensity (MFI) ratios from U2OS cells co-transfected with 250 nM hsa-let-7a or a negative control (NC) miRNA from three biological replicates. n ≥ 182 cells per condition. Unpaired t-test. (C) Same as (B) but co-transfecting 300 nM anti-let-7a or NC. n ≥ 94 cells per condition. Unpaired t-test. (D) RT-qPCR of reporter mRNAs abundance from U2OS cells transfected as (B), at 8 hr of 10 μg/ml ActD. mCherry mRNA used as reference target. Ordinary one-way ANOVA with Tukey’s multiple-comparisons test. (E) Translation rate imaging by rate of protein stabilization (TRIPS) (left) and C-TRIPS (right) assays in transfected U2OSCDK2 cells. n ≥ 162 cells per condition Left: mean and SEM from three biological replicates. Ordinary one-way ANOVA with Dunnett’s multiple-comparisons test vs. NC. Right: median and 95% CI of pooled data from left. Kruskal–Wallis with Dunnett’s multiple-comparisons test vs. NC of the respective phase. ns, not significant; *p<0.05; **p<0.01; ***p<0.001; ****p<0.0001.
-
Figure 5—source data 1
Numerical data for graphs.
- https://cdn.elifesciences.org/articles/87253/elife-87253-fig5-data1-v1.xlsx
Figure 6 with 1 supplement
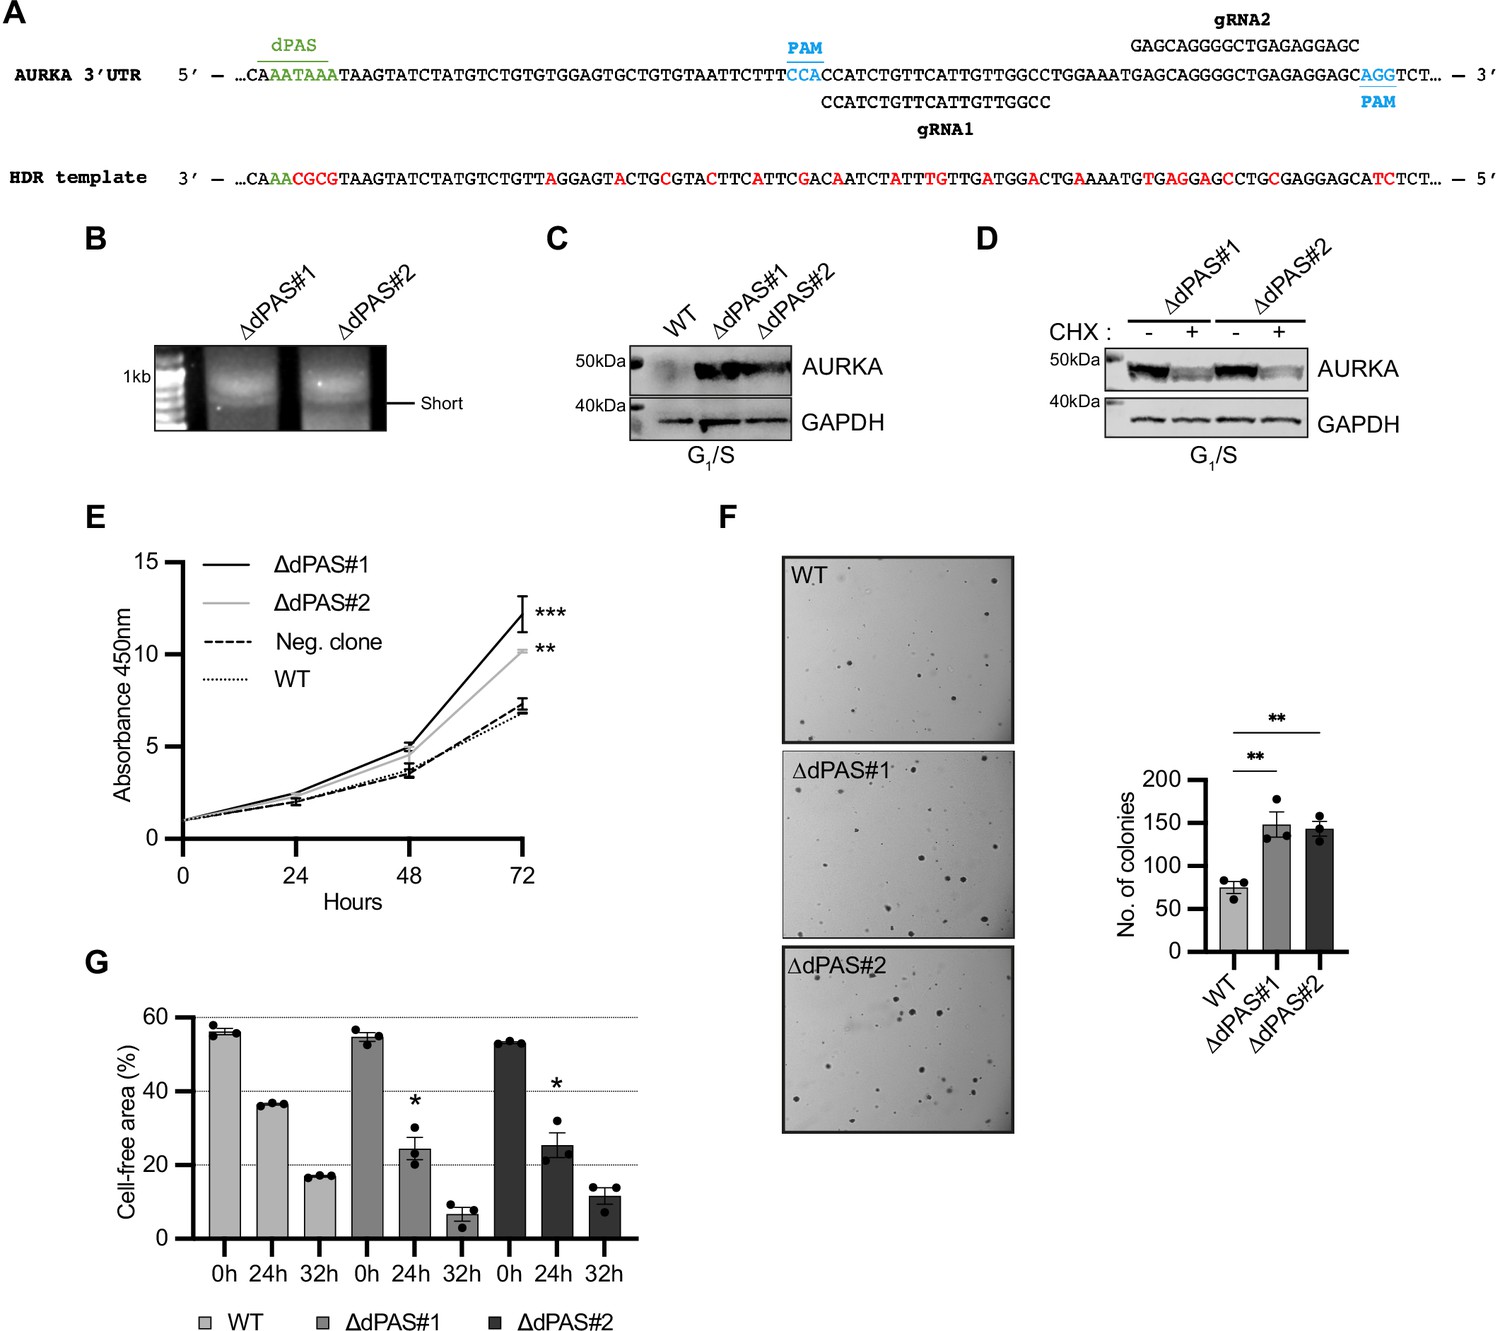
Increased Aurora Kinase A (AURKA) short/long ratio is sufficient to disrupt cell behavior.
(A) Design of CRISPR editing. Nucleotide substitutions in red. (B) 3′RACE of endogenous AURKA alternative polyadenylation (APA) isoforms. (C), (D) Western blot after G1/S enrichment (C) and with or without 6 hr treatment with 0.1 mg/ml cycloheximide (CHX) (D). Blots representative of three biological replicates. (E) CCK8 assay. A nonparental WT U2OS cell line used as negative control. Ordinary one-way ANOVA with Dunnett’s multiple-comparisons test vs. WT; **p<0.005; ***p<0.001. (F) Left: representative images of cells grown in soft agar. Right: mean number of clones and SEM of three biological replicates. (G) Measurement of migration rate. (F, G) Ordinary one-way ANOVA with Dunnett’s multiple-comparisons test vs. WT; *p<0.05; **p<0.01.
-
Figure 6—source data 1
Raw gel/blot images.
- https://cdn.elifesciences.org/articles/87253/elife-87253-fig6-data1-v1.zip
-
Figure 6—source data 2
Numerical data for graphs.
- https://cdn.elifesciences.org/articles/87253/elife-87253-fig6-data2-v1.xlsx
Figure 6—figure supplement 1
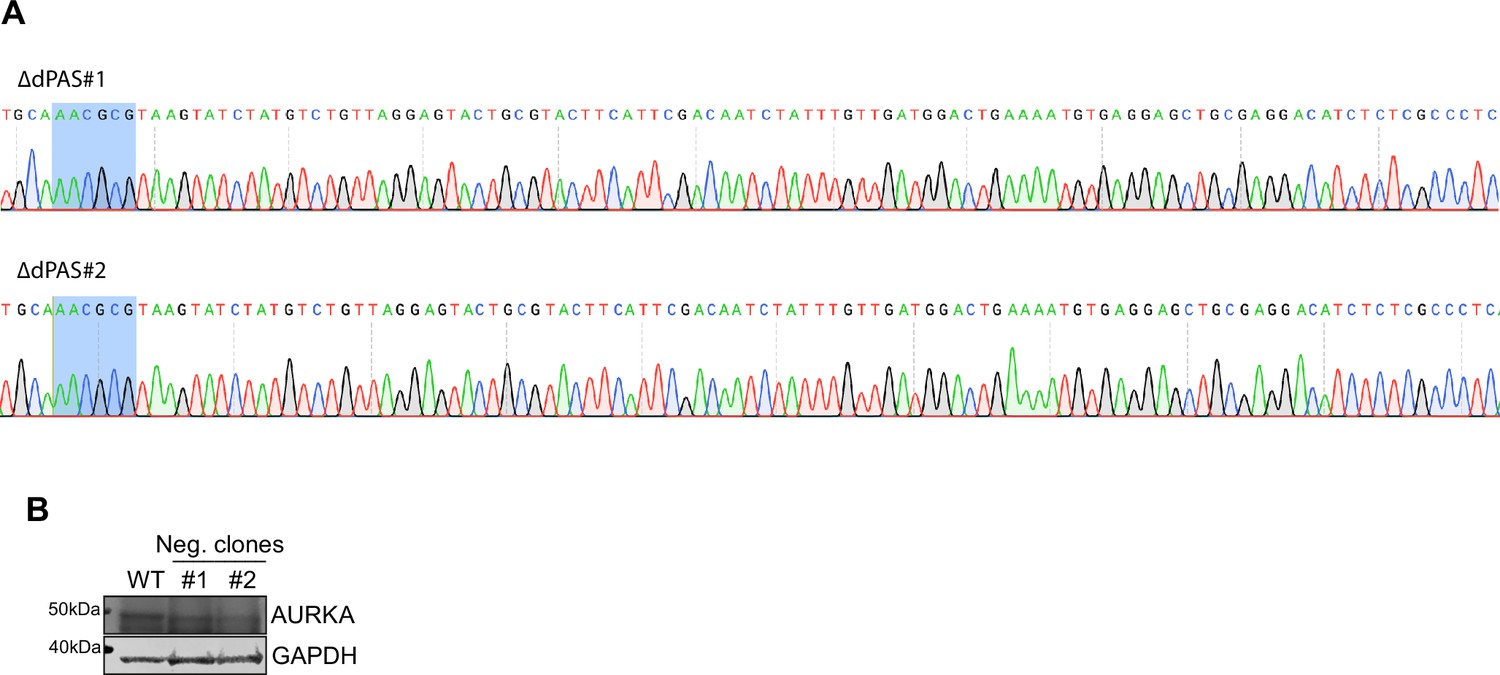
Validation of mutated cell lines.
(A) Sanger sequencing validation of the mutated dPAS element in two cell lines. (B) Western blot showing similar Aurora Kinase A (AURKA) protein expression in unsynchronized WT or U2OS cell lines that were not mutated following CRISPR editing (#1, #2).
-
Figure 6—figure supplement 1—source data 1
Raw gel/blot images.
- https://cdn.elifesciences.org/articles/87253/elife-87253-fig6-figsupp1-data1-v1.zip
Appendix 1—figure 1

Assessment of DNA contamination of RNA extracts.
(A) Lack of genomic DNA (gDNA) contamination in RNA samples was assessed by PCR using Aurora Kinase A (AURKA)-specific primers. RNA extracts from U2OS cells electroporated with the indicated reporters (Figure 2A) were used as template for the amplification reaction. An RNA extract from mock transfected U2OS cells used as negative control. gDNA from untransfected U2OS cells used as positive control. (B) Lack of plasmid DNA contamination in RNA samples was assessed by PCR using mCherry specific primers. RNA extracts from U2OS cells electroporated with the indicated reporters (Figure 2A) were used as template for the amplification reaction. An RNA extract from mock transfected U2OS cells and gDNA from untransfected U2OS cells used as negative controls. pBI-mCherry plasmid (pBI-mCh) used as positive control template.
Appendix 1—figure 2
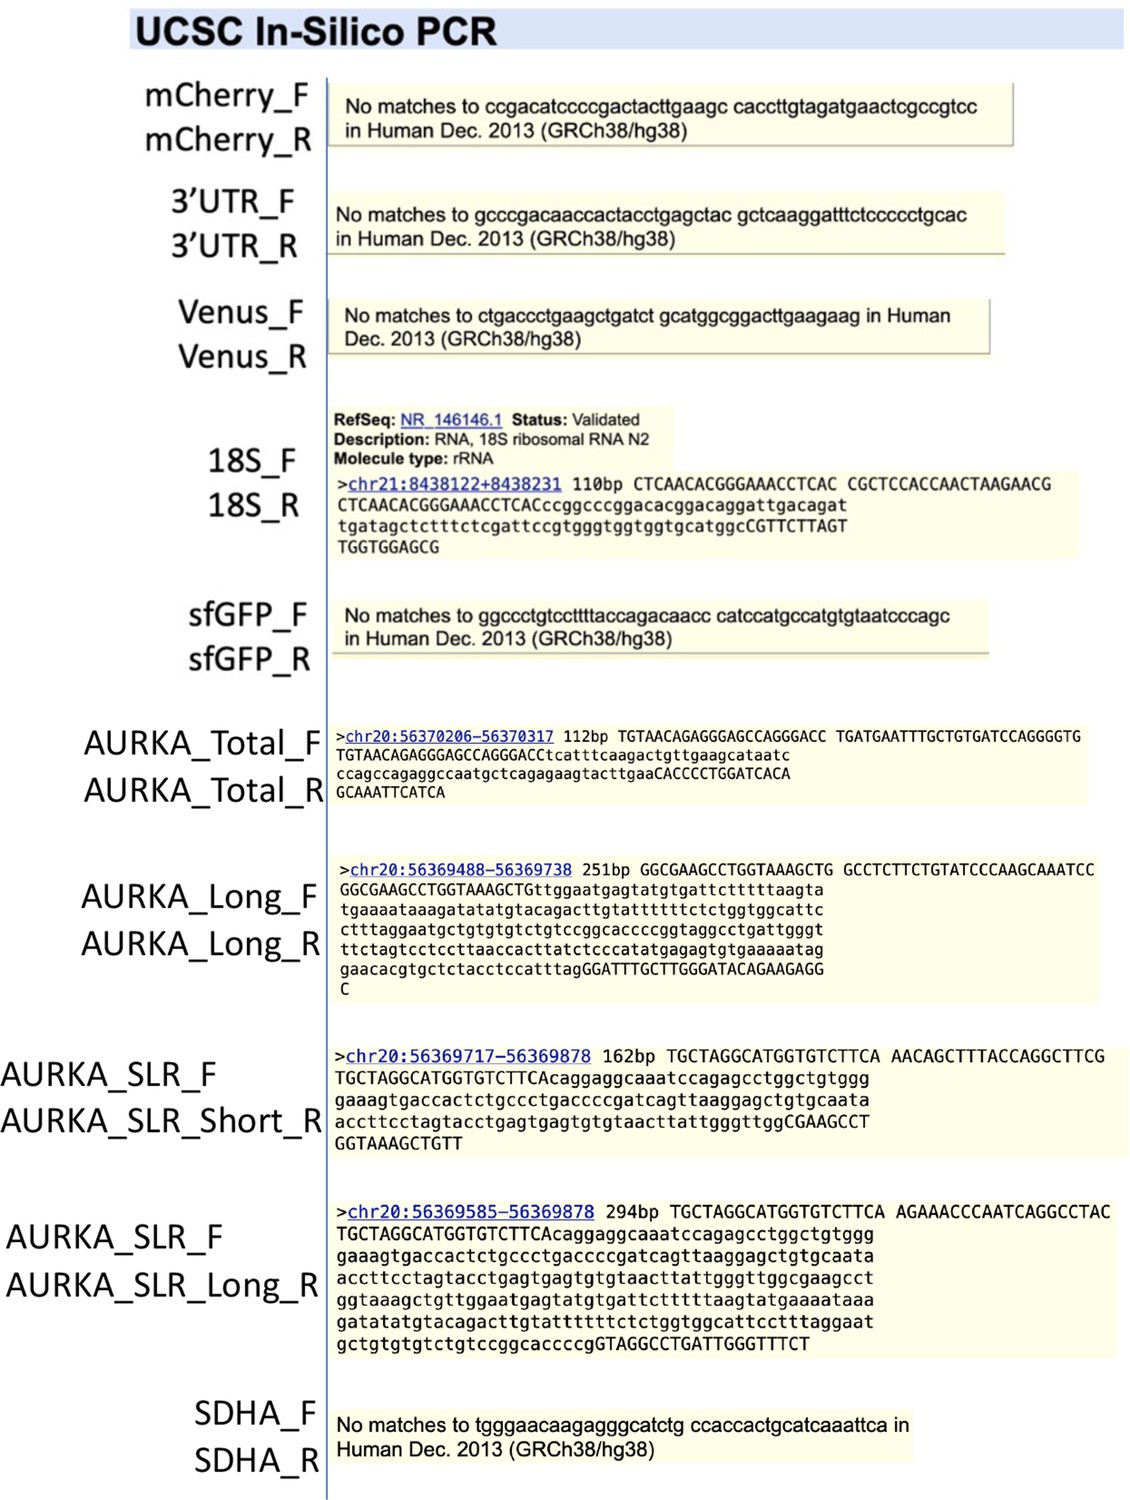
Predicted targets on human genome of primer pairs used in this study.
Analysis performed using UCSC In-Silico PCR tool (https://genome.ucsc.edu/cgi-bin/hgPcr). Genomic PCR product of SDHA primer pairs is above >850 bp length set for the in silico search.
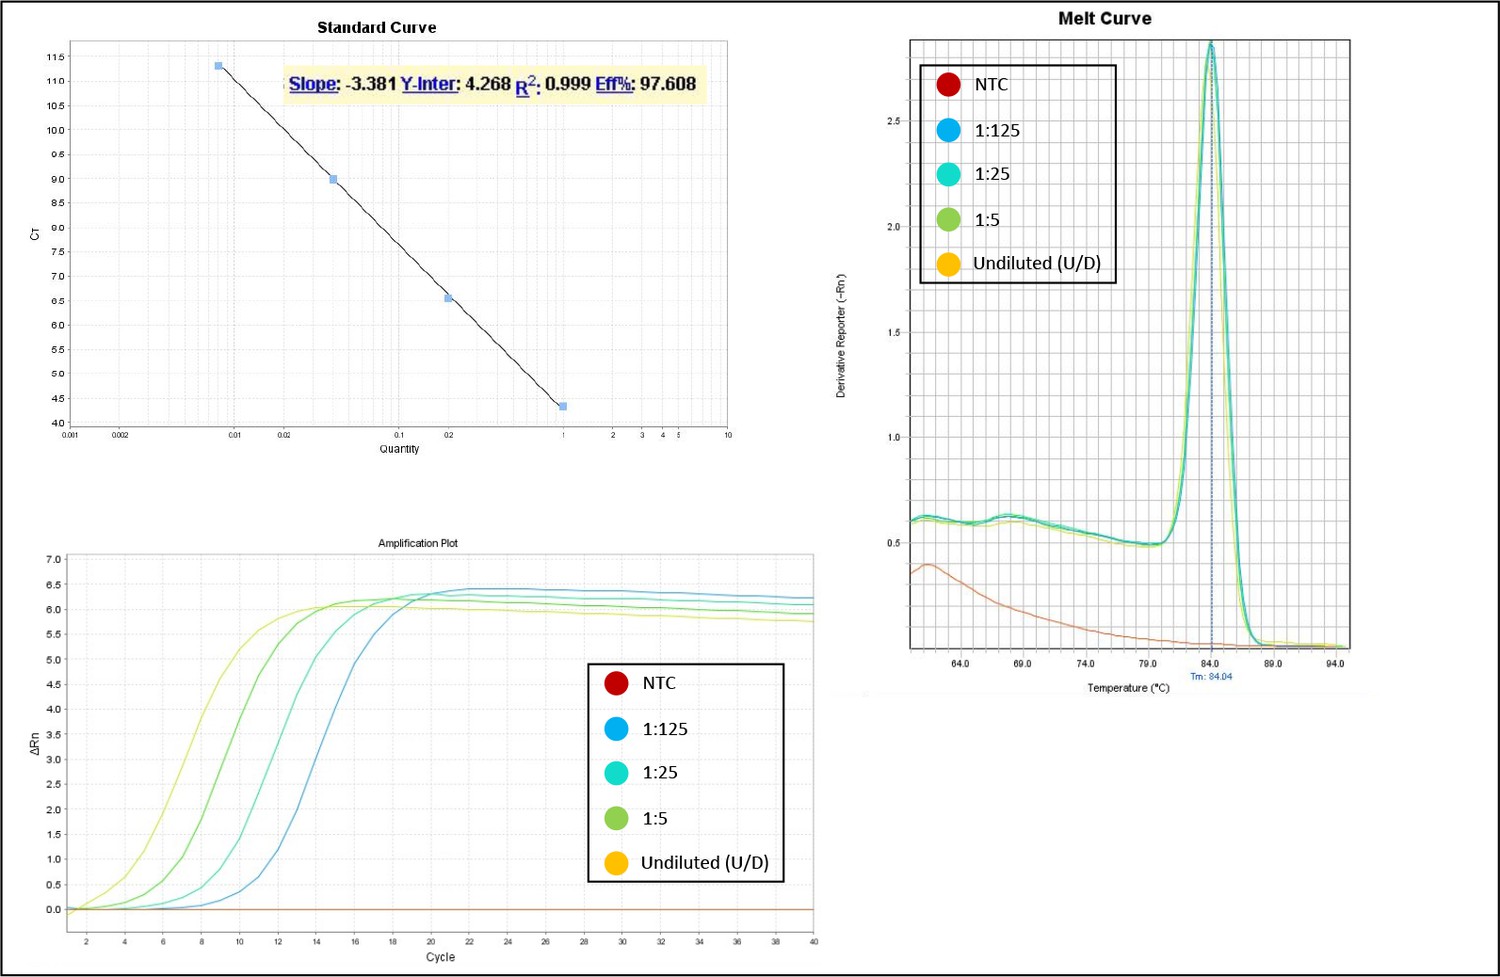
Appendix 1—figure 3
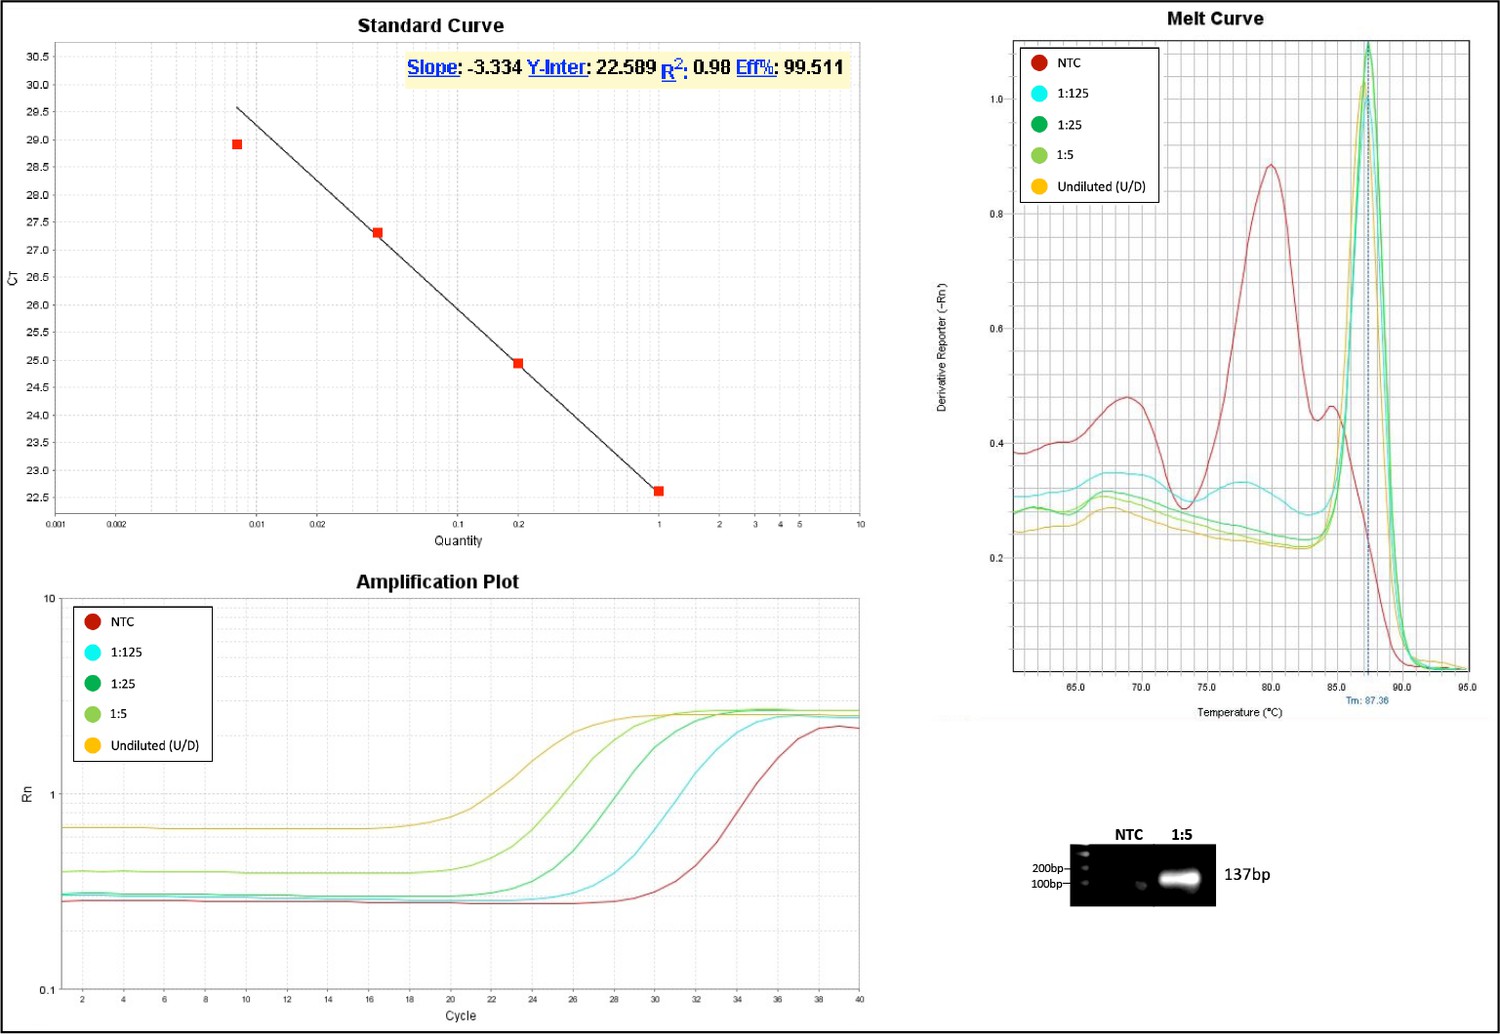
Validation of primer pairs used in RT-qPCR.
Standard curve, melt curve, and amplification plot of amplification reactions of serial dilutions (1:5) are shown. Sample reactions were loaded on gel to validate amplicon size. NTC, non-template control.
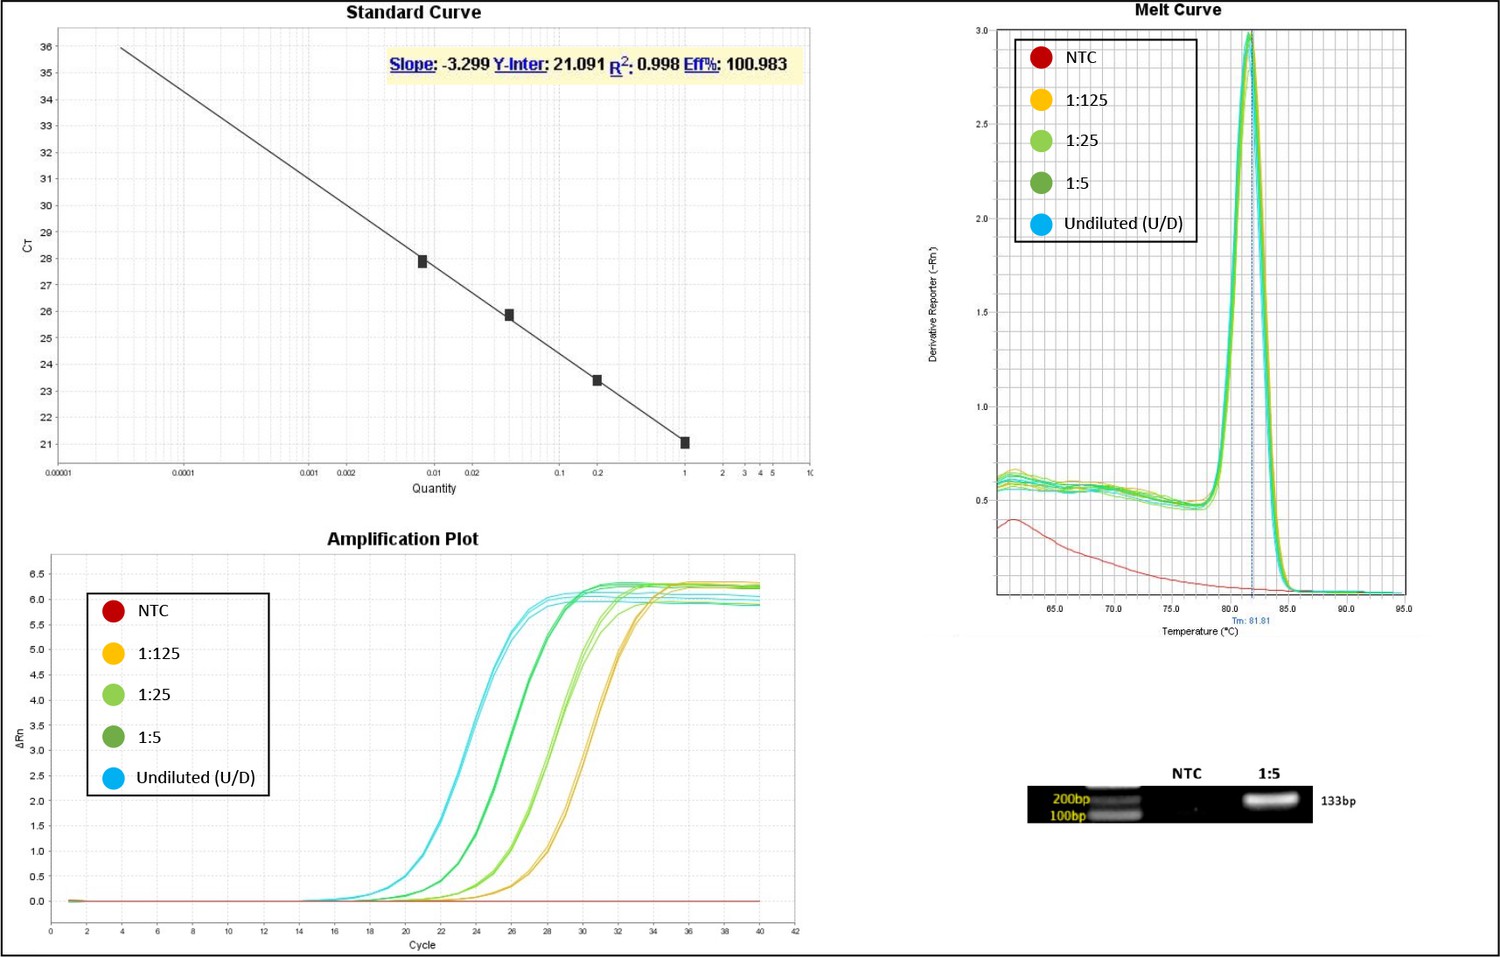
Appendix 1—figure 4
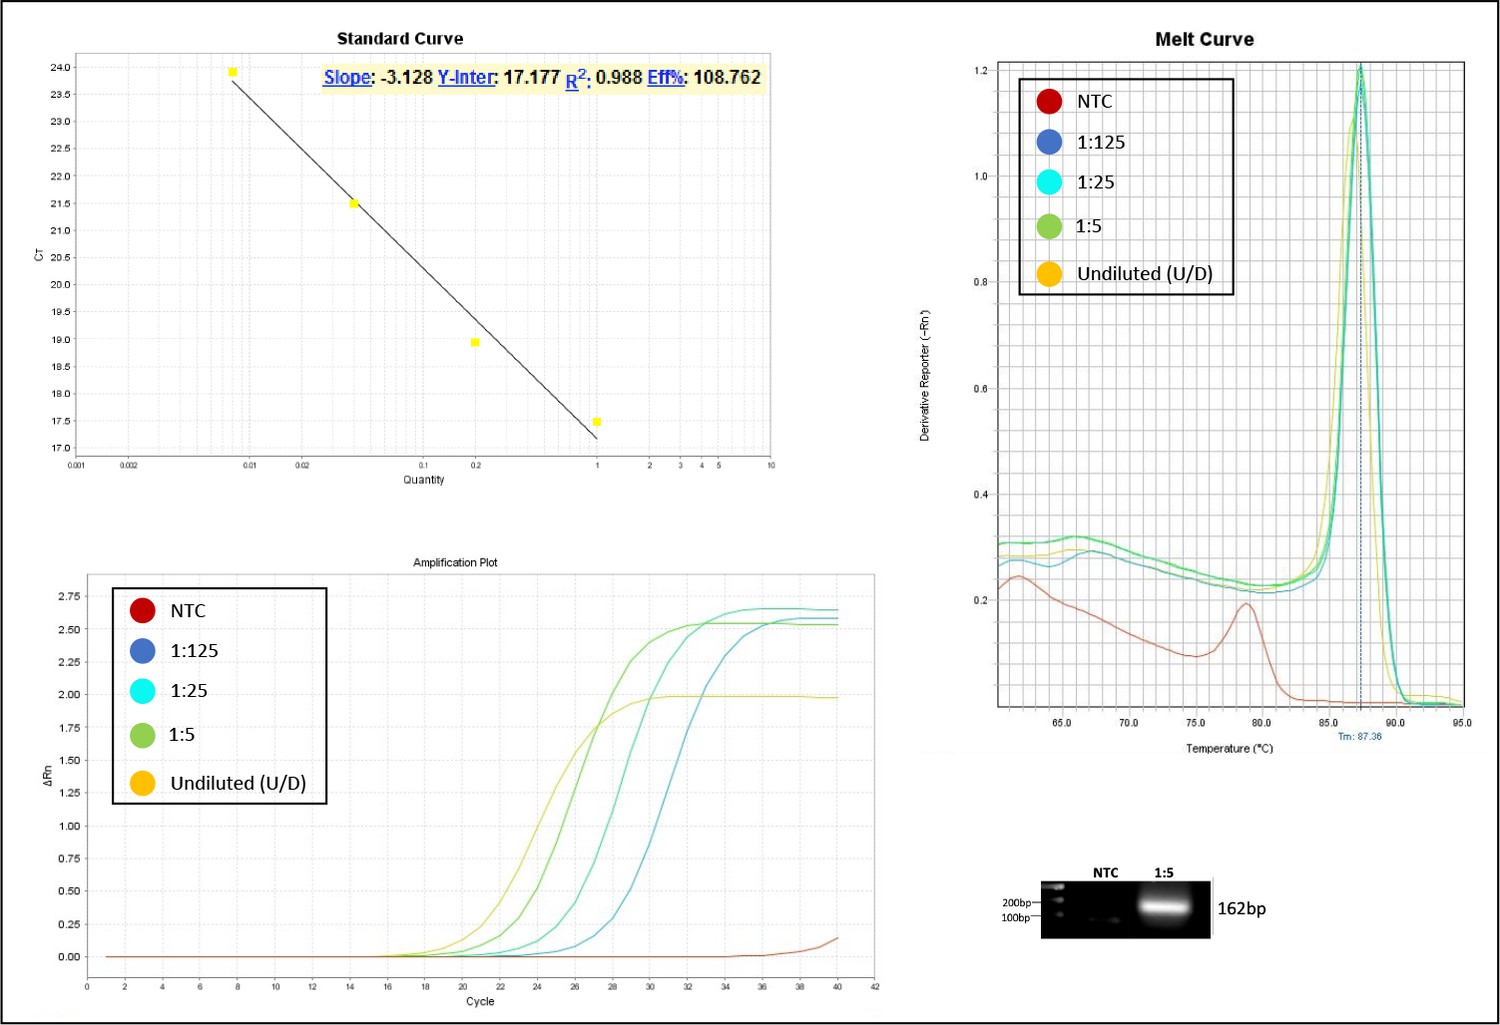
Validation of primer pairs used in RT-qPCR.
Standard curve, melt curve, and amplification plot of amplification reactions of serial dilutions (1:5) are shown. Sample reactions were loaded on gel to validate amplicon size. NTC, non-template control.
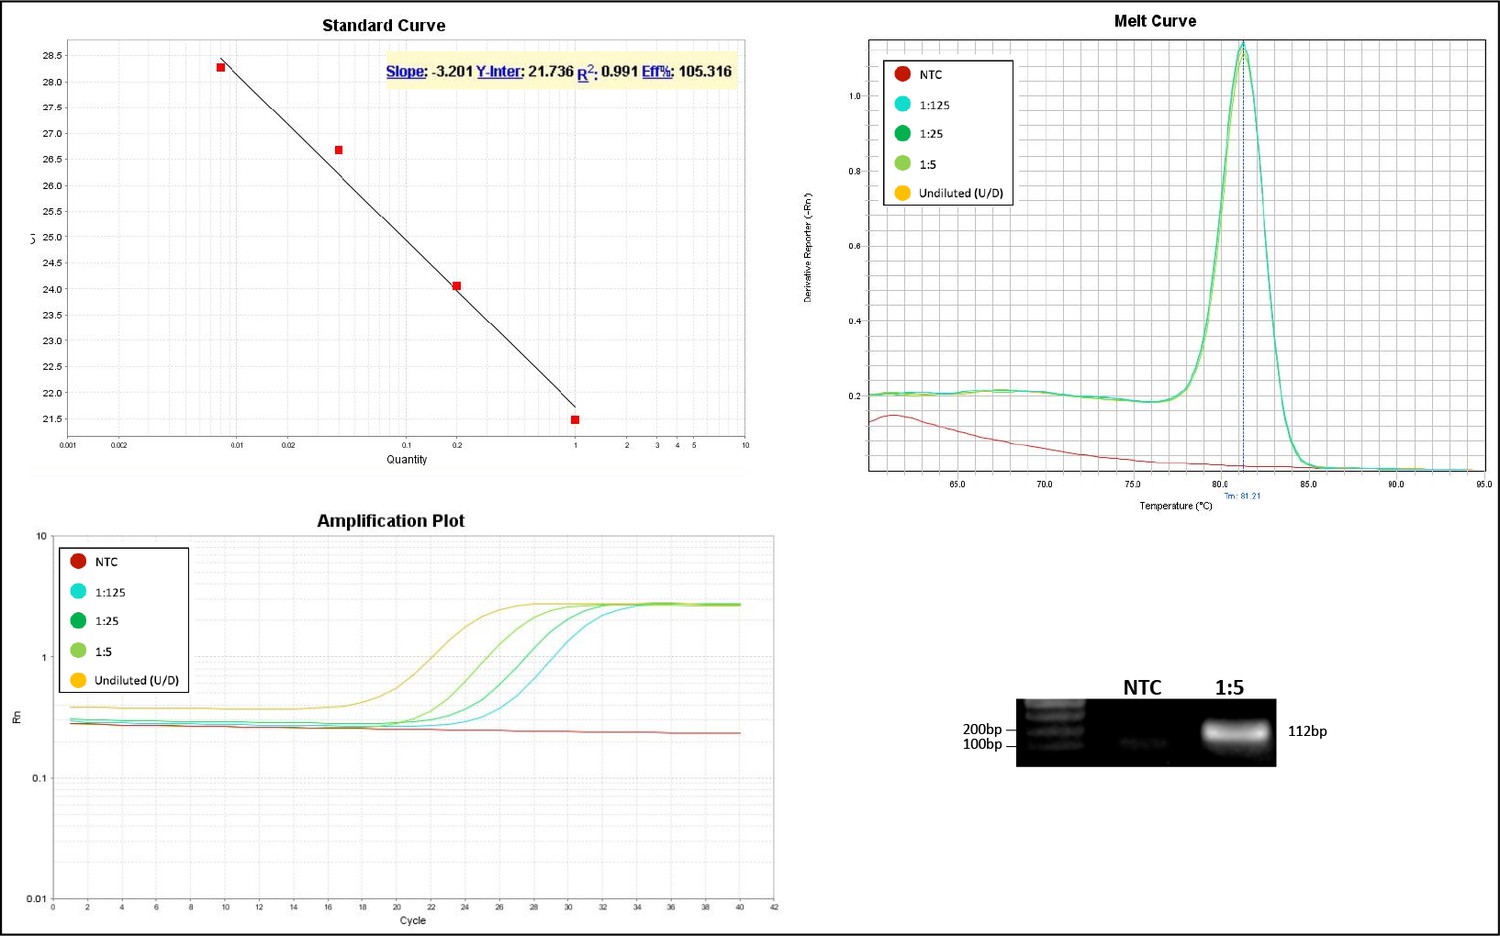
Appendix 1—figure 5
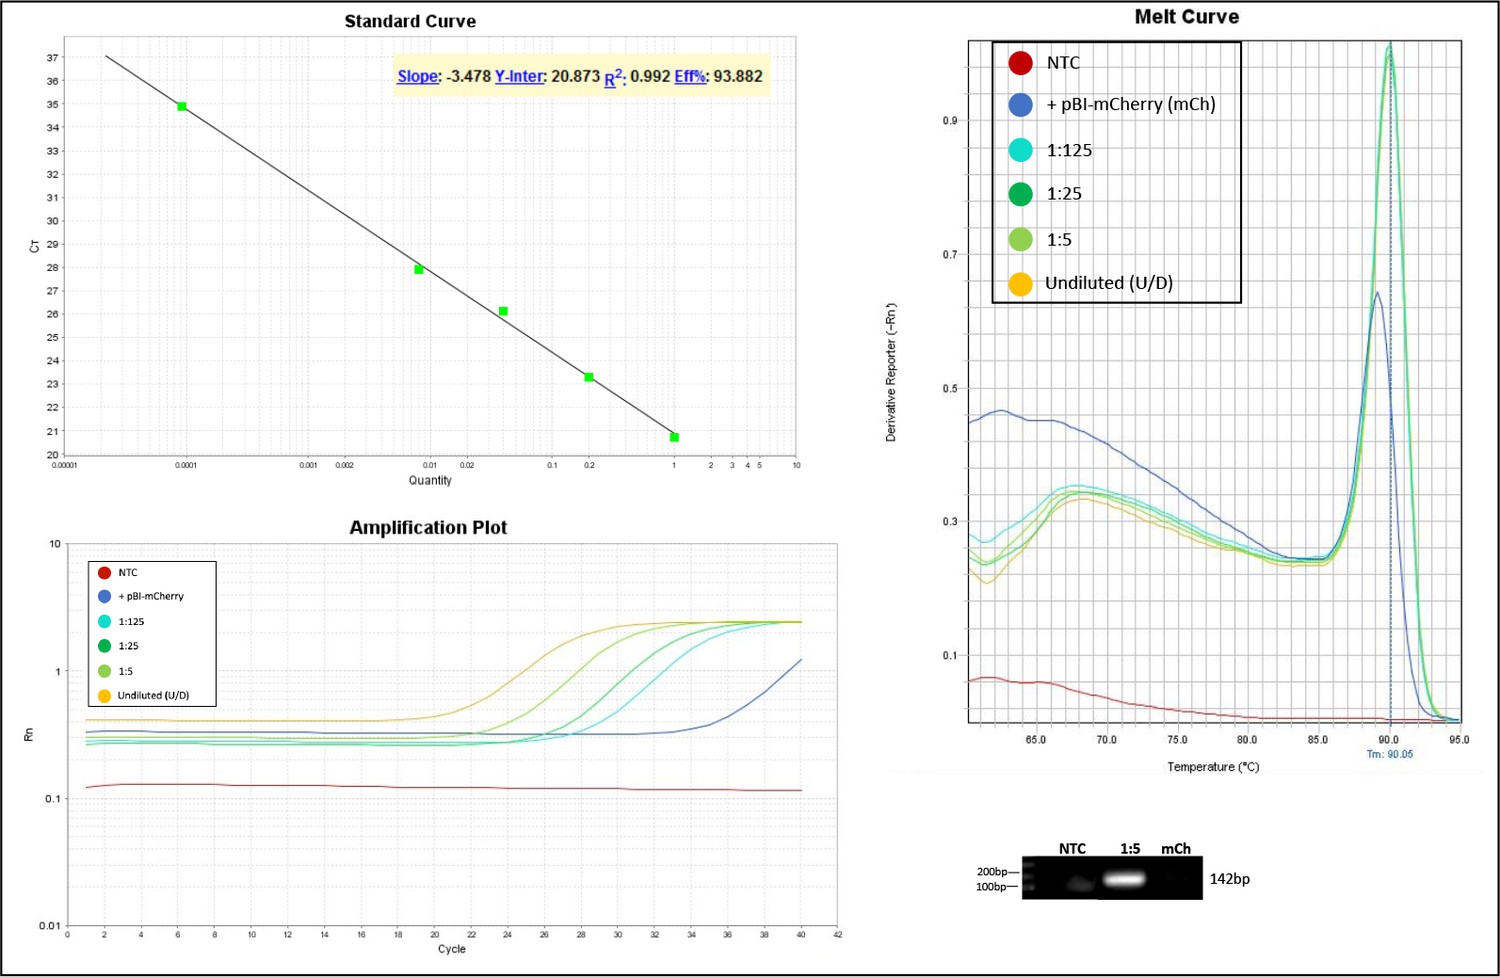
Validation of primer pairs used in RT-qPCR.
Standard curve, melt curve, and amplification plot of amplification reactions of serial dilutions (1:5) are shown. Sample reactions were loaded on gel to validate amplicon size. The target was also amplified from RNA extracts of cells transfected with the pBI-mCherry construct as neg. control (mCh). NTC, non-template control.
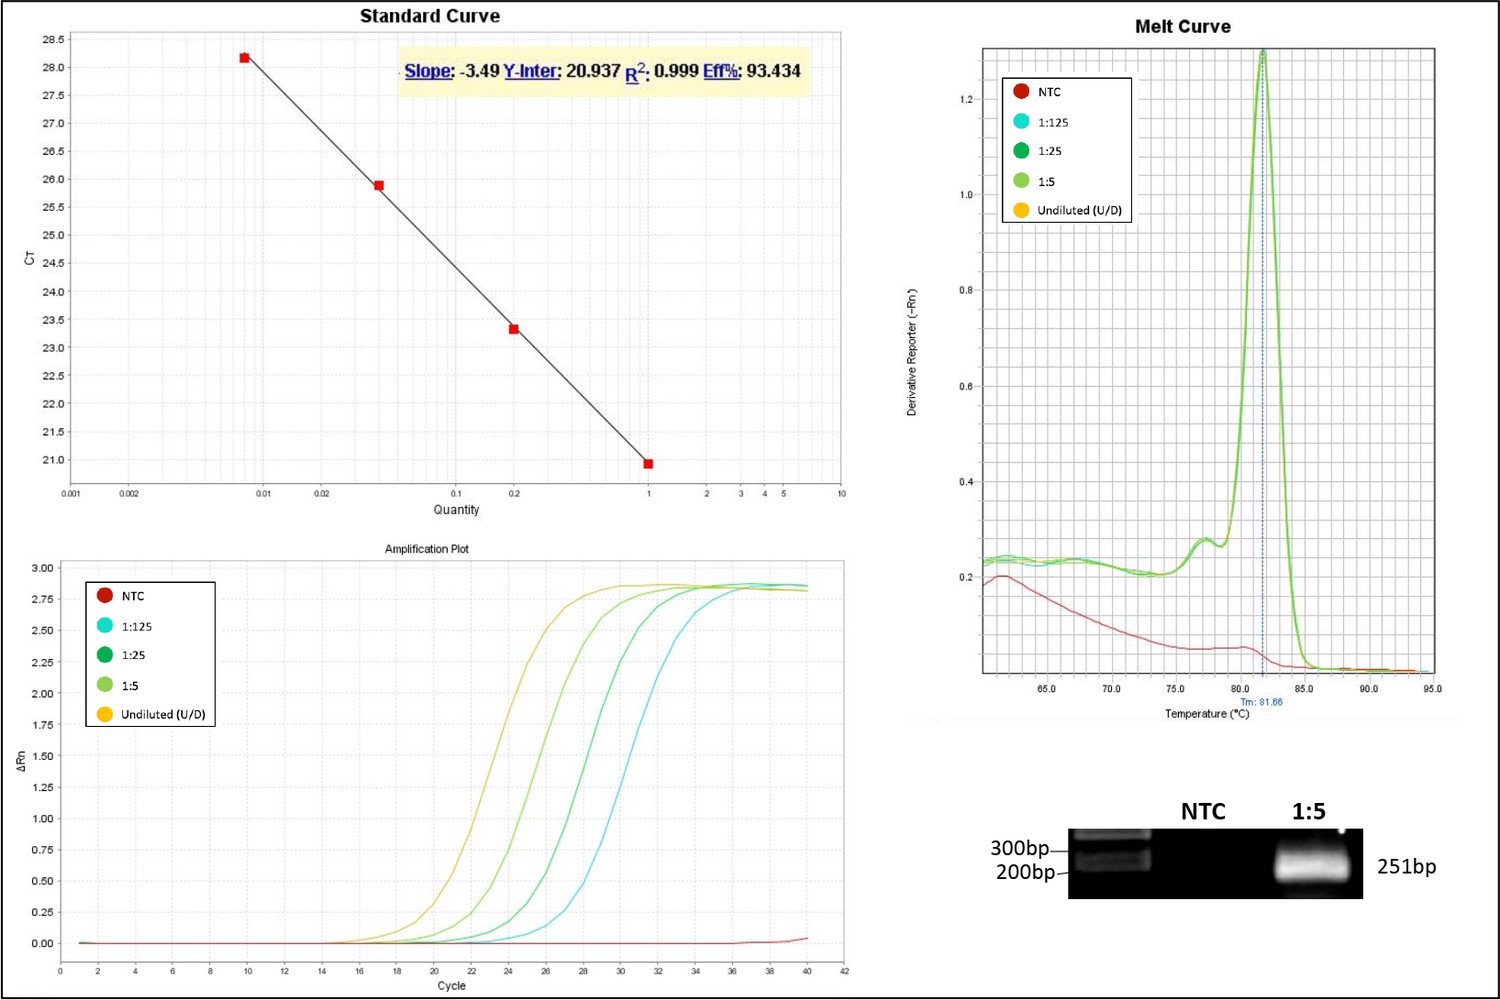
Appendix 1—figure 6
Validation of primer pairs used in RT-qPCR.
Standard curve, melt curve, and amplification plot of amplification reactions of serial dilutions (1:5) are shown. NTC, non-template control.
Appendix 1—figure 7
Validation of primer pairs used in RT-qPCR.
Standard curve, melt curve, and amplification plot of amplification reactions of serial dilutions (1:5) are shown. Sample reactions were loaded on gel to validate amplicon size. NTC, non-template control.
Appendix 1—figure 8
Validation of primer pairs used in RT-qPCR.
Standard curve, melt curve, and amplification plot of amplification reactions of serial dilutions (1:5) are shown. Sample reactions were loaded on gel to validate amplicon size. NTC, non-template control.
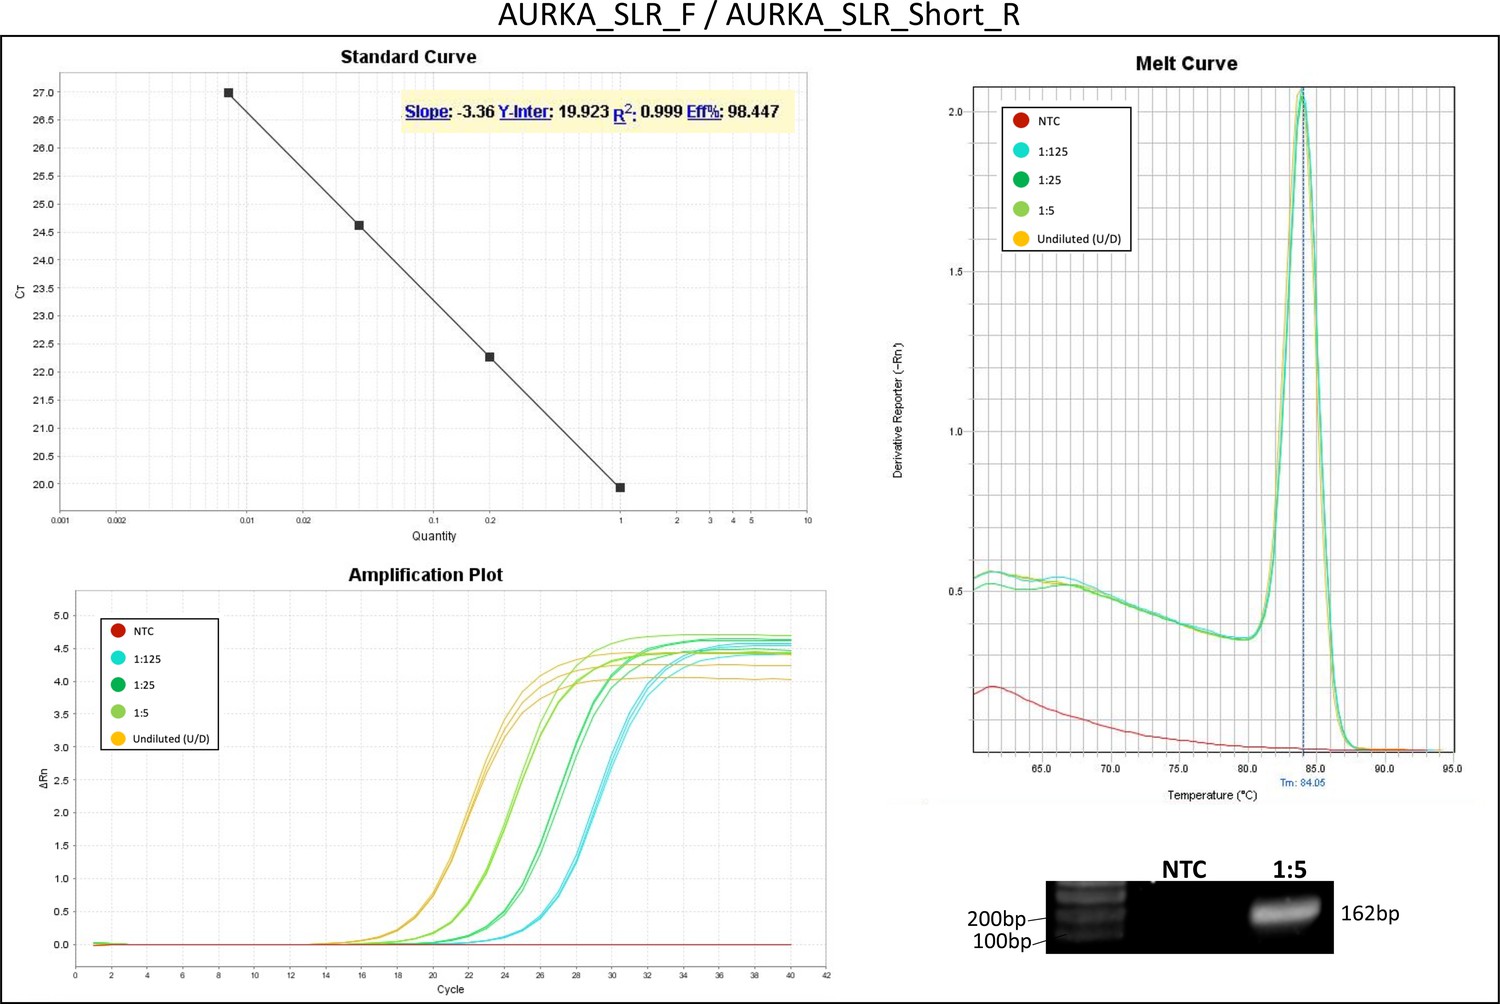
Appendix 1—figure 9
Validation of primer pairs used in RT-qPCR.
Standard curve, melt curve, and amplification plot of amplification reactions of serial dilutions (1:5) are shown. Sample reactions were loaded on gel to validate amplicon size. NTC, non-template control.
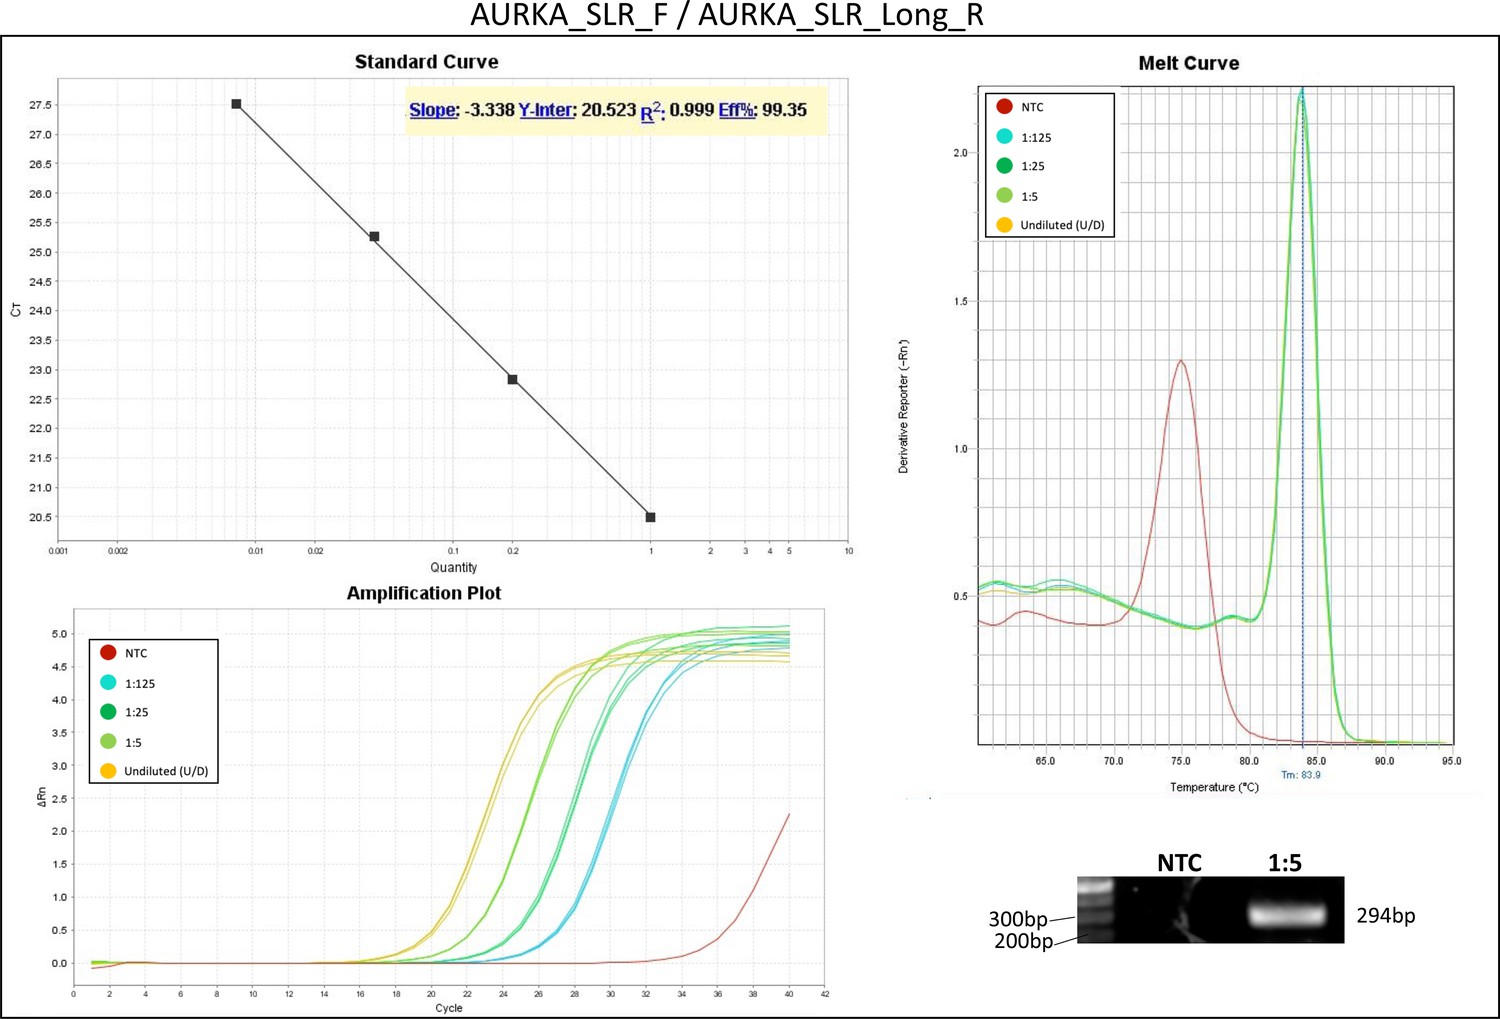
Appendix 1—figure 10
Validation of primer pairs used in RT-qPCR.
Standard curve, melt curve, and amplification plot of amplification reactions of serial dilutions (1:5) are shown. Sample reactions were loaded on gel to validate amplicon size. NTC, non-template control.
Appendix 1—figure 11
Validation of primer pairs used in RT-qPCR.
Standard curve, melt curve, and amplification plot of amplification reactions of serial dilutions (1:5) are shown. Sample reactions were loaded on gel to validate amplicon size. NTC, non-template control.
Tables
Appendix 1—table 1
Sequences of primers and targets of primer pairs used in RT-qPCR.
| Primer pair | Sequence | Target |
|---|---|---|
| mCherry_F mCherry_R | CCGACATCCCCGACTACTTGAAGC CACCTTGTAGATGAACTCGCCGTCC | mCherry ORF. |
| 3′UTR_F 3′UTR_R | GCCCGACAACCACTACCTGAGCTAC GCTCAAGGATTTCTCCCCCTGCAC | Reporter Venus mRNAs containing AURKA 3′UTR. |
| Venus_F Venus_R | CTGACCCTGAAGCTGATCT GCATGGCGGACTTGAAGAAG | Venus ORF. |
| sfGFP_F sfGFP_R | GGCCCTGTCCTTTTACCAGACAACC CATCCATGCCATGTGTAATCCCAGC | DHFR-sfGFP ORF. |
| 18S_F 18S_R | CTCAACACGGGAAACCTCAC CGCTCCACCAACTAAGAACG | 18S ribosomal RNA* (NR_146146.1). |
| AURKA_Long_F AURKA_Long_R | GGCGAAGCCTGGTAAAGCTG GCCTCTTCTGTATCCCAAGCAAATCC | All AURKA 5’UTR splice variants† and only long 3′UTR APA isoform. Primer pair anneals to AURKA exon XI. |
| AURKA_Total_F AURKA_Total_R | TGTAACAGAGGGAGCCAGGGACC TGATGAATTTGCTGTGATCCAGGGGTG | All AURKA 5′UTR splice variants† and both 3′UTR APA isoforms. Primer pair anneals to AURKA exon XI. |
| AURKA_SLR_F AURKA_SLR_Short_R | TGCTAGGCATGGTGTCTTCA AACAGCTTTACCAGGCTTCG | All AURKA 5′UTR splice variants† and both 3′UTR APA isoforms. Primer pair anneals to AURKA exon XI. |
| AURKA_SLR_F AURKA_SLR_Long_R | TGCTAGGCATGGTGTCTTCA AGAAACCCAATCAGGCCTAC | All AURKA 5′UTR splice variants† and only long 3′UTR APA isoform. Primer pair anneals to AURKA exon XI. |
| SDHA_F SDHA_R | TGGGAACAAGAGGGCATCTG CCACCACTGCATCAAATTCA | All SDHA transcript variants (NM_004168.4, NM_001294332.2, NM_001330758.2). Primer pair anneals to SDHA cDNA exons II–III. |
-
*
Primer sequences from Lin et al., 2016.
-
†
For accession numbers see Cacioppo and Lindon, 2022.
Appendix 1—table 2
Reaction conditions and thermocycling parameters for one-step RT-qPCR.
| Reagent | Volume | |||
|---|---|---|---|---|
| Luna Universal One-Step Reaction Mix (2×) | 10 µl | |||
| Luna WarmStart RT Enzyme Mix (20×) | 1 µl | |||
| Forward primer (10 µM) | 0.4 µl | |||
| Reverse primer (10 µM) | 0.4 µl | |||
| Template RNA | <100 ng | |||
| Nuclease-free water | Up to 20 µl | |||
| MicroAmp Fast Optical 96-Well Reaction Plate with Barcode, 0.1 ml (Thermo Fisher, 4346906) | ||||
| Cycling step | Temperature (°C) | Time | Cycles | |
| Reverse transcription | 55 | 10 min | 1 | |
| Initial denaturation | 95 | 1 min | 1 | |
| Denaturation extension | 95 –60 | 10 s 1 min | 40 | |
| Melt curve | 60–95 | - | 1 | |
Additional files
-
MDAR checklist
- https://cdn.elifesciences.org/articles/87253/elife-87253-mdarchecklist1-v1.docx
-
Supplementary file 1
MIQE guidelines checklist.
- https://cdn.elifesciences.org/articles/87253/elife-87253-supp1-v1.xlsx
Download links
A two-part list of links to download the article, or parts of the article, in various formats.
Downloads (link to download the article as PDF)
Open citations (links to open the citations from this article in various online reference manager services)
Cite this article (links to download the citations from this article in formats compatible with various reference manager tools)
Differential translation of mRNA isoforms underlies oncogenic activation of cell cycle kinase Aurora A
eLife 12:RP87253.
https://doi.org/10.7554/eLife.87253.2


