Rab12 is a regulator of LRRK2 and its activation by damaged lysosomes
- Denali Therapeutics, United States
- Department of Pharmaceutics, University of Minnesota, United States
Figures
Figure 1 with 1 supplement
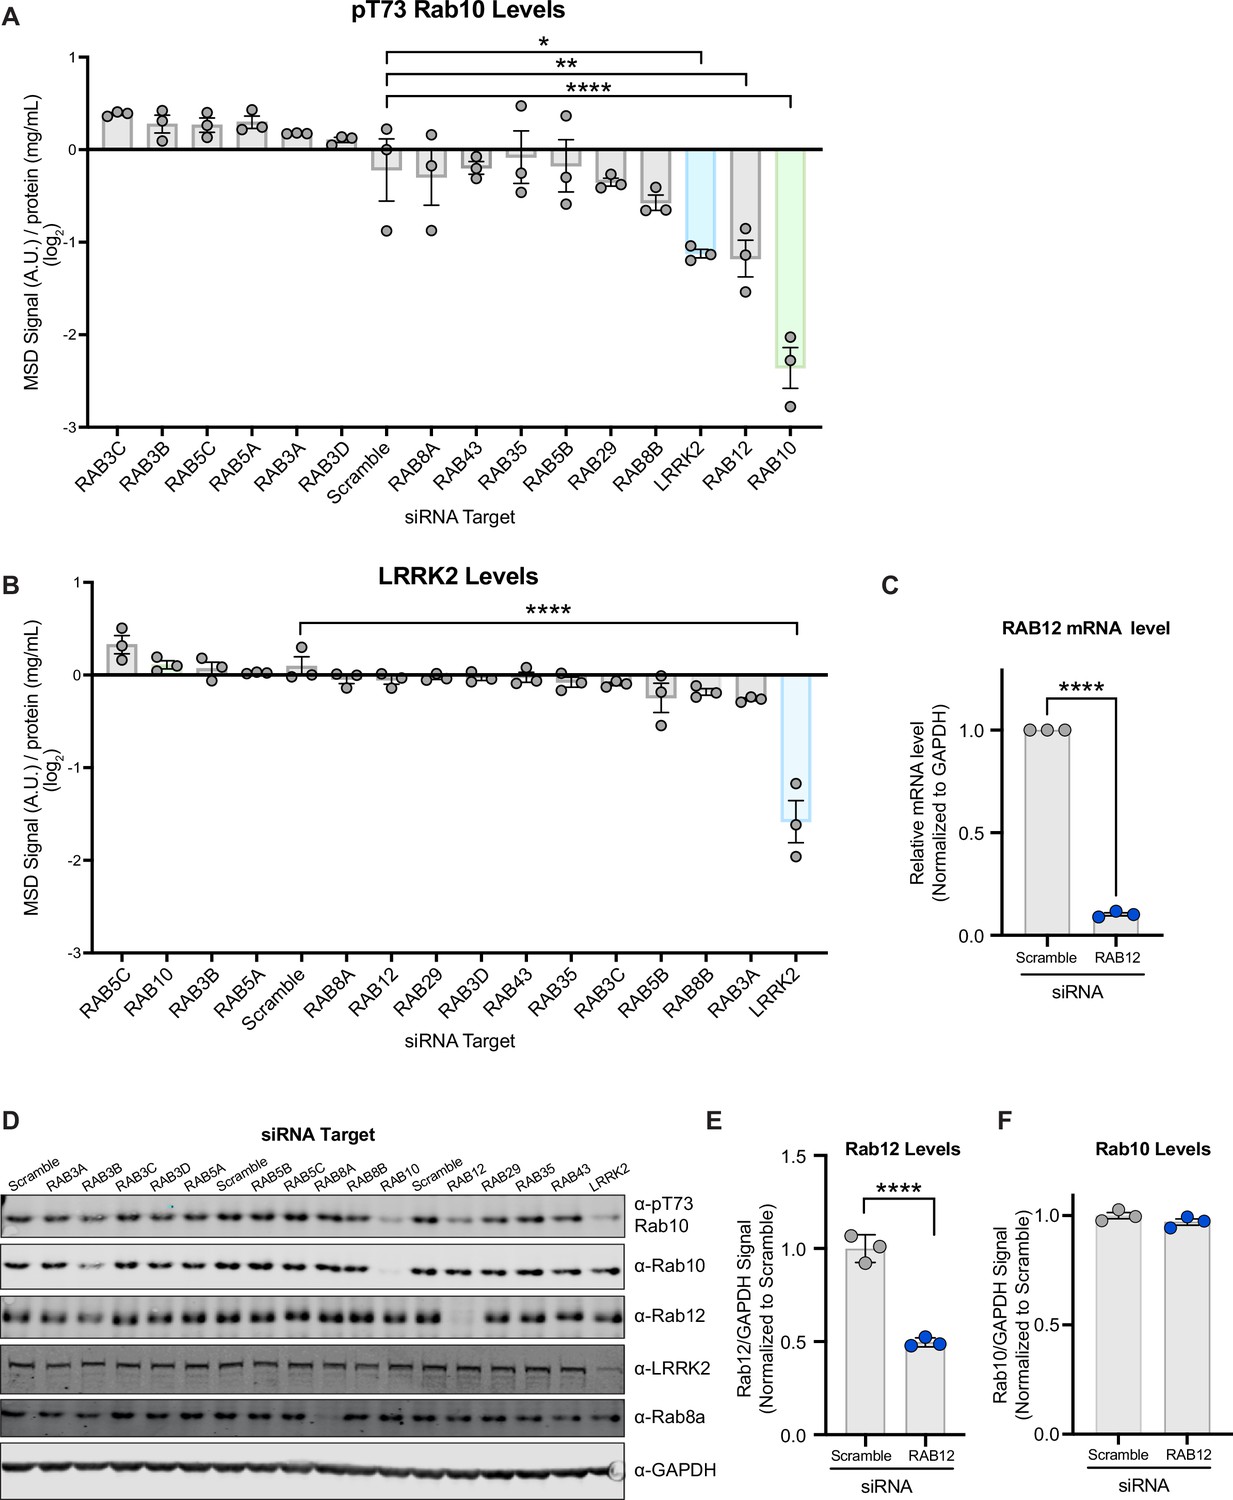
A targeted siRNA screen identifies Rab12 as a key regulator of LRRK2 kinase activity.
(A and B) A549 cells were transfected with siRNA targeting LRRK2 and its Rab substrates, lysed 3 days after transfection, and the levels of pT73 Rab10 and LRRK2 were quantified using Meso Scale Discovery (MSD)-based analysis. The MSD signal was normalized to the protein concentration, and data are shown on a log2 scale as the mean ± SEM; n=3 independent experiments, and statistical significance was determined using one-way analysis of variance (ANOVA) with Dunnett’s multiple comparison test. (C) RAB12 mRNA levels were quantified using RT-qPCR-based analysis and normalized to GAPDH following transfection with siRNAs targeting a scramble sequence or RAB12. Data are shown as the mean ± SEM; n=3 independent experiments, and statistical significance was determined using paired t-test. (D) The levels of pT73 Rab10, Rab10, Rab12, LRRK2, and Rab8a following siRNA-mediated knockdown of LRRK2 and its Rab substrates were assessed in A549 cells by western blot analysis. Shown is a representative immunoblot with GAPDH as a loading control. (E and F) The immunoblot signals from multiple experiments were quantified, and the Rab12 and Rab10 signal was normalized to GAPDH, normalized to the median within each batch and expressed as a fold change compared to the scramble control; data are shown as the mean ± SEM; n=3 independent experiments. Statistical significance was determined using unpaired t-test. *p<0.05, **p<0.01, ****p<0.0001.
-
Figure 1—source data 1
Raw data files for western blots.
- https://cdn.elifesciences.org/articles/87255/elife-87255-fig1-data1-v2.zip
-
Figure 1—source data 2
Annotated western blots.
- https://cdn.elifesciences.org/articles/87255/elife-87255-fig1-data2-v2.pdf
Figure 1—figure supplement 1
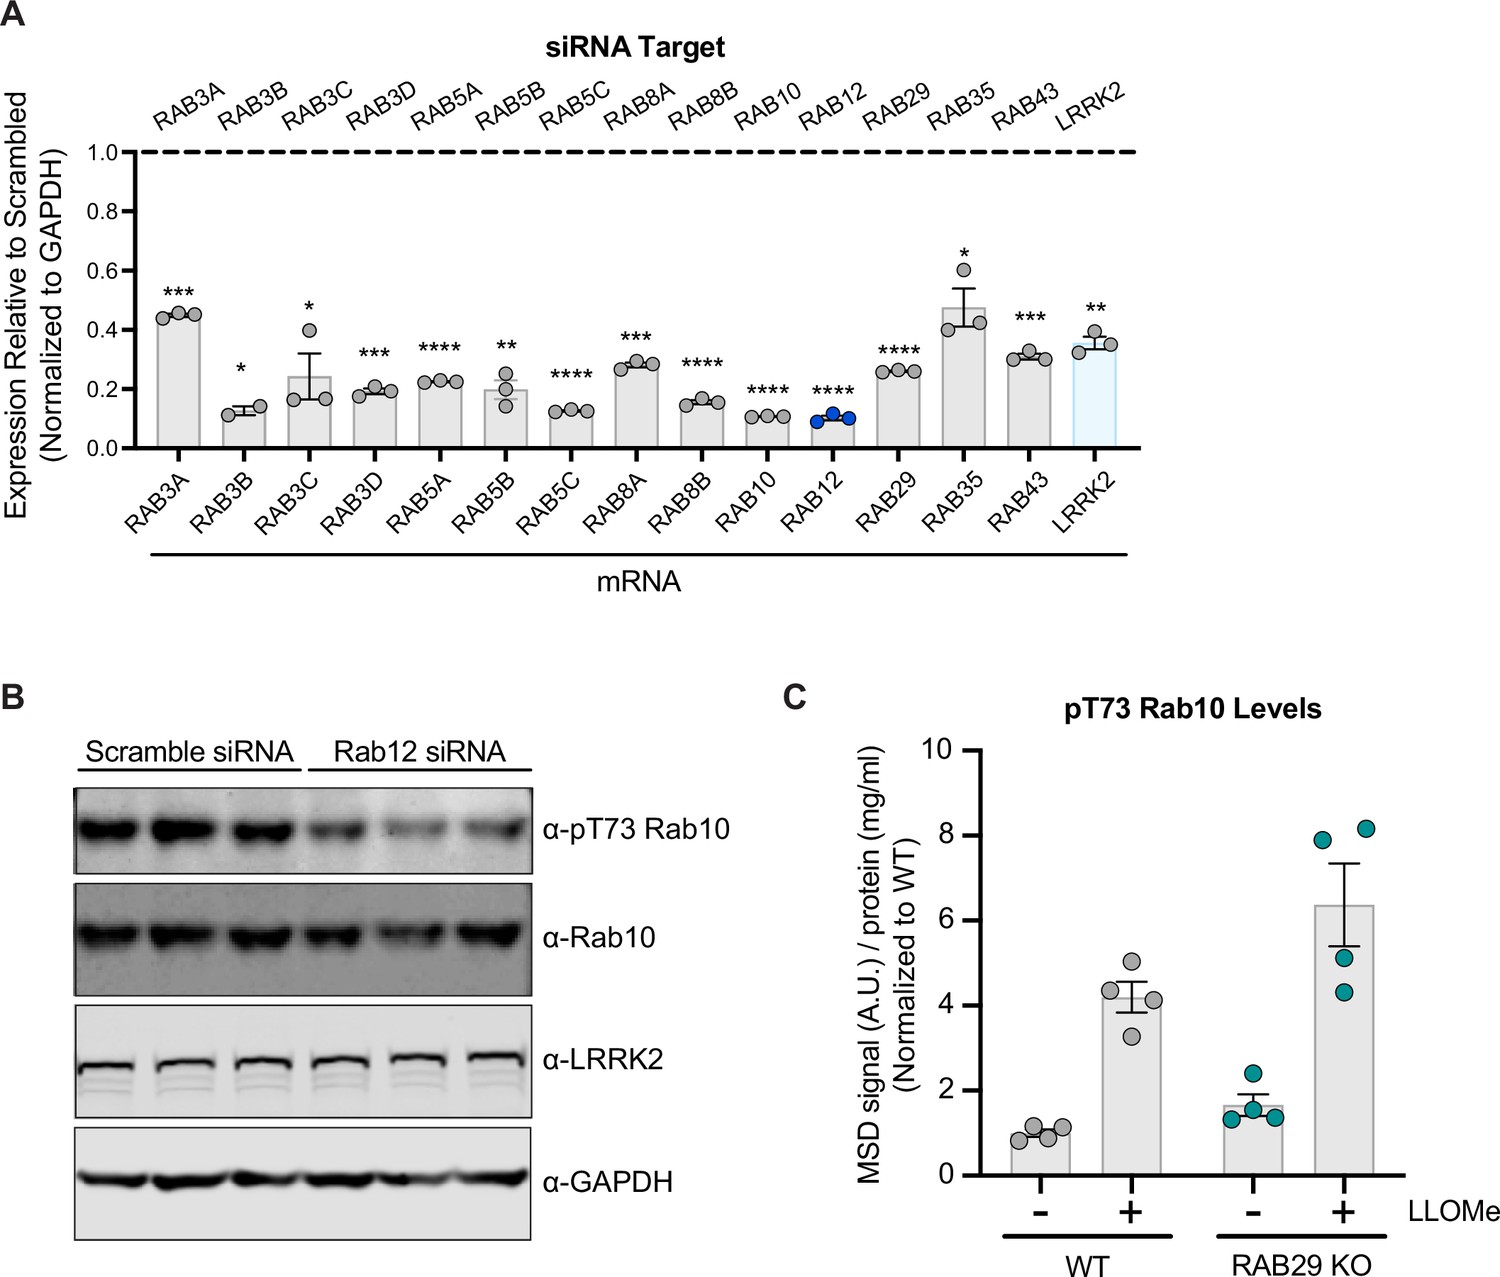
Confirmation of siRNA-mediated knockdown of LRRK2 Rab substrates.
(A) A549 cells were transfected with siRNA targeting LRRK2 and its Rab substrates, lysed 3 days after transfection, and knockdown was confirmed by qPCR-based analysis. The expression of each gene assessed was normalized to GAPDH expression, and then normalized to the expression observed with a scramble siRNA sequence. n=3 independent experiments. Data are shown as the mean ± SEM, with p values based on paired t-test. (B) A549 cells were transfected with a scramble siRNA sequence or siRNA targeting RAB12, and the levels of pT73 Rab10, Rab10, and LRRK2 were assessed by western blot analysis. GAPDH was used as a loading control. (C) Wildtype (WT) and RAB29 KO A549 cells were treated with L-leucyl-L-leucine methyl ester (LLOMe) (1 mM) for 2 hr, and the levels of pT73 Rab10 were assessed by meso scale discovery (MSD)-based analysis. The MSD signal was normalized for protein input, then normalized to the median within each batch and expressed as a fold change compared to WT untreated A549 cells; data are shown as the mean ± SEM; n=4 independent experiments. Statistical significance was determined using one-way analysis of variance (ANOVA) with Sidak’s multiple comparison test. *p<0.05, **p<0.01, ***p<0.001, ****p<0.0001.
-
Figure 1—figure supplement 1—source data 1
Raw data files for western blots.
- https://cdn.elifesciences.org/articles/87255/elife-87255-fig1-figsupp1-data1-v2.zip
-
Figure 1—figure supplement 1—source data 2
Annotated western blots.
- https://cdn.elifesciences.org/articles/87255/elife-87255-fig1-figsupp1-data2-v2.pdf
Figure 2 with 1 supplement
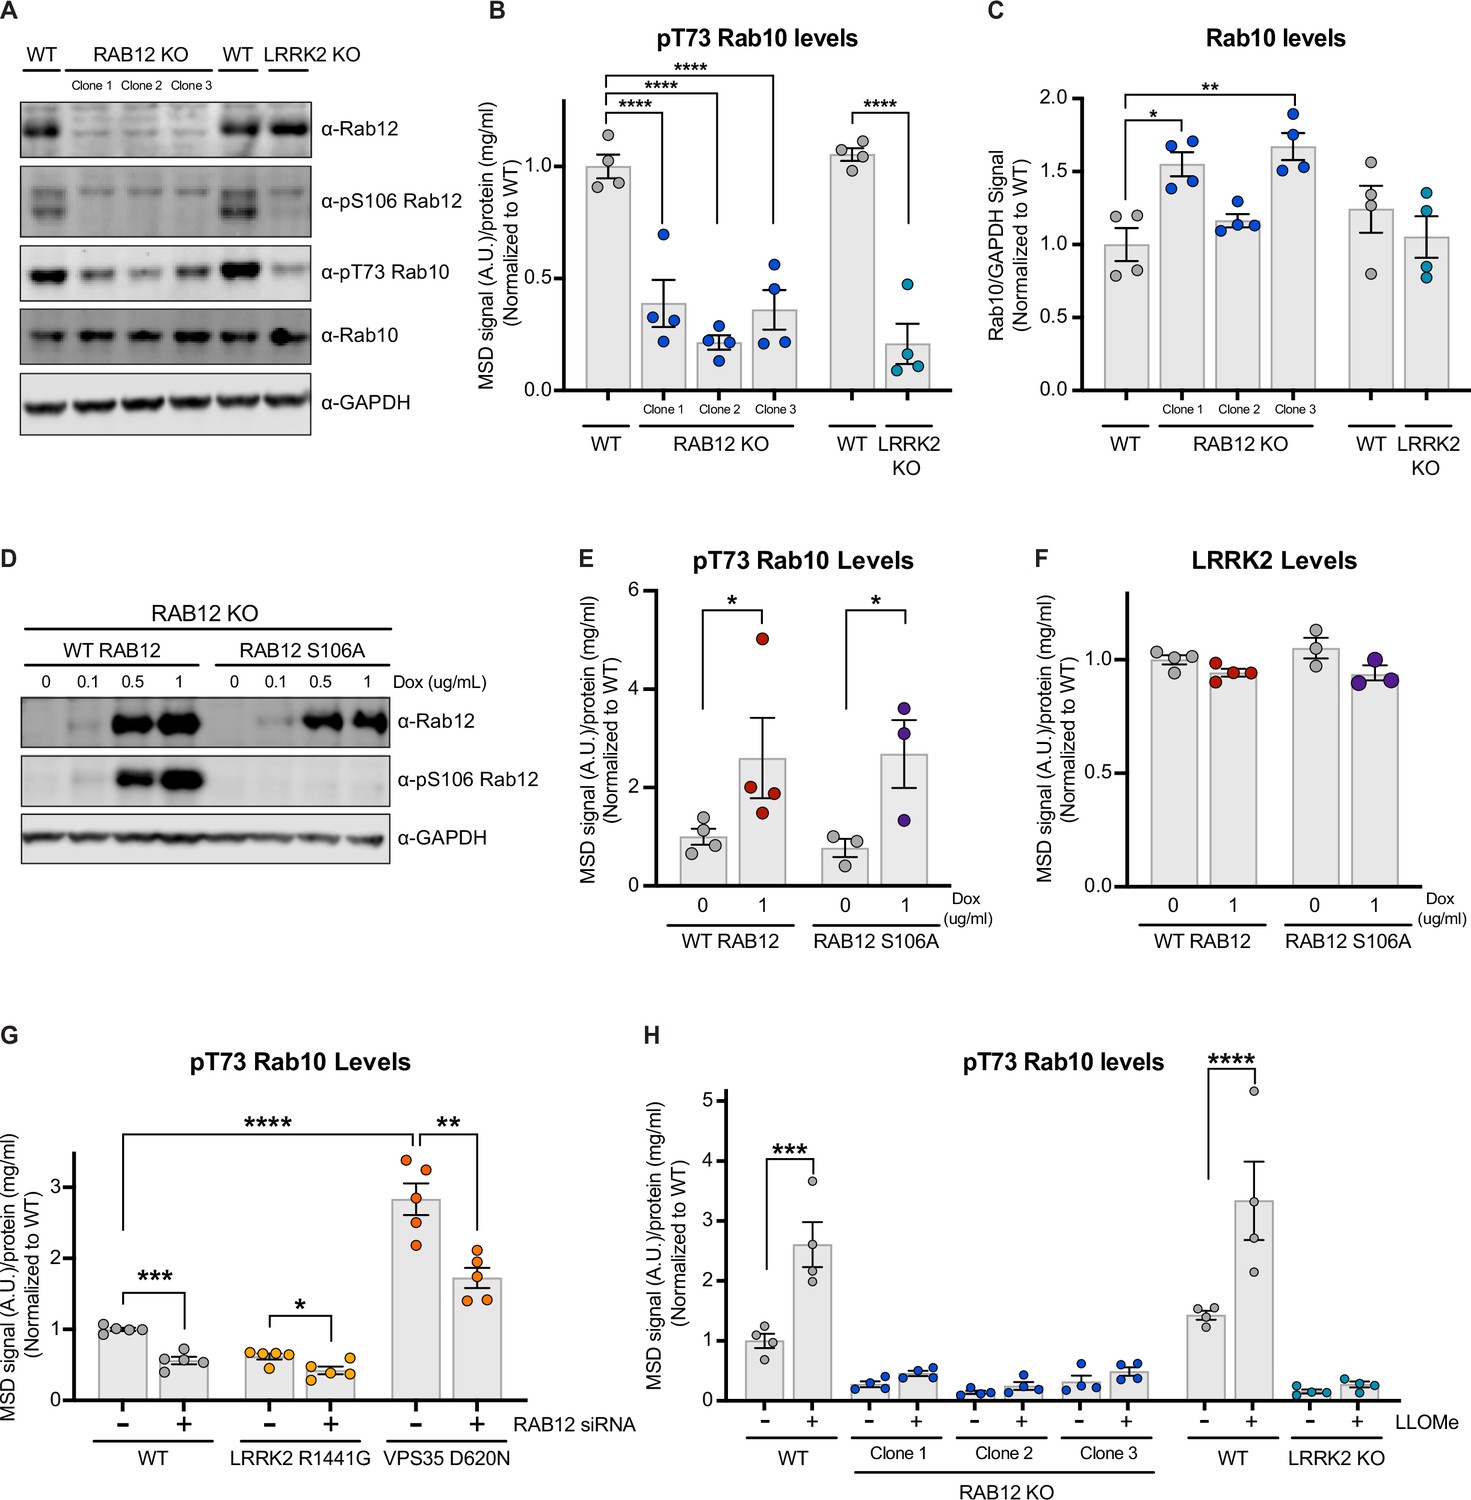
Rab12 regulates LRRK2 activation basally and in response to lysosomal damage and genetic variants associated with Parkinson’s disease (PD).
(A) The levels of Rab12, pS106 Rab12, pT73 Rab10, and Rab10 were assessed in wildtype (WT), RAB12 KO, and LRRK2 KO A549 cells by western blot analysis. Shown is a representative immunoblot with GAPDH as a loading control. (B) The levels of pT73 Rab10 were measured using a Meso Scale Discovery (MSD)-based assay. The MSD signal was normalized for protein input and expressed as a fold change compared to WT A549 cells; data are shown as the mean ± SEM; n=4 independent experiments, and statistical significance was determined using one-way analysis of variance (ANOVA) with Dunnett’s multiple comparison test. (C) Immunoblot signals from multiple experiments were quantified, and the Rab10 signal was normalized to GAPDH and expressed as a fold change compared to WT A549 cells. Data are shown as the mean ± SEM; n=4 independent experiments. Statistical significance was determined using one-way ANOVA with Dunnett’s multiple comparison test. (D–F) RAB12 KO A549 cells with doxycycline-inducible expression of WT RAB12 or a phospho-deficient variant of RAB12 (S106A) were treated with increasing concentrations of doxycycline for 3 days, and the levels of Rab12, pS106 Rab12, pT73 Rab10, and LRRK2 were measured. (D) A representative immunoblot is shown assessing Rab12 and pS106 Rab12 protein levels following doxycycline-induced expression of WT or RAB12 S106A, and GAPDH was used as a loading control. (E and F) The levels of pT73 Rab10 and LRRK2 were measured using MSD-based assays. MSD signals were normalized for protein concentration, and data were then normalized to the median within each batch and to the signals from the control group (RAB12 KO cells with inducible expression of WT Rab12 without doxycycline treatment). Data are shown as mean ± SEM; n=3–4 independent experiments, and statistical significance was determined using unpaired t-test on log transformed data. (G) The impact of Rab12 knockdown was measured in WT, LRRK2 R1441G KI, and VPS35 D620N KI A549 cells. Cells were transfected with siRNA targeting RAB12, and pT73 Rab10 levels were measured by MSD-based analysis 3 days after transfection. The MSD signal was normalized for protein input and then normalized to the median within each batch and is expressed as a fold change compared to WT A549 cells transfected with scramble siRNA. Data are shown as the mean ± SEM; n=5 independent experiments. Statistical significance was determined using one-way ANOVA with Tukey’s multiple comparison test on log transformed data. (H) WT, RAB12 KO, and LRRK2 KO A549 cells were treated with vehicle or L-leucyl-L-leucine methyl ester (LLOMe) (1 mM) for 2 hr, and the impact of LLOMe treatment on pT73 Rab10 levels was measured by MSD-based analysis. The MSD signal was normalized for protein input and is expressed as a fold change compared to WT A549 cells treated with vehicle. Data are shown as the mean ± SEM; n=4 independent experiments. Statistical significance was determined using two-way ANOVA with Sidak’s multiple comparison test. *p<0.05, **p<0.01, ***p<0.001, ****p<0.0001.
-
Figure 2—source data 1
Raw data files for western blot.
- https://cdn.elifesciences.org/articles/87255/elife-87255-fig2-data1-v2.zip
-
Figure 2—source data 2
Annotated western blots.
- https://cdn.elifesciences.org/articles/87255/elife-87255-fig2-data2-v2.pdf
Figure 2—figure supplement 1
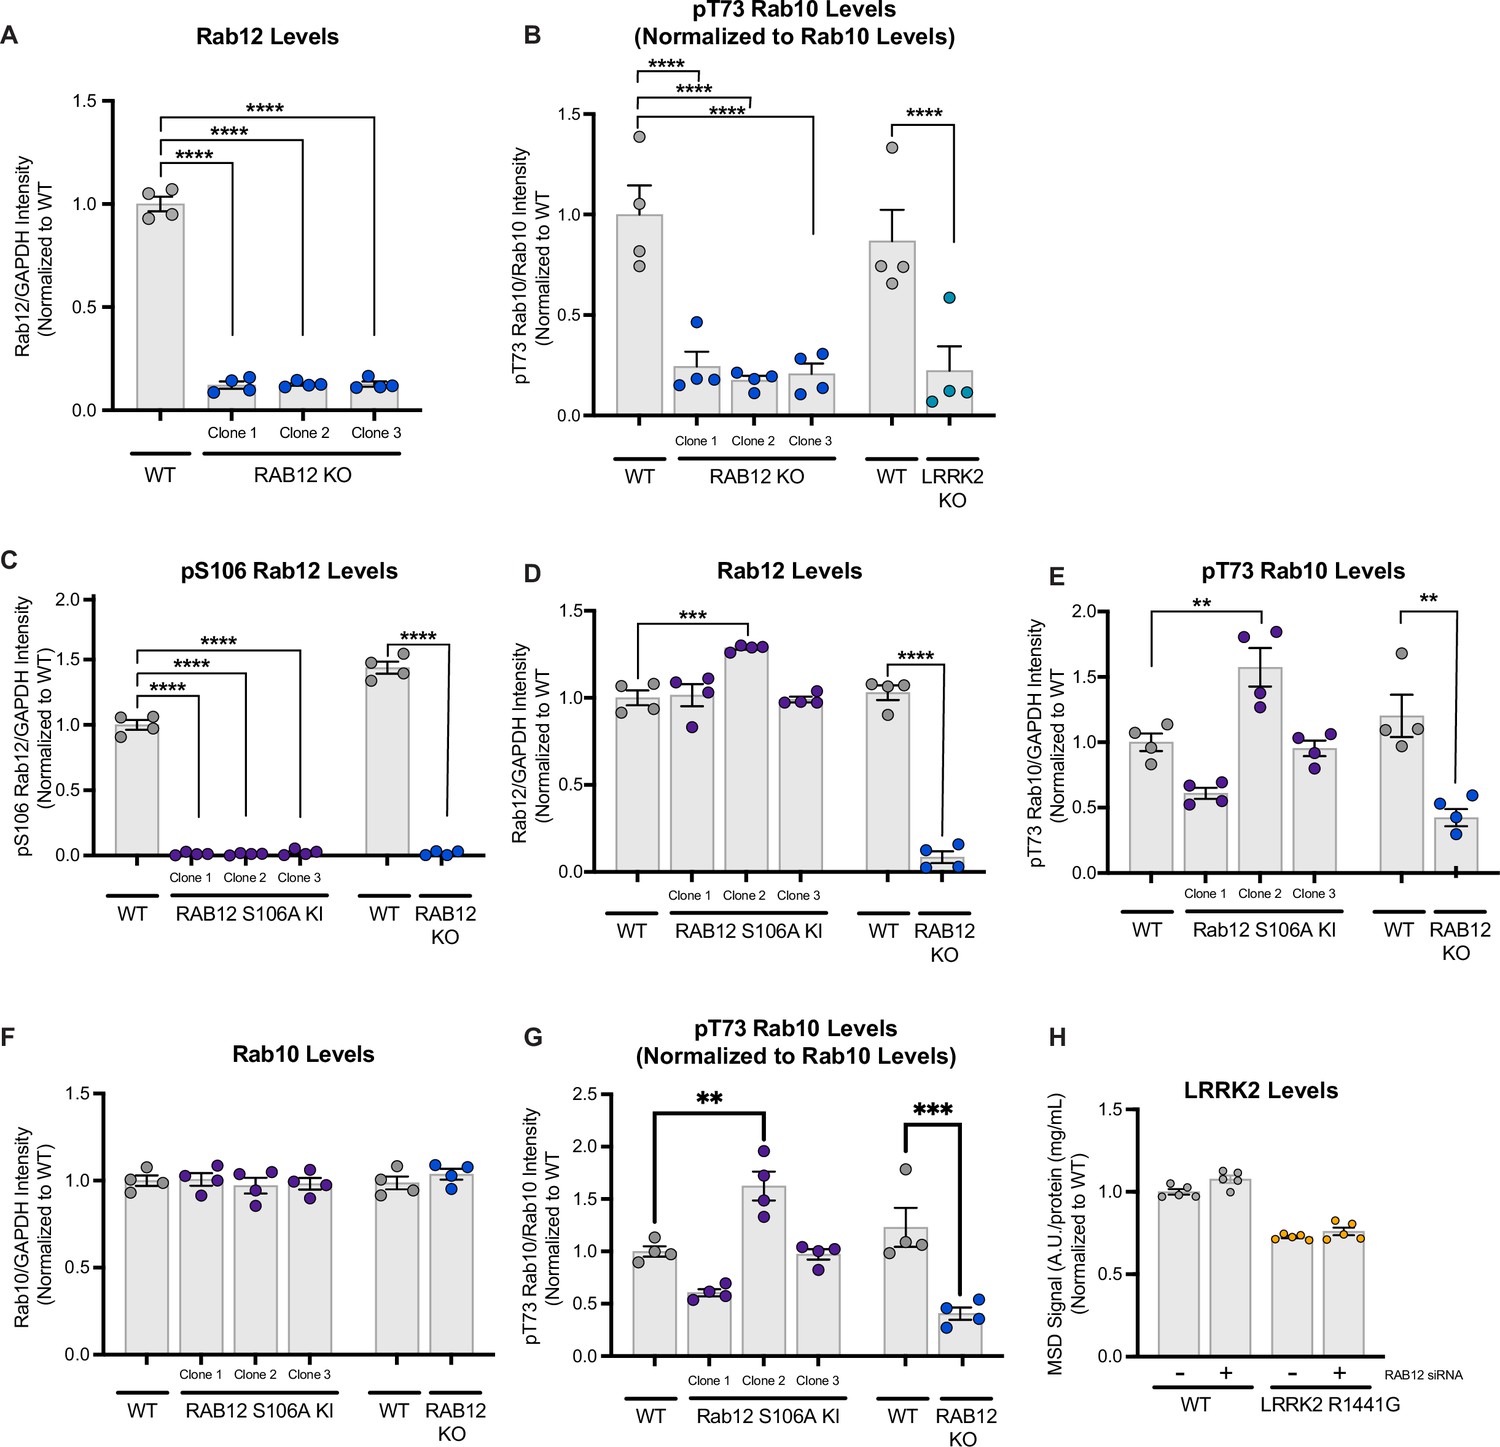
Confirmation of effects of RAB12 KO and RAB12 S106A KI on total and phospho-Rab12 and Rab10.
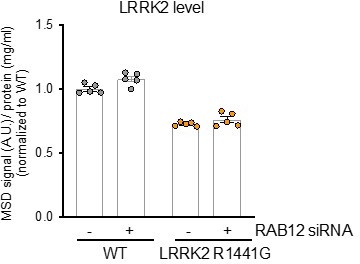
(A) The levels of Rab12 were measured in cell lysate from wildtype (WT) or three clones of RAB12 KO A549 cells by western blot analysis. The Rab12 signal was quantified and normalized to the GAPDH signal and expressed as a fold change compared to WT cells. Data are shown as the mean ± SEM; n=4 independent experiments. Statistical significance was determined using one-way analysis of variance (ANOVA) with Dunnett’s multiple comparisons test. (B) The levels of pT73 Rab10 were measured in cell lysates from WT, three clones of RAB12 KO A549 cells, or LRRK2 KO A549 cells by meso scale discovery (MSD)-based analysis and were normalized to the levels of Rab10 (measured by western blot analysis). Data are shown as the mean ± SEM; n=4 independent experiments. Statistical significance was determined using one-way ANOVA with Dunnett’s multiple comparisons test. (C–G) The levels of pS106 Rab12, Rab12, pT73 Rab10, and Rab10 were measured in cell lysates from WT, three clones of RAB12 S106A KI A549, or RAB12 KO cells by western blot analysis, and GAPDH was used as a loading control. The pS106 Rab12 signal (C), Rab12 signal (D), pT73 Rab10 signal (E), and Rab10 signal (F) were measured and normalized to the GAPDH signal and expressed as a fold change compared to WT cells. pT73 Rab10 levels (measured by MSD-based assay) were normalized to total Rab10 levels (measured by western blot) and expressed as a fold change compared to WT cells (G). Data are shown as the mean ± SEM; n=4 independent experiments. Statistical significance was determined using one-way ANOVA with Dunnett’s multiple comparison test. (H) Total LRRK2 levels were reduced in LRRK2 R1441G cells compared to WT cells. LRRK2 levels were measured in cell lysates from WT and LRRK2 R1441G KI A549 cells treated with scramble siRNA or siRNA against RAB12 by MSD-based analysis and normalized for protein input. Data are shown as the mean ± SEM; n=5 independent experiments. **p<0.01, ***p<0.001, ****p<0.0001.
-
Figure 2—figure supplement 1—source data 1
Raw data files for western blot.
- https://cdn.elifesciences.org/articles/87255/elife-87255-fig2-figsupp1-data1-v2.zip
-
Figure 2—figure supplement 1—source data 2
Annotated western blots.
- https://cdn.elifesciences.org/articles/87255/elife-87255-fig2-figsupp1-data2-v2.pdf
Figure 3 with 2 supplements
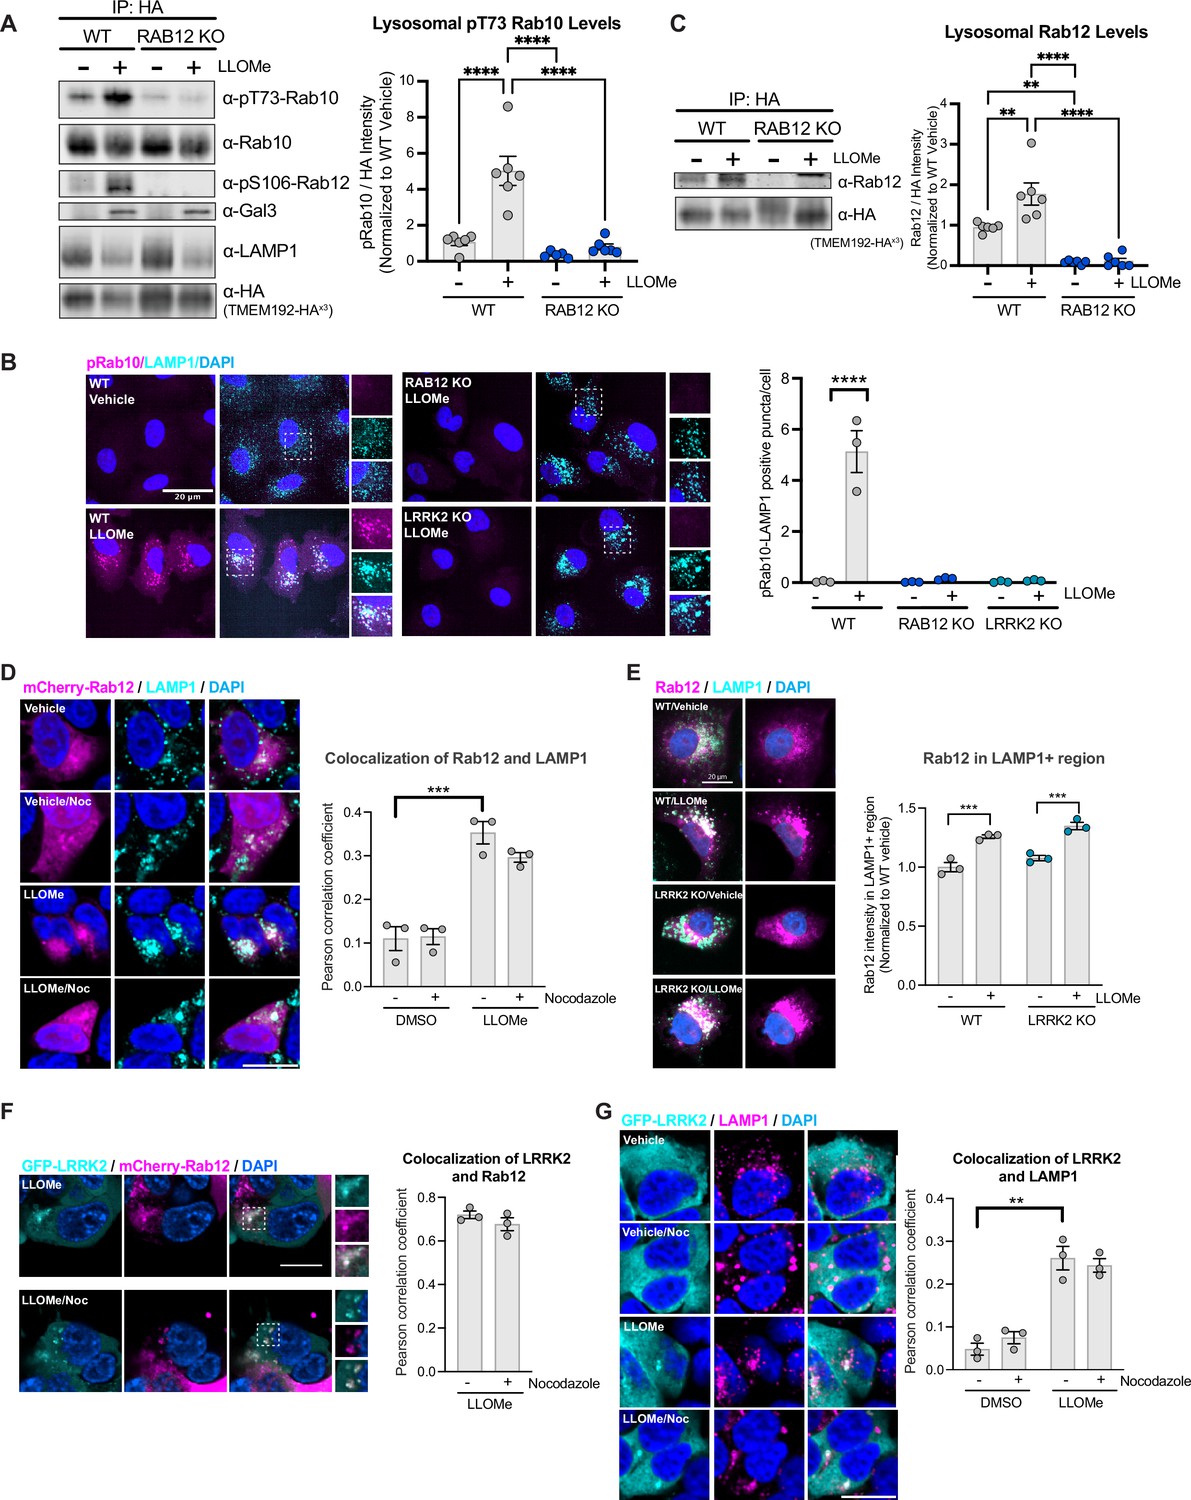
Rab12 is recruited to lysosomes following lysosomal damage and promotes Rab10 phosphorylation at the lysosome.
(A) Lysosomes were isolated from wildtype (WT) and RAB12 KO A549 cells treated with vehicle or L-leucyl-L-leucine methyl ester (LLOMe) (1 mM) for 2 hr. The levels of pT73 Rab10, total Rab10, pS106 Rab12, galectin-3 (Gal3), lysosomal-associated membrane protein 1 (LAMP1), and HA were assessed by western blot analysis, and shown is a representative immunoblot. Fluorescence signals of immunoblots from multiple experiments were quantified. The pT73 Rab10 signal was normalized to the HA signal, then was normalized to the median within each experimental replicate and expressed as a fold change compared to lysosomes isolated from WT A549 cells treated with vehicle. n=6 independent experiments. Data are shown as the mean ± SEM, and statistical significance was determined using one-way analysis of variance (ANOVA) with Tukey’s multiple comparison test. (B) WT, RAB12 KO, and LRRK2 KO A549 cells were treated with vehicle or LLOMe (1 mM) for 2 hr, and the signals of pT73 Rab10 and LAMP1 were assessed by immunostaining. Scale bar, 20 μm. pT73 Rab10 (shown in magenta) and LAMP1 (shown in cyan) double positive puncta (i.e. overlap of magenta and cyan and shown in white) were quantified per cell from n=3 independent experiments. Data are shown as the mean ± SEM with and statistical significance was determined using two-way ANOVA with Sidak’s multiple comparison test. (C) Lysosomal Rab12 levels were assessed by western blot analysis from lysosomes isolated from WT and RAB12 KO A549 cells treated with vehicle or LLOMe (1 mM) for 2 hr. The Rab12 signals were normalized to the HA signals, then were normalized to the median within each experimental replicate and expressed as a fold change compared to lysosomes isolated from WT A549 cells treated with vehicle. n=6 independent experiments. Data are shown as the mean ± SEM, and statistical significance was determined using one-way ANOVA with Tukey’s multiple comparison test. (D) HEK293T cells expressing mCherry-Rab12 were treated with vehicle or LLOMe (1 mM) for 2 hr, fixed, and stained using an antibody against LAMP1. Colocalization of Rab12 and LAMP1 was assessed by measuring the Pearson’s correlation coefficient between mCherry-Rab12 (shown in magenta) and LAMP1 (shown in cyan); nocodazole (25 μΜ for 2 hr) treatment was included as a control to confirm colocalization. Scale bar, 10 μm. n=3 independent experiments. Data are shown as the mean ± SEM, and statistical significance was determined using repeated measures one-way ANOVA with Sidak’s multiple comparison test. (E) WT and LRRK2 KO A549 cells transiently expressing mCherry-Rab12 were treated with vehicle or LLOMe (1 mM) for 2 hr, and the LAMP1 levels were assessed by immunostaining. Scale bar, 20 μm. The intensity of mCherry-Rab12 signals (shown in magenta) in LAMP1 (shown in cyan)-positive region were quantified per cell from mCherry-Rab12 expressing cells (n=20 cells per condition, with cellular intensity between 2000 and 5000 fl. units) and averaged across wells (~4–6 wells per condition). n=3 independent experiments. The Rab12 signal was normalized to the median within each experimental replicate, and then expressed as a fold change compared to WT cells treated with vehicle. Data are shown as the mean ± SEM, and statistical significance was determined using one-way ANOVA with Sidak’s multiple comparison test. (F) HEK293T cells stably expressing eGFP-LRRK2 were transfected with mCherry-Rab12 and treated with LLOMe (1 mM) for 2 hr. Colocalization of mCherry-Rab12 (shown in magenta) and eGFP-LRRK2 (shown in cyan) was assessed by measuring the Pearson’s correlation coefficient in LLOMe-responding cells (n=10 cells per condition); nocodazole (25 μΜ) treatment was included to confirm colocalization. Scale bar, 10 μm. n=3 independent experiments. (G) HEK293T cells stably expressing eGFP-LRRK2 were treated with vehicle or LLOMe (1 mM) for 2 hr, fixed, and stained using an antibody against LAMP1. Colocalization of LRRK2 and LAMP1 was assessed by measuring the Pearson’s correlation coefficient between eGFP-LRRK2 (shown in cyan) and LAMP1 (shown in magenta); nocodazole (25 μΜ) treatment was included to confirm colocalization. Scale bar, 10 μm. n=3 independent experiments. Data are shown as the mean ± SEM, and statistical significance was determined using repeated measures one-way ANOVA with Sidak’s multiple comparison test. **p<0.01, ***p<0.001, and ****p<0.0001.
-
Figure 3—source data 1
Raw data files for western blot.
- https://cdn.elifesciences.org/articles/87255/elife-87255-fig3-data1-v2.zip
-
Figure 3—source data 2
Annotated western blots.
- https://cdn.elifesciences.org/articles/87255/elife-87255-fig3-data2-v2.pdf
Figure 3—figure supplement 1
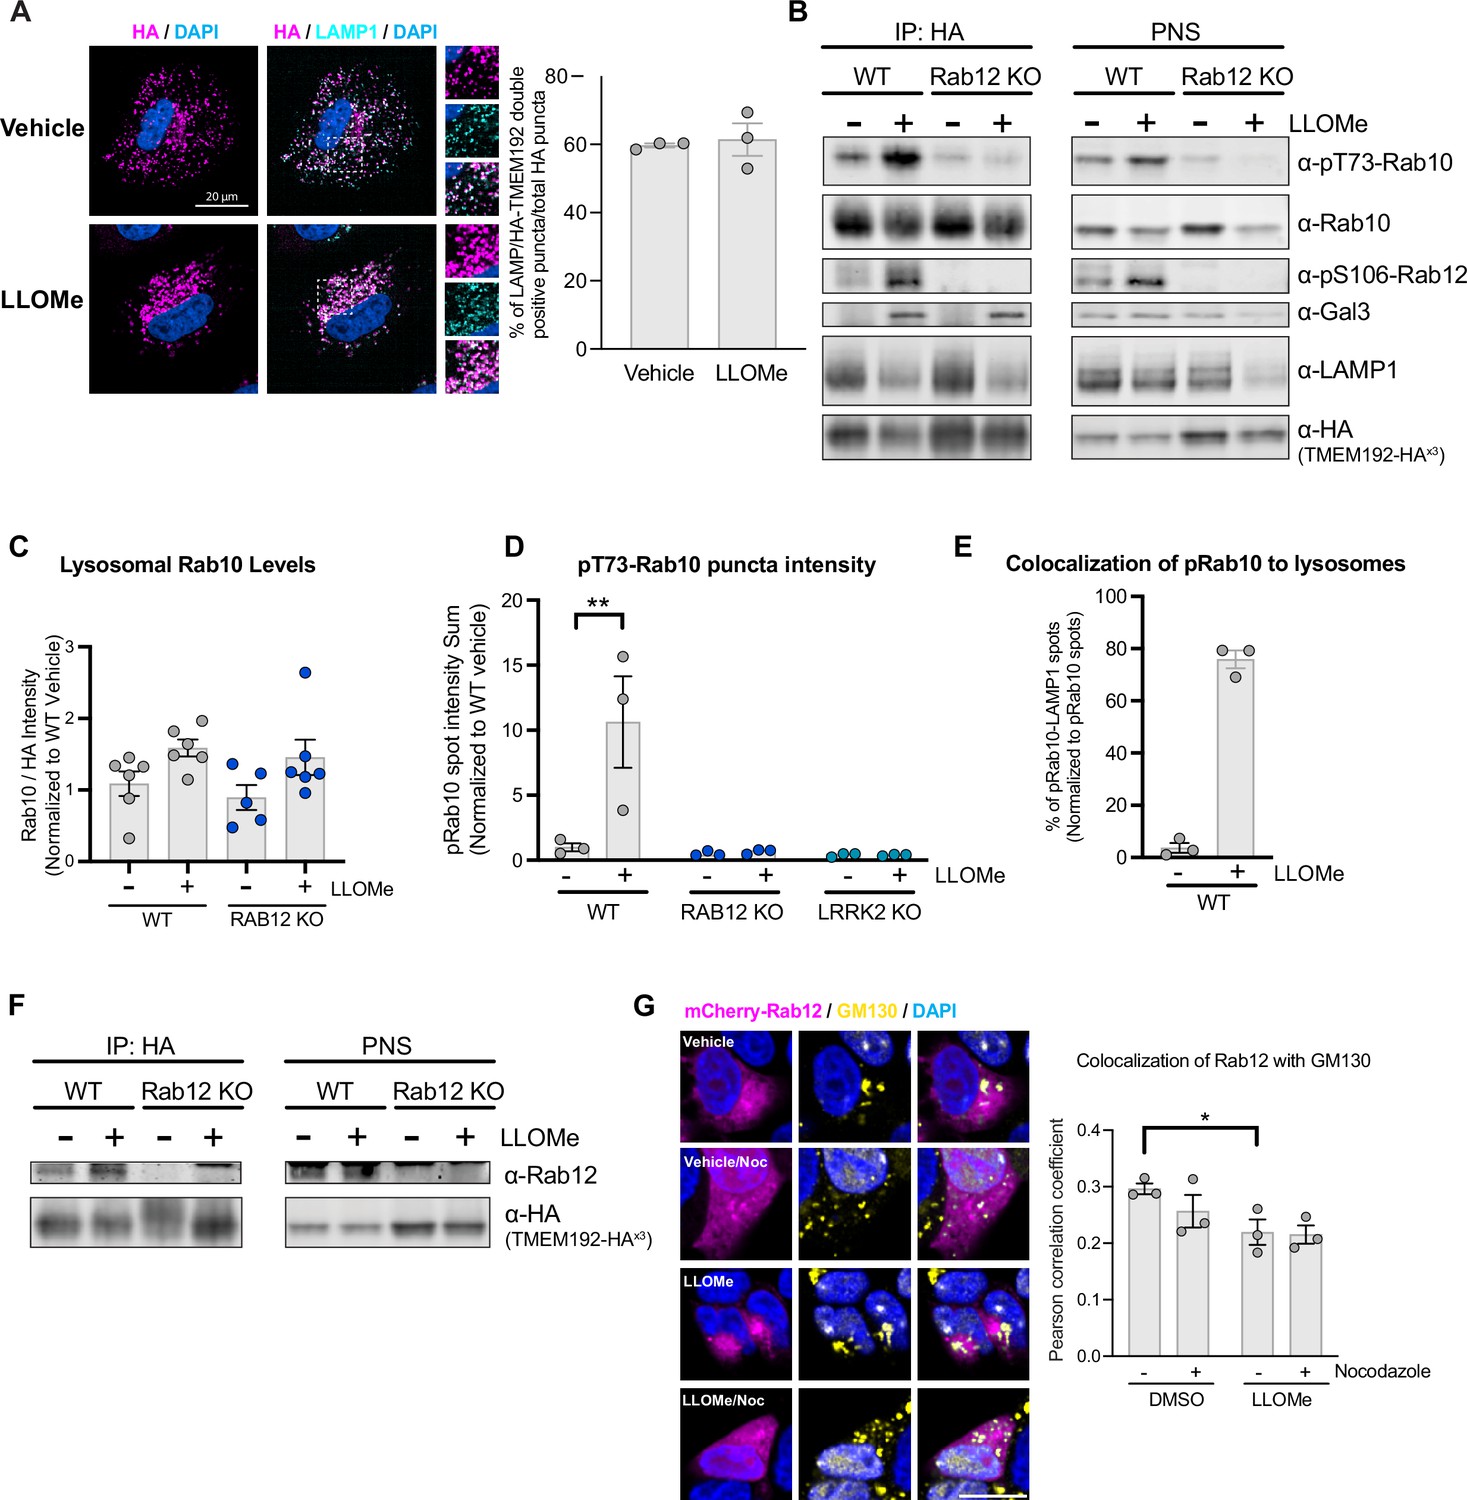
Validation of lysosomal immunopurification method and analysis of pT73 Rab10 and Rab12 localization in response to lysosomal damage.
(A) Wildtype (WT) A549 cells stably expressing TMEM192-3x-HA were treated with vehicle or L-leucyl-L-leucine methyl ester (LLOMe) (1 mM) for 2 hr, and HA (to detect TMEM192-3x-HA) and lysosomal-associated membrane protein 1 (LAMP1) signals were assessed by immunostaining. Scale bar, 20 μm. Percentage of HA (shown in magenta) and LAMP1 (shown in cyan) double positive puncta (i.e. overlap of magenta and cyan and shown in white) over total HA puncta were quantified per cell from n=3 independent experiments. Data are shown as the mean ± SEM. (B) Representative immunoblot from analysis of isolated lysosomes (IP: HA) and the post-nuclear supernatant (PNS) fraction (corresponding to Figure 3A) in WT and Rab12 KO A549 cells treated with vehicle or LLOMe (1 mM) for 2 hr. (C) Lysosomal Rab10 levels were assessed by western blot analysis from lysosomes isolated from WT and RAB12 KO A549 cells treated with vehicle or LLOMe (1 mM) for 2 hr. Rab10 levels were then normalized to the HA signal, then were normalized to the median within each experimental replicate and expressed as a fold change compared to lysosomes isolated from WT cells treated with vehicle (corresponding to Figure 3A); n=6 independent experiments. (D) pT73 Rab10 signals were assessed by immunostaining of WT, RAB12 KO, and LRRK2 KO A549 cells treated with vehicle or LLOMe (1 mM) for 2 hr (corresponding to Figure 3B). The sum intensity of puncta per cell was quantified from n=3 independent experiments. Data are shown as the mean ± SEM, and statistical significance was determined using two-way analysis of variance (ANOVA) with Sidak’s multiple comparison test. (E) Percentage of pT73 Rab10 puncta colocalized with LAMP1 were quantified from WT A549 cells treated with vehicle or LLOMe (1 mM) for 2 hr. Data are shown as the mean ± SEM, n=3 independent experiments. (F) Representative immunoblot from analysis of isolated lysosomes (IP: HA) and PNS (corresponding to Figure 3C) from WT and Rab12 KO A549 cells treated with vehicle or LLOMe (1 mM) for 2 hr. (G) HEK293T cells transiently expressing mCherry-Rab12 were treated with vehicle or LLOMe (1 mM) for 2 hr, fixed, and stained using an antibody against GM130 as a marker of the Golgi. Colocalization of Rab12 and GM130 was measured using the Pearson’s correlation coefficient between mCherry-Rab12 (shown in magenta) and GM130 (shown in yellow); nocodazole (25 μΜ) treatment was included to confirm colocalization. Scale bar, 10 μm. n=3 independent experiments. Data are shown as the mean ± SEM, and statistical significance was determined using repeated measures one-way ANOVA with Sidak’s multiple comparison test.
-
Figure 3—figure supplement 1—source data 1
Raw data files for western blot.
- https://cdn.elifesciences.org/articles/87255/elife-87255-fig3-figsupp1-data1-v2.zip
-
Figure 3—figure supplement 1—source data 2
Annotated western blots.
- https://cdn.elifesciences.org/articles/87255/elife-87255-fig3-figsupp1-data2-v2.pdf
Figure 3—figure supplement 2
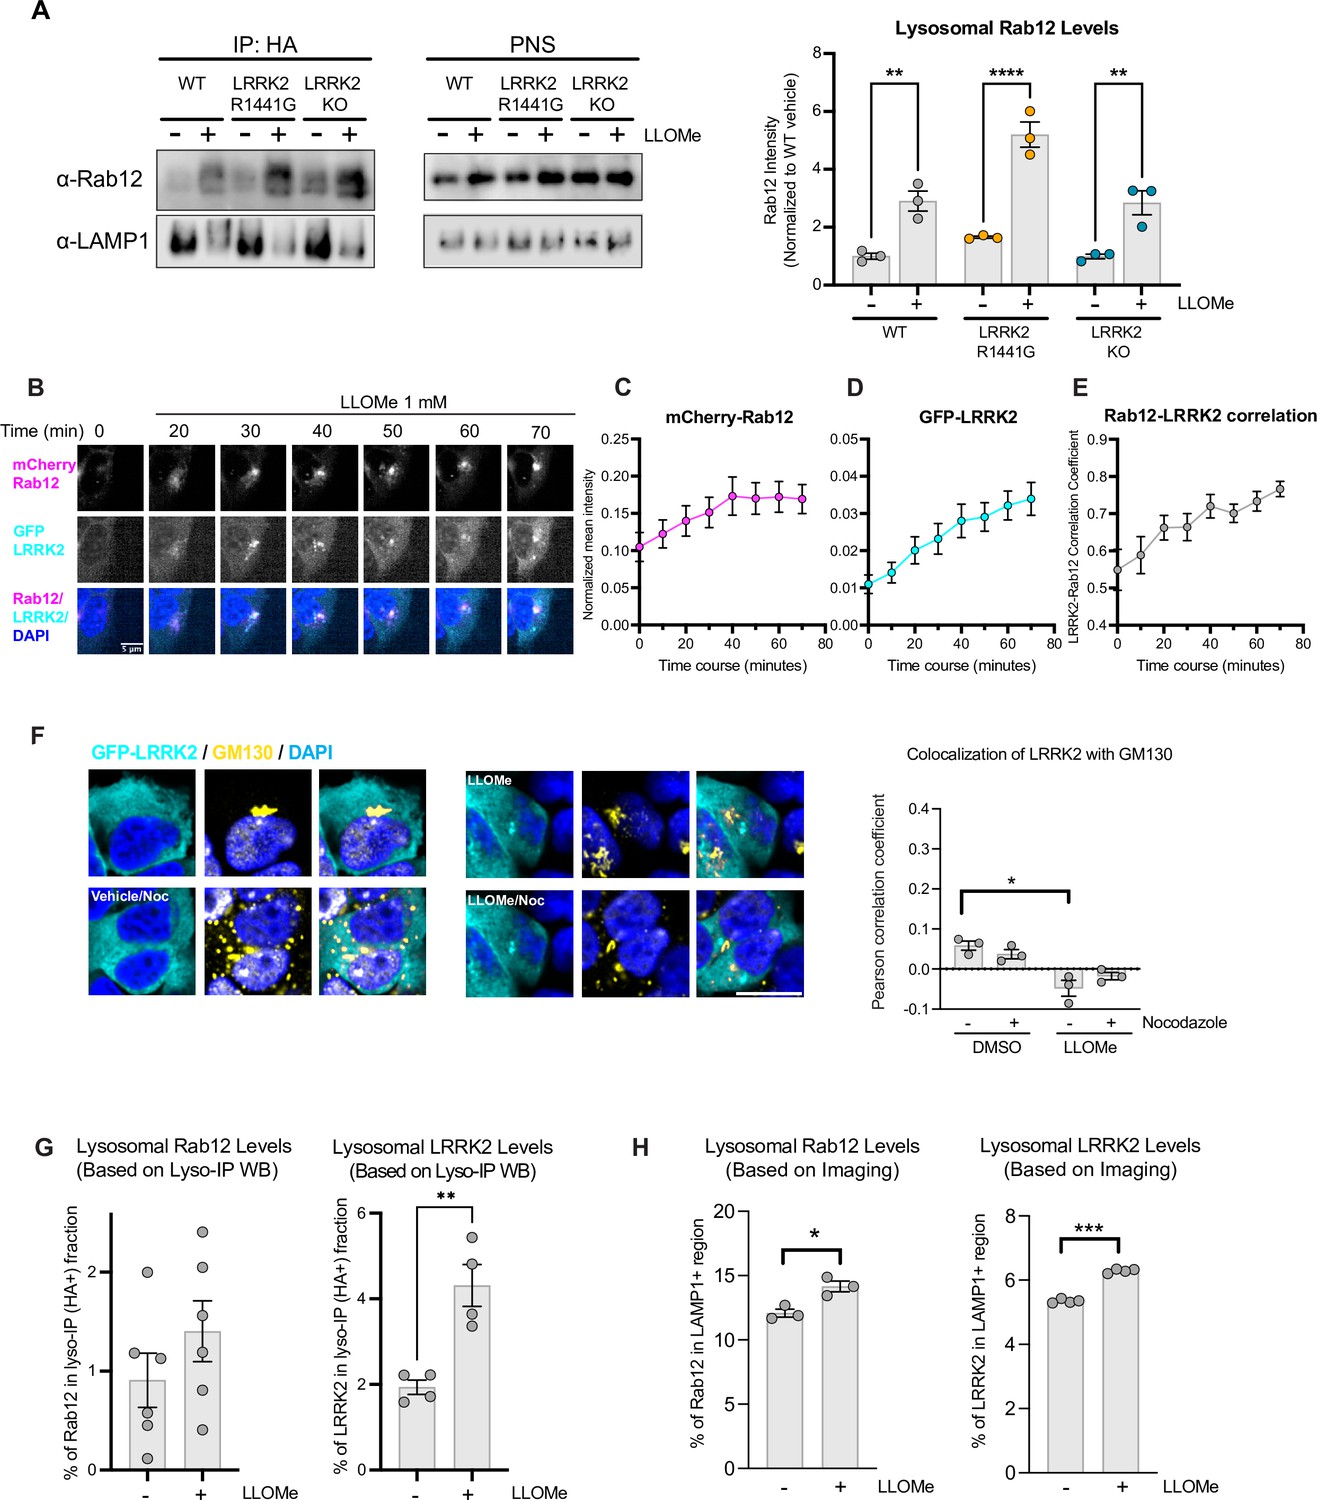
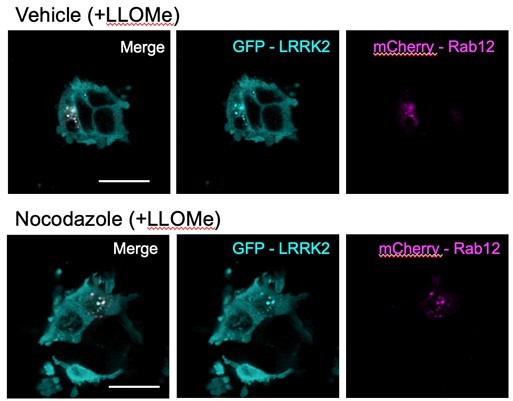
Analysis of Rab12 and LRRK2 localization at baseline and in response to lysosomal damage.
(A) Lysosomal Rab12 levels were assessed by western blot analysis from lysosomes isolated from wildtype (WT), LRRK2 R1441G, and LRRK2 KO A549 cells treated with vehicle or L-leucyl-L-leucine methyl ester (LLOMe) (1 mM) for 2 hr. The Rab12 signals were normalized to the median within each experimental replicate and expressed as a fold change compared to lysosomes isolated from WT A549 cells treated with vehicle. n=3 independent experiments. Data are shown as the mean ± SEM and statistical significance was determined using one-way analysis of variance (ANOVA) with Tukey’s multiple comparison test. (B) Representative live-cell images show the recruitment of Rab12 and LRRK2 upon LLOMe (1 mM) treatment. HEK293T cells were transfected with mCherry-Rab12 and eGFP-LRRK2, and images were acquired every 10 min. Scale bar, 5 μm. (C–E) Normalized mean intensity of mCherry-Rab12 (C) and eGFP-LRRK2 (D) were quantified over time in segmented cells (n=24 cells). (E) Pearson’s correlation coefficient (PCC) between normalized eGFP-LRRK2 and mCherry-Rab12 were quantified over time in segmented cells (n=24 cells); n=3 experiments. Data are shown as mean ± SEM. (F) HEK293T cells stably expressing eGFP-LRRK2 were treated with vehicle or LLOMe (1 mM) for 2 hr, fixed, and stained using an antibody against the Golgi marker GM130. Colocalization of LRRK2 and GM130 was assessed by measuring the PCC between eGFP-LRRK2 (shown in cyan) and GM130 (shown in yellow); nocodazole (25 μΜ) treatment was included to confirm colocalization. Scale bar, 10 μm; n=3 independent experiments. Data are shown as the mean ± SEM, and statistical significance was determined using repeated measures one-way ANOVA with Sidak’s multiple comparison test. (G) The percentage of total Rab12 and LRRK2 localized to lysosomes was assessed using western blot analysis of lysosomes isolated from A549 cells treated with vehicle or LLOMe and estimated based on the signals of Rab12 and LRRK2 in the lysosomal fraction normalized to the signals in the post-nuclear supernatant (PNS) fraction. Our analysis of total HA recovery from isolated lysosomes confirmed that not all of the HA-labeled lysosomes were captured, suggesting that the estimated lysosomal LRRK2 and Rab12 levels using this method are likely an underestimate; n=4–6 experiments. Data are shown as the mean ± SEM, and statistical significance was determined using unpaired t-test. (H) The percentage of Rab12 and LRRK2 localized to lysosomes was assessed using imaging-based analysis. HEK293T cells transfected with either mCherry-Rab12 or eGFP-LRRK2 were treated with vehicle or LLOMe, fixed, and stained using an antibody against lysosomal-associated membrane protein 1 (LAMP1). The percentage of Rab12 and LRRK2 localized to lysosomes was quantified using the sum intensity of Rab12 or LRRK2 in the LAMP1-positive region normalized to the sum intensity of Rab12 or LRRK2 in the whole cell region. n=3–4 experiments. The data were normalized to the median within each experiment. Data are shown as the mean ± SEM, and statistical significance was determined using unpaired t-test. *p<0.05, **p<0.01, ***p<0.001, ****p<0.0001.
Figure 4 with 1 supplement
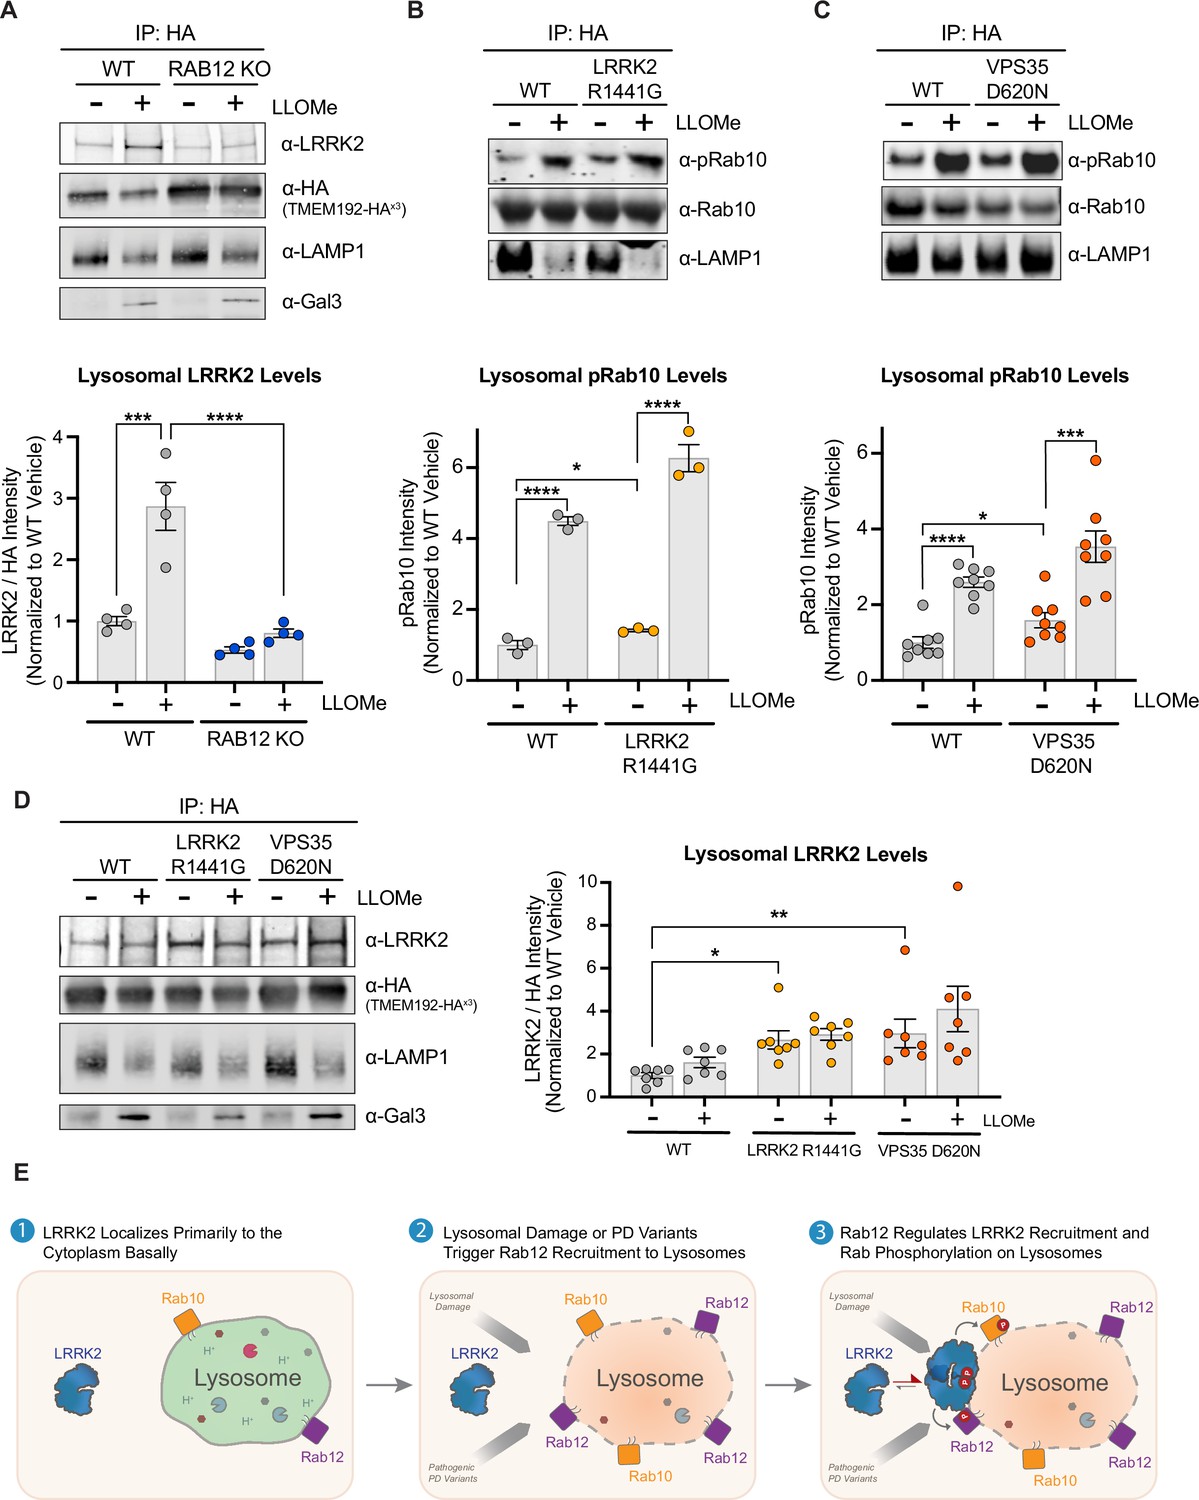
LRRK2 levels are increased on lysosomes following lysosomal damage in a Rab12-dependent manner and are also increased by Parkinson’s disease (PD)-linked variants.
(A) To analyze lysosomal LRRK2 levels, lysosomes were isolated from wildtype (WT) and RAB12 KO A549 cells treated with vehicle or L-leucyl-L-leucine methyl ester (LLOMe) (1 mM) for 4 hr. The levels of LRRK2, HA, lysosomal-associated membrane protein 1 (LAMP1), and galectin-3 (Gal3) were assessed by western blot analysis, and shown is a representative immunoblot. Fluorescence signals of immunoblots from multiple experiments were quantified, LRRK2 signal was normalized to the HA signal, then normalized to the median within each experiment, and expressed as a fold change compared to lysosomes isolated from WT A549 cells treated with vehicle. Data are shown as the mean ± SEM; n=4 independent experiments. Statistical significance was determined using one-way analysis of variance (ANOVA) with Tukey’s multiple comparison test with a single pooled variance. (B–C) To analyze lysosomal pRab10 levels, lysosomes were isolated from WT and LRRK2 R1441G KI (B) or VPS35 D620N KI (C) A549 cells treated with vehicle or LLOMe (1 mM) for 2 hr, and the levels of pT73 Rab10, Rab10, and LAMP1 were assessed by western blot analysis. Immunoblot signals from multiple experiments were quantified, and the pT73 Rab10 signal was expressed as a fold change compared to lysosomes isolated from WT A549 cells treated with vehicle. Data are shown as the mean ± SEM; n=3 independent experiments (B) and n=8 independent experiments (C). Statistical significance was determined using unpaired t-test. (D) Lysosomes were isolated from WT, LRRK2 R1441G KI, and VPS35 D620N KI A549 cells treated with vehicle or LLOMe (1 mM) for 4 hr. The levels of LRRK2, HA, LAMP1, and Gal3 were assessed by western blot analysis and shown is a representative immunoblot. Fluorescence signals of immunoblots from multiple experiments were quantified, the LRRK2 signal was normalized to the HA signal, then normalized to the median within each experiment, and expressed as a fold change compared to lysosomes isolated from WT A549 cells treated with vehicle. Data are shown as the mean ± SEM; n=7 independent experiments. Statistical significance was determined using one-way ANOVA with Dunnett’s multiple comparison test. *p<0.05, ***p<0.001, ****p<0.0001. (E) Model for proposed mechanism by which Rab12 promotes LRRK2 activation. Under steady-state conditions, LRRK2 localizes primarily to the cytoplasm. Lysosomal damage prompts the recruitment of Rab12, and Rab12 regulates the recruitment of LRRK2 to damaged lysosomes. An elevated local concentration of LRRK2 on lysosomes increases the likelihood for interactions with Rab GTPases localized on the lysosomal membrane, promoting LRRK2-dependent phosphorylation of its Rab substrates.
-
Figure 4—source data 1
Raw data files for western blot.
- https://cdn.elifesciences.org/articles/87255/elife-87255-fig4-data1-v2.zip
-
Figure 4—source data 2
Annotated western blots.
- https://cdn.elifesciences.org/articles/87255/elife-87255-fig4-data2-v2.pdf
Figure 4—figure supplement 1
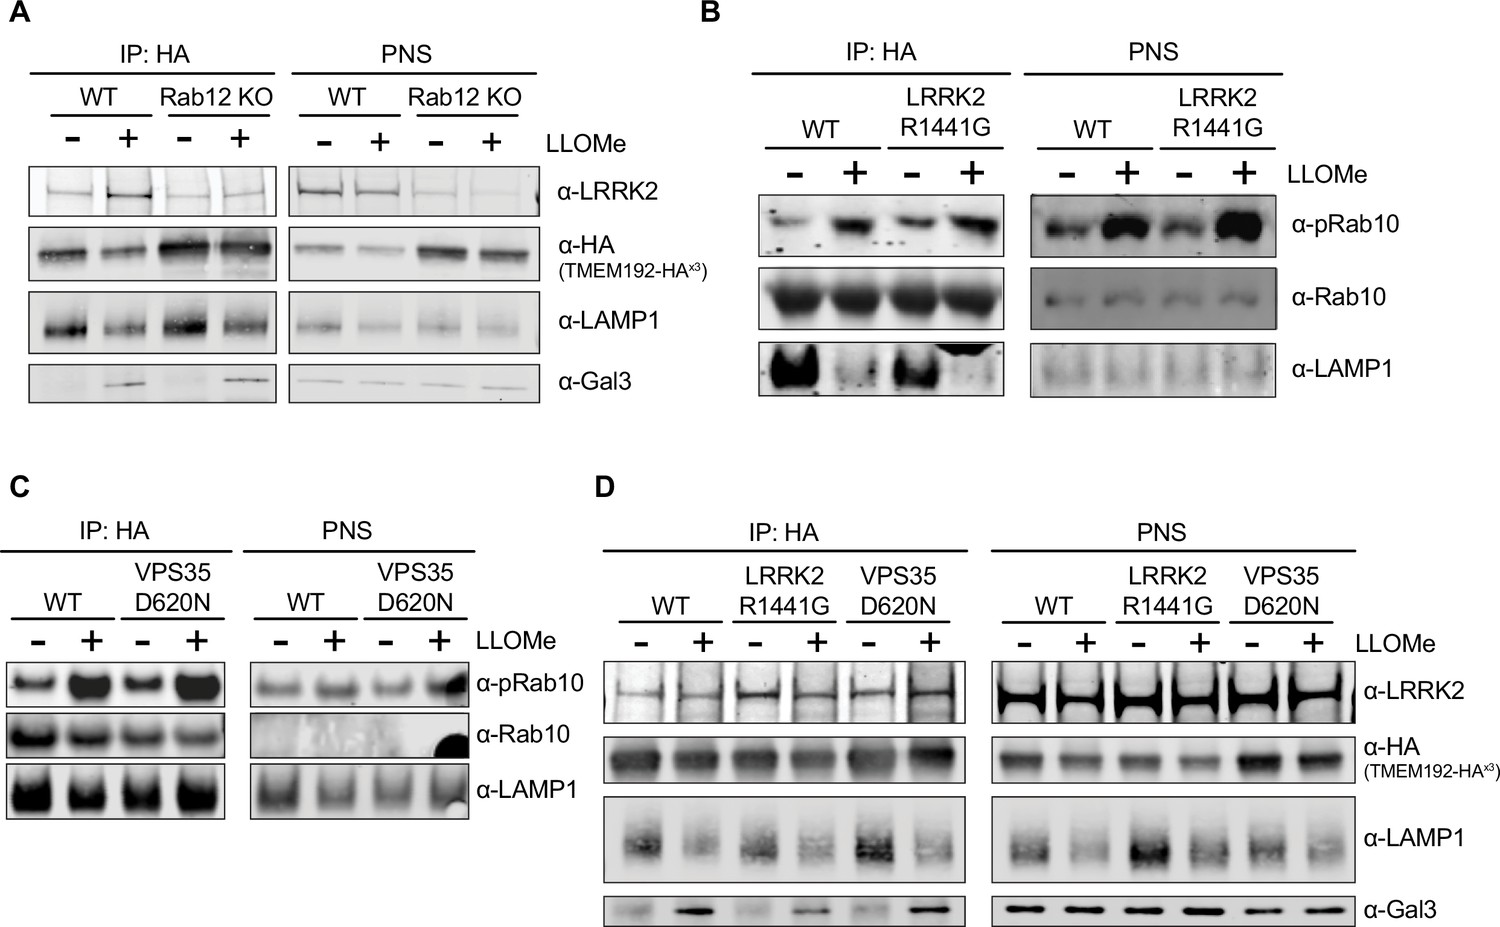
Western blot analysis of pRab10 and LRRK2 levels on isolated lysosomes and the corresponding post-nuclear supernatant (PNS).
(A) Lysosomes were isolated from wildtype (WT) and RAB12 KO A549 cells treated with vehicle or L-leucyl-L-leucine methyl ester (LLOMe) (1 mM) for 4 hr, and the immunopurified lysosomal fraction and PNS was collected. The levels of LRRK2, HA, lysosomal-associated membrane protein 1 (LAMP1), and galectin-3 (Gal3) were assessed by western blot analysis, and shown is a representative immunoblot. (B–C) Lysosomes were isolated from WT and LRRK2 R1441G KI (B) or VPS35 D620N KI (C) A549 cells treated with vehicle or LLOMe (1 mM) for 2 hr, and the immunopurified lysosomal fraction and PNS was collected. The levels of pT73 Rab10, Rab10, and LAMP1 were assessed by western blot analysis, and shown is a representative immunoblot. (D) Lysosomes were isolated from WT, LRRK2 R1441G KI, and VPS35 D620N KI A549 cells treated with vehicle or LLOMe (1 mM) for 4 hr, and the immunopurified lysosomal fraction and PNS was collected. The levels of LRRK2, HA, LAMP1, and Gal3 were assessed by western blot analysis and shown is a representative immunoblot.
Author response image 1
Author response image 2
Tables
Key resources table
| Reagent type (species) or resource | Designation | Source or reference | Identifiers | Additional information |
|---|---|---|---|---|
| Antibody | pT73 Rab10 (rabbit monoclonal) | Denali | 19-4 | WB: 1:500; MSD 1 ug/mL |
| Antibody | pT73 Rab10 (rabbit monoclonal) | Abcam | ab241060 RRID:AB_2884876 | ICC: 1:100 |
| Antibody | Rab10 (mouse monoclonal) | Abcam | ab104859 RRID:AB_10711207 | WB: 1:500 |
| Antibody | Rab10 (rabbit monoclonal) | CST | 8127 RRID:AB_10828219 | ICC: 1:100 |
| Antibody | Rab10 (rabbit monoclonal) | Abcam | ab181367 | MSD: 2 ug/mL |
| Antibody | pS106 Rab12 (rabbit monoclonal) | Abcam | ab256487 RRID:AB_2884880 | WB: 1:500 |
| Antibody | Rab12 (rabbit polyclonal) | Proteintech | 18843–1-AP RRID:AB_10603469 | WB: 1:500 |
| Antibody | Rab8a (rabbit monoclonal) | Abcam | ab188574 RRID:AB_2814989 | WB: 1:500 |
| Antibody | HA (rabbit monoclonal) | CST | 3724 RRID:AB_1549585 | WB: 1:2000 ICC: 1:100 |
| Antibody | Gal3 (mouse monoclonal) | BD | 556904 RRID:AB_396531 | WB: 1:500 |
| Antibody | LAMP1 (rabbit monoclonal) | CST | 9091 RRID:AB_2687579 | WB: 1:500 |
| Antibody | LAMP1 (mouse monoclonal) | Abcam | ab25630 RRID:AB_470708 | WB: 1:1000 ICC: 1:100 |
| Antibody | LRRK2 (mouse monoclonal) | UC Davis/NIH NeuroMab Facility | N241A/34 RRID:AB_2877351 | WB: 1:500 |
| Antibody | LRRK2 (mouse monoclonal) | Biolegend | 808201 RRID:AB_2564739 | MSD: 1 μg/mL |
| Antibody | LRRK2 | Biolegend | 844401 RRID:AB_2565614 | MSD: 0.5 μg/mL |
| Antibody | pS935 LRRK2 (rabbit monoclonal) | Abcam | ab133450 RRID:AB_2732035 | WB: 1:500 MSD: 0.5 μg/mL |
| Antibody | GAPDH (mouse monoclonal) | Abcam | ab8245 RRID:AB_2107448 | WB: 1:500 |
| Antibody | Actin (mouse monoclonal) | Sigma-Aldrich | A2228 RRID:AB_476697 | WB: 1:5000 |
| Antibody | GM130 (rabbit monoclonal) | Abcam | ab52649 RRID: AB_880266 | ICC: 1:200 |
| Cell line (Homo sapiens) | HEK293T cells | ATCC | CRL-3216 | |
| Cell line (H. sapiens) | A549 cells | ATCC | CCL-185 | |
| Cell line (H. sapiens) | Rab29 KO A549 cells | Dr. Dario Alessi | ||
| Cell line (H. sapiens) | Rab12 KO A549 cells | Denali | ||
| Cell line (H. sapiens) | LRRK2 R1441G KI A549 cells | Denali | ||
| Cell line (H. sapiens) | VPS35 D620N KI A549 cells | Denali | ||
| Cell line (H. sapiens) | eGFP-LRRK2 HEK293T cells | Denali | ||
| Recombinant DNA reagent | pLVX-TMEM192-3x-HA | Denali | ||
| Recombinant DNA reagent | pcDNA3.1-eGFP-LRRK2 | Denali | ||
| Recombinant DNA reagent | pcDNA3.1-mCherry-Rab12 | Denali | ||
| Chemical compound | LLOMe | Sigma-Aldrich | L7393 | 1 mM |
| Chemical compound | Nocodazole | Sigma-Aldrich | M1404 | 25 μΜ |
| Software, algorithm | Fiji | PMID:29187165 | RRID:SCR_002285 | |
| Software, algorithm | GraphPad Prism | Version 9.5.1 | RRID:SCR_002798 | |
| Software, algorithm | Image Studio Lite | Version 5.2.5 | RRID:SCR_013715 | |
| Software, algorithm | Harmony | Versions 4.9 and 5.1 | RRID:SCR_018809 | |
| Software, algorithm | Python Programming Language | v3.10.8 | RRID:SCR_008394 | |
| Software, algorithm | SciPy | v1.9.3 | RRID:SCR_008058 | |
| Software, algorithm | Napari | v0.4.17 | RRID:SCR_022765 | |
| Software, algorithm | scikit-image | v0.19.3 | RRID:SCR_021142 | |
| Software, algorithm | NumPy | v1.24.2 | RRID:SCR_008633 |
Additional files
Download links
A two-part list of links to download the article, or parts of the article, in various formats.
Downloads (link to download the article as PDF)
Open citations (links to open the citations from this article in various online reference manager services)
Cite this article (links to download the citations from this article in formats compatible with various reference manager tools)
Rab12 is a regulator of LRRK2 and its activation by damaged lysosomes
eLife 12:e87255.
https://doi.org/10.7554/eLife.87255


