DHODH inhibition enhances the efficacy of immune checkpoint blockade by increasing cancer cell antigen presentation
- Eppley Institute for Research in Cancer and Allied Diseases, University of Nebraska Medical Center, United States
- Department of Oncology Science, University of Oklahoma Health Sciences Center, United States
- Department of Biochemistry and Molecular Biology, University of Iowa, United States
- Center for Regenerative Medicine, Massachusetts General Hospital, United States
- Harvard Stem Cell Institute, United States
- OU Health Stephenson Cancer Center, University of Oklahoma Health Sciences Center, United States
Figures
Figure 1 with 1 supplement

Brequinar (BQ) induces mRNA expression of antigen presentation pathway genes and upregulates cell surface MHC-I in diverse cancer cell lines.
(A) Schematic of RNA sequencing experiment for panels (B–D), with de novo pyrimidine pathway shown to highlight the role of DHODH. (B) Normalized enrichment scores for gene sets commonly enriched (FDR q < 0.25) in S2-013 and CFPAC-1 cells following 2-week BQ treatment (250 nM for CFPAC-1; 500 nM for S2-013), as assessed by gene set enrichment analysis (GSEA). (C) GSEA plots for indicated gene sets following 2-week BQ treatment of CFPAC-1 (left) or S2-013 (right) cells at the indicated doses. (D) Heatmap showing log2 fold change mRNA expression measured by RNA sequencing of APP genes in CFPAC-1 cells treated with BQ for indicated dose and duration. (E) Heatmap showing log2 fold change mRNA expression measured by RNA sequencing for APP genes in A375 melanoma cells treated with the DHODH inhibitor teriflunomide (25 µM) for indicated durations, data extracted from Tan et al., 2016. (F) RT-qPCR quantification of HLA-A, HLA-B, and HLA-C mRNA levels in cancer cell lines after 24 hr BQ treatment. Numbers represent fold change relative to vehicle control for each cell line. Data are representative of at least three independent experiments. HLA-B was not detectable in MiaPaCa2 cells. (G, H) Flow cytometry analysis of cell surface MHC-I in live CFPAC-1 (G) or B16F10 (H) cells following 10-day treatment with BQ (250 nM for CFPAC-1 and 10 µM for B16F10). (I, J) Liquid chromatography-tandem mass spectrometry metabolomics quantification of de novo pyrimidine pathway metabolites in CFPAC-1 (I) or B16F10 (J) cells following 8 hr BQ treatment at indicated doses. Data represent mean ± SD of four (CFPAC-1) or six (B16F10) biological replicates. ***p<0.001 by one-way ANOVA with Dunnett’s multiple-comparison test.
-
Figure 1—source data 1
Source data for gene set enrichment analysis, RT-qPCR, and metabolomics experiments shown in Figure 1 and Figure 1—figure supplement 1.
- https://cdn.elifesciences.org/articles/87292/elife-87292-fig1-data1-v1.xlsx
Figure 1—figure supplement 1

Brequinar (BQ) treatment upregulates APP genes and depletes pyrimidine nucleotides.
(A) Heatmap showing log2 fold change mRNA expression measured by RNA sequencing of APP genes in S2-013 cells treated with BQ for indicated dose and duration. (B, C) RT-qPCR quantification of mRNA levels for indicated APP genes after 2-week BQ treatment of CFPAC-1 (250 nM) (B) or B16F10 (10 µM) (C) cells. **p<0.01, ***p<0.001 by unpaired t-test with Holm–Sidak correction for multiple comparisons. (D, E) LC-MS/MS quantification of indicated pyrimidine metabolites in CFPAC-1 (C) or B16F10 (D) cells treated with BQ for 8 hr at indicated doses. Data represent mean ± SD of four (CFPAC-1) or six (B16F10) biological replicates. **p<0.01, ***p<0.001 by one-way ANOVA with Dunnett’s multiple-comparison test.
Figure 2 with 1 supplement
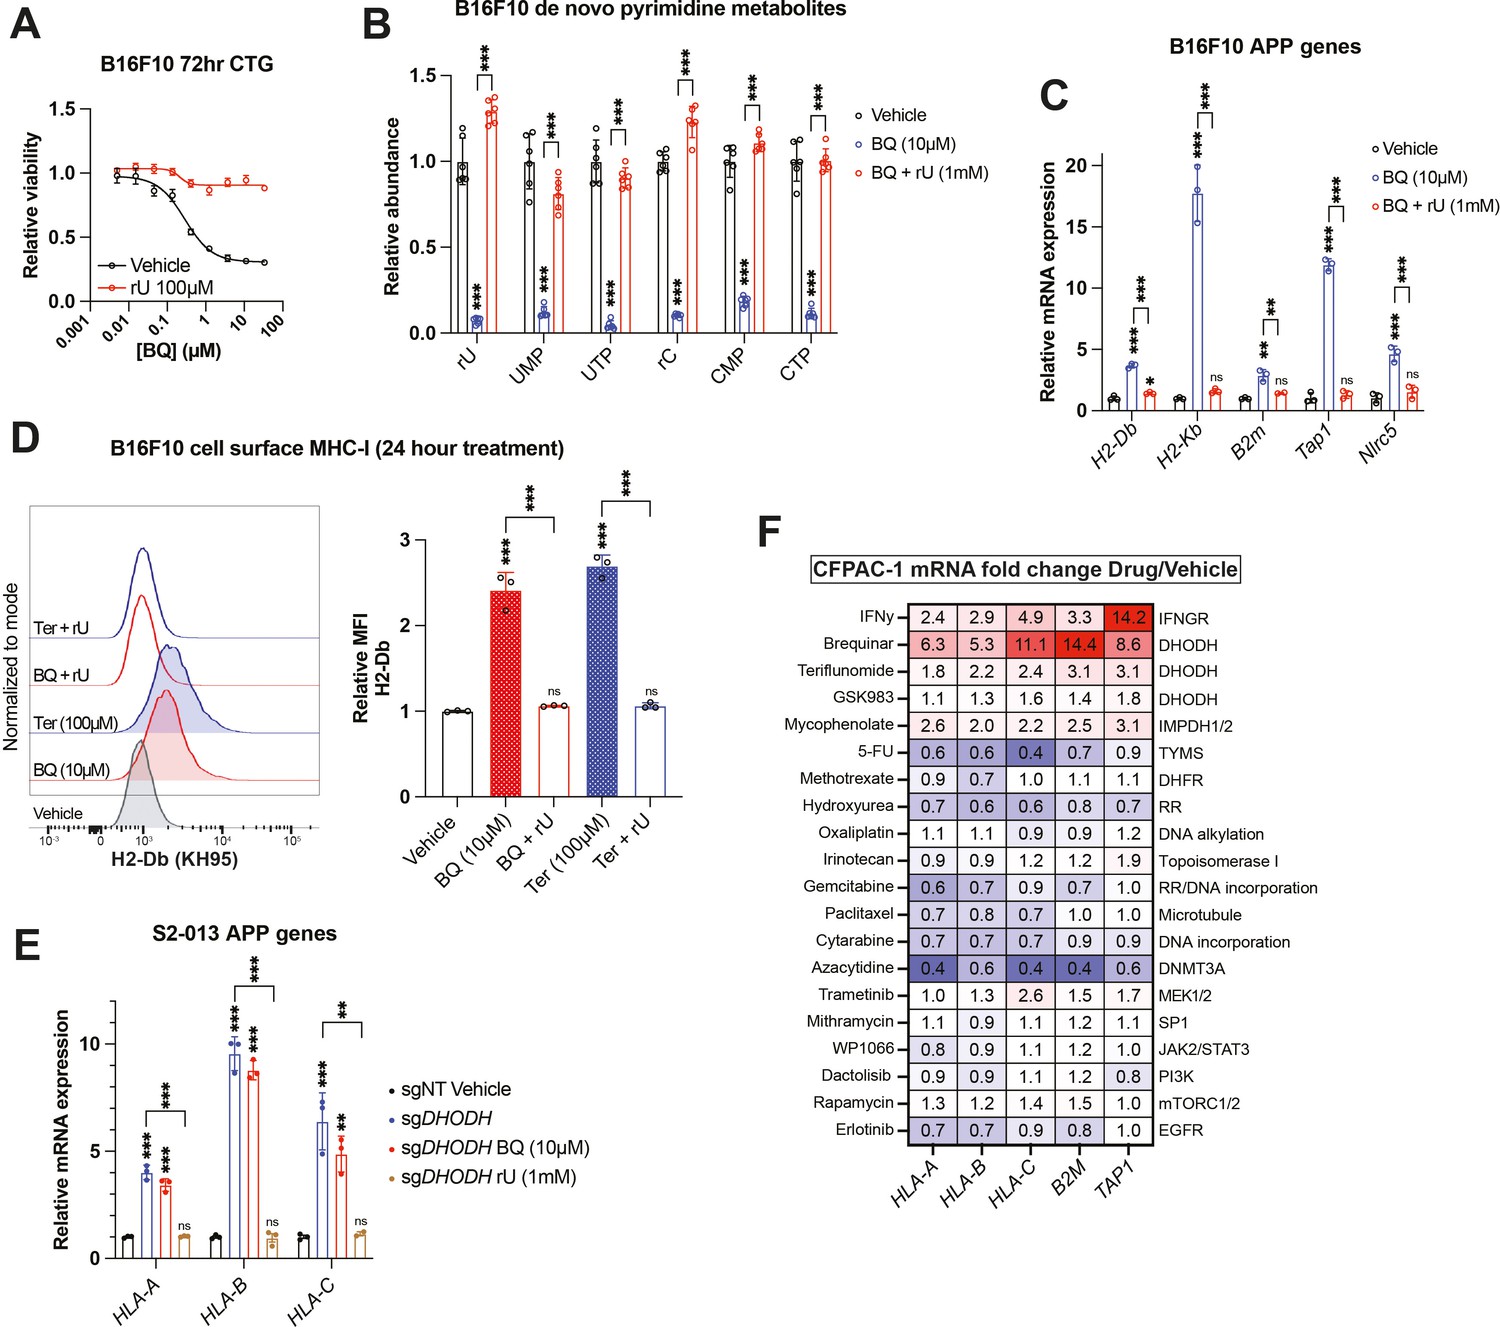
Brequinar (BQ)-mediated APP induction requires pyrimidine nucleotide depletion.
(A) Dose–response cell viability experiment in B16F10 cells treated with BQ ± uridine (100 µM) for 72 hr. Data represent mean ± SEM of three biological replicates. One representative result of three independent experiments is shown. (B) Quantification of pyrimidine metabolites following 24 hr treatment of B16F10 cells with vehicle, BQ (10 µM), or BQ + uridine (1 mM). Data represent mean ± SD of six biological replicates. ***p<0.001 by one-way ANOVA with Tukey’s multiple-comparison test. (C) RT-qPCR quantification of mRNA levels for indicated APP genes in B16F10 cells following 24 hr treatment with BQ (10 µM) ± uridine (1 mM). Data represent mean ± SD of three technical replicates. One representative result of three independent experiments is shown. **p<0.01, ***p<0.001, and ‘ns’ p>0.05 by one-way ANOVA with Tukey’s multiple-comparison test. (D) Left: flow cytometry analysis of cell surface MHC-I (H2-Db) on live B16F10 cells following 24 hr treatment with indicated agents (BQ 10 µM, teriflunomide 100 µM, uridine 1 mM). Right: quantification of H2-Db mean fluorescence intensity normalized to vehicle control. Data represent mean ± SD of three independent experiments. ***p<0.001 and ‘ns’ p>0.05 by one-way ANOVA with Tukey’s multiple-comparison test. (E) RT-qPCR quantification of mRNA levels for indicated APP genes in S2-013 cells with DHODH knockout (sgDHODH) or non-targeting control vector (sgNT) treated with indicated agents for 72 hr. Data represent mean ± SD of four determinations. One representative result of three independent experiments is shown. **p<0.01, ***p<0.001, and ‘ns’ p>0.05 by one-way ANOVA with Tukey’s multiple-comparison test. (F) RT-qPCR quantification of mRNA levels for indicated APP genes in CFPAC-1 cells following 72 hr treatment with indicated agents. Numbers in the heatmap represent mean fold change versus vehicle control with four determinations.
-
Figure 2—source data 1
Source data for cell viability, metabolomics, RT-qPCR, and flow cytometry experiments shown in Figure 2 and Figure 2—figure supplement 1.
- https://cdn.elifesciences.org/articles/87292/elife-87292-fig2-data1-v1.xlsx
Figure 2—figure supplement 1

Brequinar and teriflunomide cause MHC-I upregulation by pyrimidine nucleotide depletion.
(A) Dose–response cell viability experiment as in Figure 2A but with teriflunomide (Ter) instead of brequinar (BQ). (B) RT-qPCR analysis of indicated genes following treatment with teriflunomide (100 µM) ± uridine (1 mM) for 24 hr. Data represent mean ± SEM of three or four determinations. One representative result of three independent experiments is shown. *p<0.05, **p<0.01, and ***p<0.001 by one-way ANOVA with Tukey’s multiple-comparison test. (C) RT-qPCR analysis of indicated genes after treatment with vehicle or uridine (1 mM) for 24 hr. Data represent mean ± SD of four determinations. One representative result of three independent experiments is shown. The ‘ns’ label indicates p>0.05 by unpaired t-test with Holm–Sidak correction for multiple comparisons. (D) RT-qPCR analysis of indicated genes following treatment with BQ (10 µM) ± uridine (1 mM) for 24 hr. Data represent mean ± SD of three independent experiments. *p<0.05, **p<0.01, and ***p<0.001, and ‘ns’ indicates p>0.05 by one-way ANOVA with Tukey’s multiple-comparison test. (E) Flow cytometry analysis of cell surface MHC-I (H2-Db) following 24 hr uridine (1 mM) treatment. Data represent mean ± SD of three independent experiments. The ‘ns’ label indicates p>0.05 by one-way ANOVA with Tukey’s multiple-comparison test. The vehicle control in (E) is the same as shown in Figure 2D, as all six conditions were tested in parallel. (F) RT-qPCR quantification of mRNA levels for indicated APP genes in B16F10 cells following 24 hr treatment with MPA (5 µM) or vehicle control. Data represent mean ± SD of four determinations. One representative result of three independent experiments is shown. * p<0.05 and ***p<0.001 by unpaired t-test with Holm–Sidak correction for multiple comparisons.
Figure 3 with 1 supplement

IKK2 inhibitor BMS-345541 abrogates brequinar (BQ)-mediated APP induction in an IKK2-independent manner.
(A, B) HEK-293T cells were treated with indicated agents for 24 hr and then subjected to RT-qPCR quantification of mRNA levels for indicated APP genes. Numbers in the heatmap represent mean of four determinations. (C–E, G) B16F10 (C), CFPAC-1 (D), HCT116 (E), or MiaPaCa2-IKK2-KO (G) cells were treated with indicated agents for 24 hr and subjected to RT-qPCR analysis of indicated genes. Data in (D, E, G) represent mean ± SD of three independent experiments. *p<0.05, **p<0.01, and ***p<0.001 by one-way ANOVA with Tukey’s multiple-comparison test. For (C), numbers in the heatmap represent mean fold change versus vehicle with three determinations; representative results for three independent experiments are shown. (F) Flow cytometry analysis of cell surface MHC-I in live HCT116 cells treated with indicated agents for 24 hr.
-
Figure 3—source data 1
Source data for RT-qPCR experiments shown in Figure 3 and Figure 3—figure supplement 1.
- https://cdn.elifesciences.org/articles/87292/elife-87292-fig3-data1-v1.xlsx
Figure 3—figure supplement 1

IKK2, JAK1, JAK2, and TBK1 are dispensable for BQ-mediated APP induction.
(A) RT-qPCR quantification of mRNA levels for indicated APP genes in HEK-293T cells treated for indicated times with brequinar (BQ) (10 µM). Data represent mean ± SD of four determinations. (B) RT-qPCR analysis for Nlrc5 (left) or Tap1 (right) in B16F10 cells treated for 24 hr with indicated agents. Data represent mean ± SD of four determinations. ***p<0.001 by one-way ANOVA with Tukey’s multiple-comparison test. Representative results for one of three independent experiments are shown. (C) Heatmap showing fold change in mRNA expression (normalized to wild-type vehicle control) of indicated genes by RT-qPCR analysis in wild-type or IKK2-KO MiaPaCa2 cells treated with indicated agents for 24 hr. Numbers in the heatmap represent mean of four determinations.
Figure 4 with 1 supplement

P-TEFb inhibitor flavopiridol abrogates APP induction downstream of nucleotide depletion.
(A) Plot of percent inhibition (10 µM treatment) vs. -log(dissociation constant) for kinases bound by BMS-345541 in cell-free KINOMEscan assays; data derived from Davis et al., 2011. Each data point represents an individual kinase. (B, C) RT-qPCR quantification of mRNA levels for indicated APP genes in HEK-293T cells treated with indicated agents for 24 hr. Data represent mean ± SD of three independent experiments. **p<0.01, ***p<0.001 and ‘ns’ p>0.05 by one-way ANOVA with Tukey’s multiple-comparison test (C). ( D) Western blot analysis for CDK9 performed on HEK-293T cells treated with CDK9-targeted PROTAC (PROTAC2) and/or pomalidomide (POM) for 24 hr. Beta actin was used as a loading control. (E) RT-qPCR quantification of mRNA levels for indicated APP genes after 24 hr treatment with indicated agents. Data represent mean ± SD of three independent experiments. *p<0.05, **p<0.01, and ***p<0.001 by one-way ANOVA Tukey’s multiple-comparison test. (F) Western blot analysis for CDK9 performed on HCT116 cells treated with the indicated concentrations of PROTAC2 for 24 hr. Heat shock protein 70 (HSP70) was used as a loading control. (G) Linear regression analysis of fold change (teriflunomide/DMSO) in Pol II occupancy (assessed by ChIP-seq) vs. fold change (teriflunomide/DMSO) in mRNA abundance (assessed by RNAseq) following 48 hr treatment of A375 cells with teriflunomide (25 µM) or DMSO vehicle control; data derived from Tan et al., 2016.
-
Figure 4—source data 1
Source data for RT-qPCR experiments and KINOMEscan data analysis shown in Figure 4 and Figure 4—figure supplement 1.
- https://cdn.elifesciences.org/articles/87292/elife-87292-fig4-data1-v1.xlsx
-
Figure 4—source data 2
Source data for western blot images shown in Figure 4.
- https://cdn.elifesciences.org/articles/87292/elife-87292-fig4-data2-v1.zip
Figure 4—figure supplement 1

Flavopiridol reverses MHC-I transcriptional induction downstream of nucleotide depletion.
(A) RT-qPCR quantification of mRNA levels for indicated APP genes in HCT116 cells treated with indicated agents in the presence or absence of flavopiridol (1 µM). Numbers in the heatmap represent mean of three determinations.
Figure 5 with 1 supplement

Brequinar (BQ) inhibits tumor growth, increases tumor MHC-I, and enhances immune checkpoint blockade efficacy in B16F10 murine melanoma model.
(A–D) B16F10 cells were injected subcutaneously into syngeneic C57Bl/6J hosts. Tumor-bearing mice were treated with BQ (10 mg/kg, administered intraperitoneally daily) or vehicle control starting at day 7 post implantation. (A) Longitudinal estimation of tumor volume using digital caliper measurement of B16F10 subcutaneous tumors in BQ-treated and vehicle-treated tumor-bearing mice. Data represent mean ± SD of n = 5 mice per group. *p<0.05, **p<0.01, ***p<0.001 by unpaired t-tests with Benjamini and Hochberg FDR correction. (B) Weight (left) and volume (right) of tumors at necropsy. Data represent mean ± SD of n = 5 mice per group. *p<0.05 by unpaired t-test. (C) Quantification of indicated metabolites from B16F10 tumors harvested at necropsy. Data represent mean ± SD of n = 5 mice in control group and n = 4 for BQ group; one sample was excluded due to sample attrition during processing, leading to insufficient metabolite recovery. *p<0.05, **p<0.01, ***p<0.001 by unpaired t-test. (D) RT-qPCR quantification of mRNA expression for indicated APP genes performed on tumors harvested at necropsy. Data represent mean ± SD of n = 5 mice per group. * p<0.05 and **p<0.01 by unpaired t-test. (E) Kaplan–Meier survival analysis for mice implanted with B16F10 tumors as in (A–D) and treated with indicated regimens; see Figure 5—figure supplement 1D for treatment timeline. *p<0.05, ***p<0.001 by Mantel–Cox logrank test. Sample size (n): vehicle (black), n = 15; immune checkpoint blockade (ICB; Anti-CTLA-4 and anti-PD-1; 100 µg/mouse each, IP twice per week) (red), n = 15; BQ + concurrent ICB (green), n = 14; BQ monotherapy (blue), n = 7; BQ + delayed ICB (brown), n = 8.
-
Figure 5—source data 1
Source data for tumor burden, tumor metabolomics, tumor RT-qPCR, and mouse survival experiments shown in Figure 5 and Figure 5—figure supplement 1.
- https://cdn.elifesciences.org/articles/87292/elife-87292-fig5-data1-v1.xlsx
Figure 5—figure supplement 1

Increased mRNA expression of APP genes correlates with longer survival of patients with melanoma.
(A) Kaplan–Meier overall survival analysis of melanoma patients (SKCM) from the Cancer Genome Atlas (TCGA) with above median (indicated in red) and below median (indicated in blue) tumor mRNA expression of indicated genes. Logrank test p values are shown for each gene. (B, C) Principal component analysis (PCA) plot (B) and unsupervised hierarchical clustering (C) from metabolomics analysis of B16F10 tumors at necropsy (Figure 5C). (D) Treatment regimen of mice for experiment shown in Figure 5E.
Author response image 1

Essentiality score from CRISPR and RNAi perturbation of CDK9 in cancer cell lines https://depmap.org/portal/gene/CDK9?tab=overview&dependency=RNAi_merged.
Tables
Key resources table
| Reagent type (species) or resource | Designation | Source or reference | Identifiers | Additional information |
|---|---|---|---|---|
| Strain (Mus musculus) | C57BL/6J | JAX | RRID:IMSR_JAX:000664 | Mouse strain used for tumor implantation experiments |
| Cell line (Homo sapiens) | A375 | ATCC | CRL-1619 | Source: malignant melanoma, 54-year-old female |
| Cell line (H. sapiens) | A549 | ATCC | CCL-185 | Source: lung carcinoma, 58-year-old male |
| Cell line (H. sapiens) | CFPAC-1 | ATCC | CRL-1918 | Source: pancreas adenocarcinoma, 26-year-old male |
| Cell line (H. sapiens) | HCT116 | ATCC | CCL-247 | Source: colorectal carcinoma, adult male (age unspecified) |
| Cell line (H. sapiens) | HEK-293T | ATCC | CRL-3216 | Source: kidney, female embryo |
| Cell line (H. sapiens) | MDA-MB-231 | ATCC | HTB-26 | Source: breast adenocarcinoma, 51-year-old female |
| Cell line (H. sapiens) | Panc1 | ATCC | CRL-1469 | Source: pancreas adenocarcinoma, 56-year-old male |
| Cell line (H. sapiens) | MiaPaCa2 (wild-type parental cell line for MiaPaCa2-IKK2-KO) | Gift from Amar Natarajan laboratory; Napoleon et al., 2022, originally from ATCC | CRL-1420 | Source: pancreas adenocarcinoma, 65-year-old male |
| Cell line (H. sapiens) | MiaPaCa2-IKK2-KO | Gift from Amar Natarajan laboratory; Napoleon et al., 2022 | Please see Napoleon et al., 2022 for information on how the cell line was generated | |
| Cell line (H. sapiens) | S2-013 | Tony Hollingsworth laboratory; Mullen et al., 2023 | RRID:CVCL_B280 | Source: liver metastasis from pancreas carcinoma, 73-year-old male |
| Cell line (H. sapiens) | S2-013 sgNT | Mullen et al., 2023 | S2-013 stably transduced with non-targeting sgRNA vector and Cas9 | |
| Cell line (H. sapiens) | S2-013 sgDHODH | Mullen et al., 2023 | S2-013 stably transduced with DHODH-targeting sgRNA vector and Cas9 | |
| Cell line (M. musculus) | B16F10 | ATCC | CRL-6475 | Source: malignant melanoma, male C57BL/6 mouse |
| Antibody | Anti-HSP70 (host: rabbit polyclonal) | CST | Ca# 4872 | Dilution factor 1:1000 for western blot |
| Antibody | Anti-CDK9 (host: rabbit monoclonal) | CST | Cat# 2316 Clone: C12F7 | Dilution factor 1:1000 for western blot |
| Antibody | Anti-ACTB (host: mouse monoclonal) | Santa Cruz Biotechnology | Cat# sc-4778 Clone: C4 | Dilution factor 1:500 for western blot |
| Antibody | Anti-H2-Db (host: mouse monoclonal) | BioLegend | Cat# 111508 Clone: HK95 | Conjugated to phycoerythrin for flow cytometry Dilution factor 2 µl in 100 µl final volume |
| Antibody | Anti-MHC-I (host: mouse monoclonal) | BioLegend | Cat# 311418 Clone: W6/32 | Conjugated to Pacific Blue fluorescent marker for flow cytometry Dilution factor 2 µl in 100 µl final volume |
| Antibody | Anti-MHC-I (host: mouse monoclonal) | BioLegend | Cat# 311406 | Conjugated to phycoerythrin for flow cytometry Dilution factor 2 µl in 100 µl final volume |
| Chemical compound, drug | Please see Supplementary file 1 for complete list of all biologically active chemical compounds used in this study | Please see Supplementary file 1 for complete list of all biologically active chemical compounds used in this study | Please see Supplementary file 1 for complete list of all biologically active chemical compounds used in this study | Please see Supplementary file 1 for complete list of all biologically active chemical compounds used in this study |
| Gene (H. sapiens) | Please see Supplementary file 2 for complete list of all genes mentioned in this study | Please see Supplementary file 2 for complete list of all genes mentioned in this study | Please see Supplementary file 2 for complete list of all genes mentioned in this study | Please see Supplementary file 2 for complete list of all genes mentioned in this study |
| Gene (M. musculus) | Please see Supplementary file 2 for complete list of all genes mentioned in this study | Please see Supplementary file 2 for complete list of all genes mentioned in this study | Please see Supplementary file 2 for complete list of all genes mentioned in this study | |
| Sequence-based reagent: RT-qPCR primer sets (H. sapiens) | Please see Supplementary file 2 for complete list of all primer sets used in this study | Please see Supplementary file 2 for complete list of all genes mentioned in this study | Please see Supplementary file 2 for complete list of all primer sets used in this study | Please see Supplementary file 2 for complete list of all primer sets used in this study |
Additional files
-
Supplementary file 1
Table listing the name, manufacturer, and catalog number of all small molecules used in this study.
The concentration of each agent that was used for Figure 2F is also listed.
- https://cdn.elifesciences.org/articles/87292/elife-87292-supp1-v1.xlsx
-
Supplementary file 2
Table listing the gene symbol and NCBI gene ID for each gene that was named in this this article.
For genes that were assayed by RT-qPCR, forward and reverse primer sequences are listed. ‘N/A’ indicates that primer sequence is not applicable because that gene was not assayed by RT-qPCR in this study.
- https://cdn.elifesciences.org/articles/87292/elife-87292-supp2-v1.xlsx
-
MDAR checklist
- https://cdn.elifesciences.org/articles/87292/elife-87292-mdarchecklist1-v1.docx
Download links
A two-part list of links to download the article, or parts of the article, in various formats.
Downloads (link to download the article as PDF)
Open citations (links to open the citations from this article in various online reference manager services)
Cite this article (links to download the citations from this article in formats compatible with various reference manager tools)
DHODH inhibition enhances the efficacy of immune checkpoint blockade by increasing cancer cell antigen presentation
eLife 12:RP87292.
https://doi.org/10.7554/eLife.87292.3


