Primaquine in glucose-6-phosphate dehydrogenase deficiency: an adaptive pharmacometric assessment of ascending dose regimens in healthy volunteers
- Clinical Therapeutics Unit, Faculty of Tropical Medicine, Mahidol University, Thailand
- Mahidol Oxford Tropical Medicine Research Unit, Faculty of Tropical Medicine, Mahidol University, Thailand
- Oxford University Clinical Research Unit, Hospital for Tropical Diseases, Viet Nam
- Centre for Tropical Medicine and Global Health, Nuffield Department of Medicine, University of Oxford, United Kingdom
- Shoklo Malaria Research Unit, Thailand
- Department of Molecular Tropical Medicine and Genetics, Faculty of Tropical Medicine, Mahidol University, Thailand
Figures
Figure 1
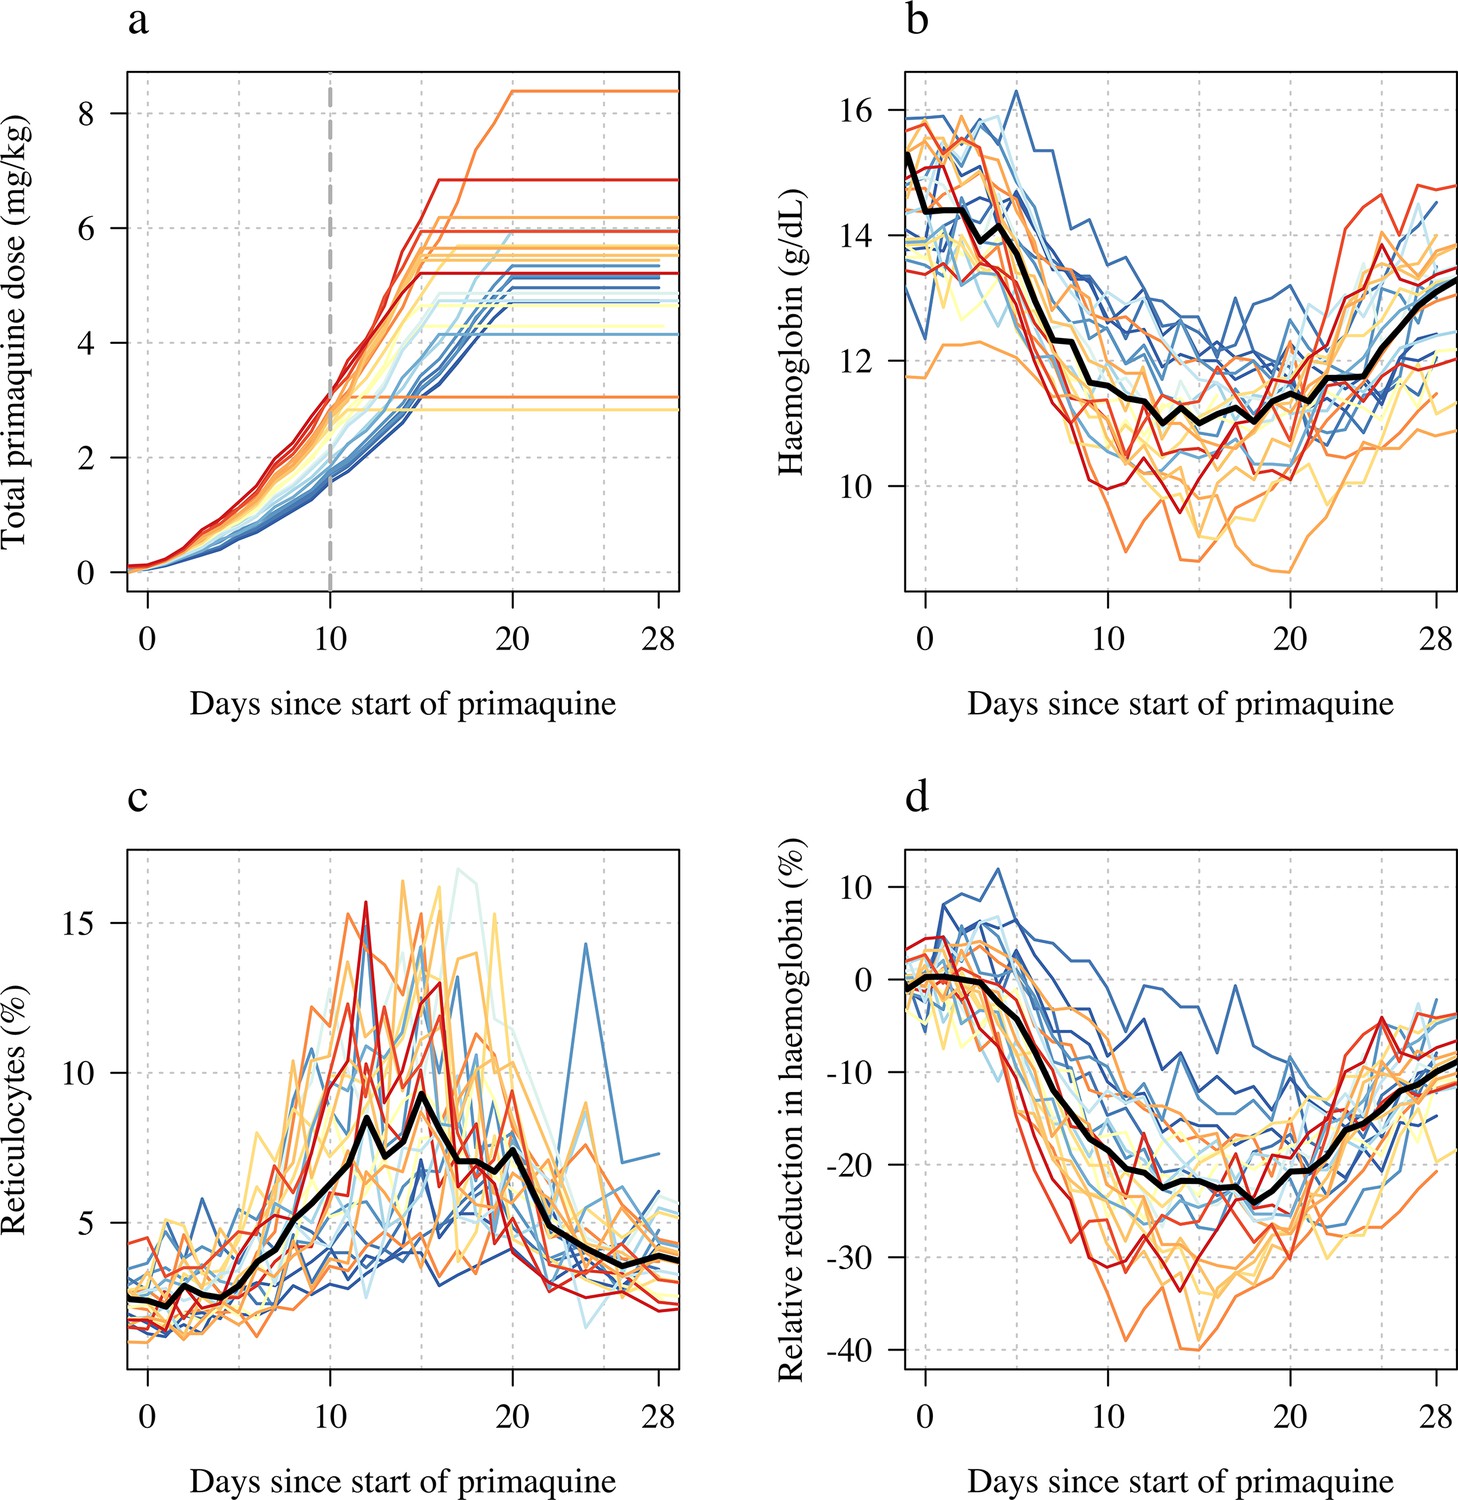
Ascending dose study in 23 male hemizygote glucose-6-phosphate dehydrogenase (G6PD)-deficient healthy volunteers included in the primary analysis.
Colours from blue to red are in order of increasing day 10 total cumulative primaquine dose as shown in panel a (cumulative primaquine doses over time). Panels b and c show the absolute haemoglobin values and reticulocyte counts over time; panel d shows the relative change from baseline in haemoglobin over time. The thick black lines in panels b–d show the daily median values.
Figure 2
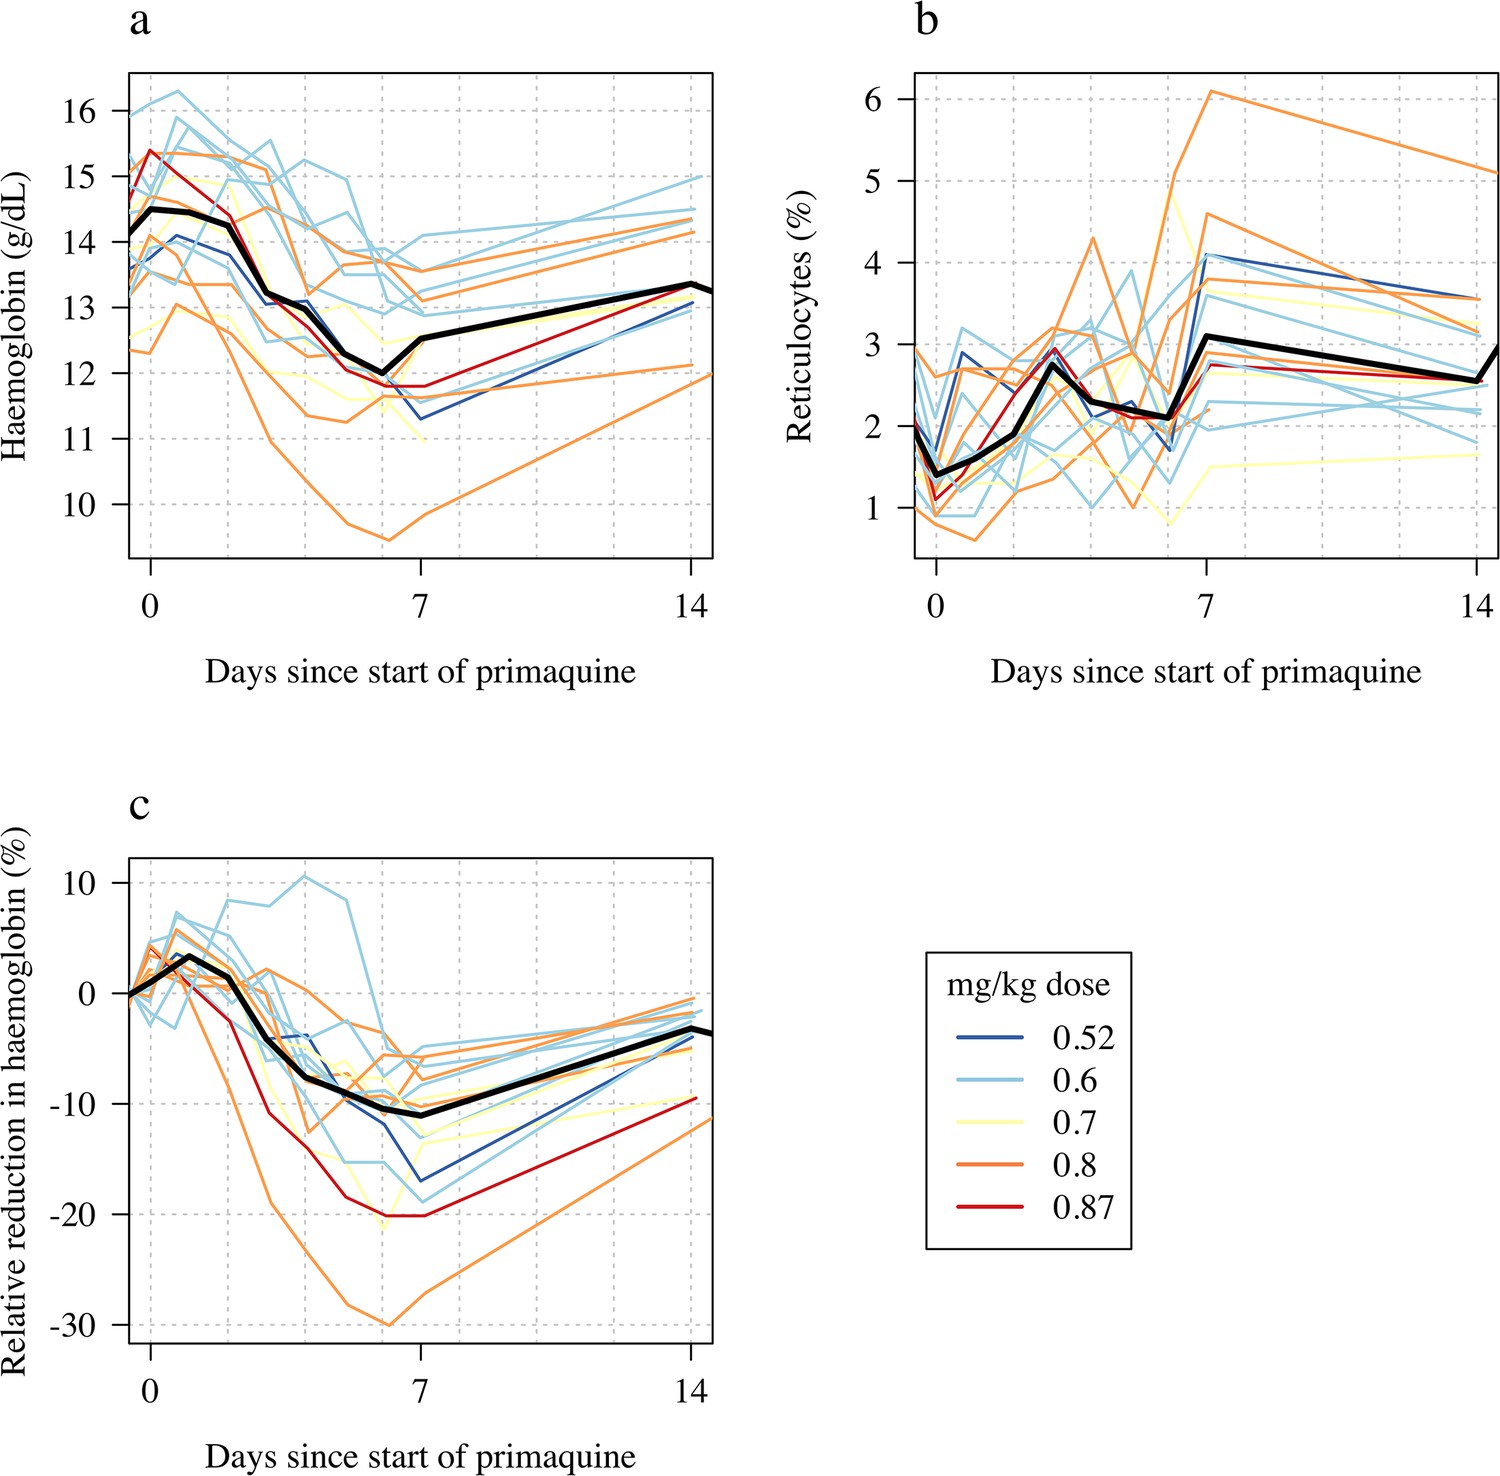
Haemolytic effect of 45 mg single primaquine dose in 16 male hemizygote glucose-6-phosphate dehydrogenase (G6PD)-deficient healthy volunteers.
Colours from blue to red are in order of increasing mg/kg dose. Panel a: absolute haemoglobin values; panel b: reticulocyte counts; panel c: relative change in haemoglobin from baseline. The thick black lines in panels a–c show the daily median values.
Figure 3

Comparing the haemolytic effect of ascending dose primaquine regimens (dark blue triangles) and the single 45 mg primaquine dose (pink circles).
Panels a-b show the relationship between the total cumulative dose of primaquine given to each subject in each study (x-axis) and the absolute fall in haemoglobin concentration (panel a) or the relative fall (panel b). Subjects who participated in both parts are joined by the light grey dashed lines. The horizontal dashed lines show the median falls by sub-study. Panels c-d show the daily observed changes in haemoglobin (c: Part 1; d: Part 2), the red line shows the daily median change.
Figure 4
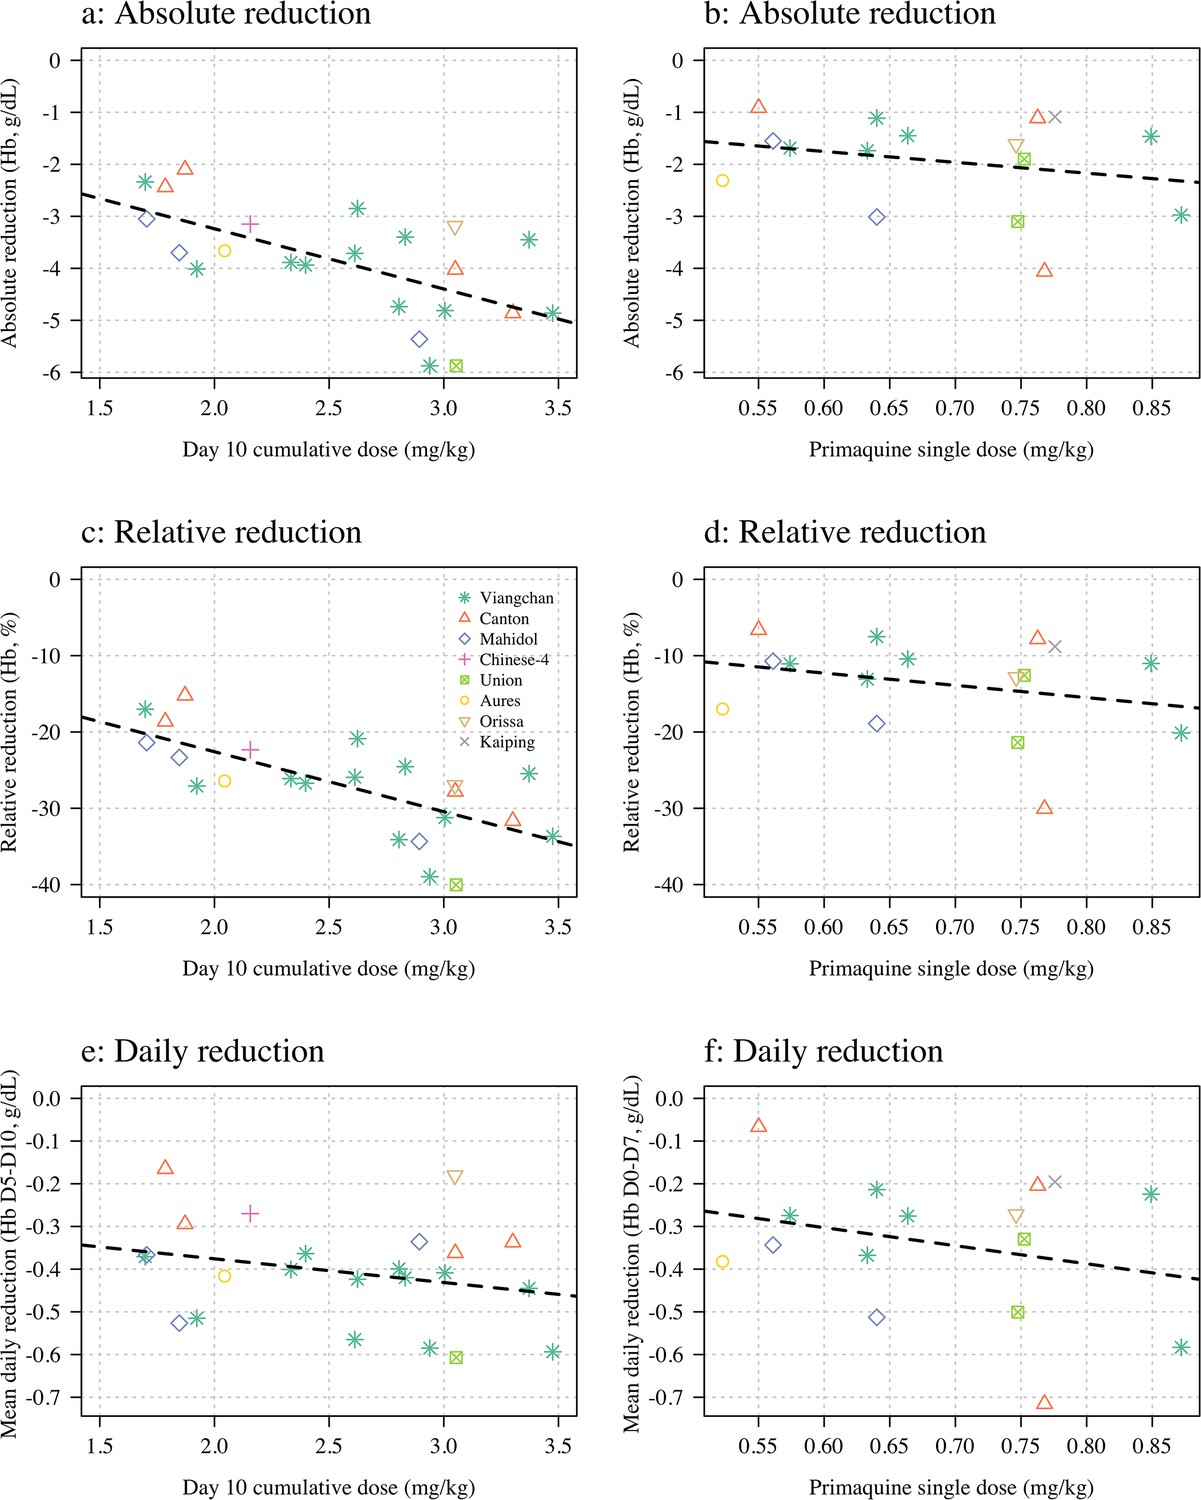
Haemolysis dose-response relationships (panels a, c and e correspond to Part 1; panels b, d, and f to Part 2).
Three pre-specified outcome variables are shown: the maximum absolute reduction in haemoglobin (panels a & b); the maximum relative reduction (panels c & d); and the mean daily reduction between days 5 and 10 (panels e & f). The dose exposure summary in Part 1 is the day 10 cumulative primaquine dose (n=23); for Part 2 it is the mg/kg single dose (n=16). Hb: haemoglobin.
Figure 5
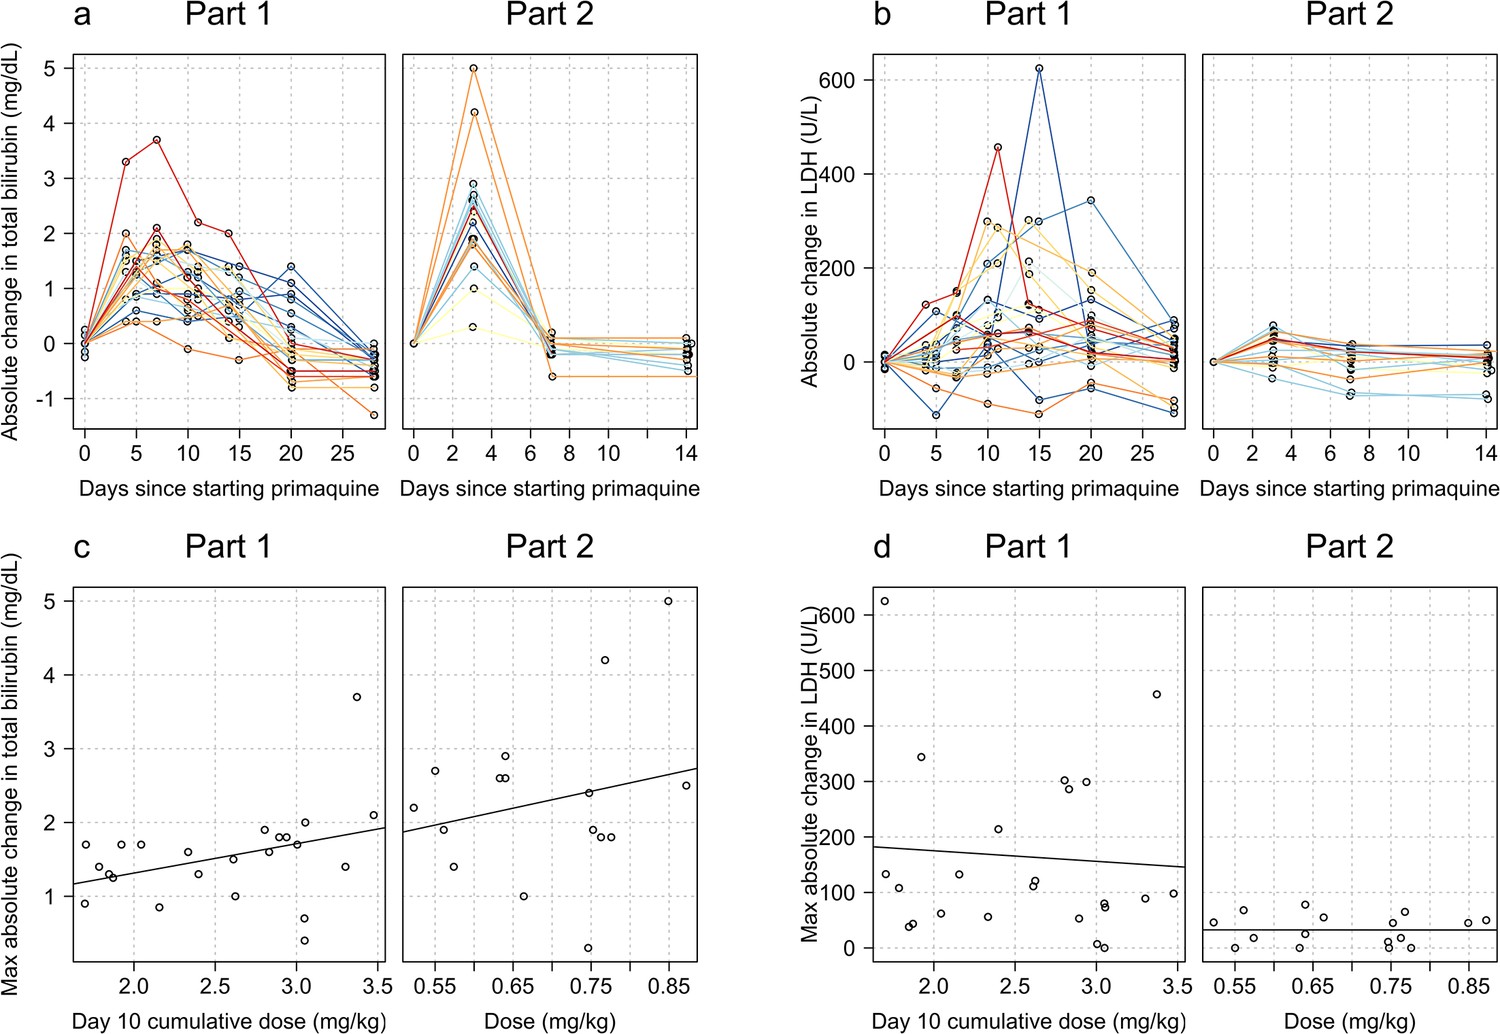
Relationship between primaquine dose (Part 1: day 10 cumulative mg/kg dose; Part 2: mg/kg single dose) and total plasma bilirubin (panels a and c) and lactate dehydrogenase (LDH) concentrations (panels b and d).
The top rows show the normalised data; the bottom rows the dose-response relationship with the maximum normalised increases.
Figure 6
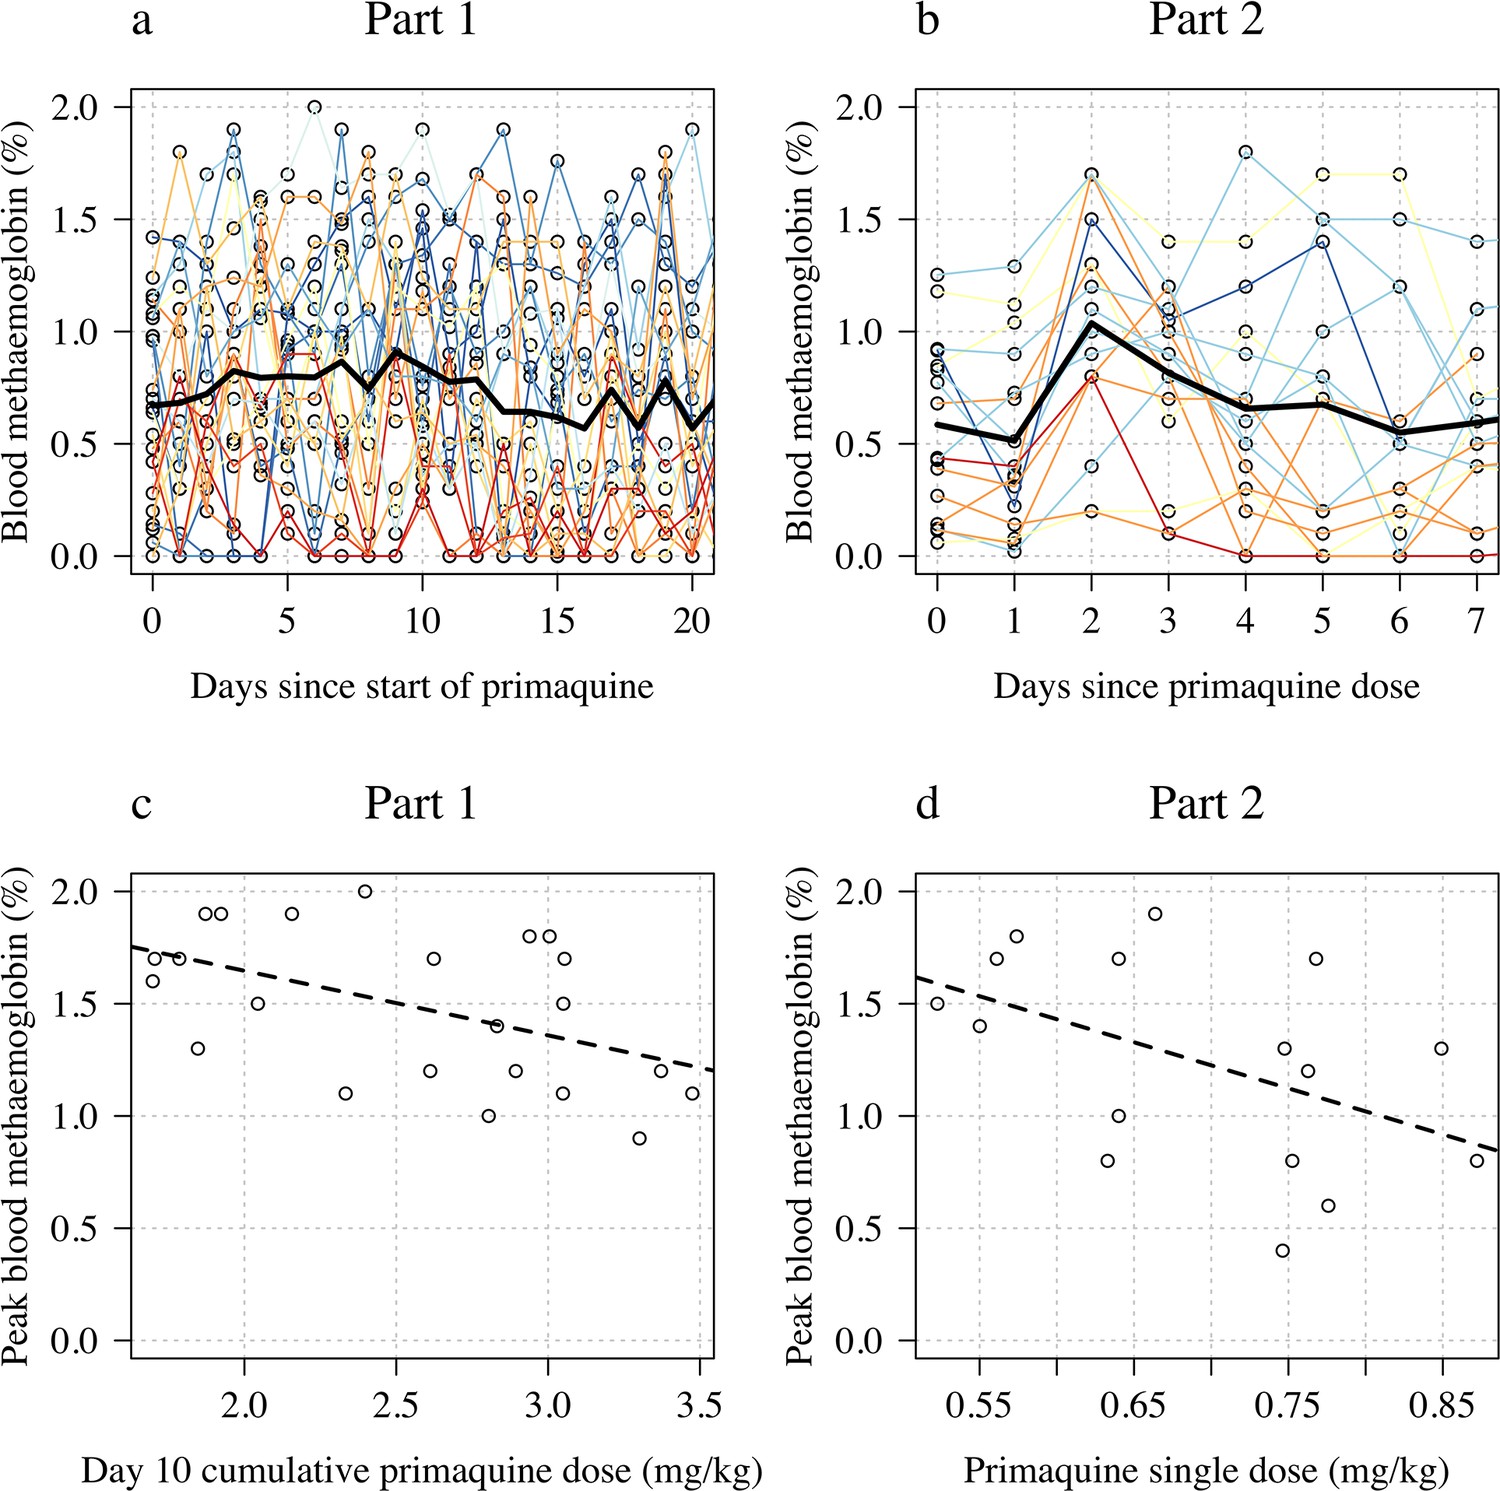
Changes in blood methaemoglobin concentration.
Top row: individual data (panel a: Part 1; panel b: Part 2) with the daily mean value shown by the thick black line. Bottom row: relationship between dose (panel c: Part 1 summarised by the day 10 total dose; panel d: Part 2 summarised by the mg/kg dose) and peak observed blood methaemoglobin (%).
Appendix 2—figure 1
Rules for determining the primaquine regimen in the next cohort of five subjects.
These pre-specified rules were for guidance only and were not binding as participant safety was the primary concern.
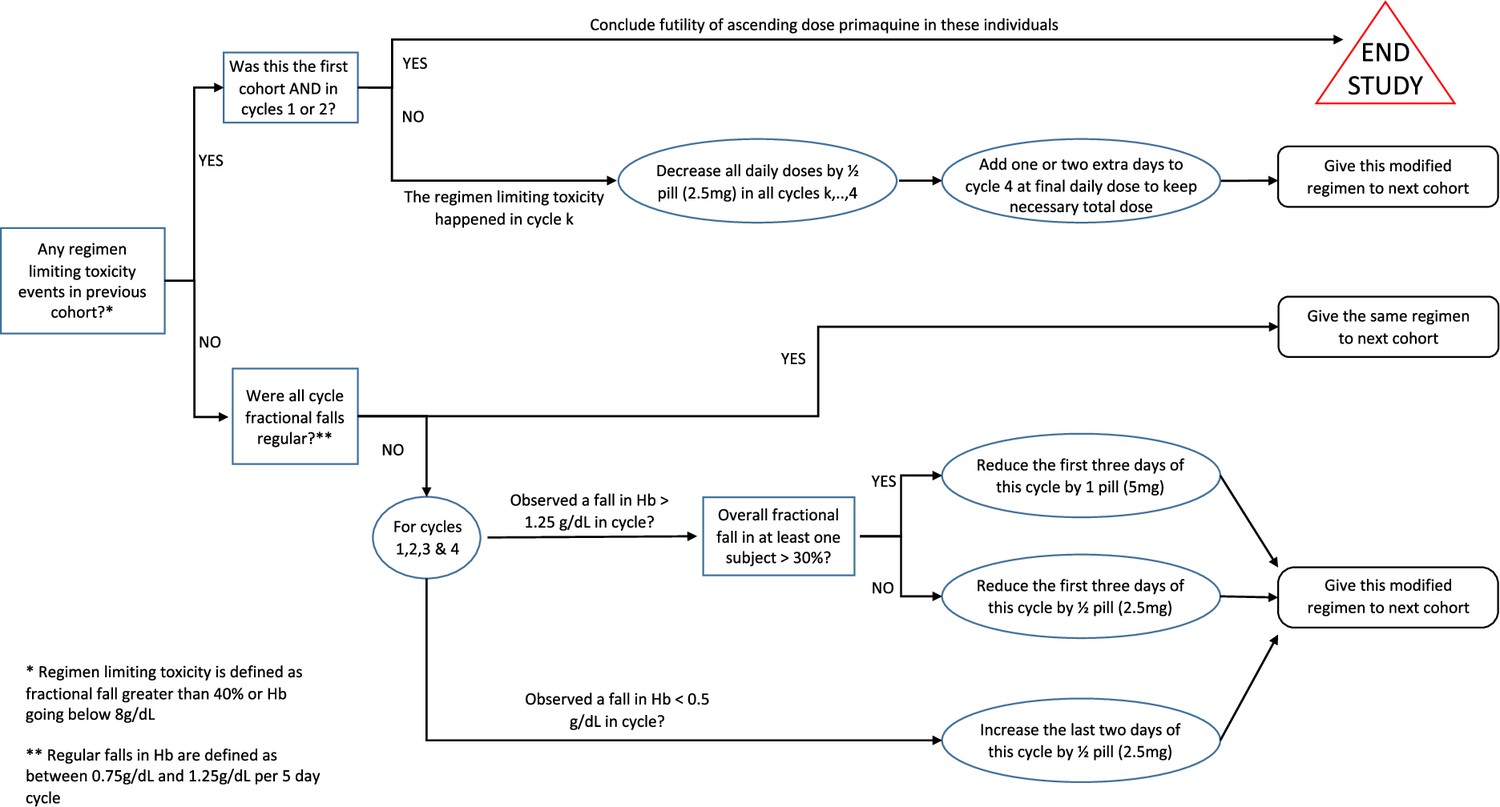
Appendix 2—figure 2

Rules for increasing primaquine dose for each subject.
Each cycle was between 3 and 5 days, and doses were increased across the successive cycles. Each subject progressed to the next cycle (i.e. higher dose) only if they had a haemoglobin >70% of their baseline value (i.e. <30% relative decrease). Primaquine was stopped if the haemoglobin went under 40% of the baseline value.
Appendix 4—figure 1
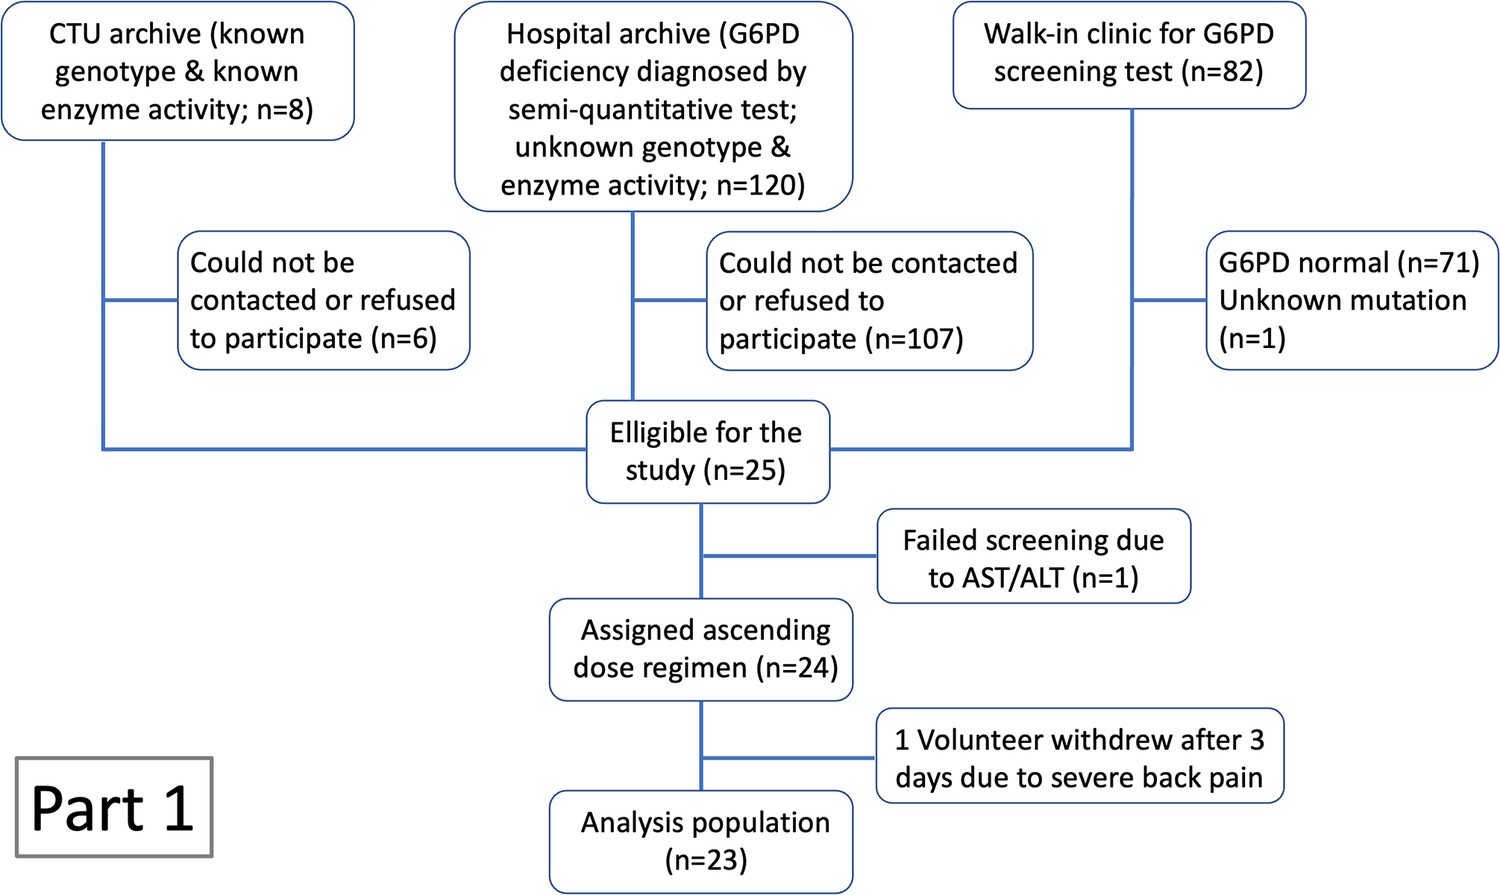
CONSORT diagram for Part 1 of the study.
Appendix 4—figure 2
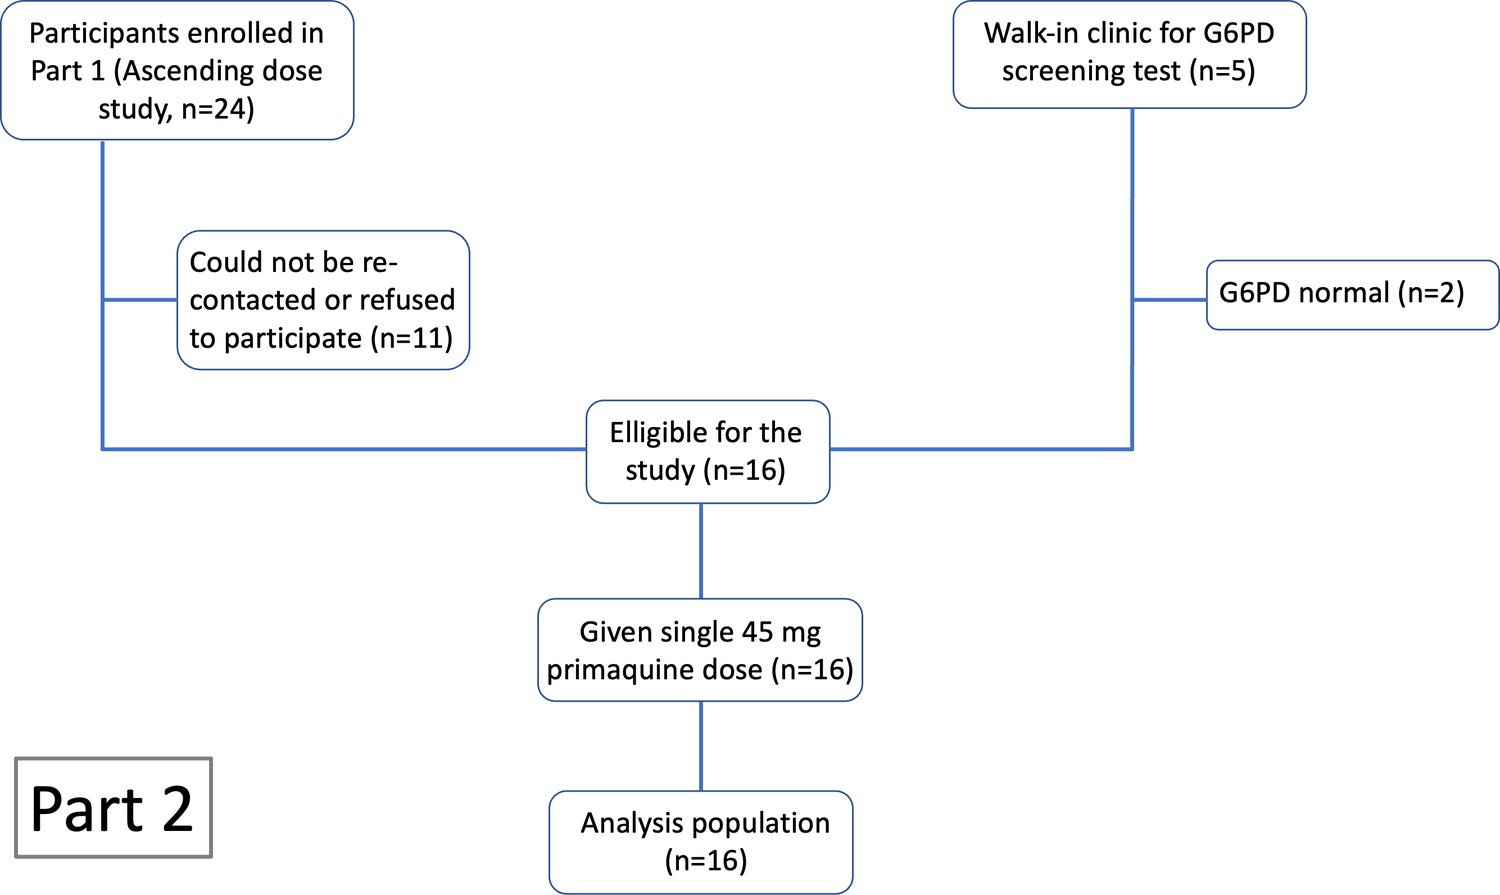
CONSORT diagram for Part 2 of the study.
Appendix 5—figure 1
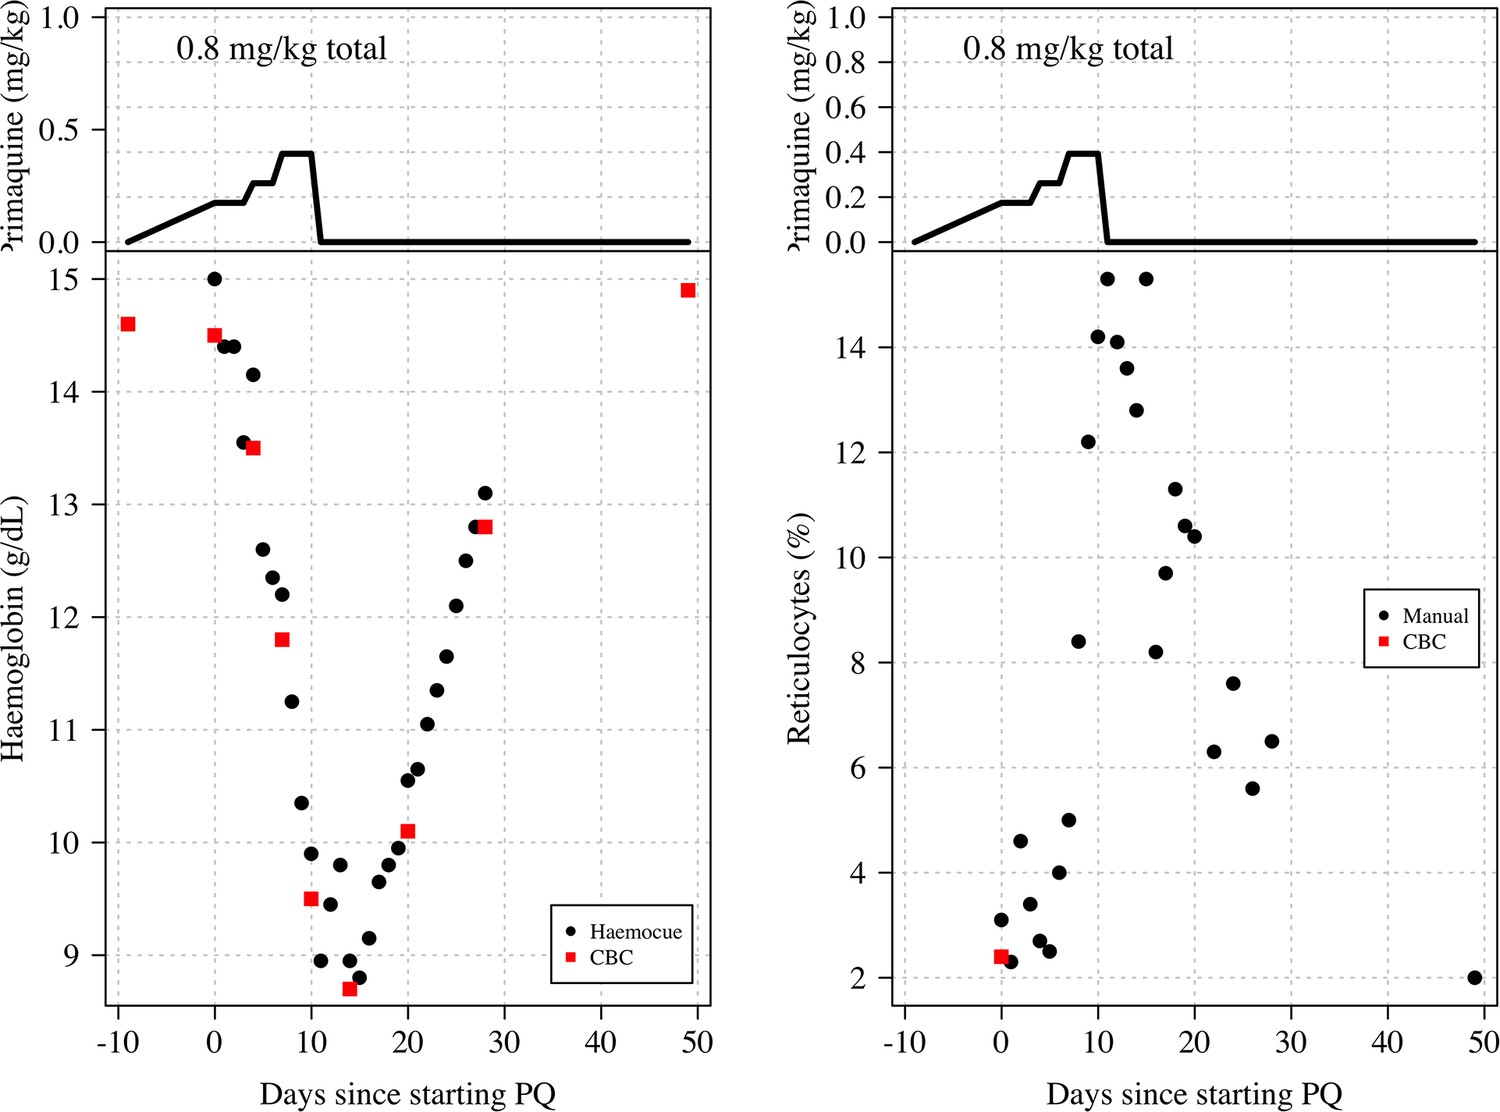
Haemoglobin and reticulocyte data from subject 11 who was stopped because he met the study withdrawal stopping rule.
The top panels show the dose of primaquine given each day; the bottom panels show the observed haemoglobin measurements (left) and reticulocyte counts (right). Black circles: haemocue and manual reticulocyte counts; red squares: complete blood count (CBC) haemoglobin and reticulocyte counts.
Appendix 5—figure 2

Day 10 urine sample from subject 11 showing slight haemoglobinuria (Hillmen score of 4).
The subject‘s maximum Hillmen score on days 4–9 varied between 2 and 3 .
Appendix 6—figure 1
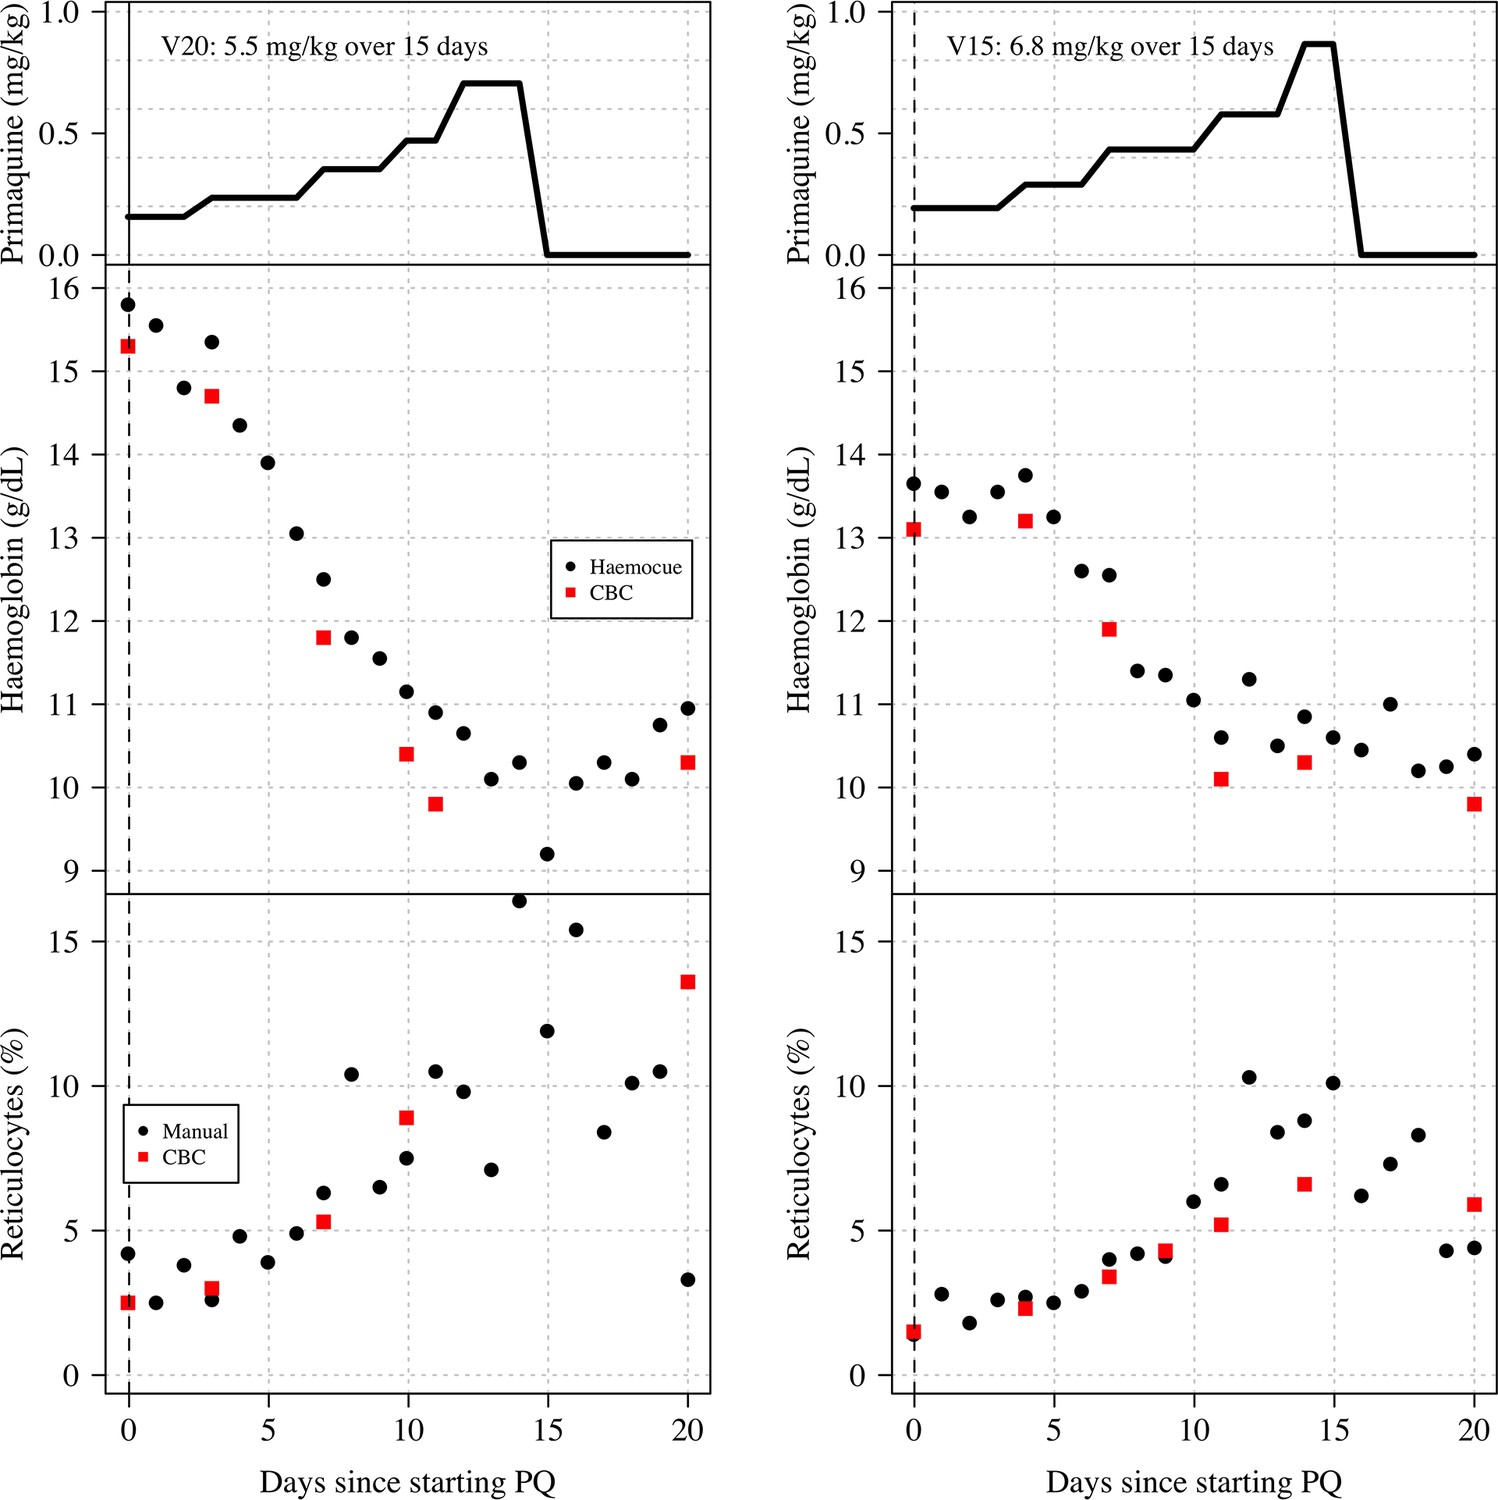
Haemoglobin and reticulocyte data from two subjects (left: V15; right: V20) who both had the Viangchan variant (871G>A).
Both received very similar ascending dose regimens which are shown in the top panels (mg/kg primaquine daily dose); the middle panels show the observed haemoglobin measurements; the bottom panels show the reticulocyte counts. Black circles: haemocue and manual reticulocyte counts; red squares: complete blood count (CBC) haemoglobin and reticulocyte counts.
Appendix 7—figure 1

The relationship between the reduction in haemoglobin from the previous day and the normalised absolute increase in total bilirubin.
Black: Part 1; red: Part 2. Each subject has two datapoints corresponding to when the total bilirubin was measured (days 5 and 10 for Part 1; days 3 and 7 for Part 2). The relationship is significant for Part 2 (p=0.003), not significant for Part 1 (p=0.2).
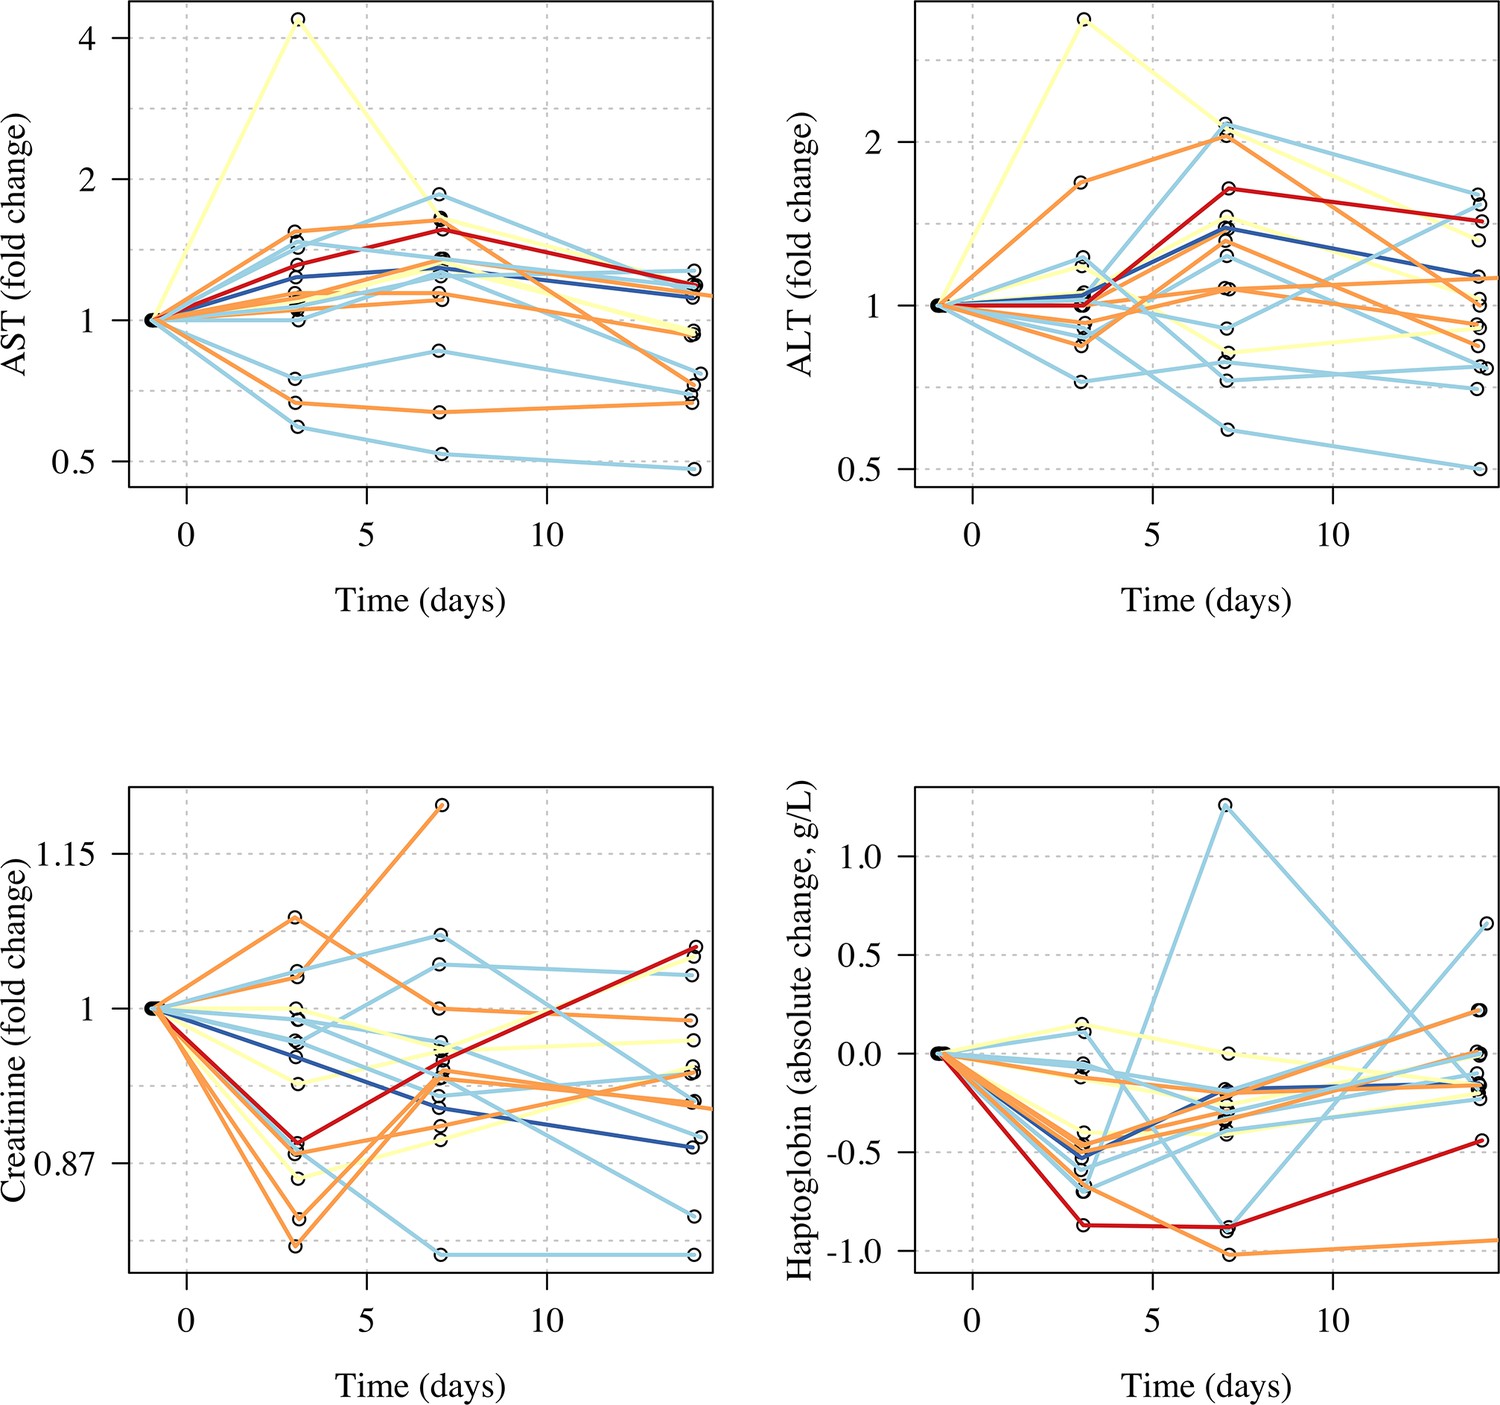
Appendix 8—figure 1
Normalised changes in the plasma concentrations of transaminases, haptoglobin, and creatinine during the ascending dose regimen.
Colours correspond to the day 10 cumulative dose (as in Figure 1 in main text). The numbers in the top panels highlight the data from subjects 7, 11, and 14 who had substantial raises in AST and ALT.
Appendix 8—figure 2

Normalised changes in the plasma concentrations of transaminases, haptoglobin, and creatinine during the single dose primaquine 45 mg study.
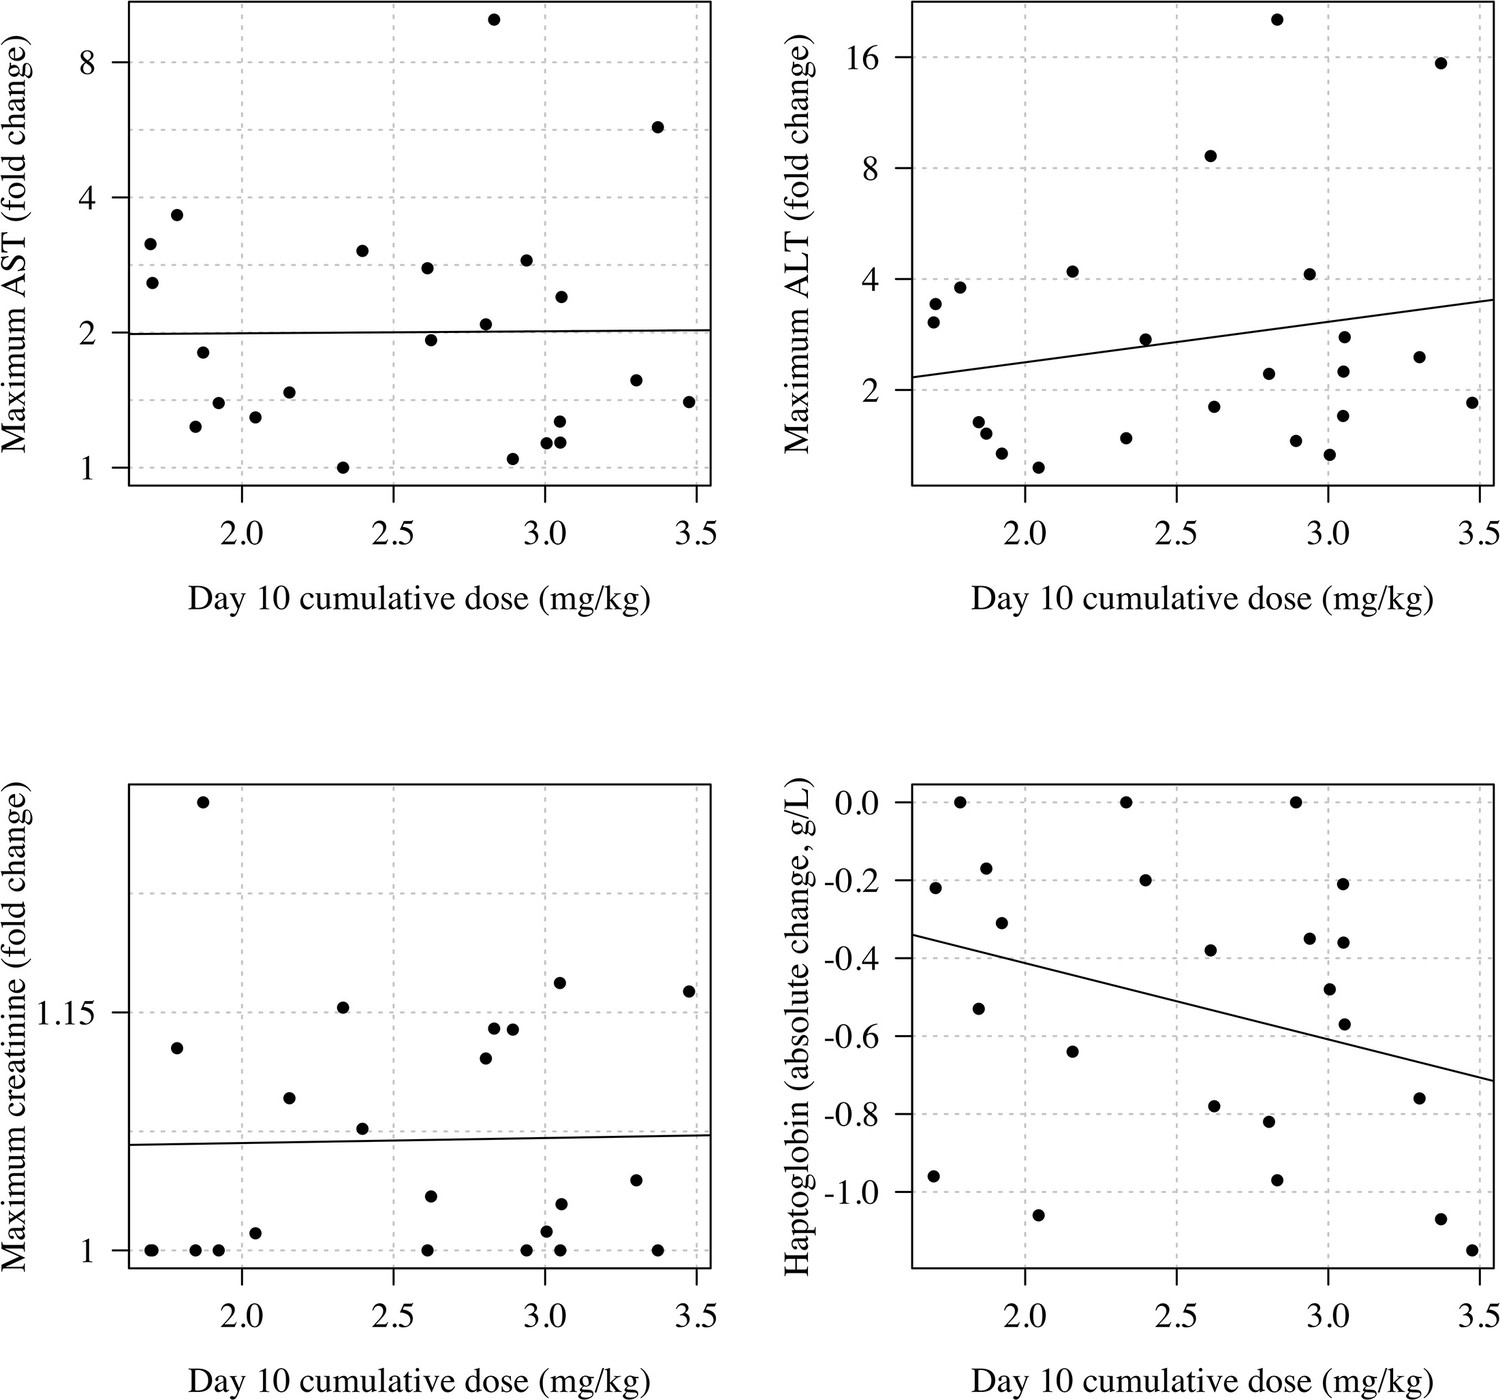
Appendix 8—figure 3
Relationship between the total cumulative dose of primaquine received by day 10 in the 23 volunteers who took ascending primaquine dose regimens and the maximum fold change increases in AST, ALT, and creatinine and the maximum absolute decrease in haptoglobin.
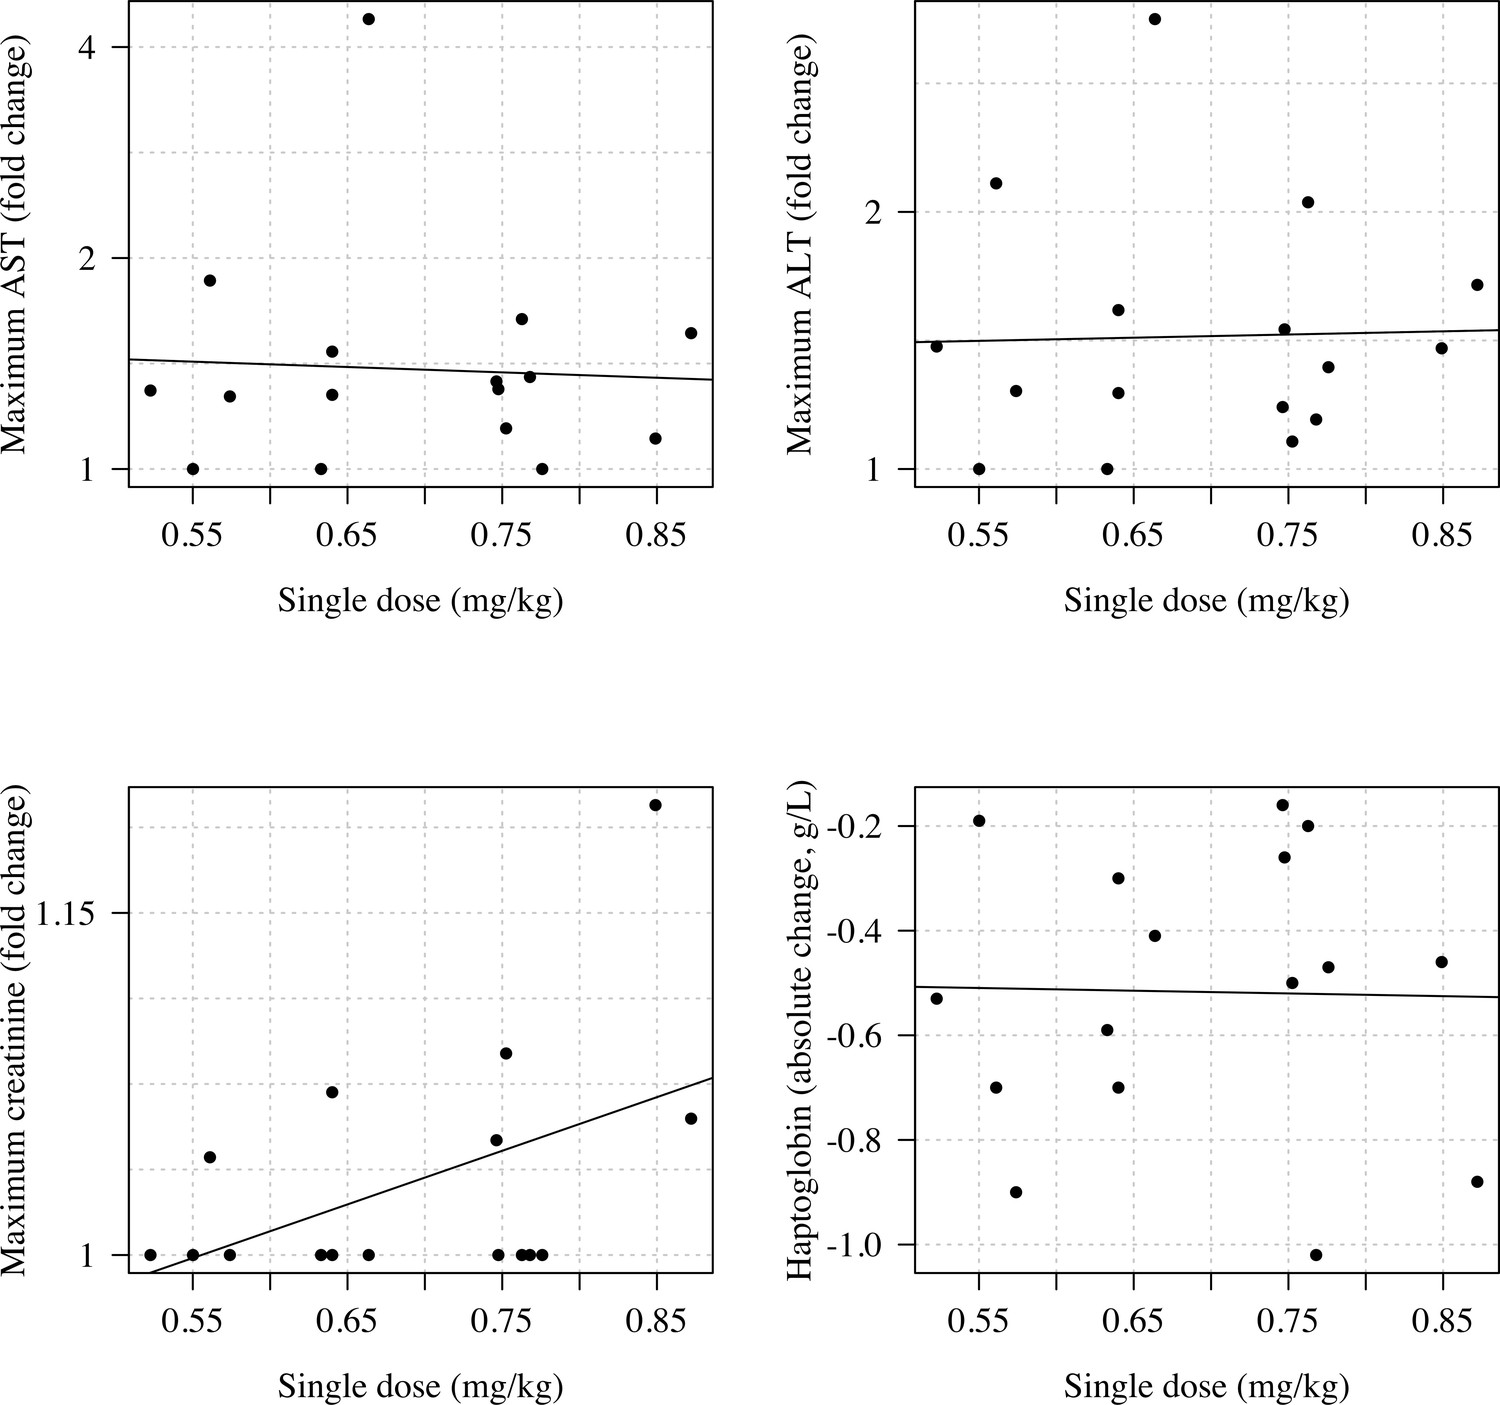
Appendix 8—figure 4
Relationship between the mg/kg single dose of primaquine received by the 16 volunteers and the maximum fold change increases in AST, ALT, and creatinine and the maximum absolute decrease in haptoglobin.
Appendix 9—figure 1
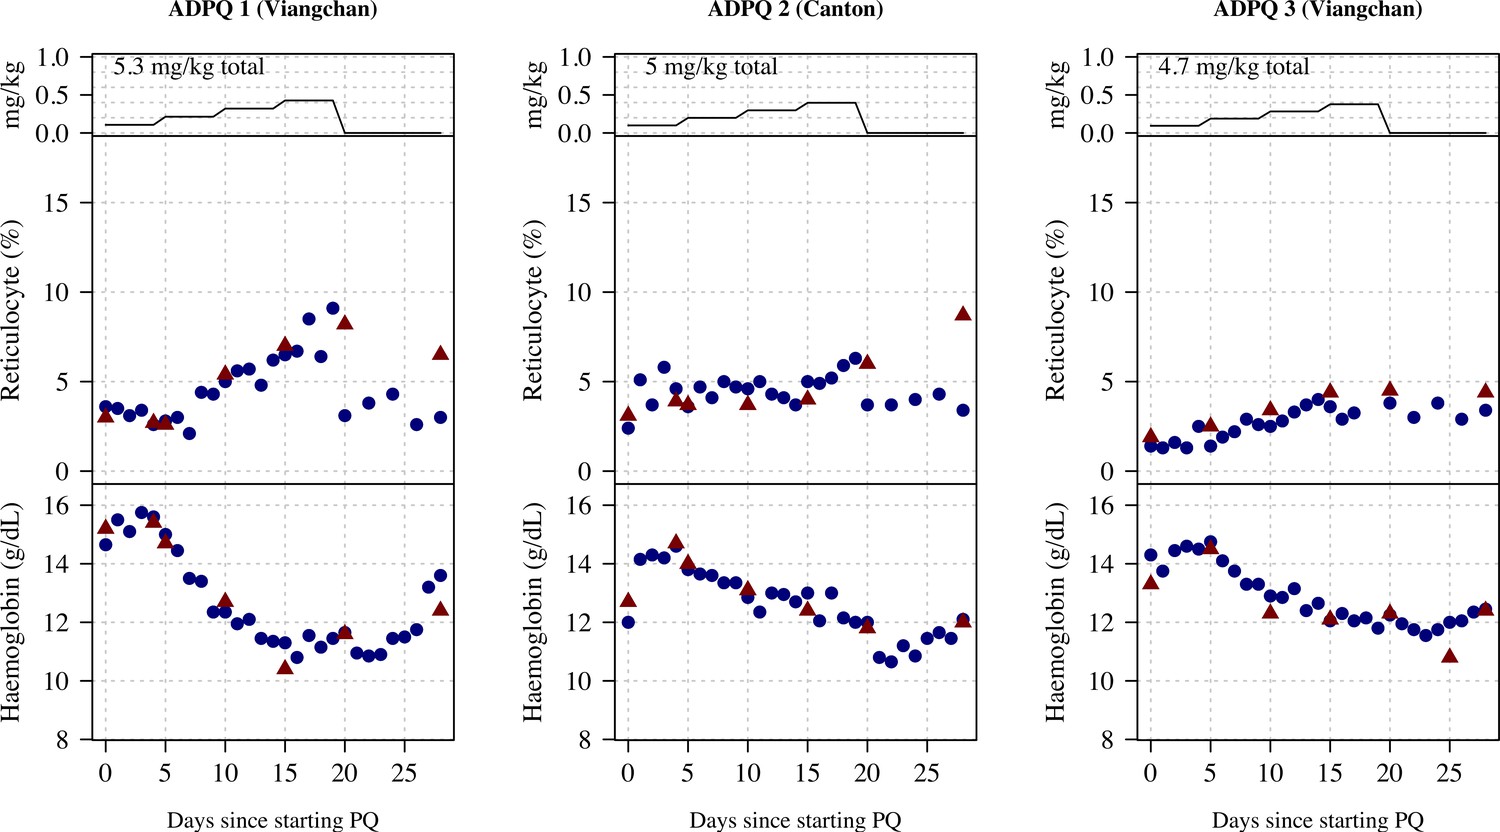
Ascending dose: haemoglobin and reticulocyte data over time for volunteers 1–3.
Blue shows the manual reticulocyte readings and haemocue value; red shows the complete blood count (CBC) values.
Appendix 9—figure 2
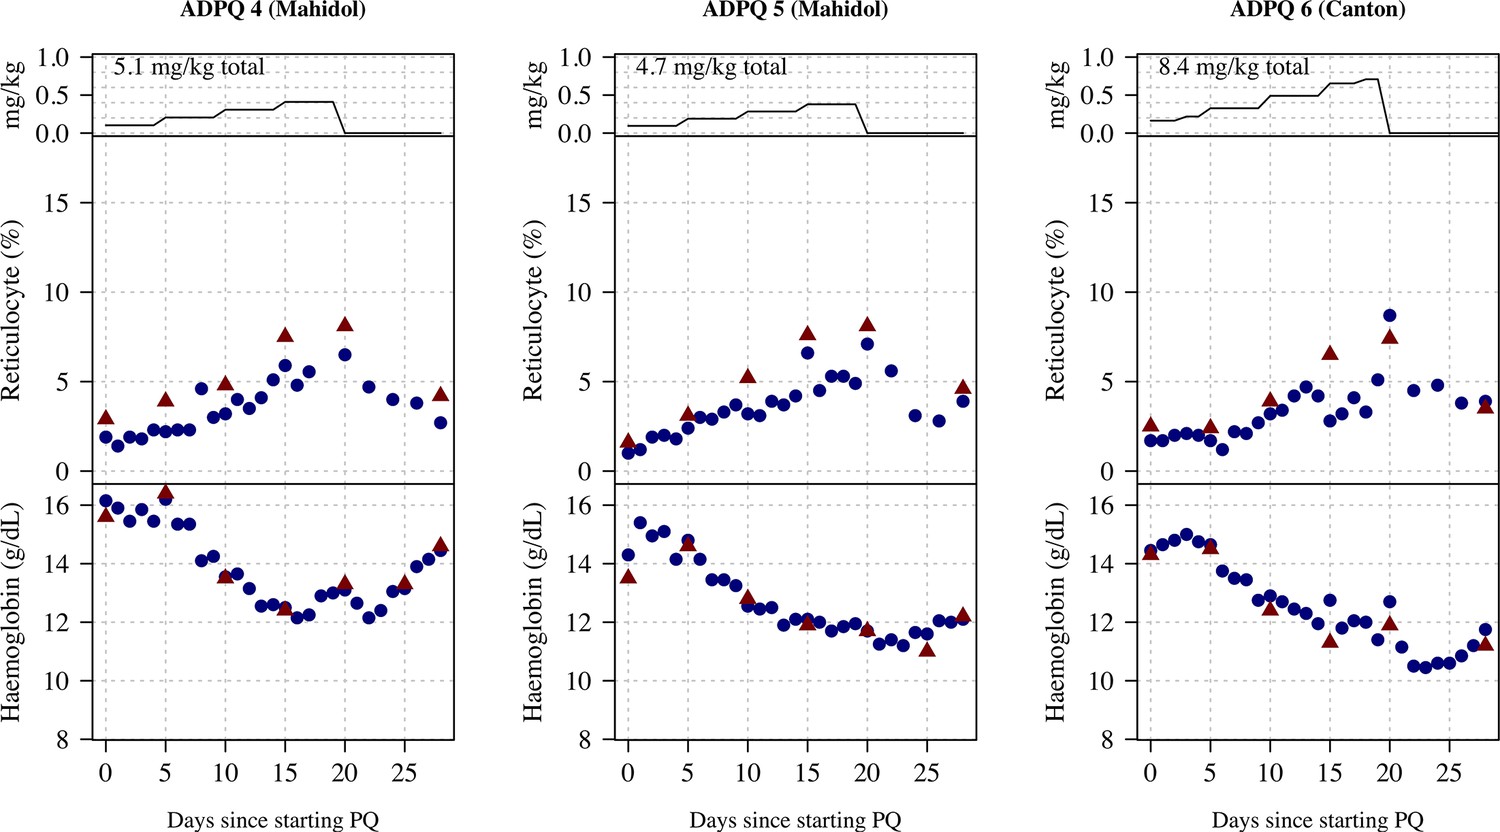
Ascending dose: haemoglobin and reticulocyte data over time for volunteers 4–6.
Blue shows the manual reticulocyte readings and haemocue value; red shows the complete blood count (CBC) values.
Appendix 9—figure 3
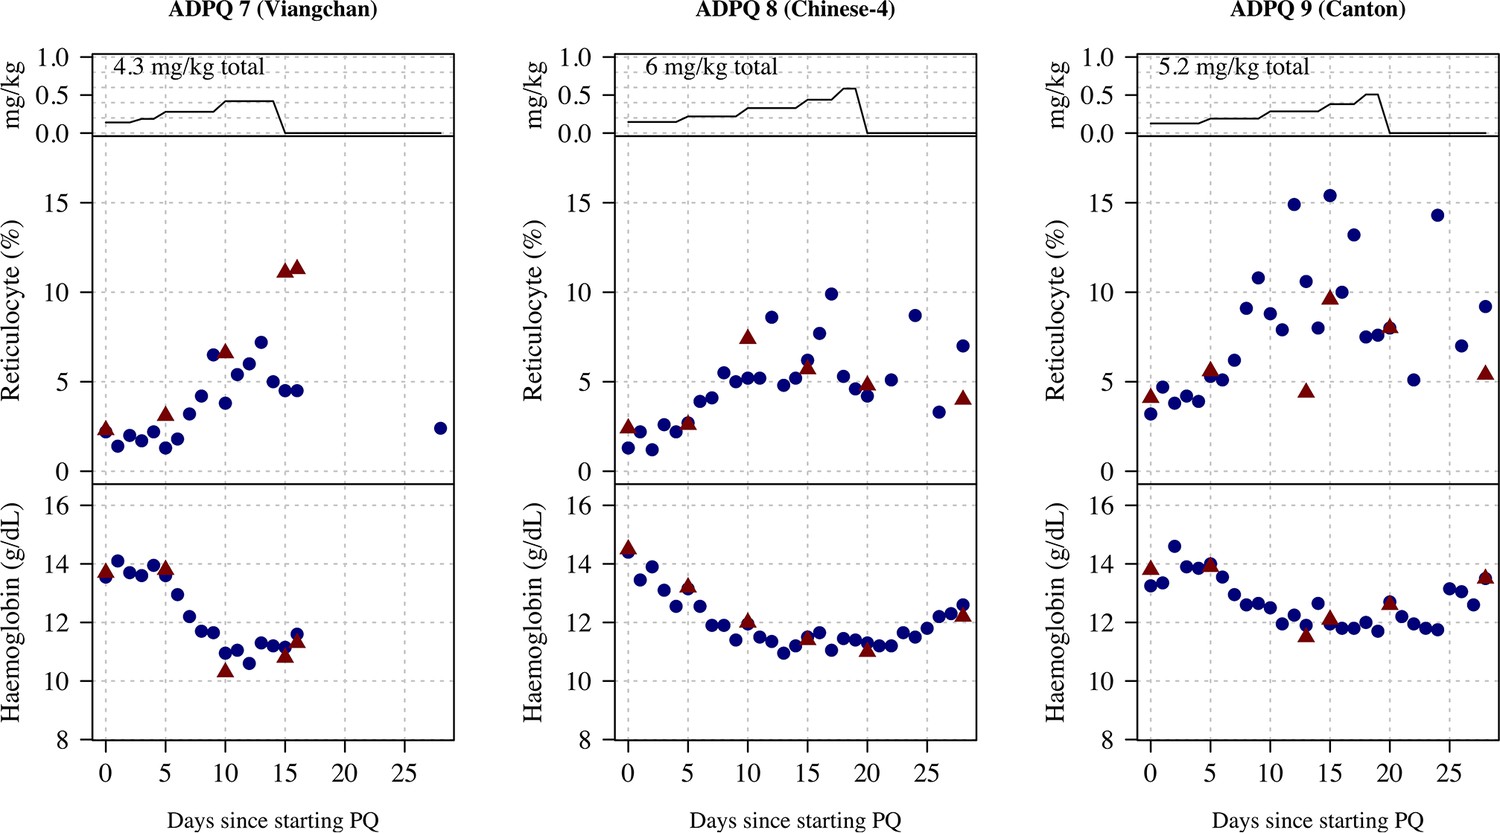
Ascending dose: haemoglobin and reticulocyte data over time for volunteers 7–9.
Blue shows the manual reticulocyte readings and haemocue value; red shows the complete blood count (CBC) values.
Appendix 9—figure 4
Ascending dose: haemoglobin and reticulocyte data over time for volunteers 10–12.
Blue shows the manual reticulocyte readings and haemocue value; red shows the complete blood count (CBC) values.
Appendix 9—figure 5
Ascending dose: haemoglobin and reticulocyte data over time for volunteers 13–15.
Blue shows the manual reticulocyte readings and haemocue value; red shows the complete blood count (CBC) values.
Appendix 9—figure 6

Ascending dose: haemoglobin and reticulocyte data over time for volunteers 16–17, 19.
Blue shows the manual reticulocyte readings and haemocue value; red shows the complete blood count (CBC) values.
Appendix 9—figure 7
Ascending dose: haemoglobin and reticulocyte data over time for volunteers 20–22.
Blue shows the manual reticulocyte readings and haemocue value; red shows the complete blood count (CBC) values.
Appendix 9—figure 8
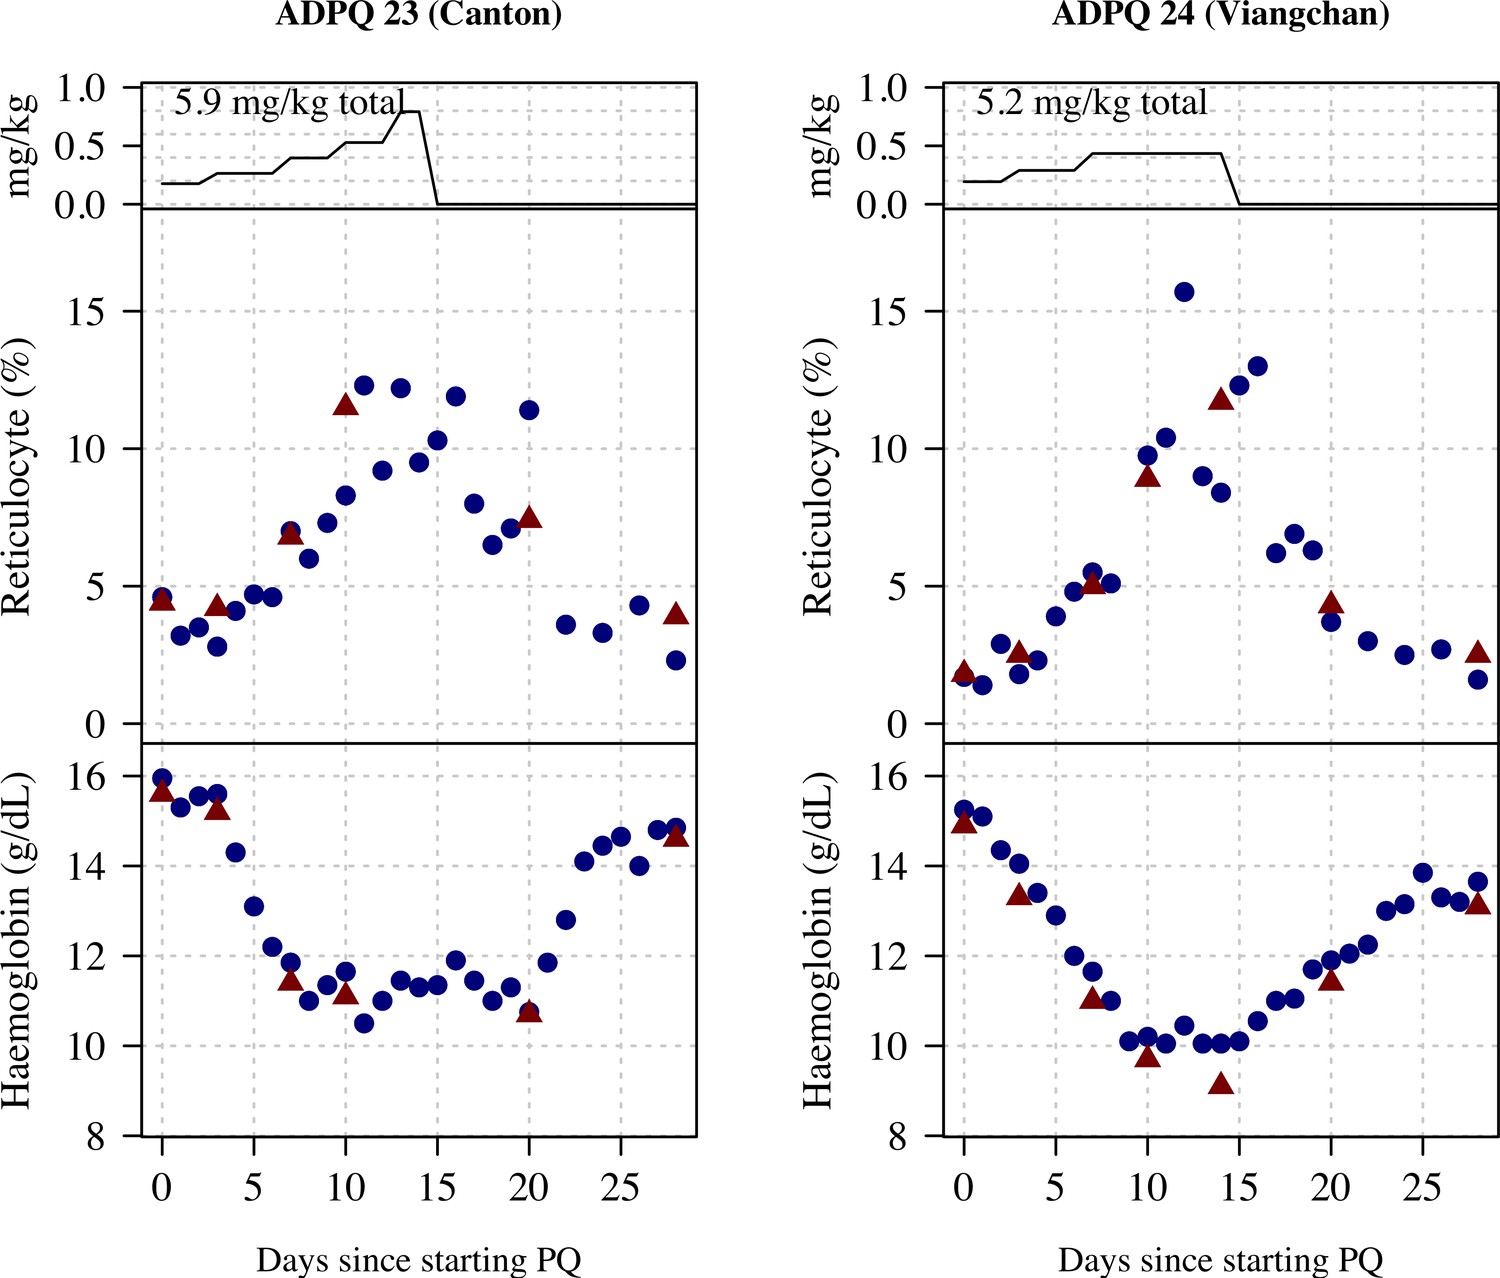
Ascending dose: haemoglobin and reticulocyte data over time for volunteers 23 and 24.
Blue shows the manual reticulocyte readings and haemocue value; red shows the complete blood count (CBC) values.
Appendix 9—figure 9
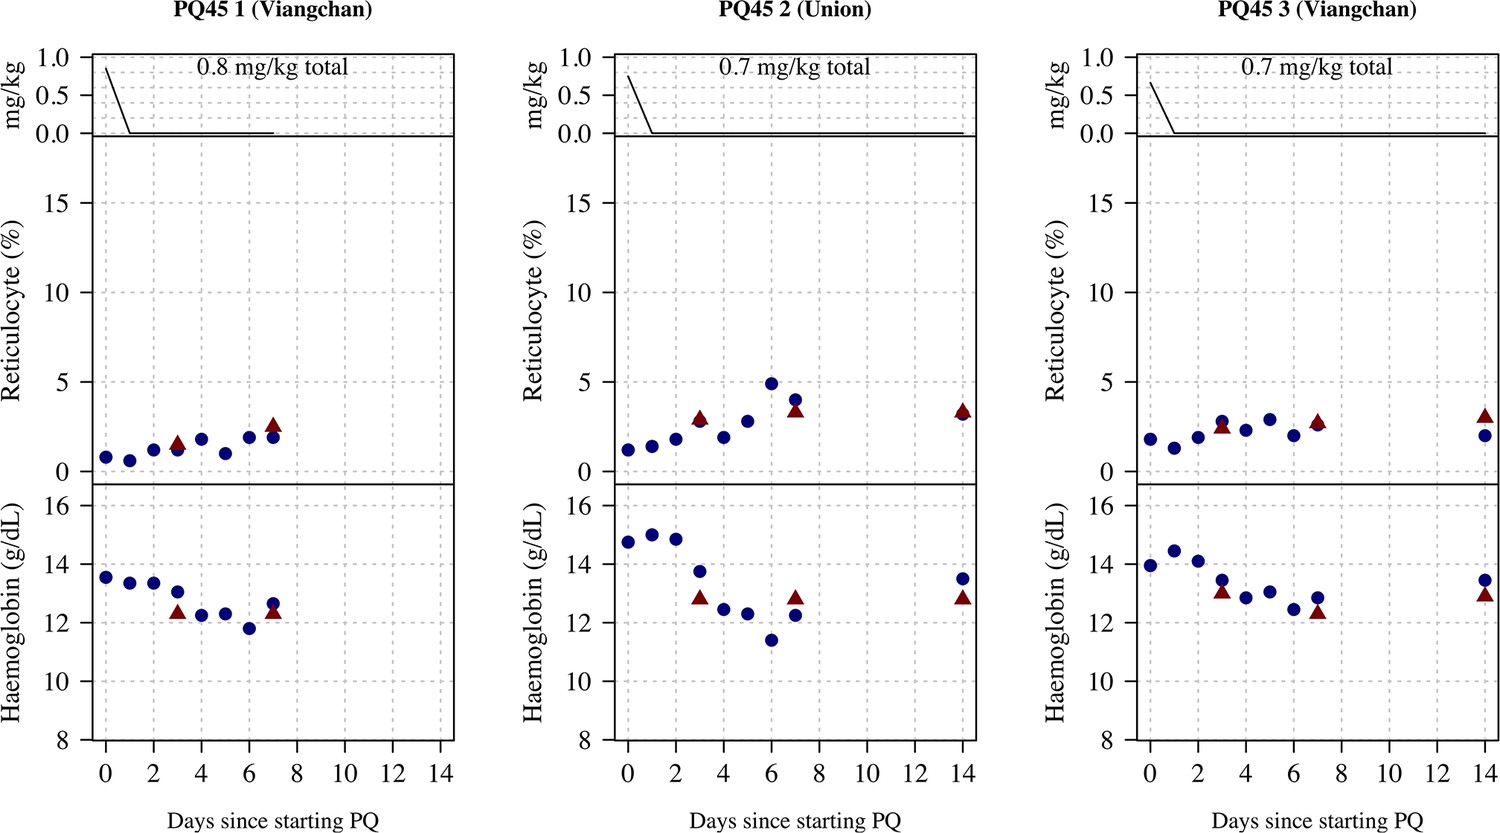
Ascending dose: haemoglobin and reticulocyte data over time for volunteers 1–3.
Blue shows the manual reticulocyte readings and haemocue value; red shows the complete blood count (CBC) values.
Appendix 9—figure 10
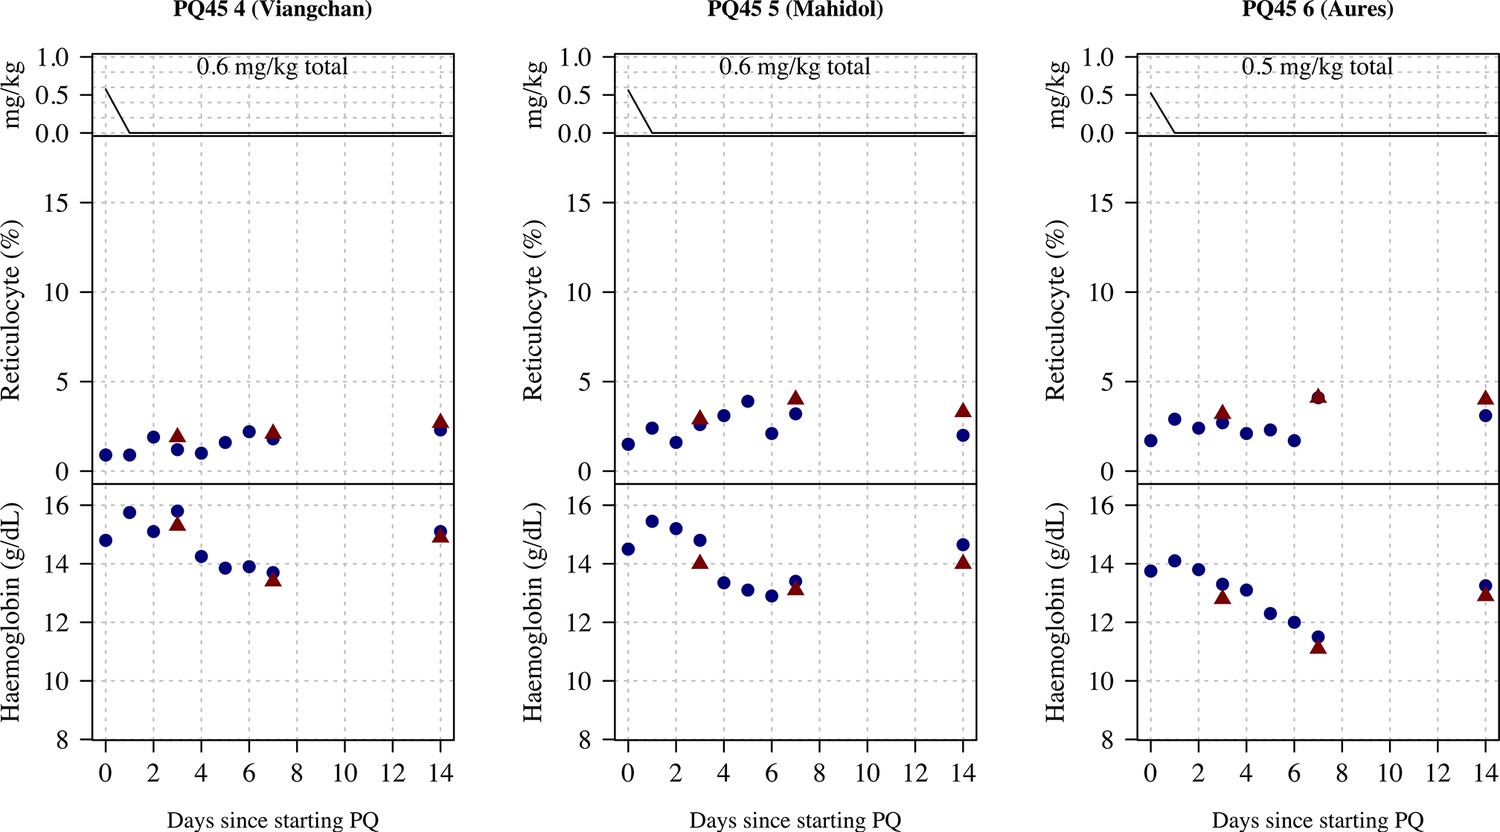
Ascending dose: haemoglobin and reticulocyte data over time for volunteers 4–6.
Blue shows the manual reticulocyte readings and haemocue value; red shows the complete blood count (CBC) values.
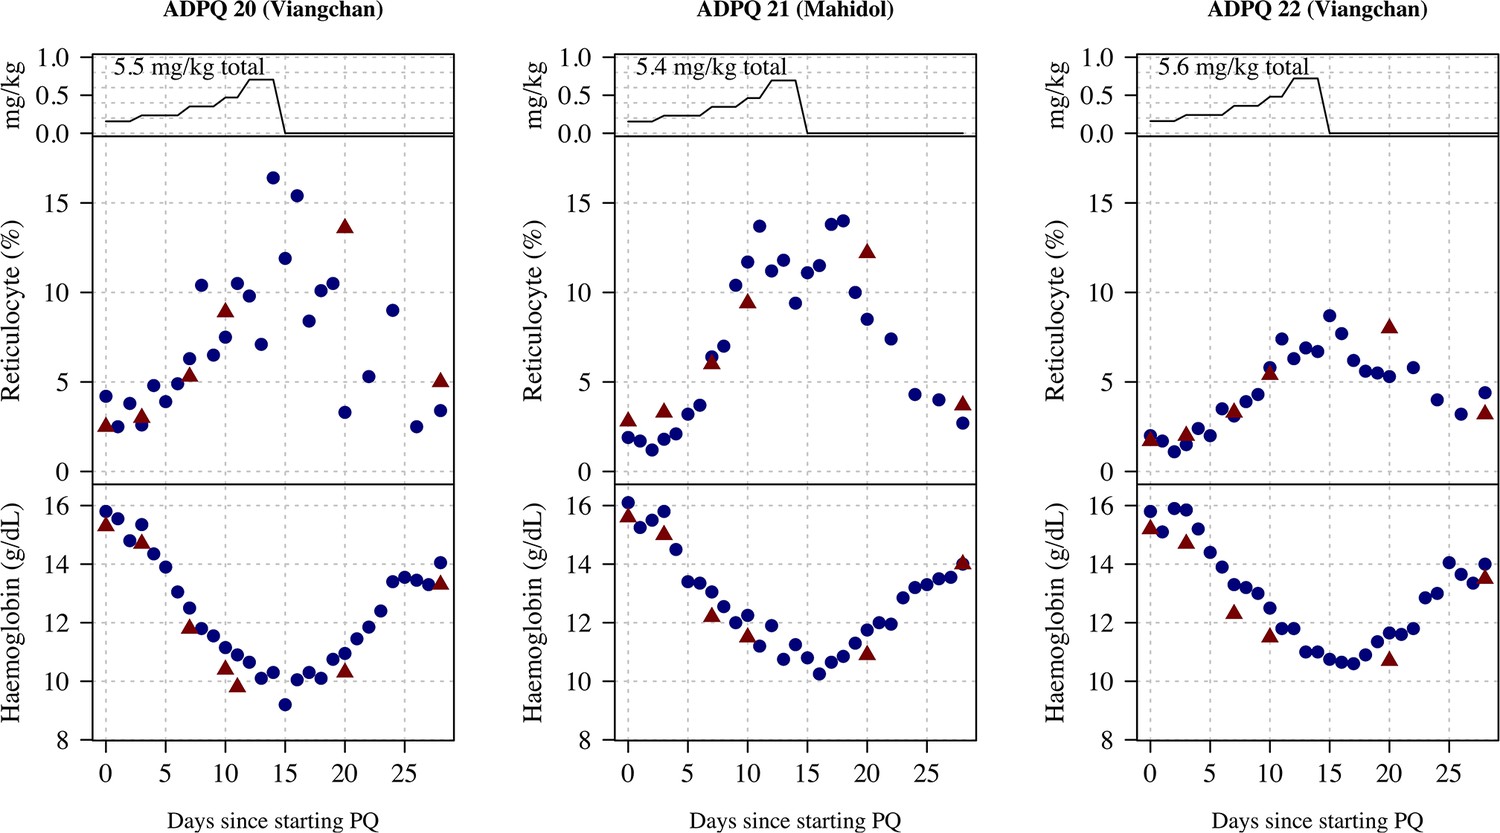
Appendix 9—figure 11
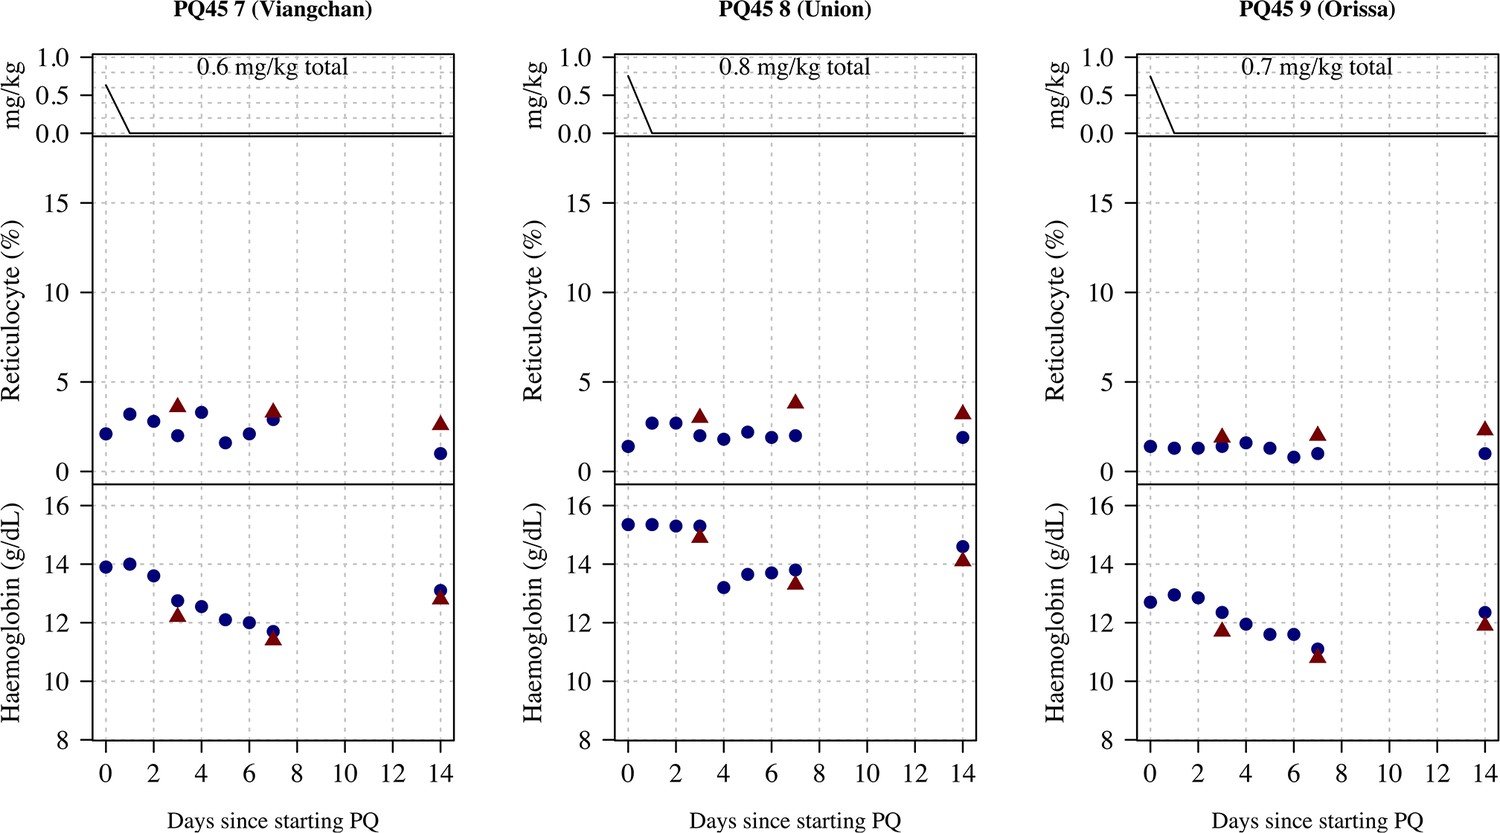
Ascending dose: haemoglobin and reticulocyte data over time for volunteers 7–9.
Blue shows the manual reticulocyte readings and haemocue value; red shows the complete blood count (CBC) values.
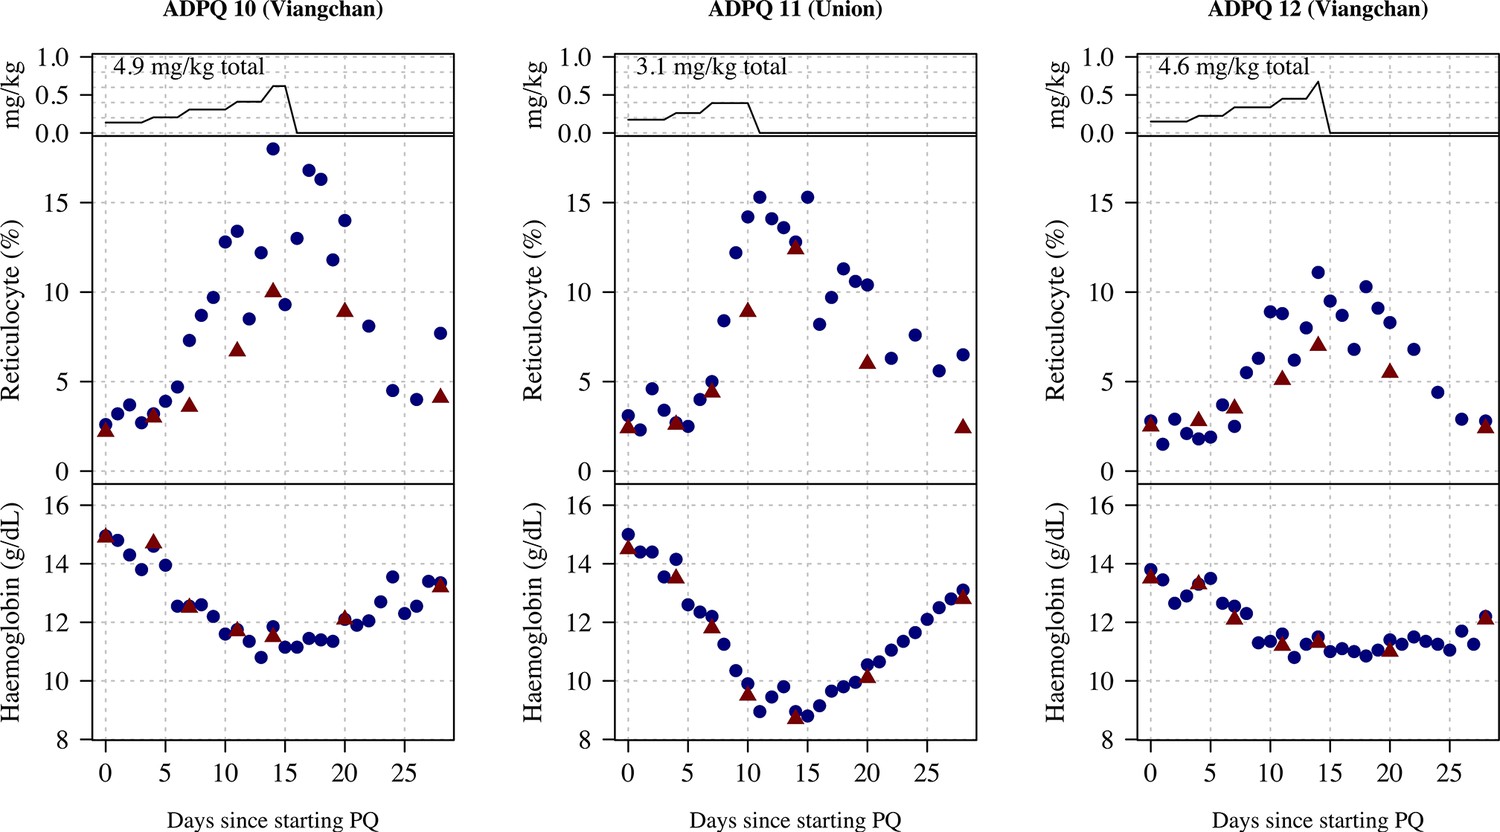
Appendix 9—figure 12
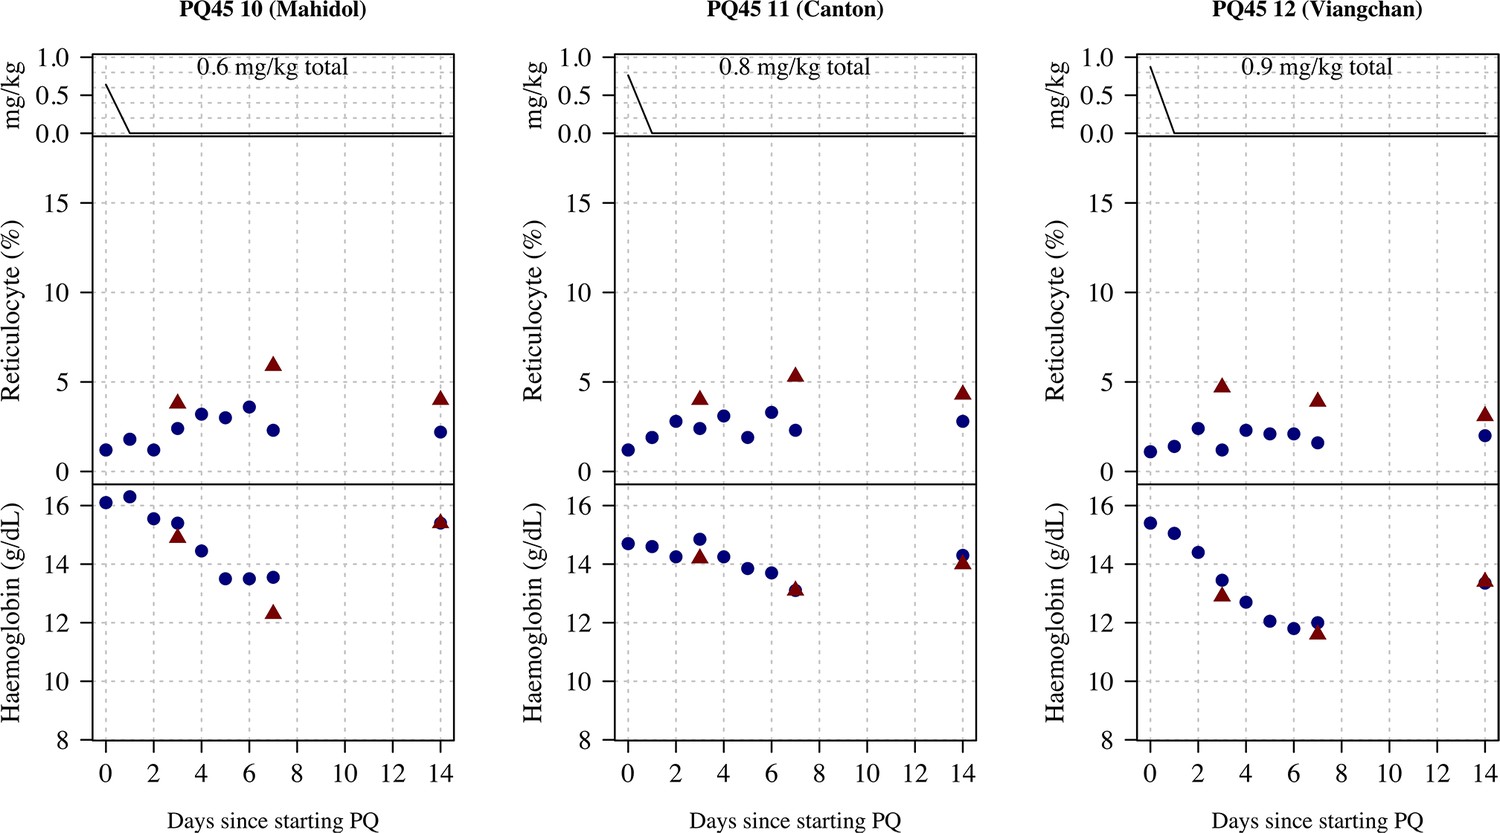
Ascending dose: haemoglobin and reticulocyte data over time for volunteers 10–12.
Blue shows the manual reticulocyte readings and haemocue value; red shows the complete blood count (CBC) values.
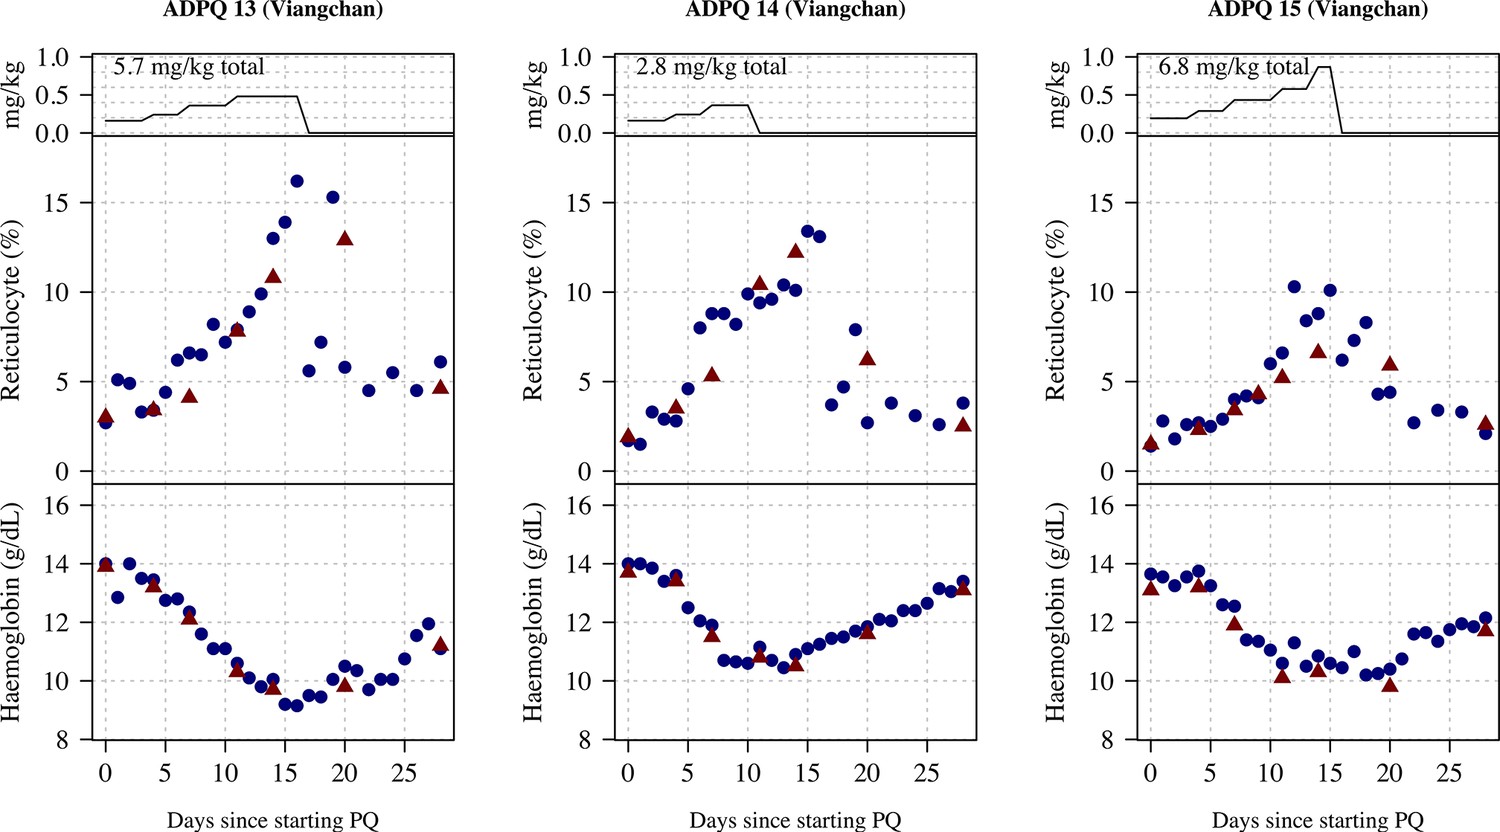
Appendix 9—figure 13

Ascending dose: haemoglobin and reticulocyte data over time for volunteers 13–15.
Blue shows the manual reticulocyte readings and haemocue value; red shows the complete blood count (CBC) values.
Appendix 9—figure 14

Ascending dose: haemoglobin and reticulocyte data over time for volunteer 16.
Blue shows the manual reticulocyte readings and haemocue value; red shows the complete blood count (CBC) values.
Appendix 10—figure 1

Comparison of haemoglobin as measured by complete blood count (CBC) (x-axis) and haemocue (difference between CBC and haemocue shown on the y-axis).
The haemocue gave systematically higher haemoglobin concentrations relative to the CBC for low haemoglobin concentrations (about 0.5 g/dL higher at a haemoglobin of 10 g/dL).
Tables
Table 1
Baseline characteristics of the healthy male volunteers.
For the continuous variables we show the median (range). Of the 27 volunteers, 13 participated in both sub-studies.
| Part 1 - Ascending dose | Part 2 - Single 45 mg dose | Overall | |
|---|---|---|---|
| n | 24 | 16 | 27 |
| Age (years) | 32 (18–55) | 34 (20–58) | 32 (18–58) |
| Weight (kg) | 64 (46–86) | 64 (52–86) | 64 (46–86) |
| G6PD genotype | |||
| Viangchan (871G>A) | 12 | 6 | 12 |
| Mahidol (487G>A) | 4 | 2 | 4 |
| Canton (1376G>T) | 4 | 3 | 5 |
| Aures (143T>C) | 1 | 1 | 1 |
| Chinese-4 (392G>T)† | 1 | 0 | 1 |
| Orissa (131C>G) | 1 | 1 | 1 |
| Union (1360C>T) | 1 | 2 | 2 |
| Kaiping (1388G>A) | 0 | 1 | 1 |
| G6PD enzyme activity (U/g Hb) | 0.15 (0–1.9) | ||
| Haemoglobin (g/dL) | 14.3 (11.8–15.8) | 14.0 (12.3–15.9) | |
| Red cell count (×1012 per L) | 4.9 (4.2–6.0) | 5.1 (3.9–5.9) | |
| Reticulocyte count (%) | 2.4 (1.1–4.0) | 2.4 (1.0–2.9) | |
| Platelet count (×1000 per µL) | 285 (190–424) | 289 (174–412) | |
| Total white blood cell count (×1000 per µL) | 6.6 (4.8–9.3) | 6.6 (5.2–8.4) | |
| Methaemoglobin (%) | 0.5 (0–1.5) | 0.7 (0–1.4) | |
| AST (IU/L) | 23 (15–60) | 21 (14–36) | |
| ALT (IU/L) | 26 (10–85) | 22 (11–47) | |
| Creatinine (mg/dL) | 0.9 (0.8–1.1) | 1.0 (0.7–1.1) | |
| Total bilirubin (mg/dL) | 0.6 (0.3–1.6) | 0.7 (0.3–1.3) | |
| Haptoglobin (g/L) | 1.1 (0.5–1.7) | 1.1 (0.5–1.7) | |
| CYP2D6 genotypes | |||
| *10/*10 | 6 | 4 | 8 |
| *2/*10 | 7 | 4 | 7 |
| *1/*10 | 6 | 4 | 7 |
| *1/*2 | 3 | 3 | 3 |
| *1/*1 | 2 | 1 | 2 |
| Haemoglobin E trait‡ | 7 | 4 | 7 |
| Presumptive alpha-thalassaemia trait* | 5 | 5 | 7 |
-
*
See definition in Methods.
-
†
Also known as Quing Yan (Minucci et al., 2012).
-
‡
Haemoglobin typing done by electrophoresis in Part 1 only.
Additional files
Download links
A two-part list of links to download the article, or parts of the article, in various formats.
Downloads (link to download the article as PDF)
Open citations (links to open the citations from this article in various online reference manager services)
Cite this article (links to download the citations from this article in formats compatible with various reference manager tools)
Primaquine in glucose-6-phosphate dehydrogenase deficiency: an adaptive pharmacometric assessment of ascending dose regimens in healthy volunteers
eLife 12:RP87318.
https://doi.org/10.7554/eLife.87318.3


