A new look at the architecture and dynamics of the Hydra nerve net
- Department of Biology, Ludwig-Maximilians-University Munich, Germany
- Centre for Organismal Studies (COS) Heidelberg, Heidelberg University, Germany
- Department of Zoology and Center for Molecular Biosciences Innsbruck (CMBI), University of Innsbruck, Austria
- Department of Biological Chemistry, University of California, United States
Figures
Figure 1 with 2 supplements
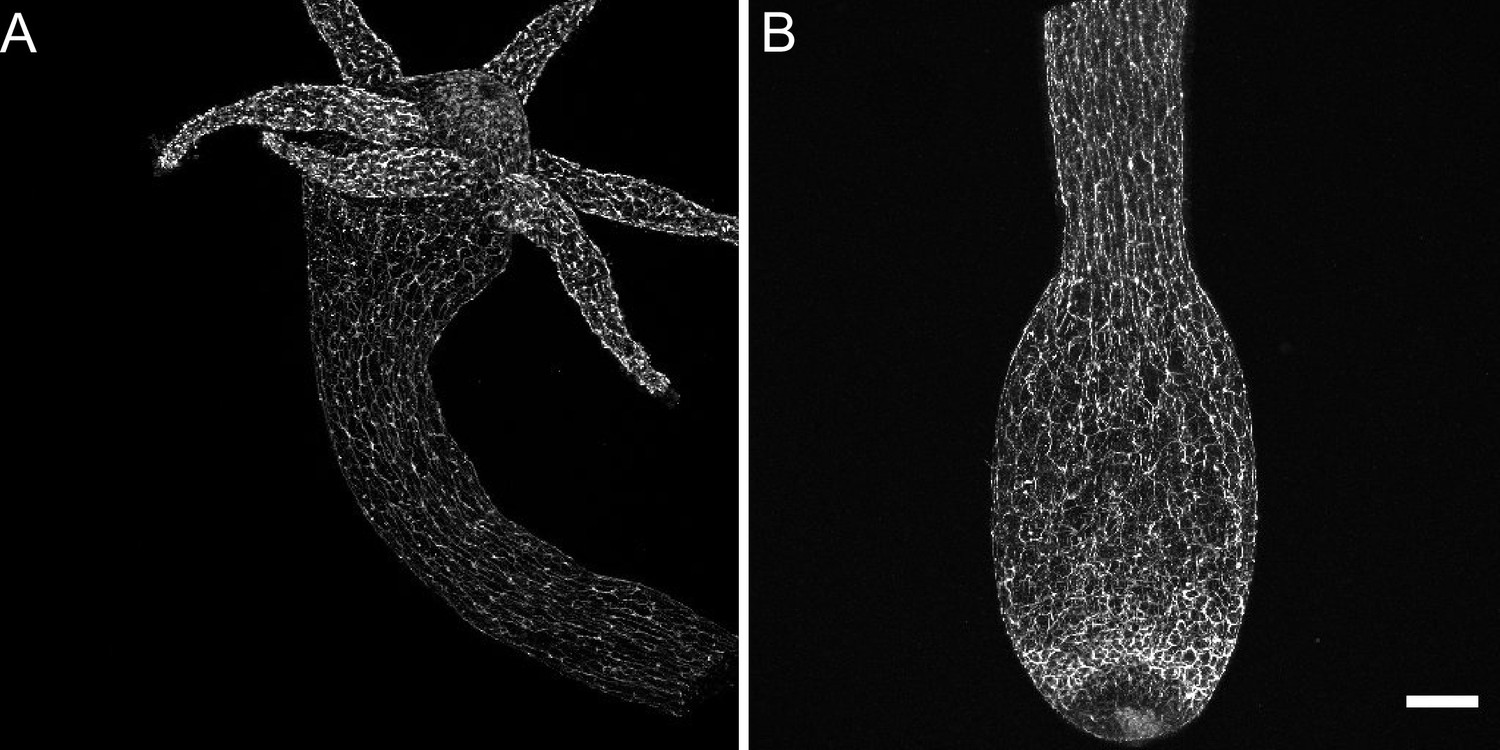
Distribution of pan-neuronal antibody (PNab)-stained nerve cells along the Hydra body axis.
The confocal images are maximum intensity projections of short stacks (10–15 µm) showing the ectoderm. (A) Upper body column including the hypostome and tentacles. (B) Lower body column including the peduncle and basal disk. Scale bar: 150 µm.
Figure 1—figure supplement 1
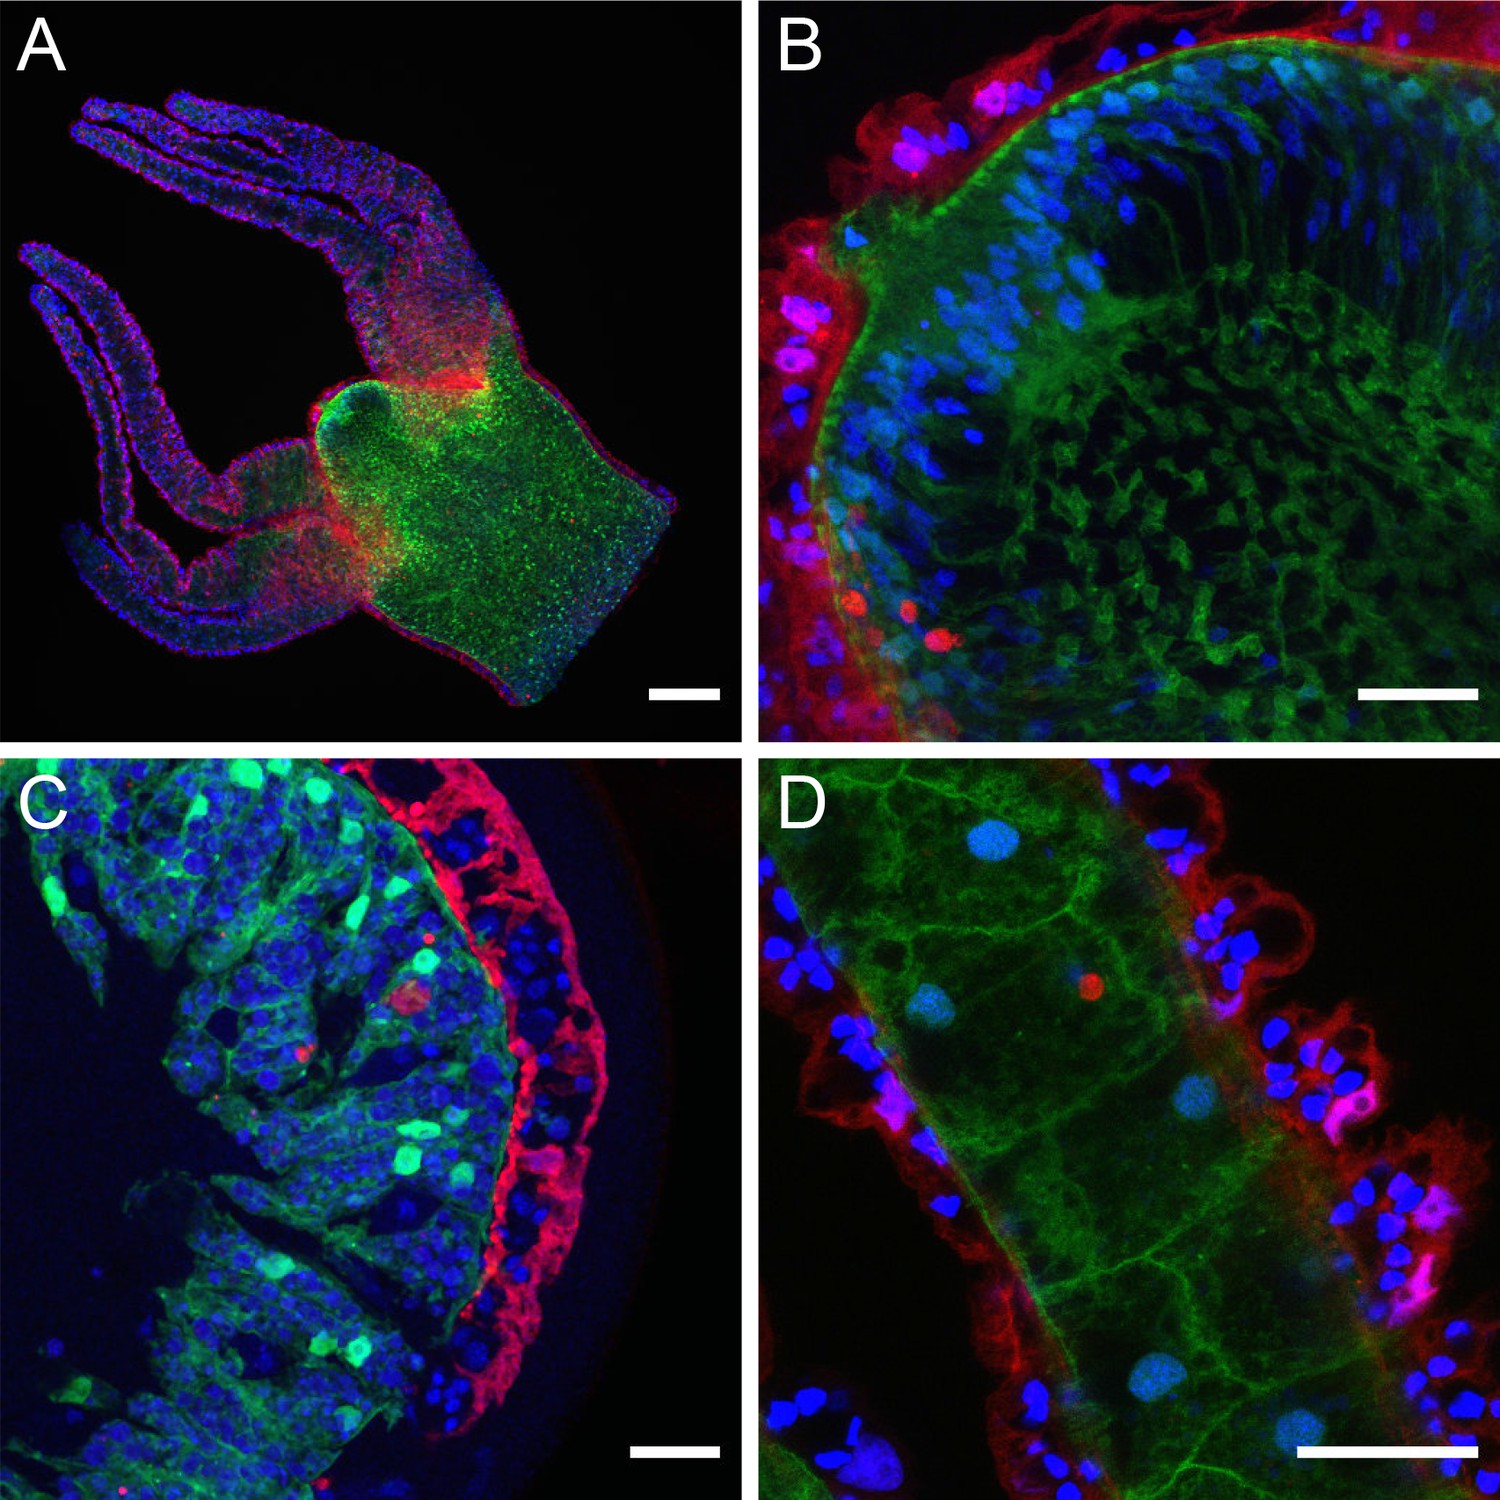
Structure of Hydra tissue imaged in transgenic polyps expressing DsRed2 in ectodermal epithelial cells and GFP in endodermal epithelial cells.
Nuclei are stained with DAPI. Images are maximum intensity projections of short stacks (3–5 µm). Ectodermal nuclei are magenta (DAPI+DsRed2). Endodermal nuclei are turquoise (DAPI+GFP). Blue DAPI nuclei are non-transgenic interstitial cell derivatives. (A) Hypostome, tentacles, and upper body column. Vertical optical section through the mouth region. (B) High-magnification image showing endodermal cells of the mouth opening extending to the surface of the hypostome. Extensive black spaces in the endoderm are occupied by mucous cells. (C) Segment of tissue ring excised from the body column showing ectoderm (red) on the outside and endoderm (green) on the inside. Black spaces are non-transgenic interstitial cell derivatives (gland cells in the endoderm, interstitial stem cells and nematoblast nests in the ectoderm). (D) Longitudinal optical section through a tentacle showing large endodermal cells in center flanked by red ectodermal (battery) cells containing embedded nematocytes (blue nuclei in black spaces). Scale bars: (A) 150 µm, (B, C, D) 30 µm.
Figure 1—figure supplement 2
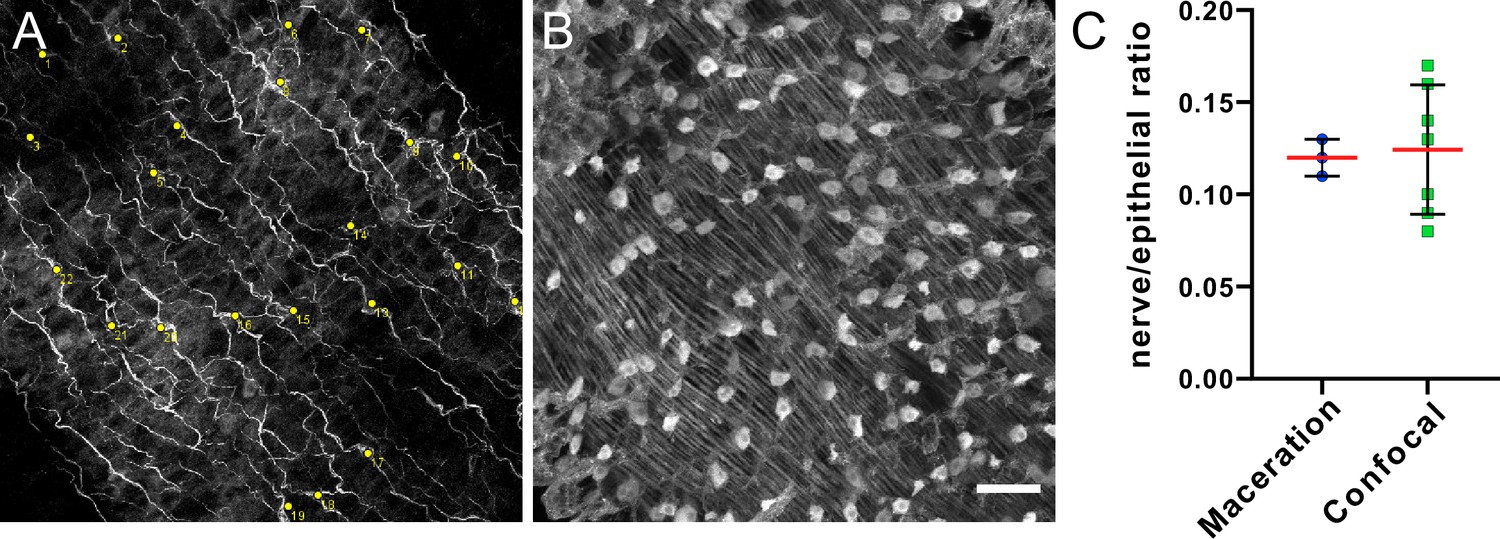
Representative images of pan-neuronal antibody (PNab)-stained body column of a transgenic watermelon polyp (GFP in ectoderm, DsRed2 in endoderm) used to count epithelial cells and nerve cells.
The images are 250×250 µm2. The stack depth is 20 µm. Such images were used to count nerve cells and epithelial cells in the ectoderm. (A) PNab (red)-stained nerve cells (nerve cell nuclei stained with DAPI are indicated by yellow spots). (B) Anti-GFP (green)-stained ectodermal epithelial cells; nuclei appear as round spots above parallel muscle processes at the base of the cells. Scale bar: 30 µm. (C) Nerve to epithelial cell ratio assayed by maceration and by cell counting in confocal image stacks (see Materials and methods). Three maceration preparations containing 8, 9, and 10 animals respectively were scored to yield an average value of 0.12 nerve cells per epithelial cell. Seven PNab-stained Hydra were imaged by confocal microscopy. The ratio of nerve cells to epithelial cells in confocal image stacks taken through the body wall in the gastric region varied between animals; the average value was 0.12 nerve cells per epithelial cell. Error bars indicate the standard deviation of the mean. In both maceration samples and confocal image stacks, 500–1800 total cells were counted per sample.
Figure 2
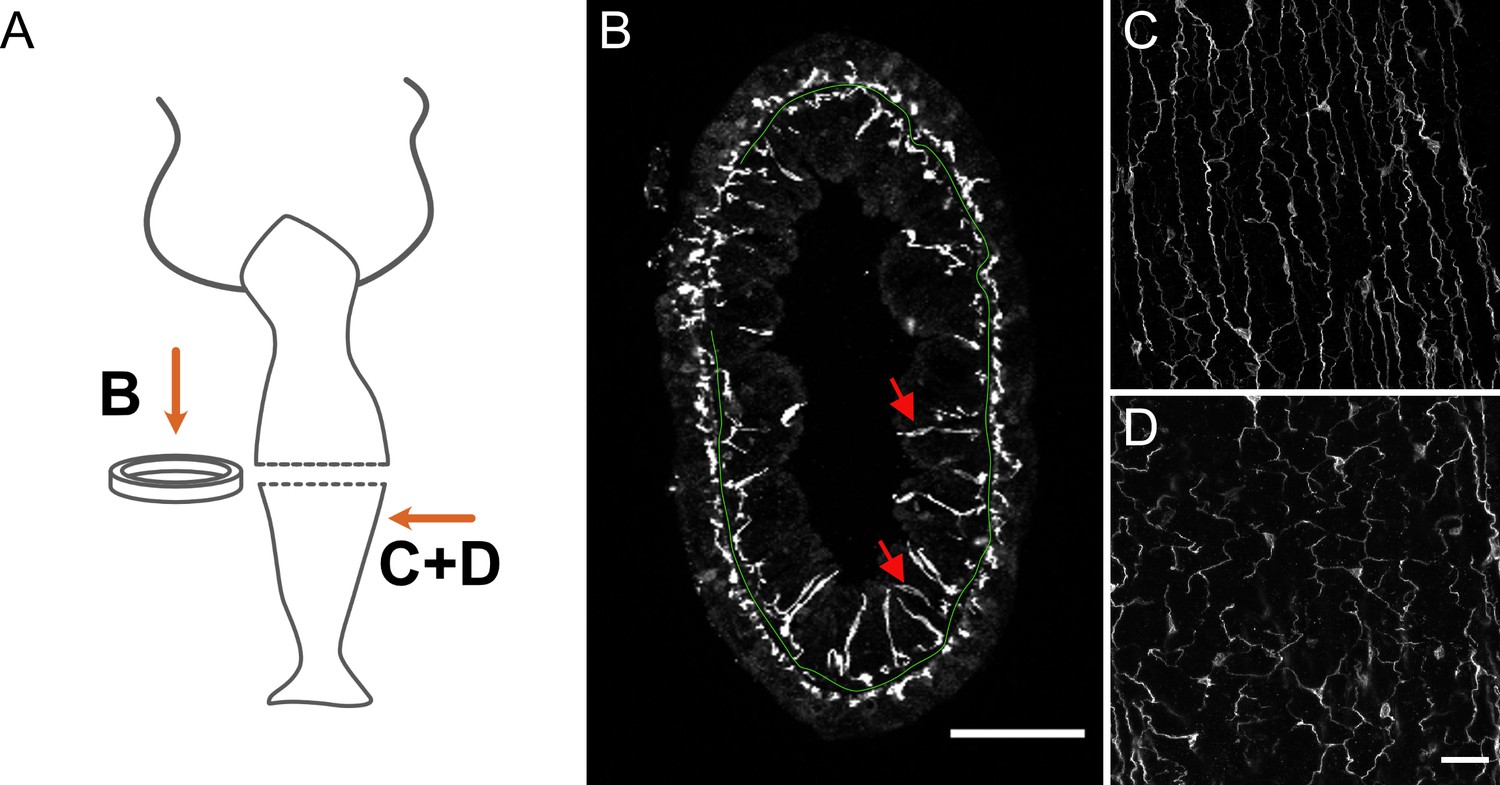
Distribution of pan-neuronal antibody (PNab)-stained nerve cells in a cross-section of the body column.
(A) Schematic shows the position of imaged tissue. (B) Circular ring of tissue excised from the body column and viewed from above. The green line traces the position of the mesoglea separating ectoderm and endoderm except where tissue is compressed in the upper left quadrant. The ectodermal and endodermal nerve nets are separate structures. Red arrows indicate sensory cells extending from the endodermal ganglion net into the gastric cavity. (C and D) Maximum intensity projection images of short stacks through the body wall showing parallel tracks of neurites and nerve cell bodies in the ectoderm (C) and a polygonal pattern of nerve cells and neurites at the same position in the endoderm (D). Oral is to the top, aboral to the bottom. Scale bars: (B) 100 µm, (C and D) 30 µm.
Figure 3
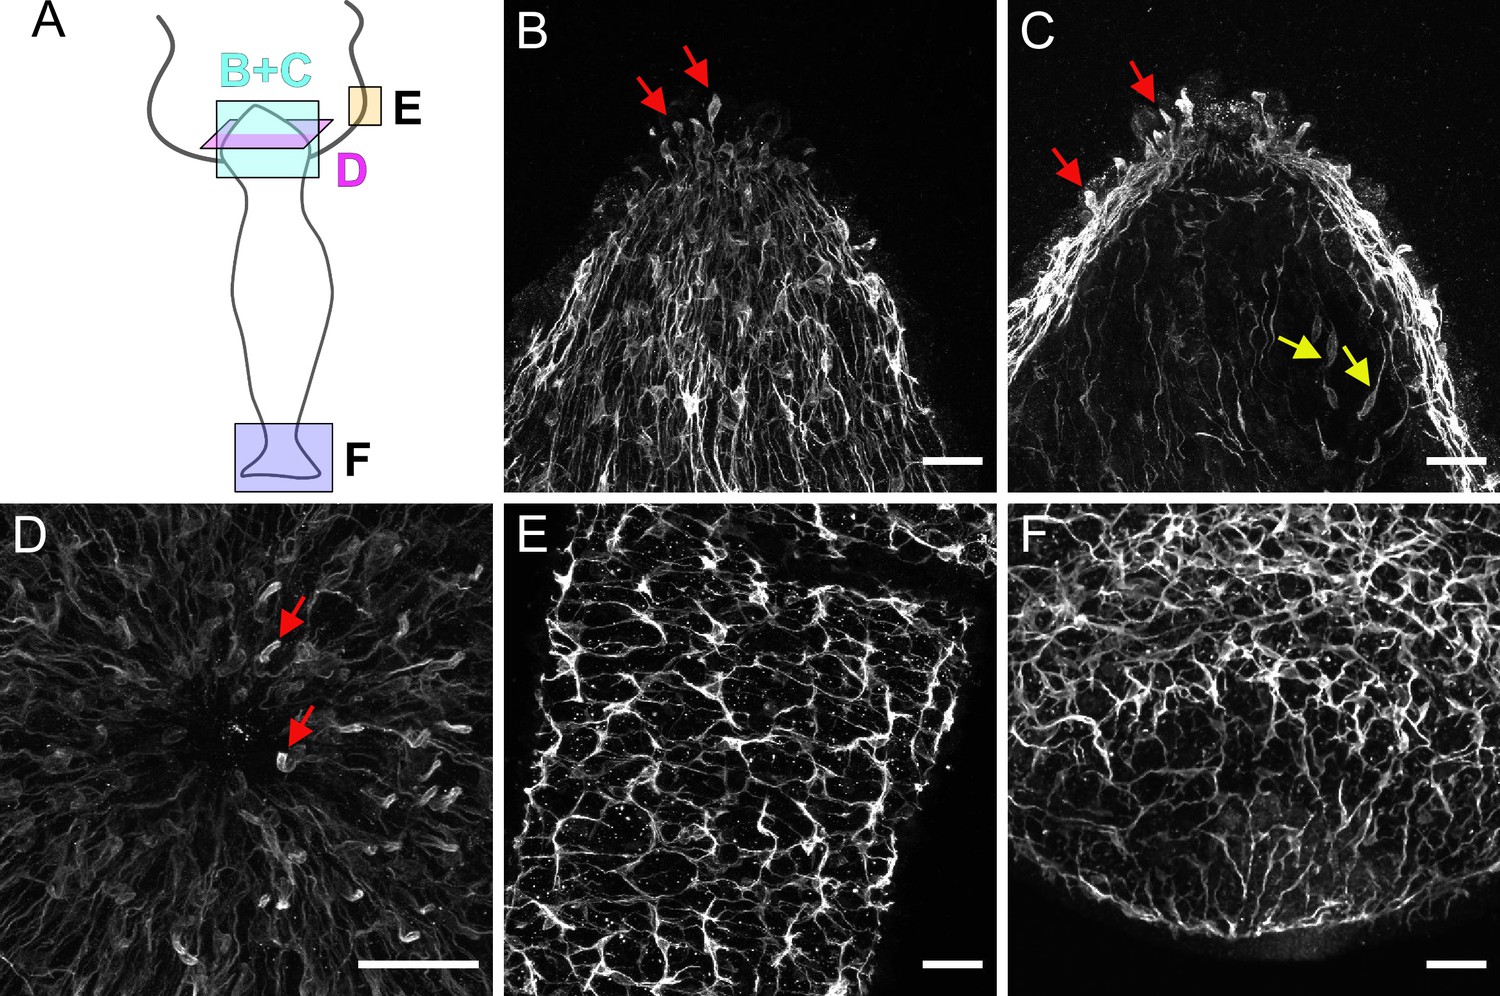
Pan-neuronal antibody (PNab)-stained nerve cells in the hypostome (B, C, D), tentacle (E), and peduncle/basal disk (F).
(A) Schematic shows the orientation of the confocal images. The images are maximum intensity projections of short stacks (10–15 µm) through the ectoderm of the hypostome (B) and deeper in the tissue at the same position (C) showing sensory nerve cells in the ectoderm (red arrows) and in the endoderm (yellow arrows). (D) Ectoderm surrounding the mouth opening viewed from above showing sensory nerve cells in ectoderm (red arrows). (E) Ectodermal nerve net in a short section of tentacle tissue. (F) Ectodermal nerve net in the peduncle and basal disk. Scale bars: (B, C, D, E, and F) 30 µm.
Figure 4
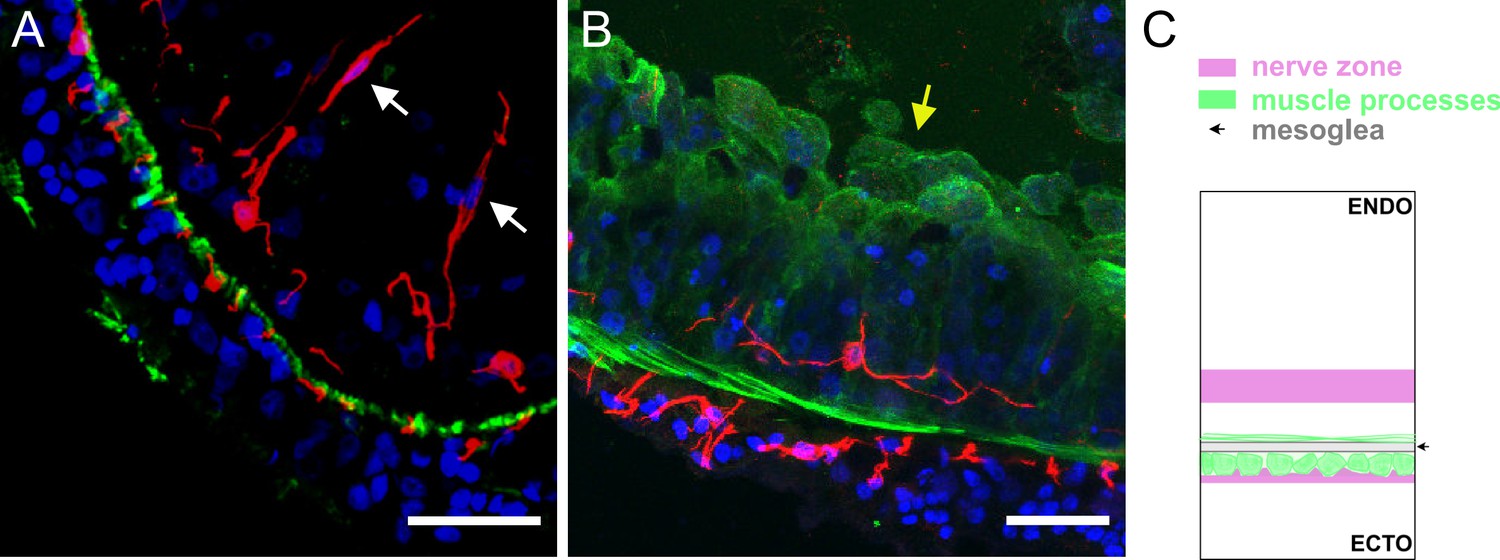
Segments of a ring of body column tissue excised perpendicular to the main body axis from Lifeact ecto (A) and Lifeact endo (B) polyps stained with pan-neuronal antibody (PNab) (red) and anti-GFP (green).
The confocal images are maximum intensity projections of short stacks (20 µm) down the body column. (A) Lifeact ecto polyp. In the ectoderm small red spots (neurites) and green spots (muscle processes) alternate and are directly adjacent to the unstained mesoglea. In the endoderm neurites of ganglion cells are located at some distance from the mesoglea. Two sensory nerve cells (white arrows) in the endoderm extend upward to the gastric cavity. (B) Lifeact endo polyp. Green muscle processes extend laterally in the plane of the image. The apical actin network of the endodermal cells faces the gastric cavity and is also strongly stained green (yellow arrow). A single ganglion cell in the endoderm extends red neurites parallel to, but separate from green muscle processes. (C) Schematic shows the position of ectodermal and endodermal nerve nets relative to corresponding muscle processes and the mesoglea. Scale bars: 30 µm.
Figure 5
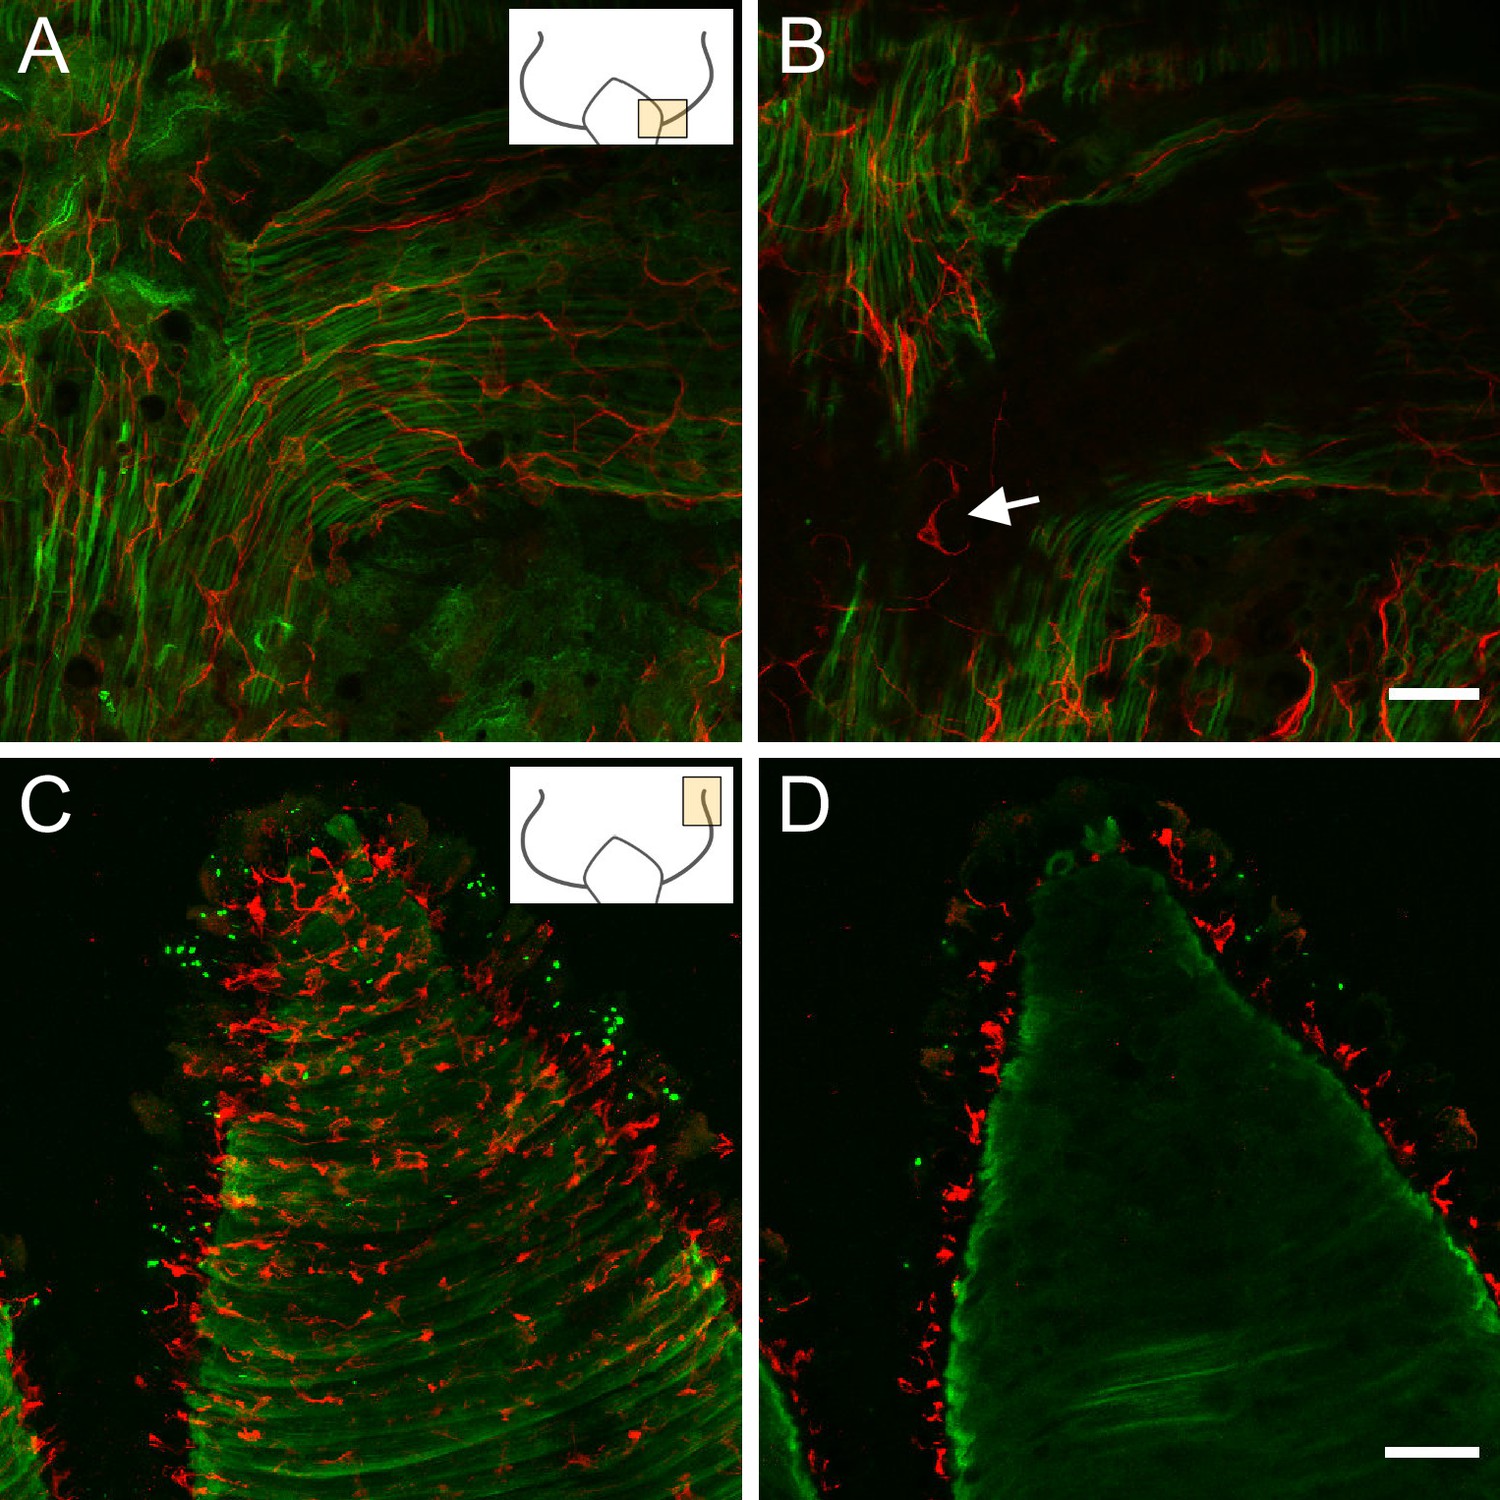
Lifeact ecto (A and B) and Lifeact endo (C and D) polyps stained with pan-neuronal antibody (PNab).
Confocal images are maximum intensity projections of image stacks in the ectoderm and endoderm. Small schematics indicate position of the images. (A) Lifeact ecto polyp showing the base of a tentacle. Green muscle processes extend parallel to the oral-aboral body axis and into the base of the tentacle. Red neurites are closely associated with muscle processes and extend into the tentacle. (B) Image at the same position as (A) but deeper into the tissue showing absence of nerve cells in the endoderm of the tentacle but a nerve cell and neurites in the endoderm of body column (white arrow). (C) Lifeact endo polyp showing a tentacle surrounded by circular green muscle processes. Red nerve cells form a net in the ectoderm. (D) Same position but deeper in the tissue than (C), showing complete absence of red nerve cells in the endoderm. Scale bars: (A and B) 30 µm, (C and D) 100 µm.
Figure 6
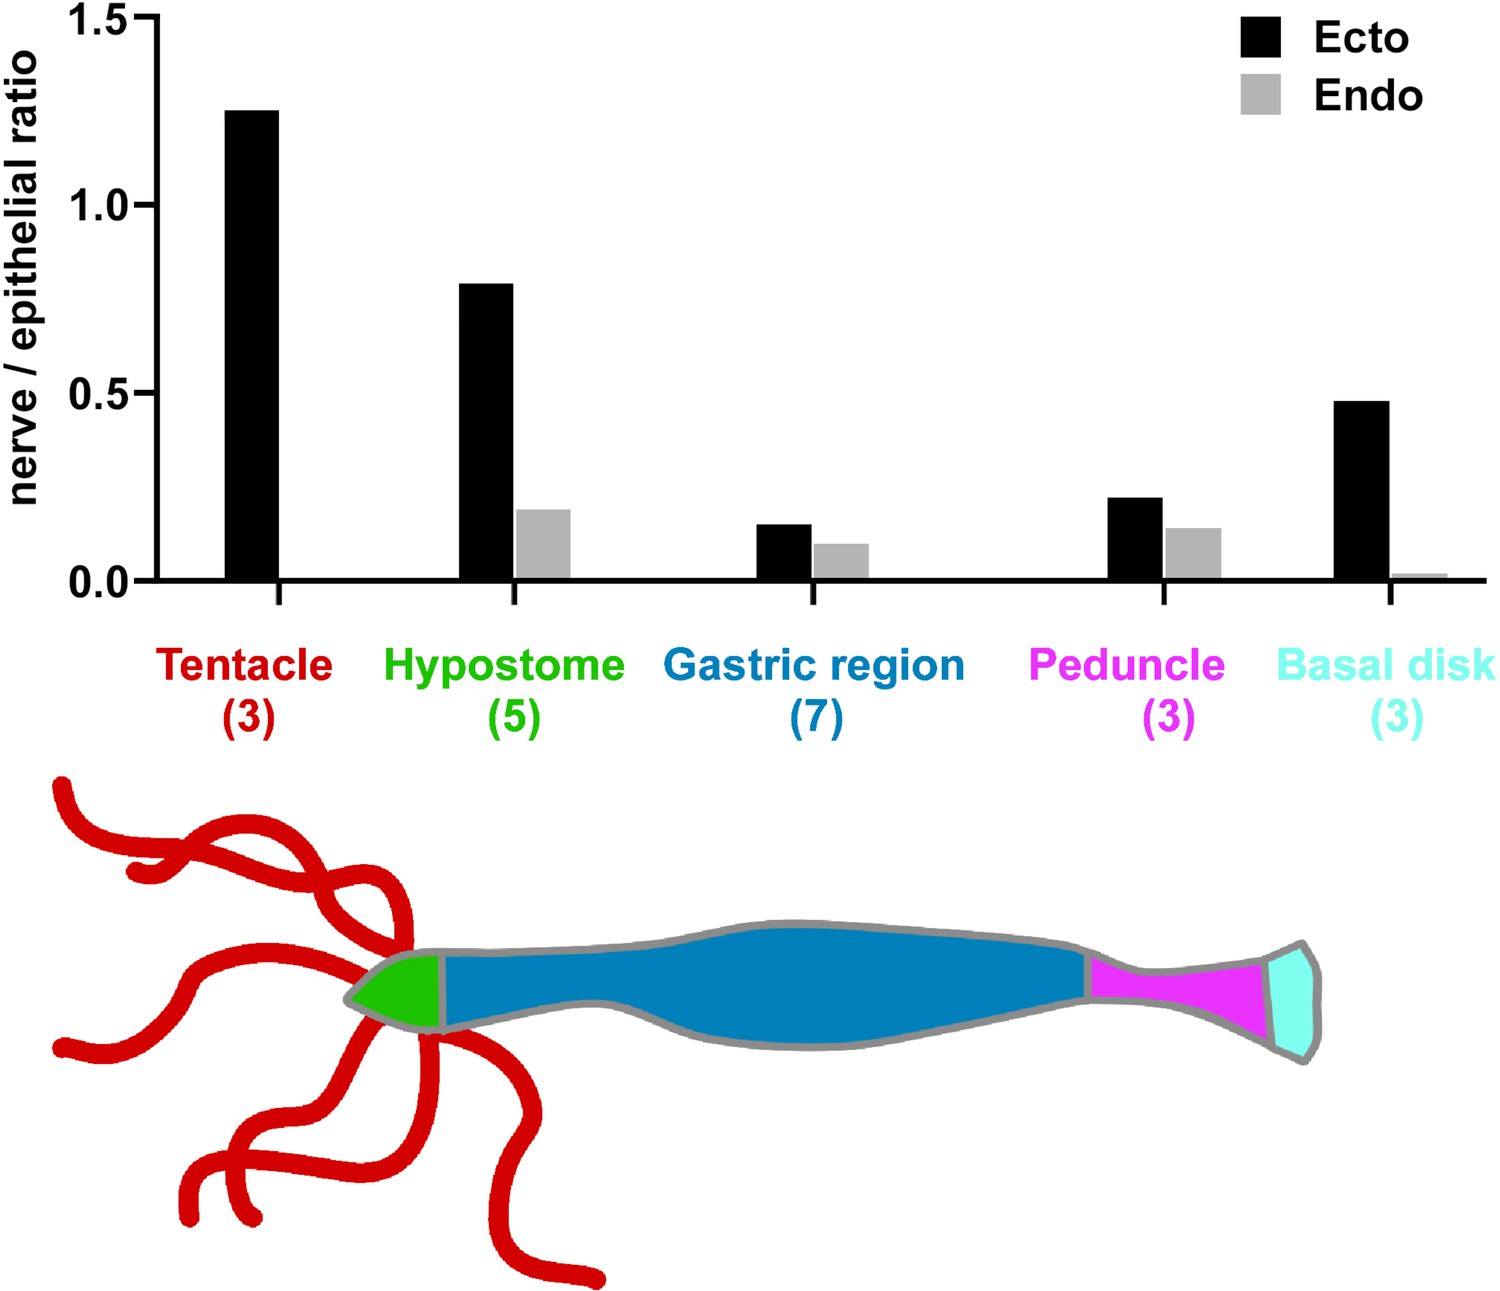
Nerve cell to epithelial cell ratio along the body column of Hydra.
Transgenic watermelon and inverse watermelon polyps were stained with pan-neuronal antibody (PNab) to identify nerve cells and with DAPI to identify nuclei. Confocal stacks were taken through the body wall at various positions along the body column and scored for ectodermal and endodermal epithelial cells and for nerve cells (see Materials and methods and Figure 1—figure supplement 2). The results are semi-quantitative, since the number of animals scored (shown in brackets) and the number of image stacks varied at each position. A total of 80–400 nerve cells were scored in body column and peduncle samples, 20–30 in hypostome samples, but only 0–2 in the endoderm of tentacle and basal disk due to absence or very rare occurrence of endodermal nerve cells in these body parts.
Figure 7
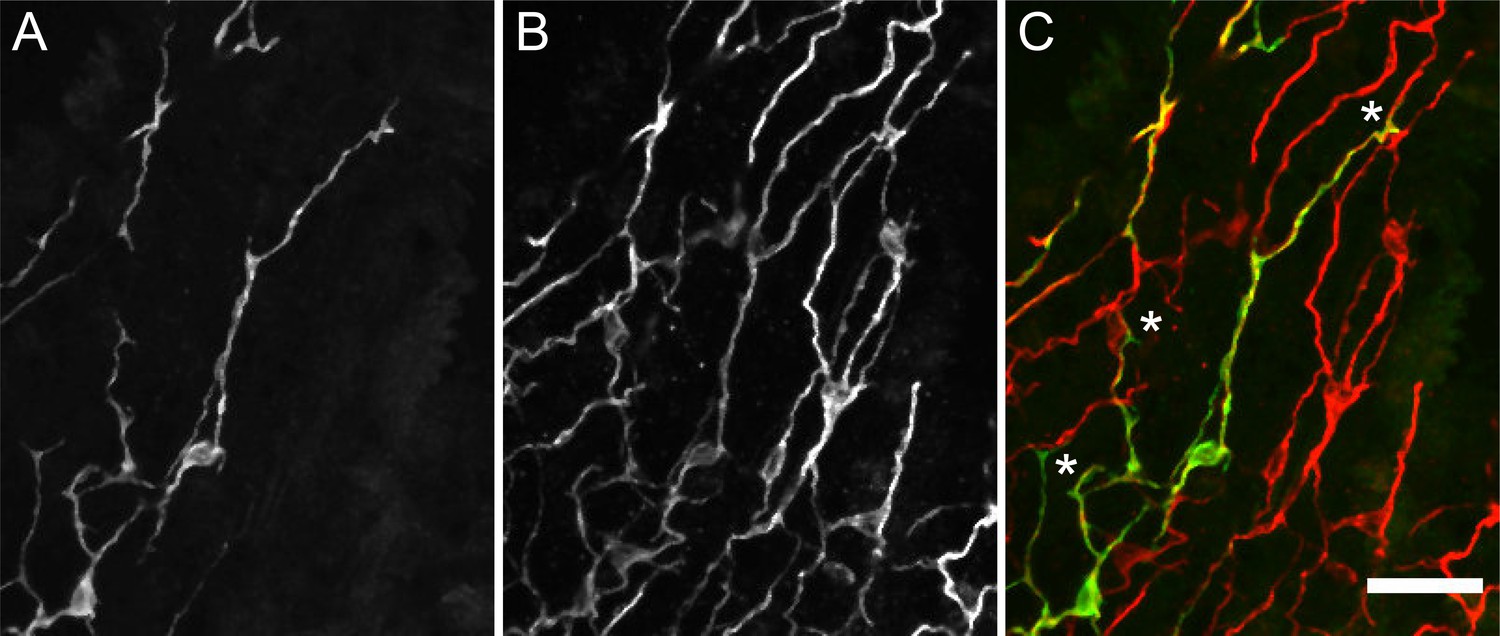
Transgenic nGreen polyp stained with anti-GFP (green) and pan-neuronal antibody (PNab) (red).
Confocal images of the ectoderm in the body column showing two GFP-labeled nerve cells overlapping the PNab-stained nerve net. (A) Anti-GFP, (B) PNab, and (C) overlay of anti-GFP (green) and PNab (red) images. White asterisks mark three GFP-labeled neurites, which run parallel to and terminate on the PNab-stained nerve net. Note that GFP-labeled nerve cells are also stained with PNab. Scale bar: 30 µm.
Figure 8
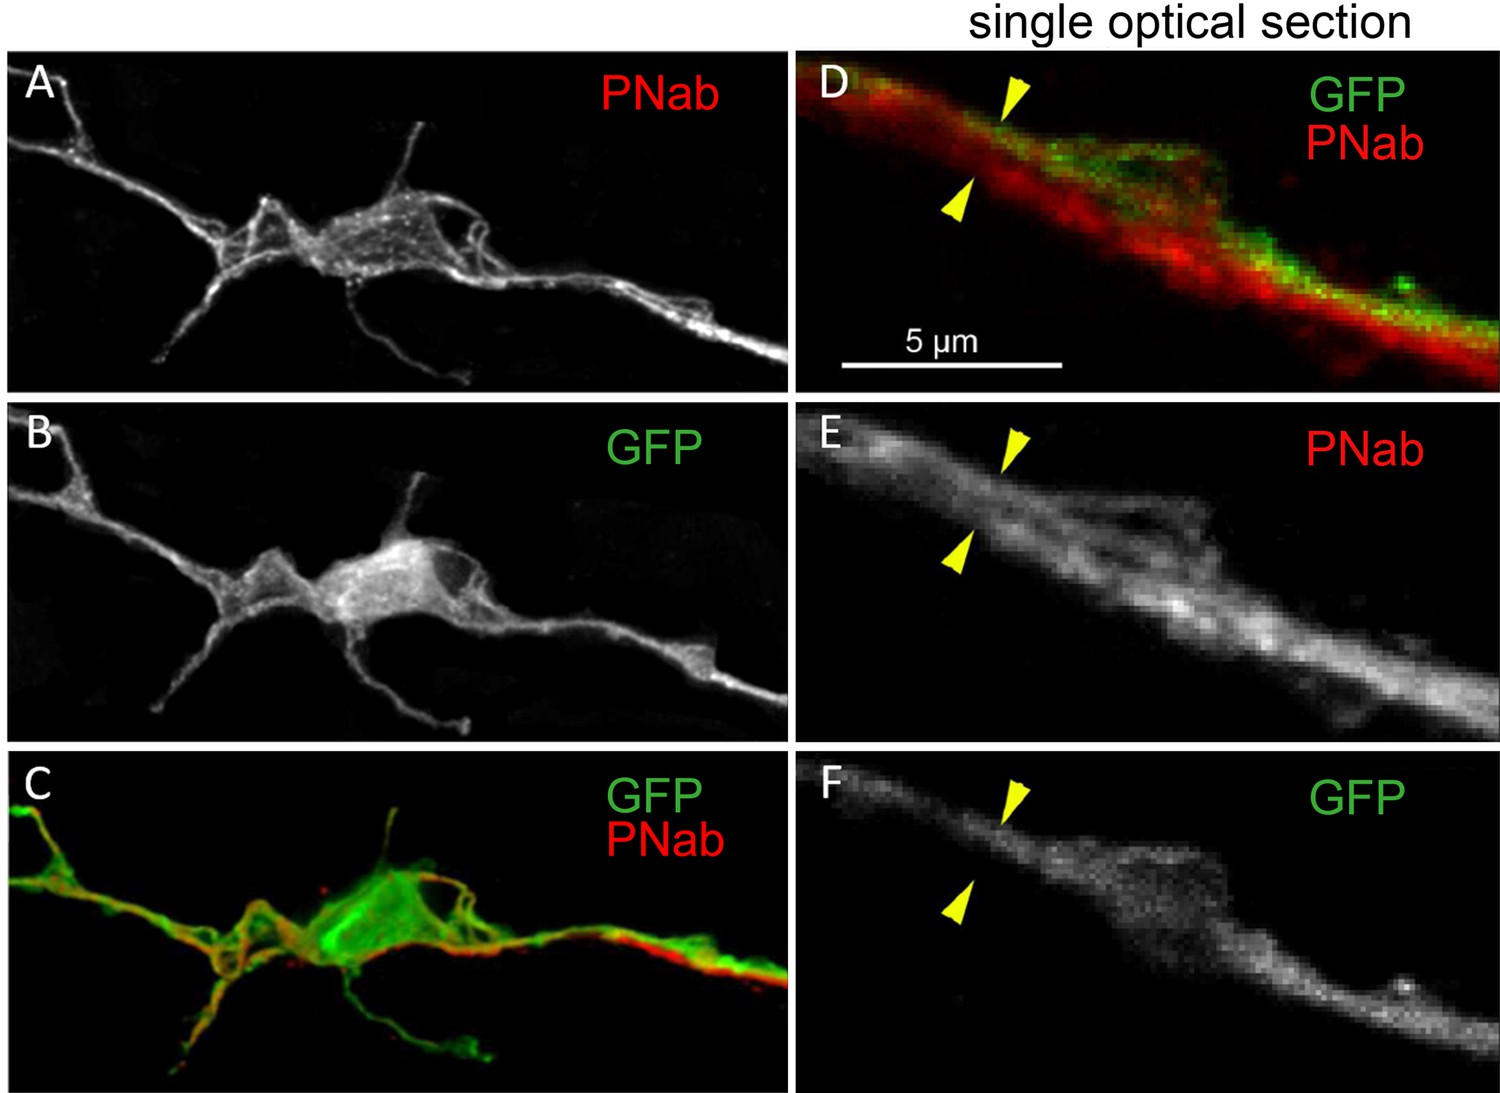
Transgenic nGreen polyp stained with pan-neuronal antibody (PNab) (red) and anti-GFP (green).
(A–C) Maximum intensity projection confocal image stack of a GFP-stained nerve cell tightly associated with a PNab (red)-stained neurite from another cell. (D–F) Single optical section from the image stack in (A) showing parallel GFP and non-GFP neurites, both stained with PNab. The yellow arrowheads mark the outer boundary of the two parallel neurites in (D, E, and F). Scale bar: 5 µm.
Figure 9
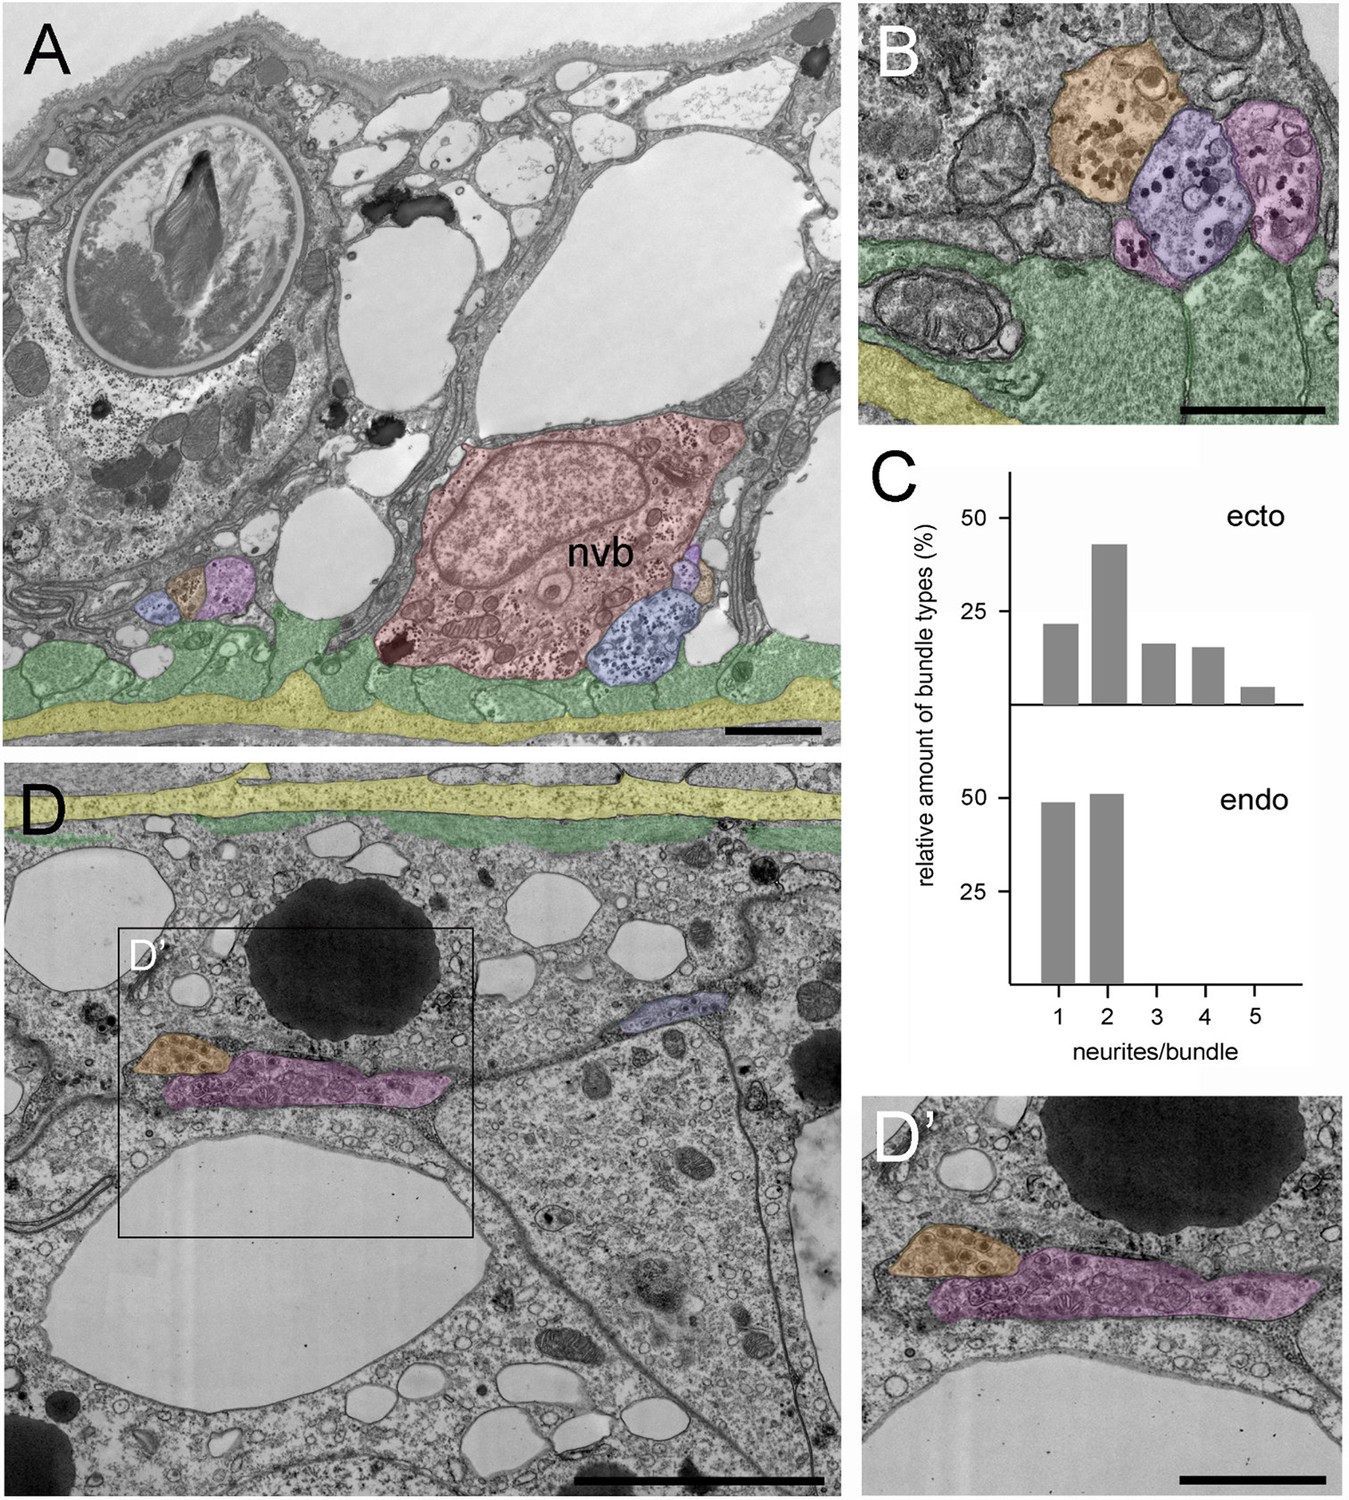
Position and structure of neurite bundles in the mid-body column in transmission electron microscopy (TEM) cross-sections.
To facilitate identification, neurites are overlaid in orange-blue-purple, the nerve cell body in red, muscle processes in green, and the mesoglea in yellow. (A) Low magnification of the ectoderm. A nerve cell body (nvb) is directly associated with the muscle processes, and four neurites cut in cross-section run parallel to the nerve cell body. An additional neurite bundle containing three neurites with contact to a muscle process is visible to the left of the nerve cell body. (B) Higher magnification image of another bundle of four neurites in contact with and running parallel to muscle processes. (C) Quantitative analysis of the relative amount of neurite bundle complexity using four TEM cross-sections spanning 40 µm in the mid-body column. Analysis included 130 nerve tracks in the ectoderm and 47 nerve tracks in the corresponding endodermal area. In the ectoderm, about 20% of nerve tracks consist of single neurites, about 80% of bundles contain two to five neurites. In contrast, about 50% of endodermal nerve tracks consist of single neurites, and about 50% contain two neurites. (D) Cross-section of the endoderm showing a single neurite and a bundle with two neurites located at some distance to the basal muscle processes and the mesoglea. (D’) Higher magnification of the endodermal nerve bundle reveals numerous dense core vesicles and mitochondria. Scale bars: (A) 10 µm, (B and D) 5 µm, (D’) 2 µm.
Figure 10 with 1 supplement
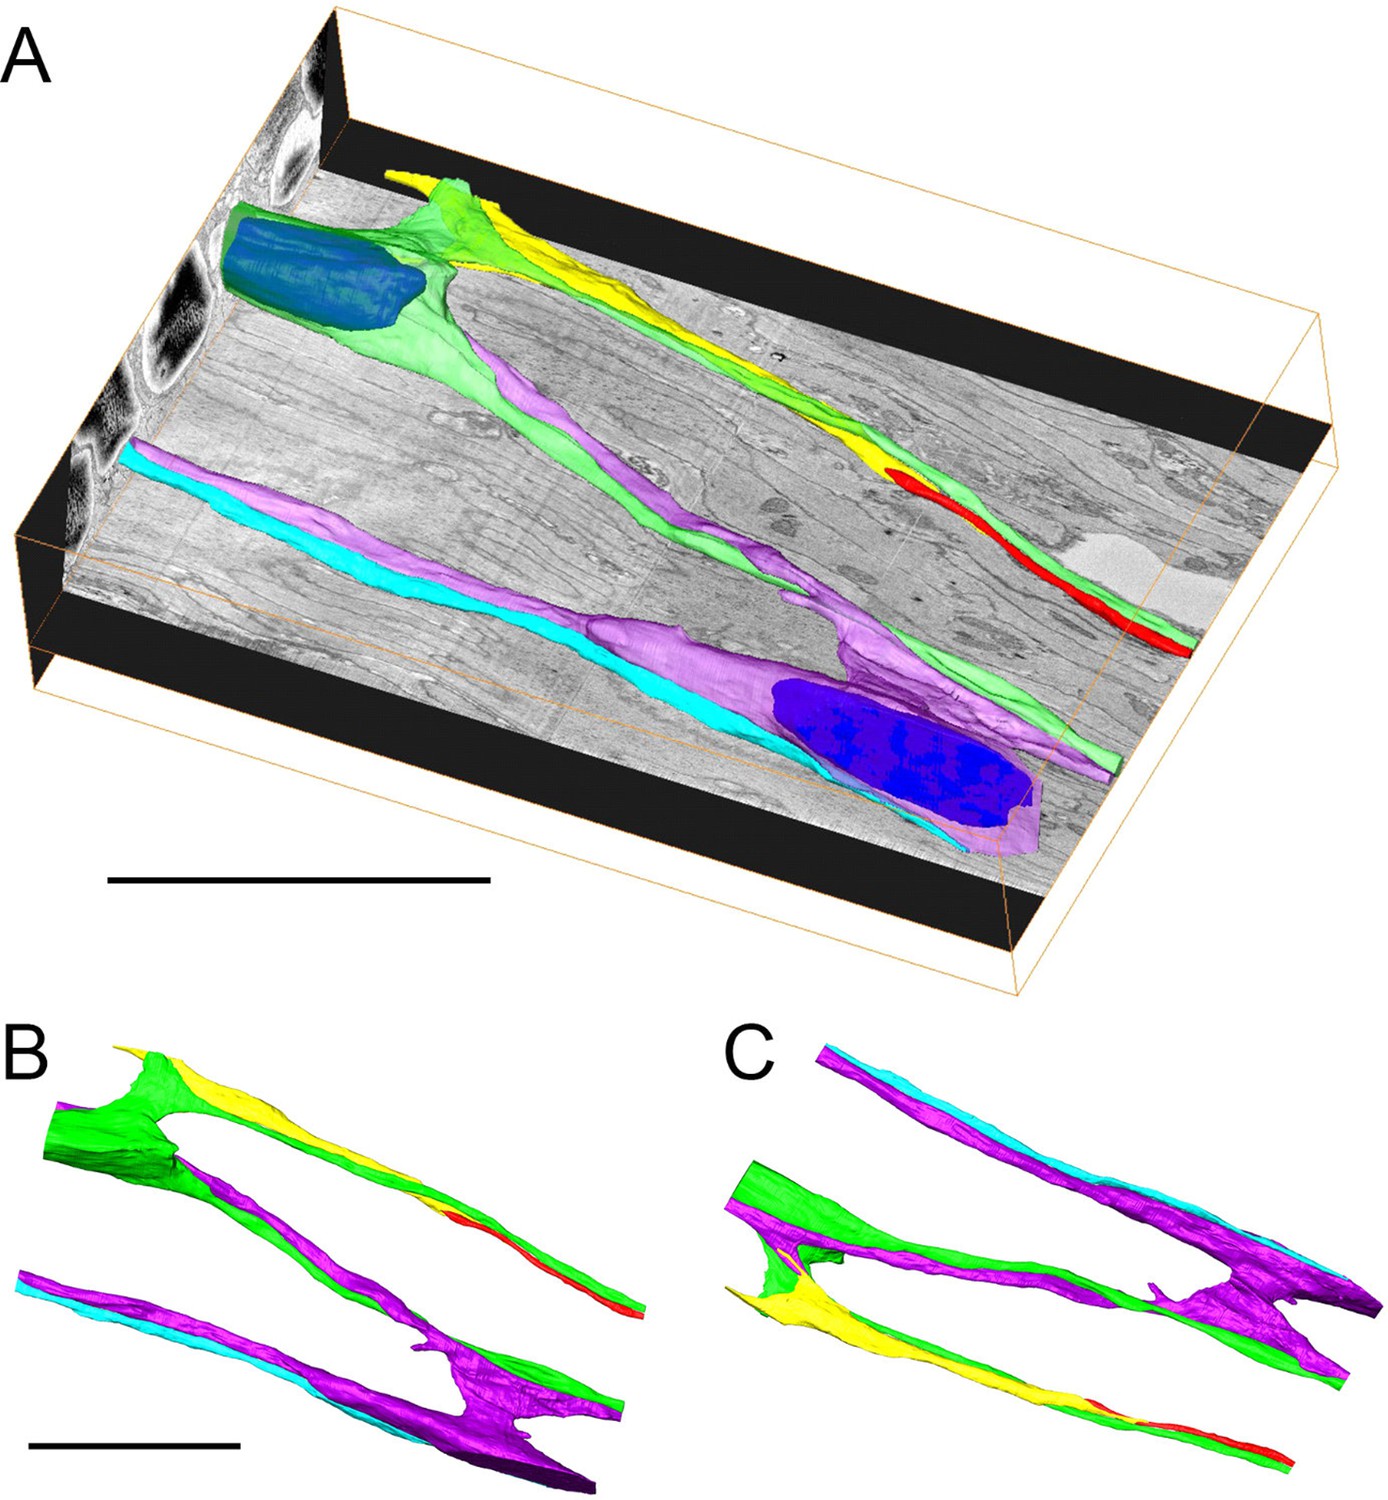
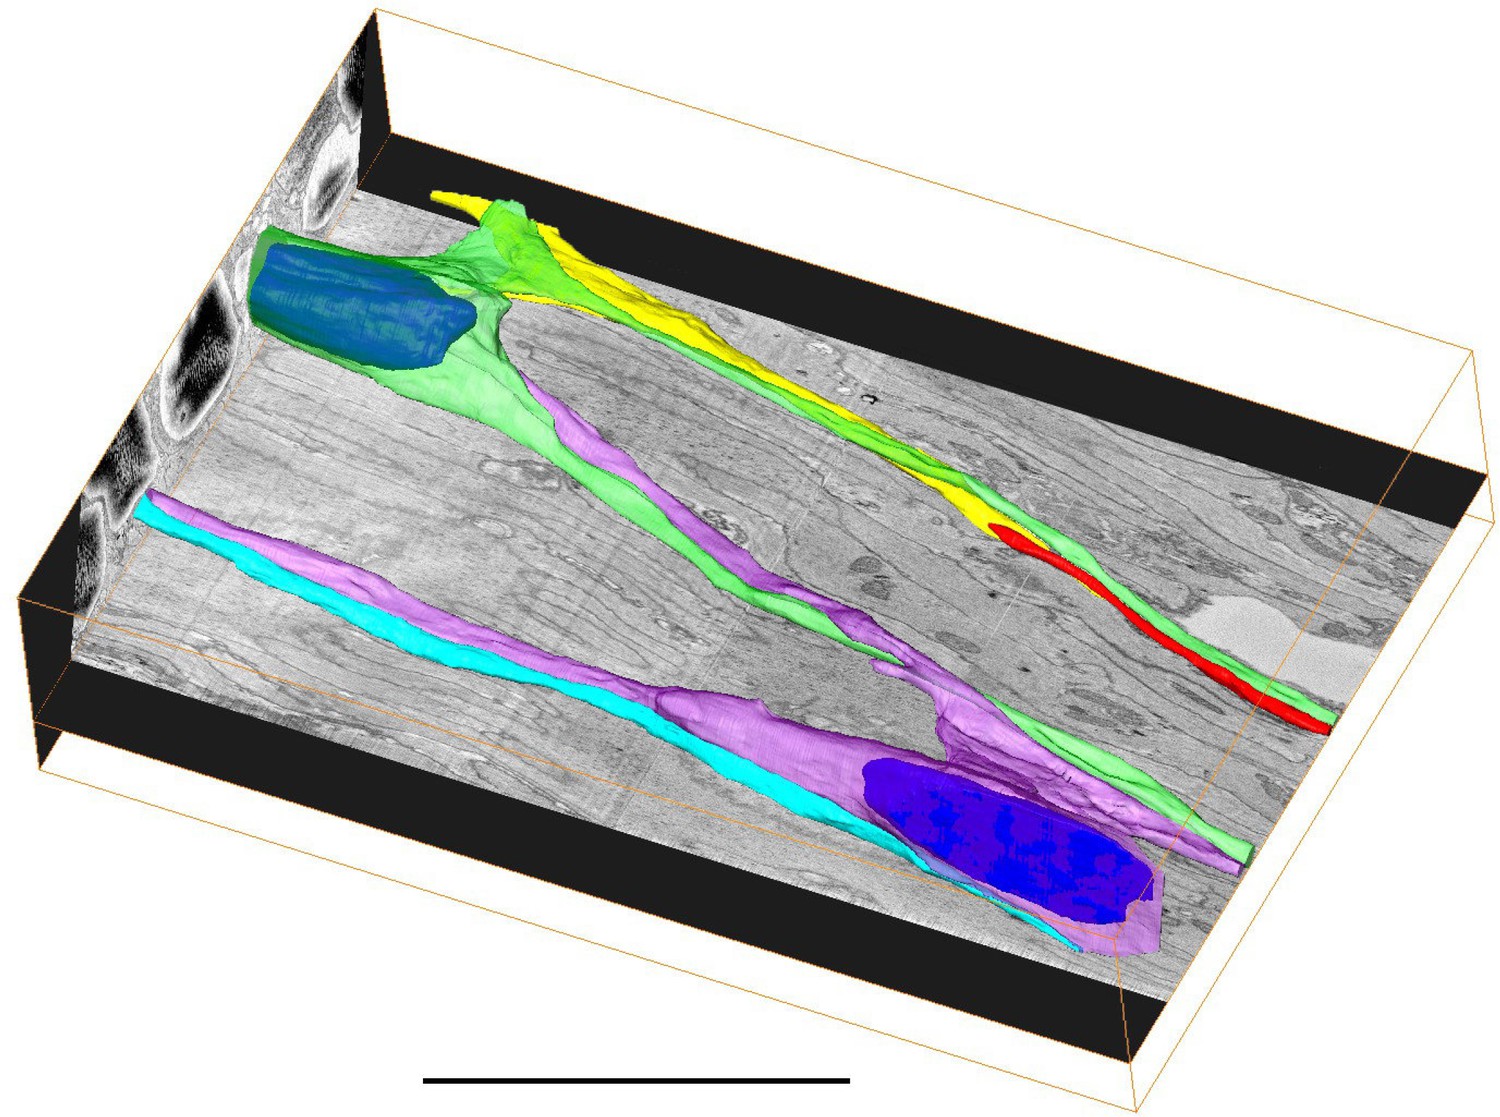
3D reconstruction of 2000 serial sections obtained by serial block face scanning electron microscopy (SEM) in the ectoderm of the body column.
(A) Two nerve cell bodies and their neurites are colored green and purple (nuclei are highlighted in blue). Three additional neurites from nerve cells outside the imaged block are colored yellow, red, and blue. The imaged block is 56 µm long. (B and C) Top and bottom projections from an interactive model of the reconstruction showing only nerve cell bodies and neurites (Figure 10—figure supplement 1). Scale bars: 20 µm.
Figure 10—figure supplement 1
3D interactive model of the serial block face scanning electron microscopy (SEM) reconstruction shown in Figure 10.
The interactive 3D model can be accessed by clicking into the figure and dragging the image with the left mouse button pressed (Adobe Reader Version 7 or higher required). Scale bar: 20 µm.
Figure 11
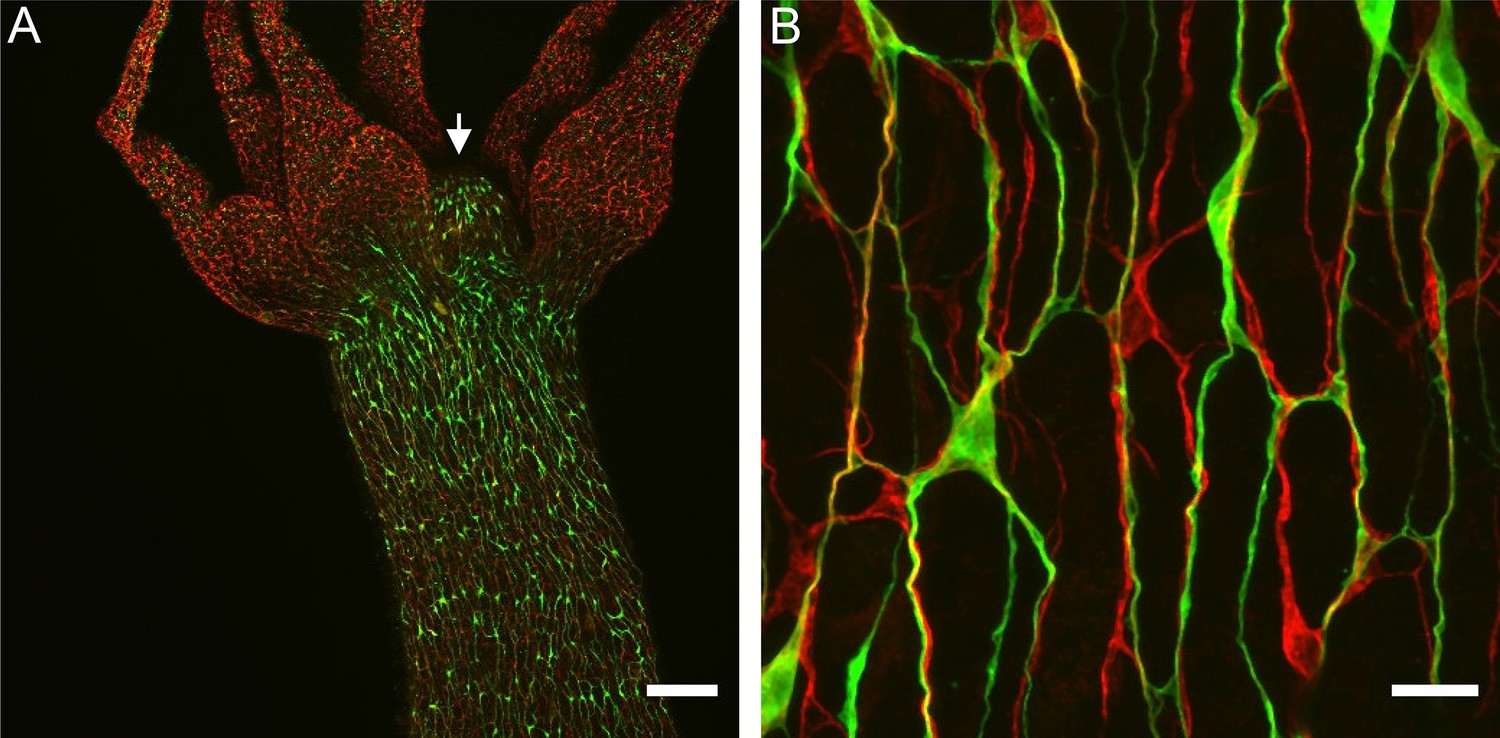
Nerve cell composition of neurite bundles.
Transgenic Hym176B animal stained with anti-GFP and pan-neuronal antibody (PNab). (A) Overview of hypostome (white arrow), tentacles, and upper body column showing transgenic Hym176B nerve cells stained with anti-GFP (green) and all nerve cells stained with PNab (red). (B) High-magnification image of the same Hym176B animal showing nerve cell bodies and neurite bundles in the nerve net. Most bundles consist of both Hym176B neurites and PNab-stained neurites (stained only with PNab). Scale bars: (A) 150 µm, (B) 15 µm.
Figure 12
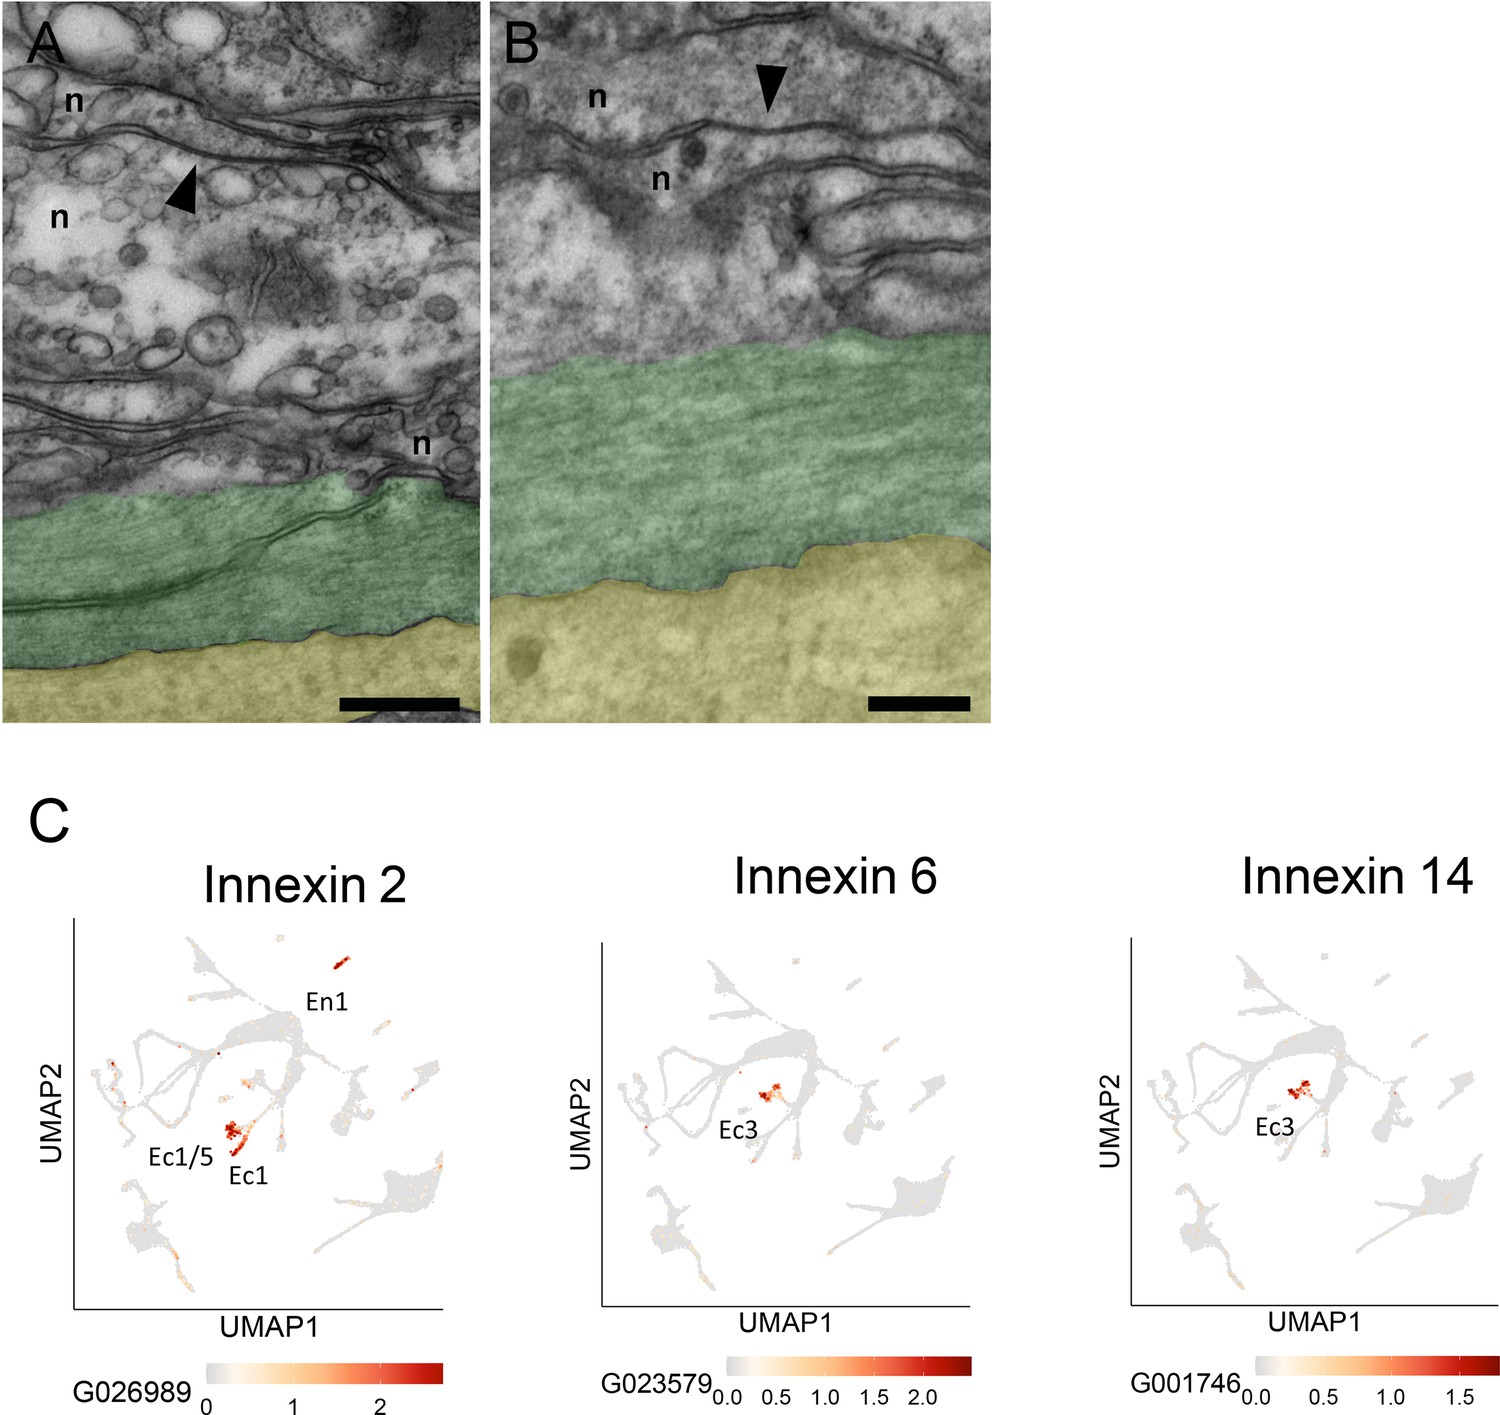
Gap junctions and innexins.
(A and B) Transmission electron microscopy (TEM) images of longitudinal sections in the mid-body column of the ectoderm show neurite bundles running along muscle processes. Gap junctions connecting two neurites (n) are indicated by black arrowheads. To facilitate identification, muscle processes are overlaid in green and the mesoglea in yellow. Scale bar: 2 µm. (C) Innexin genes 2, 6, and 14 are uniquely expressed in specific nerve cell populations. UMAPs show expression (orange spots) of individual innexin genes in specific nerve cell populations: innexin2 in Ec1/5 and Ec1 in the ectoderm and En1 in the endoderm; innexin6 and innexin14 in Ec3 in the ectoderm. The UMAP identifying cell populations is shown as a gray background. Data from Cazet et al., 2023. See https://biowebprod22.nhgri.nih.gov/HydraAEP/SingleCellBrowser/.
Figure 13
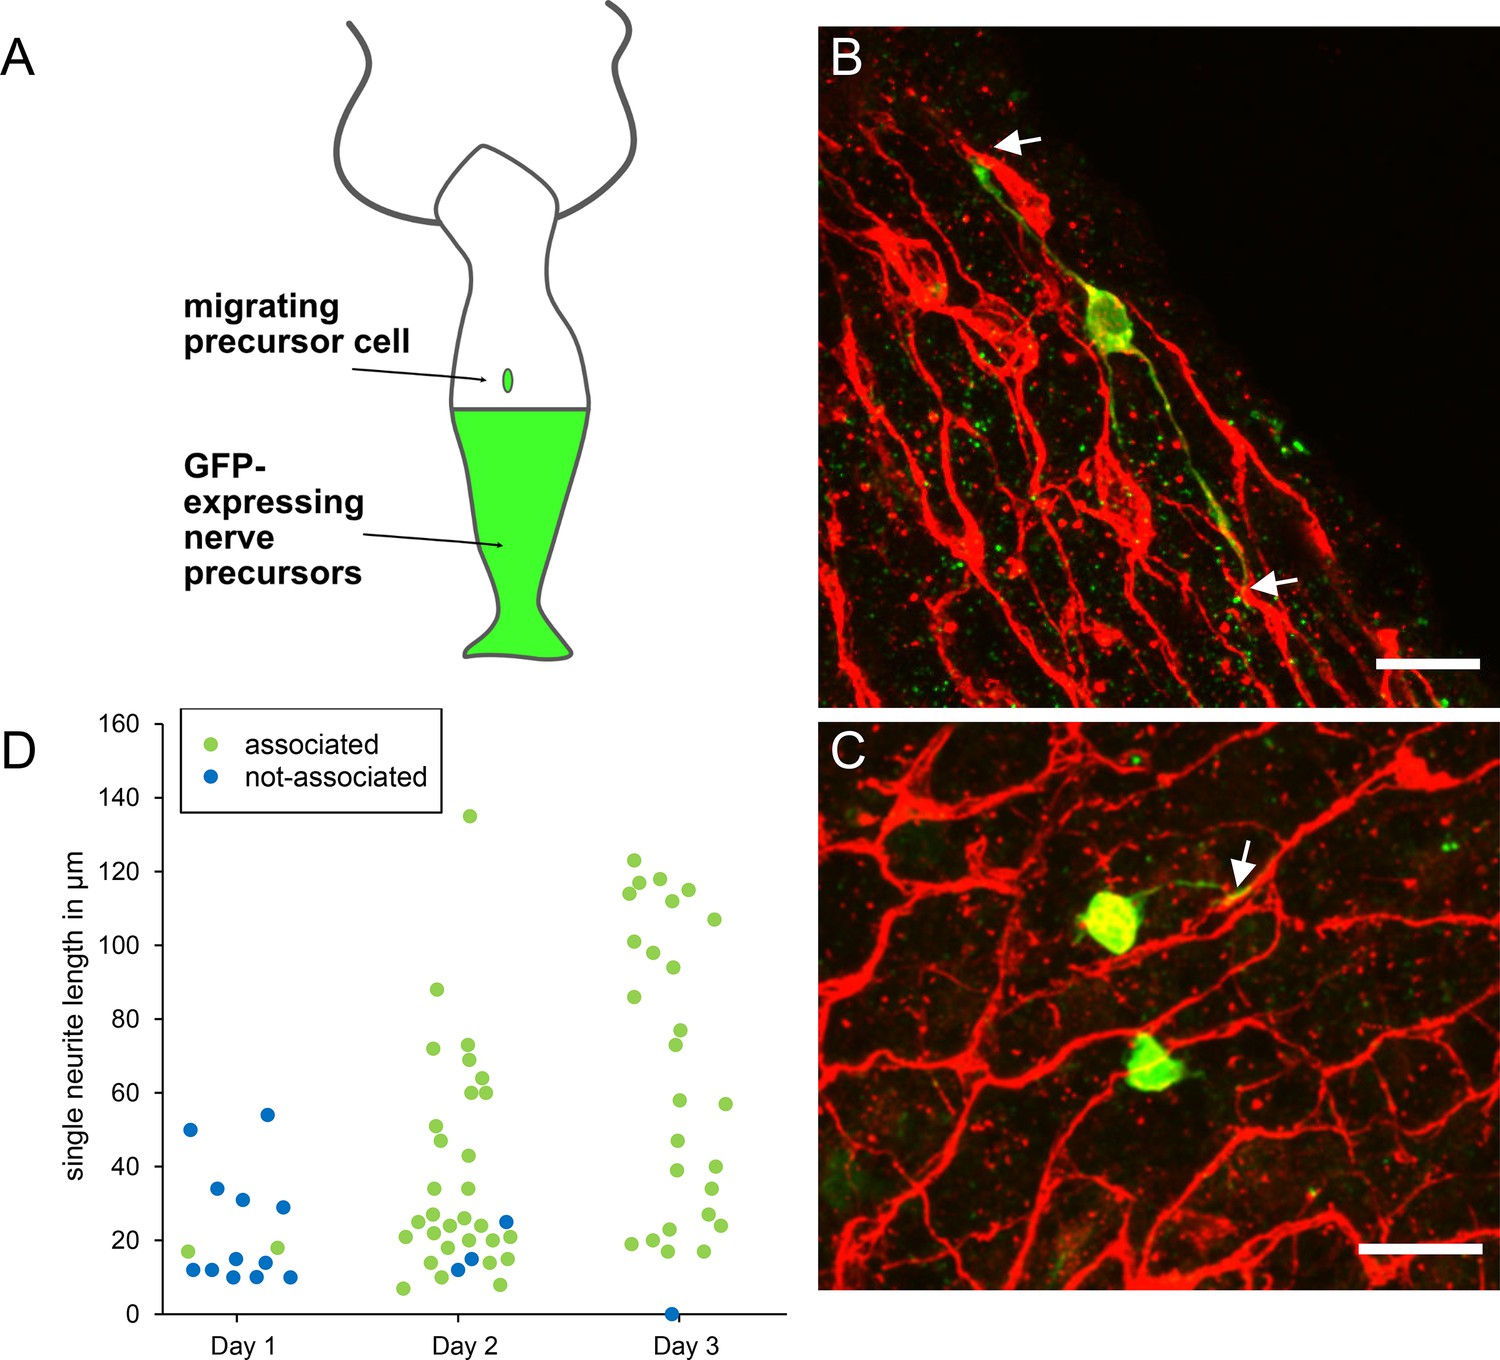
Differentiation of migrating nerve cell precursors in AEP (top)/nGreen (bottom) grafts stained with pan-neuronal antibody (PNab).
(A) Schematic of AEP/nGreen graft. (B and C) Two images of differentiating nerve cell precursors (nGreen) on day 2 after grafting. Nerve net stained with PNab (red). White arrows mark association of nGreen neurites with the red nerve net. Differentiating nGreen nerve cells are stained with PNab and hence appear yellowish in the images. (D) Neurite outgrowth and association with the nerve net on days 1–3 after grafting. Each spot represents one nGreen nerve cell. Scale bars: 15 µm.
Figure 14
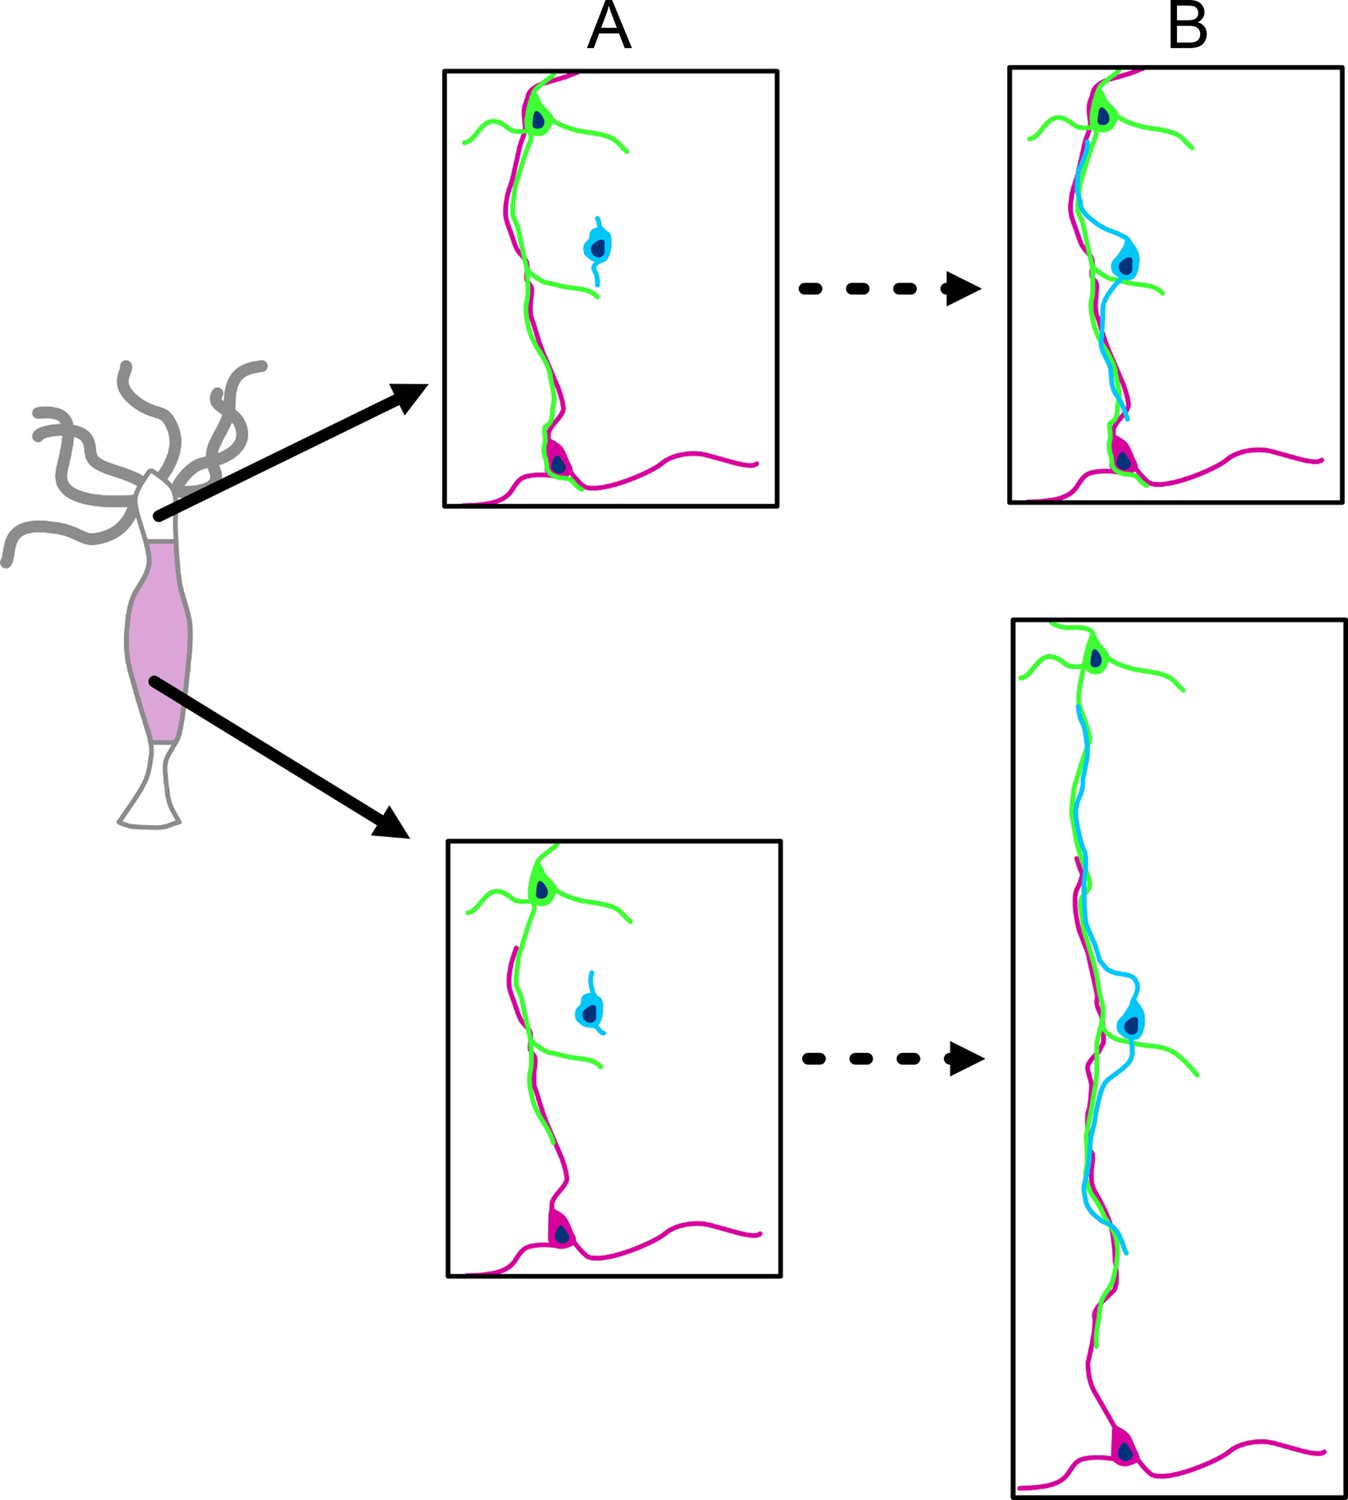
Schematic diagram of nerve net growth by lateral association of newly differentiated nerve cells (blue) with the pre-existing nerve net (green and red).
Upper images: the base of tentacles; lower images: the middle of the body column. The images are approximately to scale and show changes associated with tissue growth. (A) Nerve net at t0. (B) Nerve net during tissue growth. Lower image pair: new nerve cell (blue) attaches laterally to the nerve net (as shown in Figure 13) and thus maintains the ratio of nerve cells to epithelial cells during growth of the nerve net. Upper image pair: new nerve cell attaches laterally to the nerve net at the base of a tentacle. The nerve net does not grow at this position but is displaced into the tentacle. Newly differentiated nerve cells thus increase the ratio of nerve cells to epithelial cells in the ectoderm of the tentacle (see Figure 6).
Figure 15
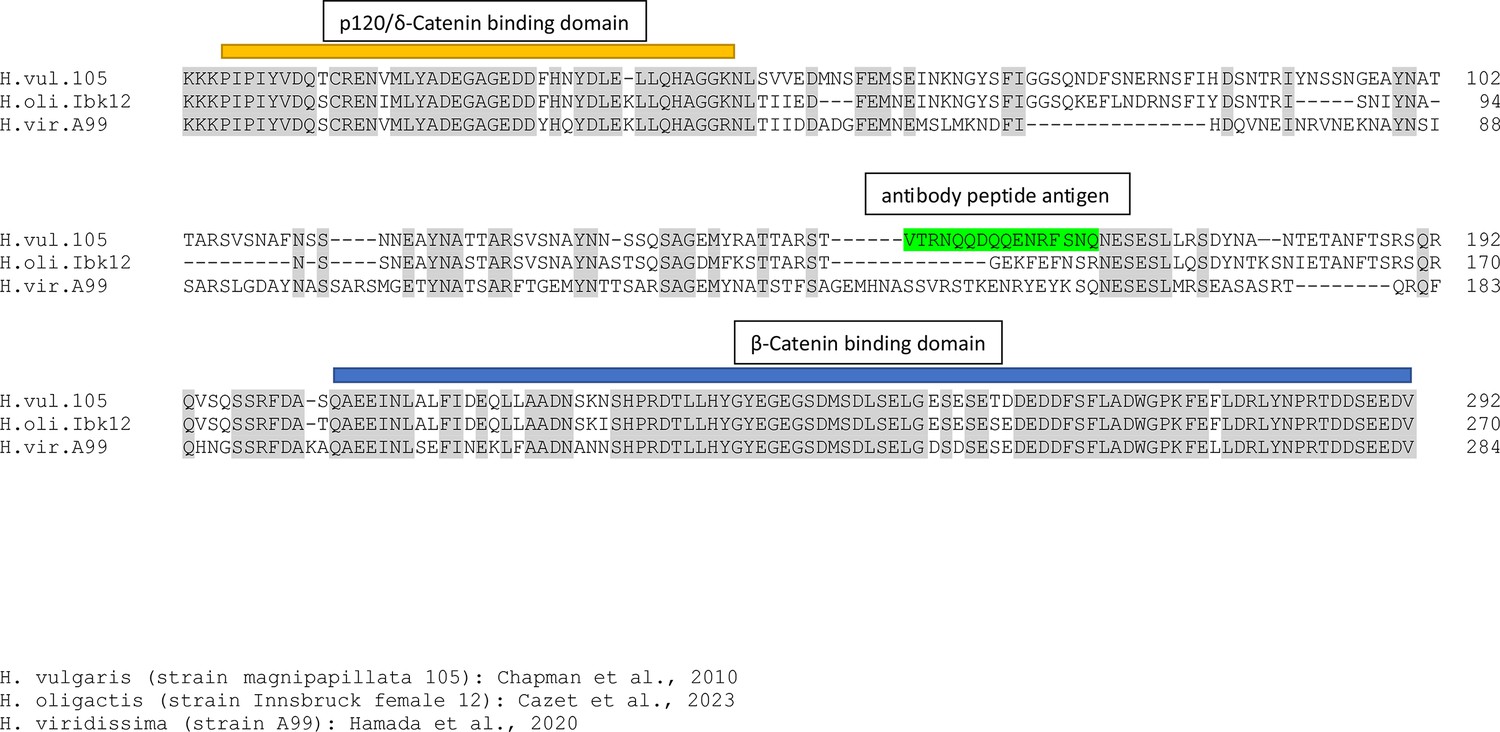
Sequence alignment of the intracellular domains of classic cadherin proteins from H. vulgaris (strain 105), H. oligactis, and H. viridissima.
The p120/delta-catenin and the beta-catenin binding domains are highly conserved in all three species and anchor the alignment. The sequence between these two conserved domains is quite variable and, in particular, the 18 amino acid sequence (green) used to make the pan-neuronal antibody (PNab) is only present in the H. vulgaris sequence.
Additional files
Download links
A two-part list of links to download the article, or parts of the article, in various formats.
Downloads (link to download the article as PDF)
Open citations (links to open the citations from this article in various online reference manager services)
Cite this article (links to download the citations from this article in formats compatible with various reference manager tools)
A new look at the architecture and dynamics of the Hydra nerve net
eLife 12:RP87330.
https://doi.org/10.7554/eLife.87330.3


