Mitochondrial electron transport chain, ceramide, and coenzyme Q are linked in a pathway that drives insulin resistance in skeletal muscle
- Charles Perkins Centre, School of life and Environmental Sciences, University of Sydney, Australia
- Charles Perkins Centre and School of Medical Sciences, Faculty of Medicine and Health, University of Sydney, Australia
- Cellular Bioenergetics Laboratory, Victor Chang Cardiac Research Institute, Australia
- Center for Computational Biology and Center for Computational Mathematics, Flatiron Institute, United States
- School of Chemistry, UNSW Sydney, Australia
- Division of Endocrinology, Metabolism, and Diabetes, University of Colorado Anschutz Medical Campus, United States
- Lilly Research Laboratories, Division of Eli Lilly and Company, United States
Figures
Figure 1 with 2 supplements
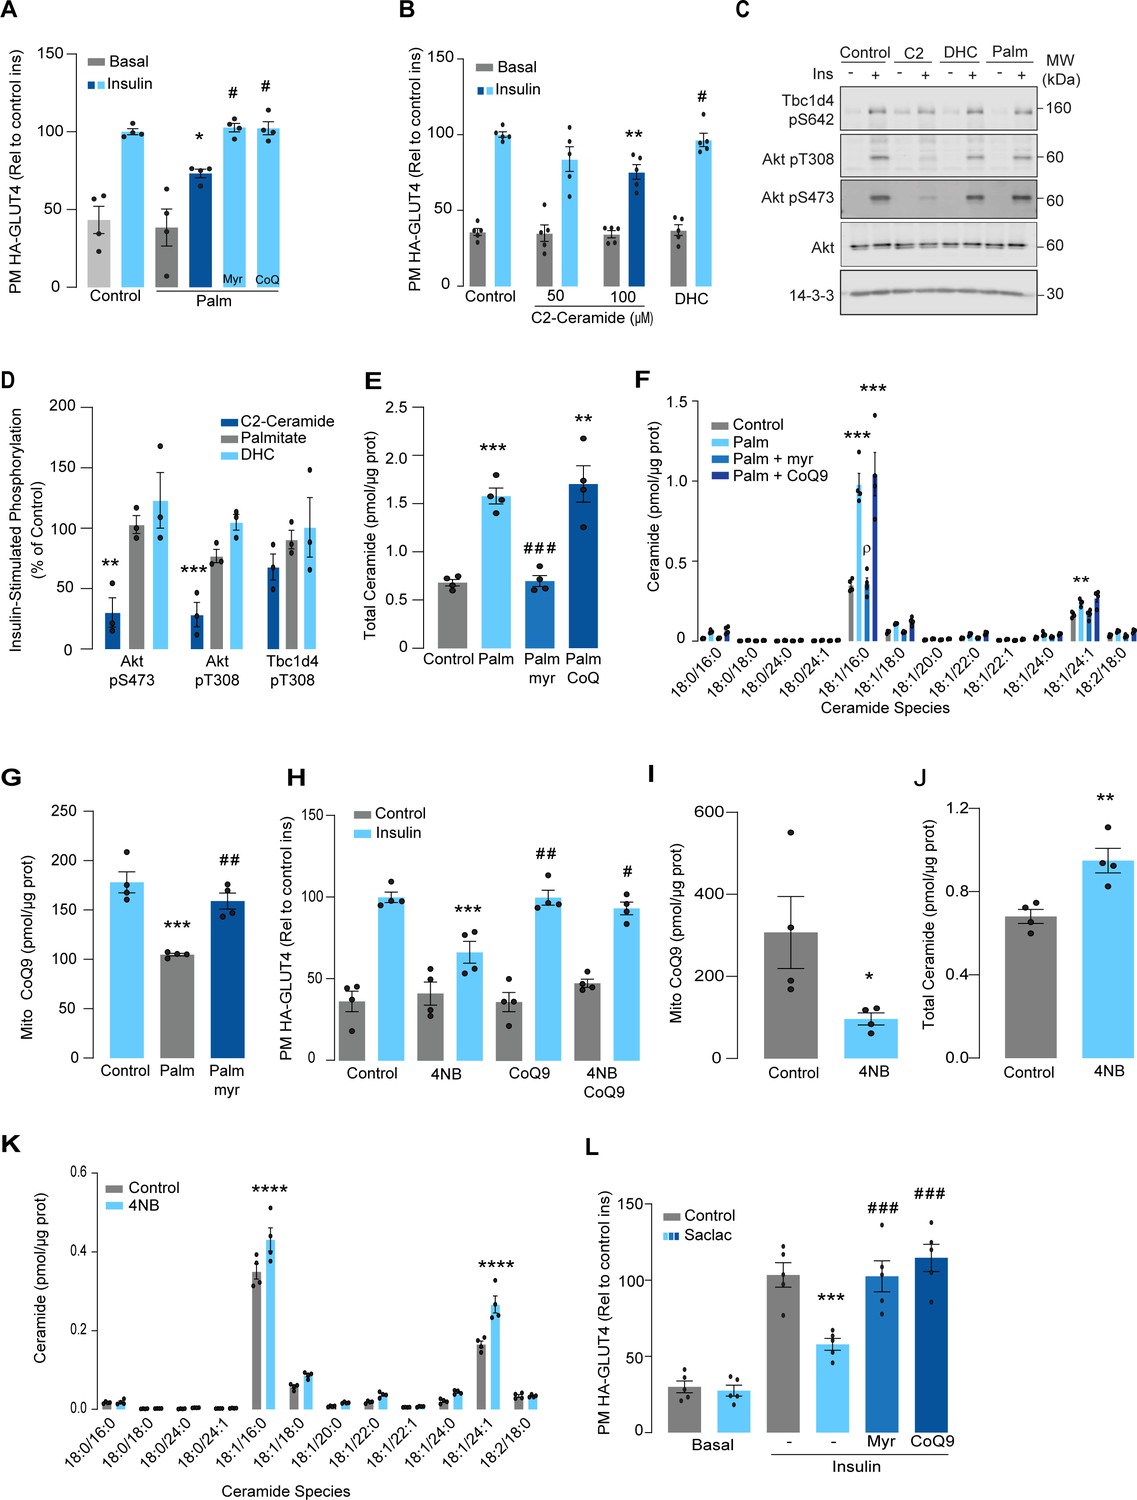
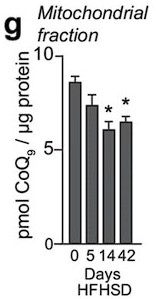
Palmitate increases ceramides, decreases coenzyme Q (CoQ), and induces insulin resistance in L6 myotubes.
(A) Insulin-induced GLUT4 translocation in L6-HA-GLUT4 myotubes exposed to palmitate (150 μM for 16 hr, Palm) or BSA (Control) in the presence of DMSO (Control), myriocin (10 μM for 16 hr), or CoQ9 (10 μM for 16 hr). Plasma membrane GLUT4 (PM-GLUT4) abundance was normalized to insulin-treated control cells. N = 4 biological replicates, mean ± SEM. *p<0.05 vs Control ins, # p<0.5 vs Palm ins. (B) Insulin-induced GLUT4 translocation in L6-HA-GLUT4 myotubes exposed to C2-ceramide, dihydroceramide (100 μM, DHC) or DMSO (Control) for 2 hr. Plasma membrane GLUT4 (PM-GLUT4) abundance was normalized to insulin-treated control cells. N = 5 biological replicates, mean ± SEM. **p<0.01 vs Control ins, # p<0.5 vs 100 μM C2-ceramide ins. (C, D) L6-HA-GLUT4 myotubes were serum-starved after BSA (Control for 16 hr), palmitate (Palm for 16 hr), C2-ceramide (100 μM for 2 hr, C2), or DHC (100 μM for 2 hr) treatment and acute insulin (Ins) was added where indicated. Phosphorylation status of indicated sites was assessed by immunoblot (C). Immunoblots were quantified by densitometry and normalized to insulin-treated control cells (indicated by dotted line). N = 3 biological replicates, mean ± SEM. **p<0.01, ***p<0.001. (E, F) Endogenous ceramides levels in L6-HA-GLUT4 myotubes treated for 16 hr with BSA (control), palmitate (150 μM, Palm), myriocin (10 μM for 16 hr), or CoQ (10 μM for 16 hr) as indicated in the graph. Total (E) and specific (F) ceramide species were quantified. N = 4 biological replicates, mean ± SEM. **p<0.01, ****p<0.001 vs Control, ###p<0.001 vs Palm, ρp<0.01 vs Palm. (G) CoQ9 level in mitochondrial fraction obtained from L6-HA-GLUT4 myotubes. N = 4 biological replicates, mean ± SEM. ***p<0.001 vs Control, ##p<0.01 vs Palm. (H) Insulin-induced GLUT4 translocation in L6-HA-GLUT4 myotubes exposed to 4-NB (2.5 mM for 16 hr) or DMSO (Control) in the presence of CoQ9 (10 μM for 16 hr). Plasma membrane GLUT4 (PM-GLUT4) abundance was normalized to insulin-treated control cells. N = 4 biological replicates, mean ± SEM. ***p<0.001 vs Control ins, ##p<0.01, ###p<0.001 vs 4NB. (I) CoQ9 level in mitochondrial fraction obtained from L6-HA-GLUT4 myotubes exposed to DMSO (Control) or 4NB for 16 hr. N = 4 biological replicates, mean ± SEM. *p<0.05 (J, K) Total (J) and specific (K) ceramide species quantified in L6-HA-GLUT4 myotubes treated for 16 hr with DMSO (control) or 4NB (2.5 mM for 16 hr). N = 4 biological replicates, mean ± SEM. **p<0.01, ****p<0.0001. (L) Insulin-induced GLUT4 translocation in L6-HA-GLUT4 myotubes exposed to Saclac (10 μM for 24 hr) or EtOH (Control) in the presence of DMSO (control), myriocin (10 μM for 16 hr), or CoQ9 (10 μM for 16 hr). Plasma membrane GLUT4 (PM-GLUT4) abundance was normalized to insulin-treated control cells. N = 5 biological replicates, mean ± SEM. ***p<0.001 vs Control Ins, ### p<0.001 vs Saclac Ins.
Figure 1—figure supplement 1
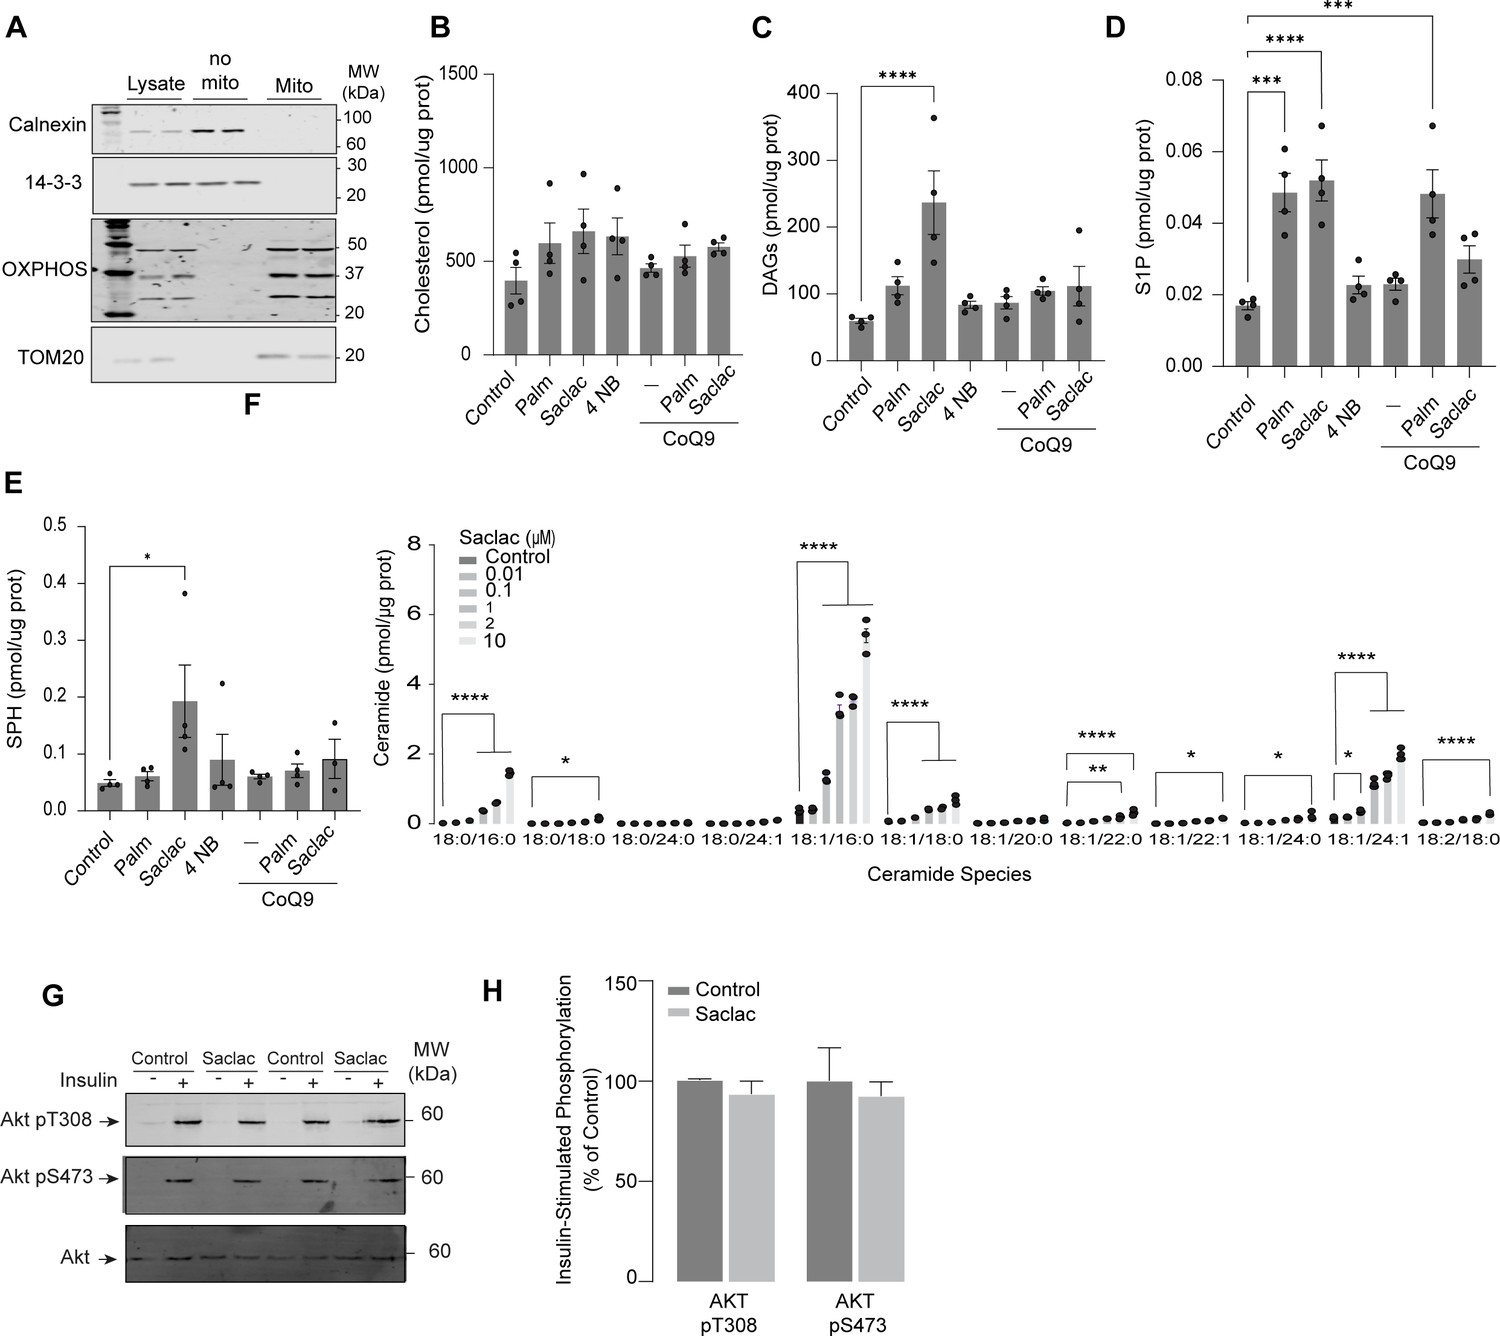
Inhibiting ceramidases is sufficient to decrease CoQ levels, leading to insulin resistance.
(A) Mitochondrial-enriched fraction from L6 myotubes. Calnexin was used as a marker of endoplasmic reticulum. OXPHOS: oxidative phosphorylation system. Cholesterol (B), diacylglycerol (DAGs) (C), sphingosine-1 phosphate (S1P) (D), and sphingosine (SPH) (E) abundance in L6 myotubes exposed to different compounds (as indicated). Lipid abundance was determined by lipidomics and normalized against protein concentration. N = 4, mean ± SEM. ***p<0.001, ****p<0.0001. (F) Concentration of endogenous ceramide in L6-HA-GLUT4 myotubes treated for 24 hr with EtOH (Control) or different concentrations of Saclac. N = 3, mean ± SEM. *p<0.05, **p<0.01, ****p<0.0001. (G, H) L6-HA-GLUT4 myotubes were serum-starved after EtOH (Control) or Saclac (10 μM) treatment (for 24 hr) and acute insulin (Ins) was added where indicated. Phosphorylation status of indicated sites was assessed by immunoblot. Immunoblots were quantified by densitometry and normalized to insulin-treated control cells. N = 2, mean ± SEM.
Figure 1—figure supplement 2
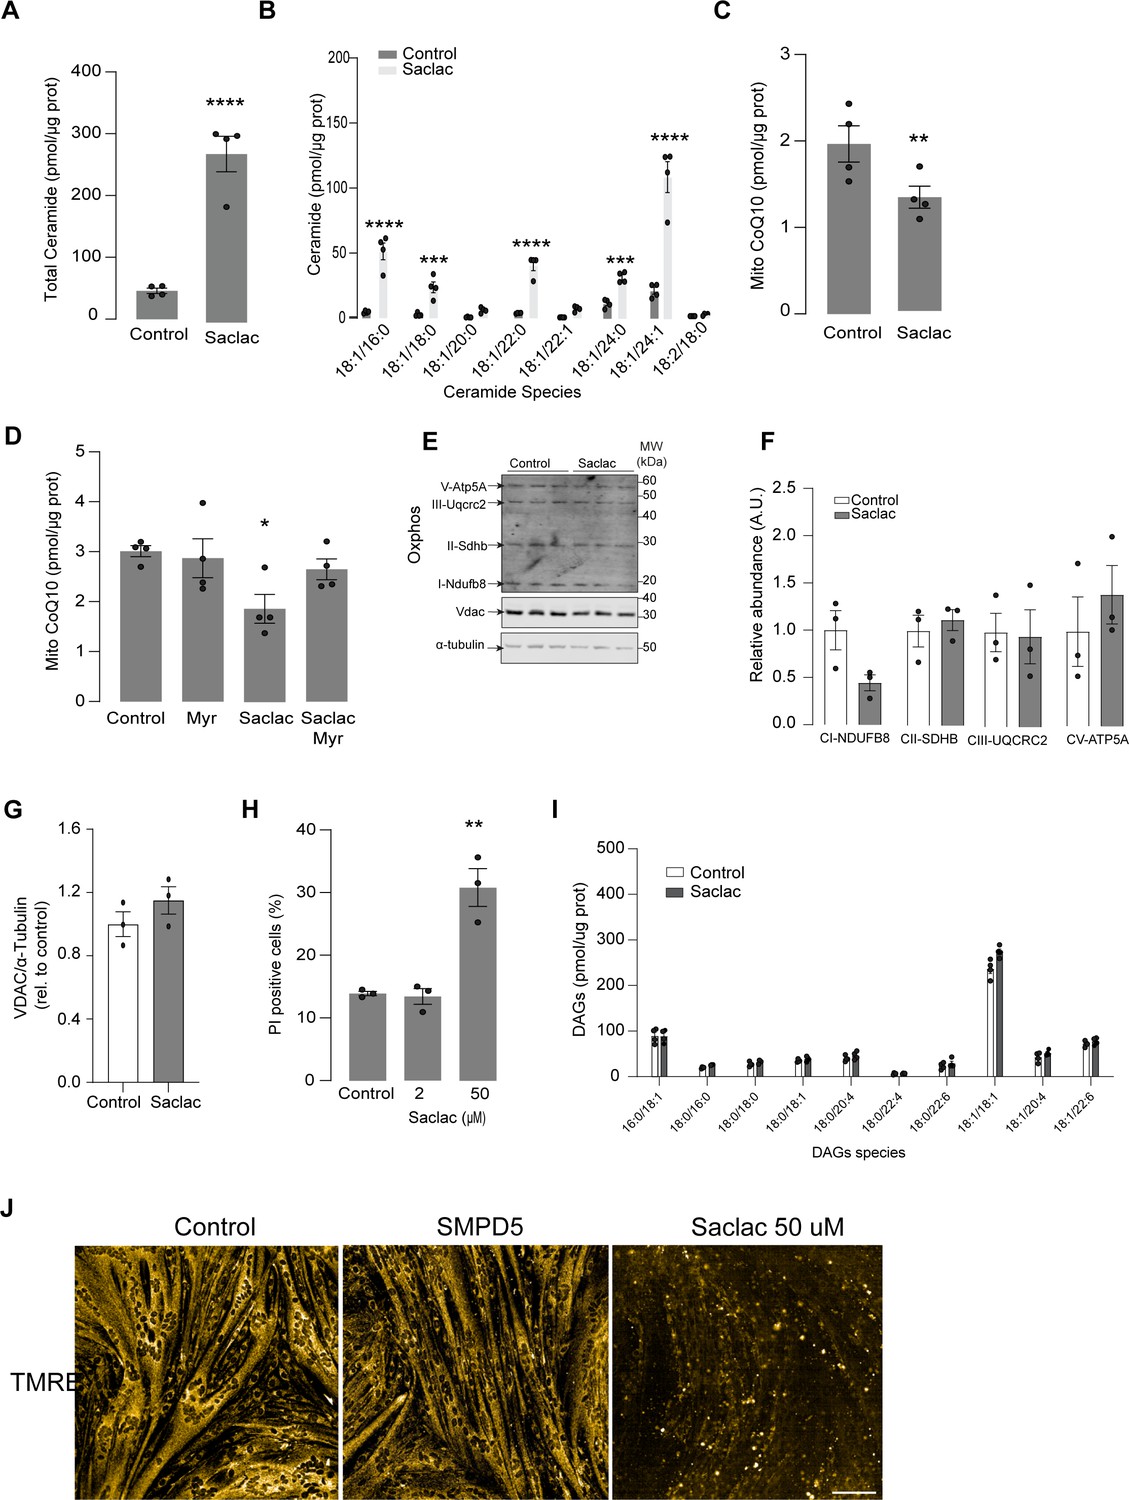
Inhibtion of ceramidases induces CoQ depletion in human cell line.
(A, B) Total (A) and specific (B) ceramide species quantified in HeLa cells treated for 24 hr with Saclac (2 uM for 24 hr) or vehicle control (EtOH, Control) as indicated. N = 4, mean ± SEM. **p<0.01, ****p<0.0001 vs Control. (C) CoQ10 levels in the mitochondrial fraction obtained from HeLa cells exposed to different concentrations of Saclac or vehicle control. N = 4, mean ± SEM. *p<0.05. (D) CoQ10 levels in the mitochondrial fraction obtained from HeLa cells exposed to different concentrations of Saclac (2 μM for 24 hr) or control in the presence or absence of myriocin (10 μM for 16 hr). N = 4, mean ± SEM. *p<0.05. (E–G) Mitochondrial abundance markers determined by western blot in HeLA cells exposed to 2 uM of Saclac for 24 hr. (F, G) Immunoblots were quantified by densitometry and normalized to control cells. N = 3, mean ± SEM. (H) Percentage of nonviable HeLa cells determined by propidium iodide (PI) staining and microscopy, following a 24 hr treatment with Saclac. N = 3, mean ± SEM. **p<0.01. (I) Specific diacylglycerol species were quantified in HeLA cells exposed to Saclac vs Control. Lipid abundance was determined by lipidomics and normalized against protein concentration. N = 4, mean ± SEM. *p<0.001, ****p<0.0001. (J) L6 myotubes were loaded with TMRE (20 nM) for 20 min in control cells, SMPD5-overexpressing cells, and cells treated with Saclac (50 uM) for 24 hr.
Figure 2 with 1 supplement
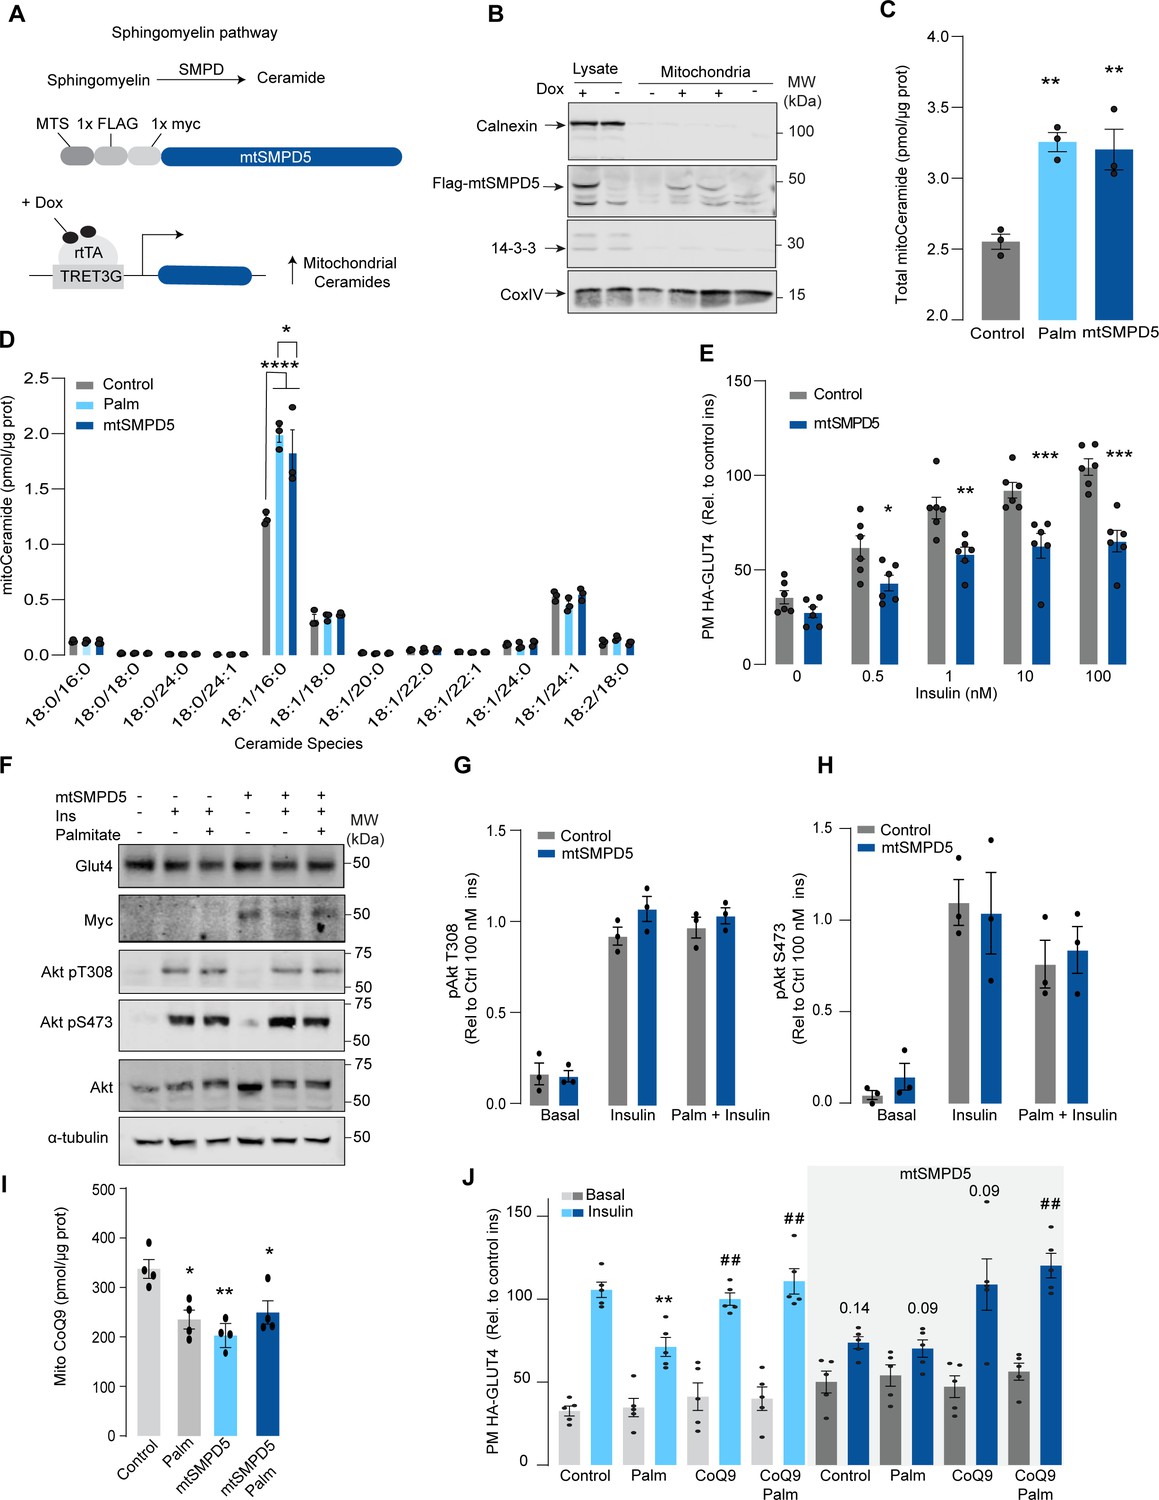
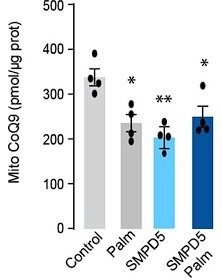
Mitochondrial overexpression of SMPD5 induces insulin resistance by lowering CoQ9 in L6 myotubes.
(A) Schematic representation of doxycycline-inducible overexpression of mitochondrial-targeted sphingomyelinase 5 (SMPD5). L6-HA-GLUT4 myotubes were exposed to 1 μg/mL of doxycycline from day 3 to day 6 of differentiation. Experiments were performed on day 7 of differentiation. (B) Determination of SMPD5 expression in mitochondrial fraction obtained from L6-HA-GLUT4. Doxycycline was added where indicated. (C, D) Levels of endogenous ceramides in mitochondrial fraction from L6-HA-GLUT4 myotubes treated with BSA (Control), palmitate (150 μM for 16 hr, Palm), or doxycycline. Total (C) and specific (D) ceramide species were quantified. N = 3 biological replicates, mean ± SEM. *p<0.05, **p<0.01, ****p<0.0001 vs Control. (E) Insulin-induced GLUT4 translocation in L6-HA-GLUT4 myotubes exposed to doxycycline (1 μg/mL for 3 d). Plasma membrane GLUT4 (PM-GLUT4) abundance was normalized to 100 nM insulin-treated control cells. N = 6 biological replicates, mean ± SEM. *p<0.05, **p<0.01, ***p<0.001 vs Control ins. (F–H) L6-HA-GLUT4 myotubes were serum-starved after BSA (Control), palmitate (150 μM for 16 hr, Palm), or doxycycline (1 μg/mL for 3 d) treatment and acute insulin (Ins) was added where indicated. Phosphorylation status of indicated sites was assessed by immunoblot. Immunoblots were quantified by densitometry and normalized to insulin-treated control cells (indicated by dotted line). N = 3 biological replicates, mean ± SEM. * p<0.05, *** p<0.001 vs Basal. (I) CoQ9 level in mitochondrial fraction obtained from L6-HA-GLUT4 myotubes exposed to doxycycline (1 μg/mL for 3 d). N = 4 biological replicates, mean ± SEM. **p<0.001. (J) Insulin-induced GLUT4 translocation in L6-HA-GLUT4 myotubes exposed to doxycycline (1 μg/mL for 3 d). Control or doxycycline-treated cells were exposed to BSA (Control), palmitate (150 μM for 16 hr, Palm), or CoQ9 (10 μM for 16 hr). Plasma membrane GLUT4 (PM-GLUT4) abundance was normalized to insulin-treated control cells. N = 5 biological replicates, mean ± SEM. **p<0.01 vs Control ins, ## p<0.01 vs Palm ins.
Figure 2—figure supplement 1
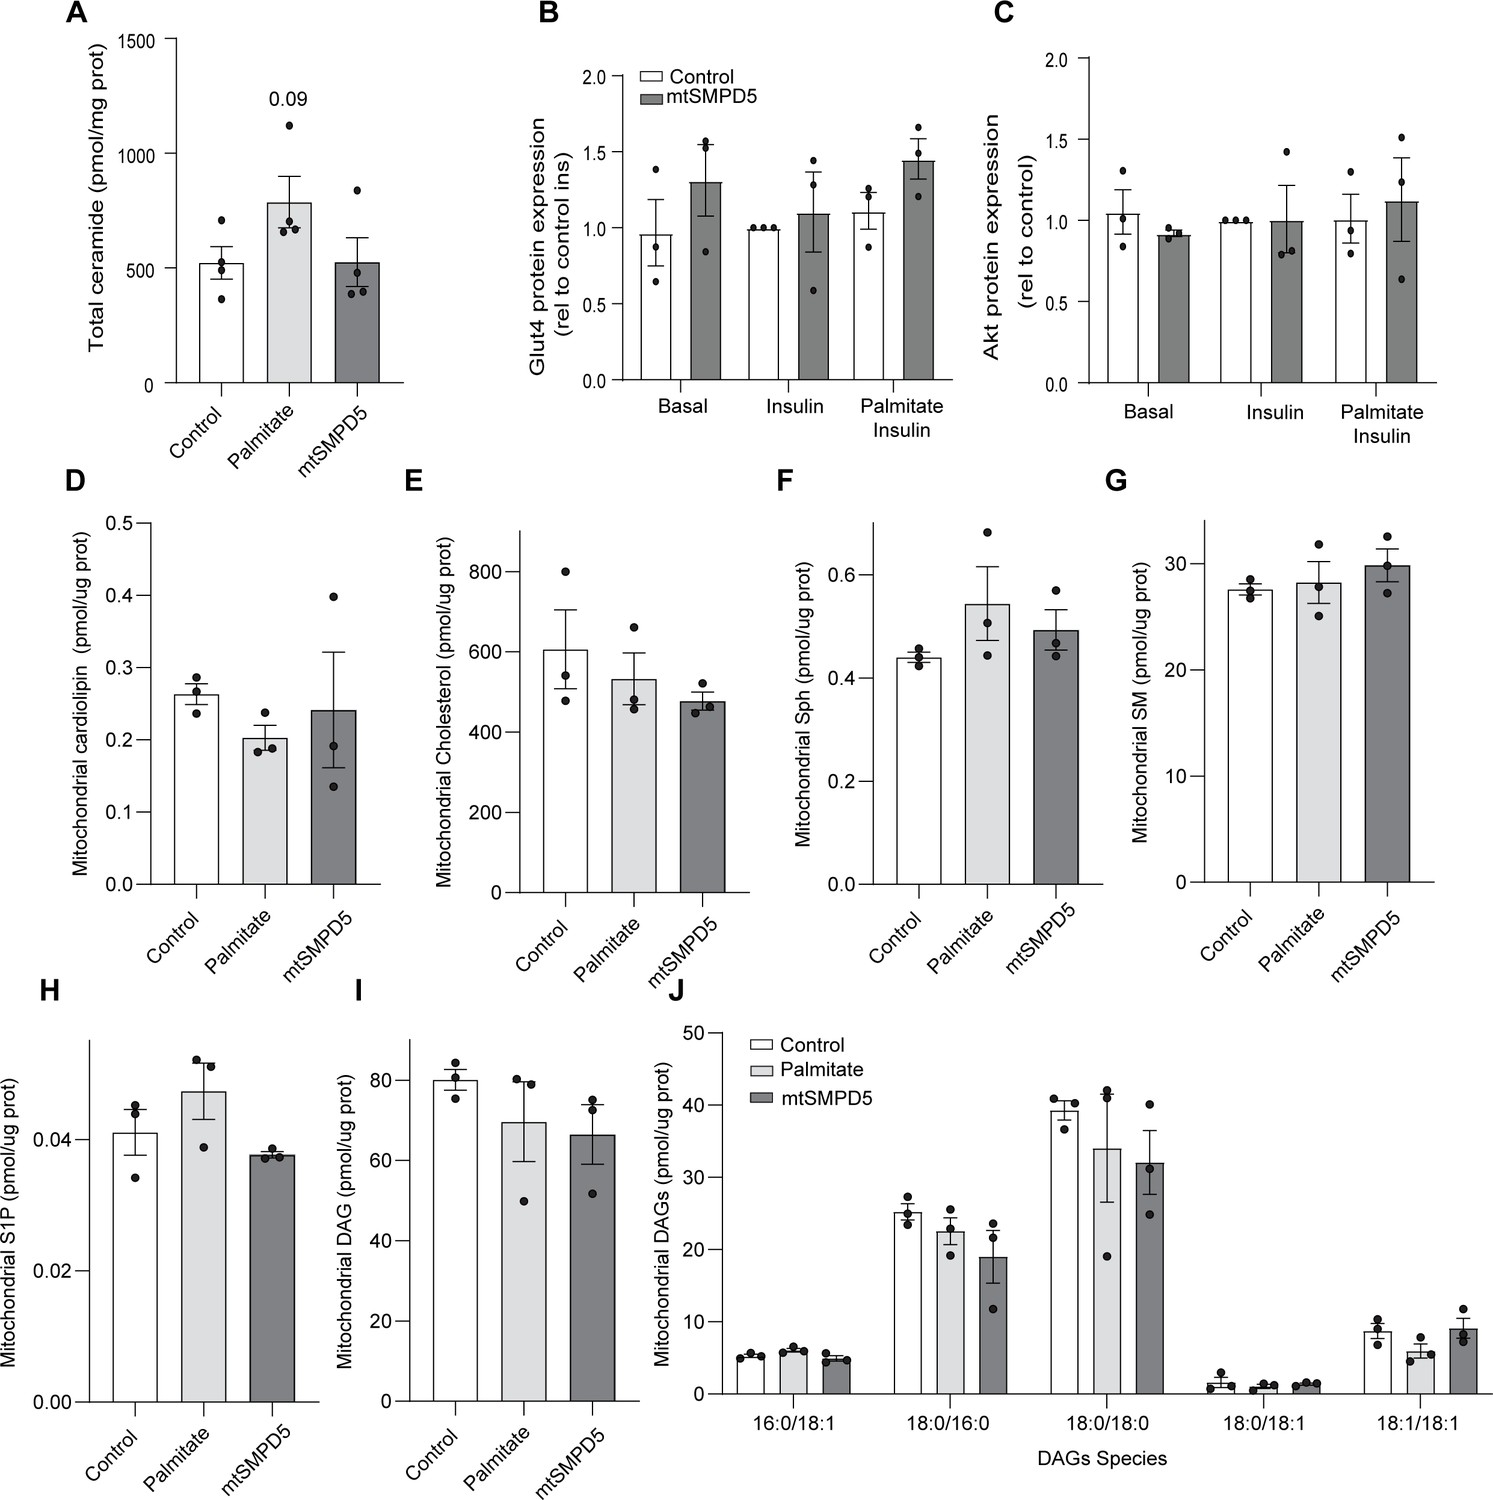
The overexpression of mtSMPD5 selectively increases mitochondrial ceramides.
(A) Total ceramide levels extracted from whole lysate of L6 myotubes exposed to different treatments (as indicated). (B, C) Densitometric analysis of Figure 3F of selected proteins (as indicated). Mitochondrial levels of cardiolipin (D), cholesterol (E), sphingosine (F), sphingomyelin (G), sphingosine-1 phosphate (H), and diacylglycerol (I, J) (as indicated) were determined by lipidomics and normalized against mitochondrial protein concentration. Cells were exposed to doxycycline for 3 d for SMPD5 induction. N = 3, mean ± SEM. ****p<0.0001.
Figure 3 with 2 supplements
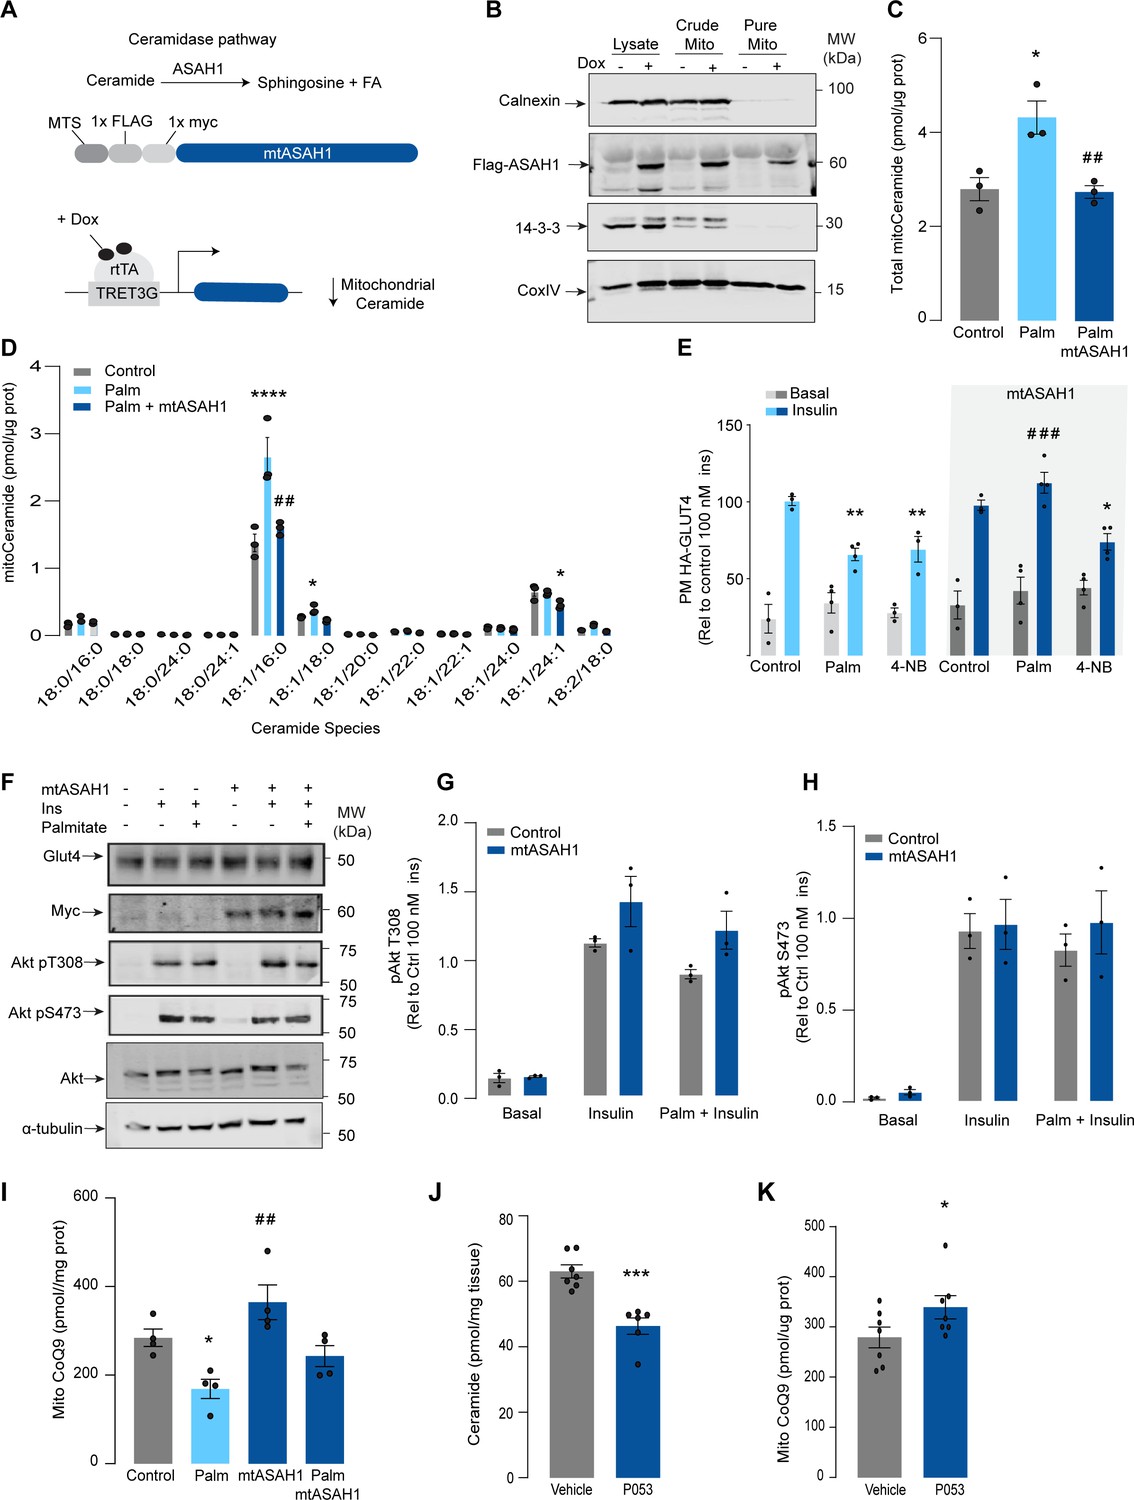
Mitochondrial overexpression of ASAH1 protects against insulin resistance and increases coenzyme Q (CoQ) levels in L6 myotubes.
(A) Schematic representation of doxycycline-inducible overexpression of mitochondrial-targeted acid ceramidase 1 (ASAH1). L6-HA-GLUT4 myotubes were exposed to 1 μg/mL of doxycycline from day 3 to day 6 of differentiation. Experiments were performed on day 7 of differentiation. (B) Determination of ASAH1 expression in mitochondrial fraction obtained from L6-HA-GLUT4. Doxycycline was added where indicated. (C, D) Endogenous ceramides levels in mitochondrial fraction from L6-HA-GLUT4 myotubes treated with BSA (Control), palmitate (150 μM for 16 hr, Palm), or doxycycline. Total (C) and specific (D) ceramide species were quantified. N = 3 biological replicates, mean ± SEM. *p<0.05 vs Control, ##p<0.01 vs Palm. (E) Insulin-induced GLUT4 translocation in L6-HA-GLUT4 myotubes exposed to doxycycline (1 μg/mL for 3 d). Control or doxycycline-treated cells were exposed to BSA (control), palmitate (150 μM for 16 hr, Palm), or 4NB (2.5 mM for 16 hr). Plasma membrane GLUT4 (PM-GLUT4) abundance was normalized to insulin-treated control cells. N = 6 biological replicates, mean ± SEM. **p<0.01 vs Control ins, ### p<0.001 vs Palm ins. (F–H) L6-HA-GLUT4 myotubes were serum-starved after BSA (Control), palmitate (150 μM for 16 hr, Ppalm), or doxycycline (1 μg/mL for 3 d) treatment and acute insulin (Ins) was added where indicated. Phosphorylation status of indicated sites was assessed by immunoblot. Immunoblots were quantified by densitometry and normalized to insulin-treated control cells (indicated by dotted line). N = 3 biological replicates, mean ± SEM. ***p<0.001 vs Basal, # p<0.05 vs Control ins. (I) CoQ9 level in mitochondrial fraction obtained from L6-HA-GLUT4 myotubes exposed to doxycycline (1 μg/mL for 3 d). Control or doxycycline treated cells were exposed to BSA (Control) or palmitate (150 μM for 16 hr, Palm) N = 4 biological replicates, mean ± SEM. *p<0.05 vs Control, ## p<0.01 vs Palm. (J) Levels of total ceramides in skeletal muscle of mice fed chow with vehicle or 5 mg/kg P053 for 6 wk. N = 7 mice per group, mean ± SEM. ***p<0.001. (K) Levels of CoQ in mitochondrial fraction isolated from skeletal muscle of mice fed chow with vehicle or 5 mg/kg P053 for 6 wk. N = 7 mice per group, mean ± SEM. *p<0.05.
Figure 3—figure supplement 1
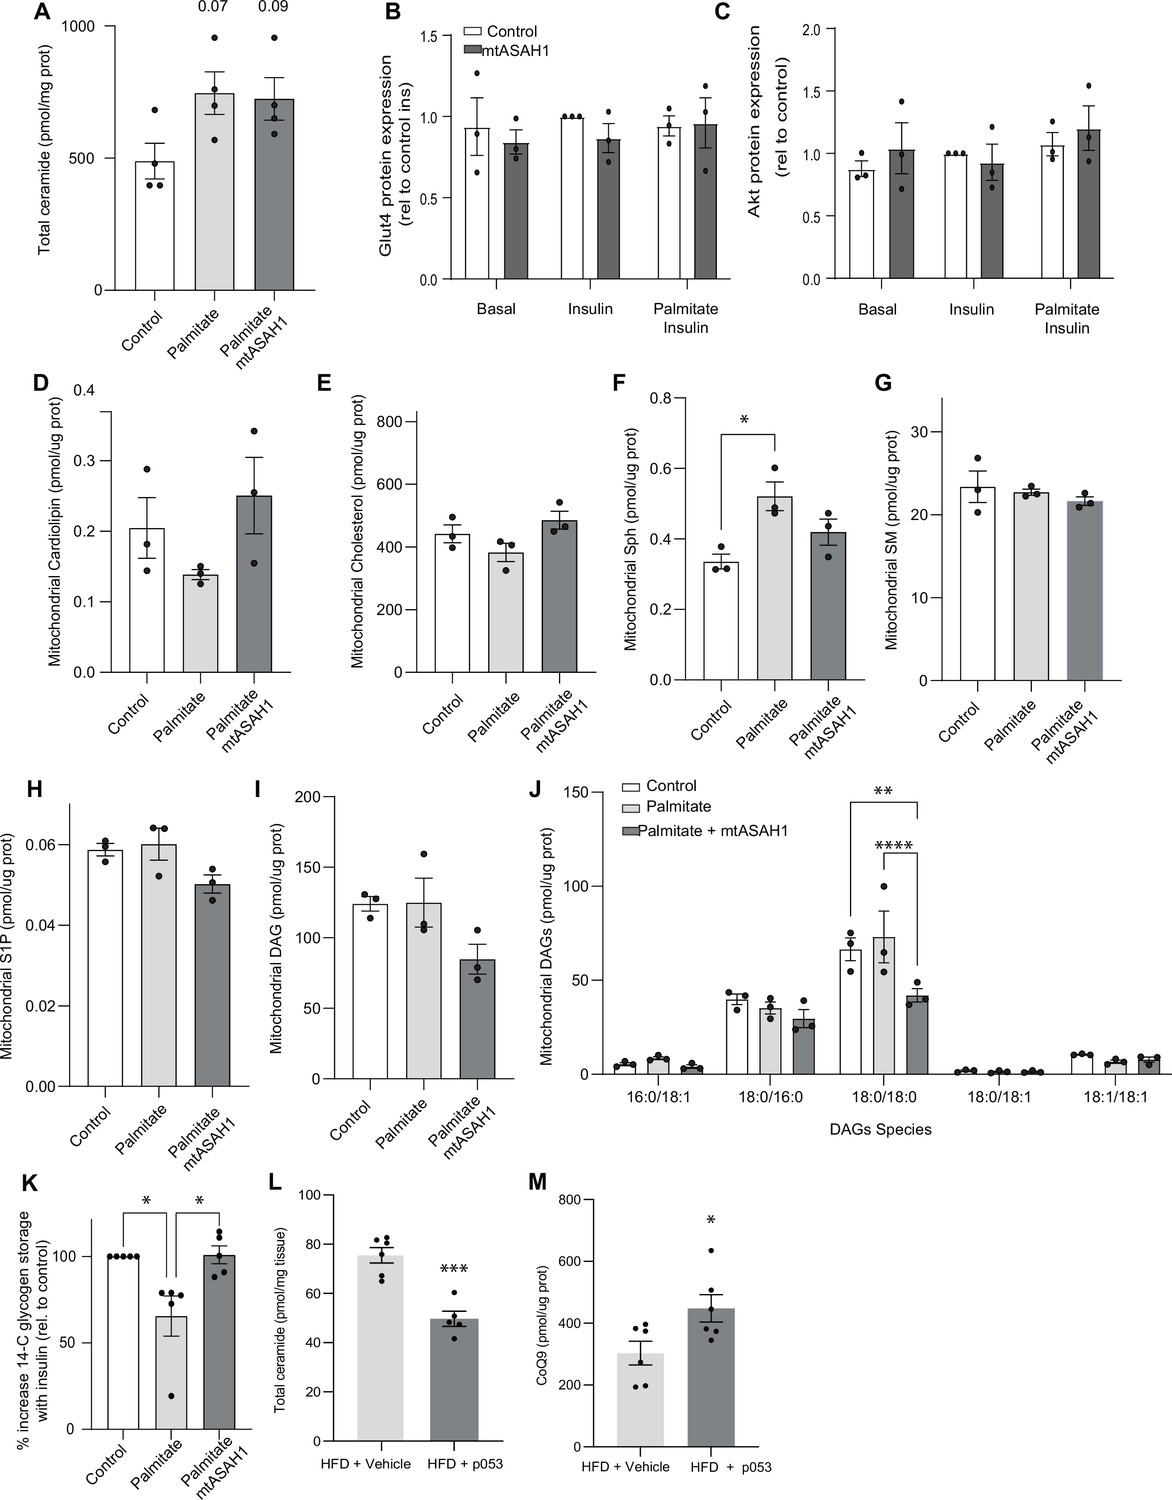
The overexpression of mtASAH1 decreases DAGs in palmitate-treated cells.
(A) Total ceramide levels extracted from whole lysate of L6 myotubes exposed to different treatments (as indicated). (B, C) Densitometric analysis of Figure 3F of selected proteins (as indicated). Mitochondrial levels of cardiolipin (D), cholesterol (E), sphingosine (F), sphingomyelin (G), sphingosine-1 phosphate (H), and diacylglycerol (I, J) (as indicated) were determined by lipidomics and normalized against mitochondrial protein concentration. Cells were exposed to doxycycline for 3 d for ASAH1 induction. N = 3, mean ± SEM. *p<0.05, **p<0.01, ****p<0.0001. (K) Insulin-induced glycogen synthesis. L6 myotubes were exposed to different treatments (as indicated) and glycogen storage was measured by 14C glucose (as indicated in the ‘Materials and methods’ section). Data is expressed as a percentage of increased 14-glycogen after insulin stimulation relative to control cells. N = 4, mean ± SEM. *p<0.05. (H, I) Total ceramides (H) and mitochondrial coenzyme Q (CoQ) levels (I) in skeletal muscle from mice exposed to a high-fat diet and exposed to either vehicle (DMSO) or the inhibitor of CerS1 P053 (5 mg/kg) in drinking water for 6 wk as described in Turner et al., 2018. N = 6, mean ± SEM. *p<0.05, *** p<0.001 vs Control.
Figure 3—figure supplement 2
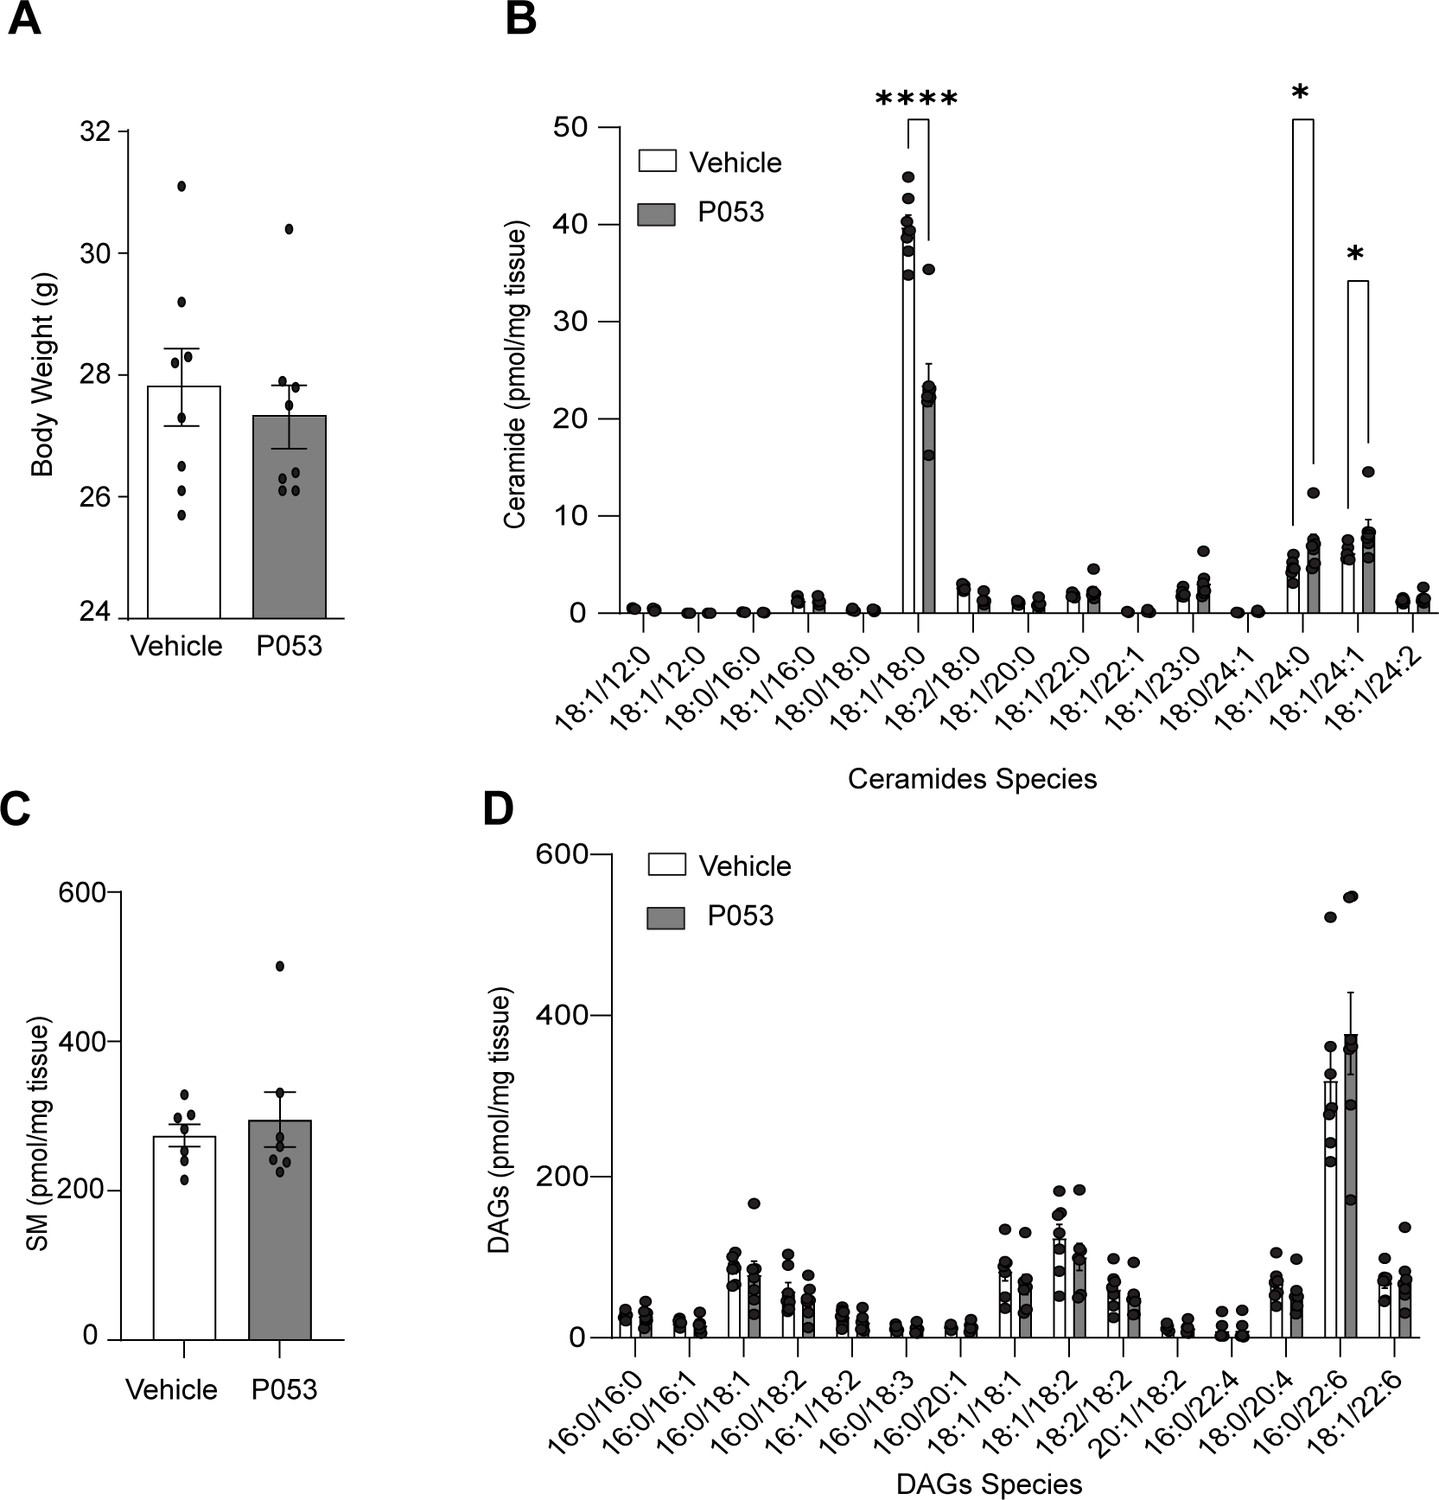
Lipidomic analysis of mice exposed to the CerS1 inhibitor P053.
(A) Body weight of mice exposed to either vehicle (DMSO) or the inhibitor of CerS1 P053 (5 mg/kg) in drinking water for 6 wk. (B) Ceramide, (C) sphingomyelin, and (D) diacylglycerol species were determined in skeletal muscle by lipidomics and normalized against mg of tissue. N = 6, mean ± SEM. *p<0.05, ****p<0.0001.
Figure 4 with 1 supplement
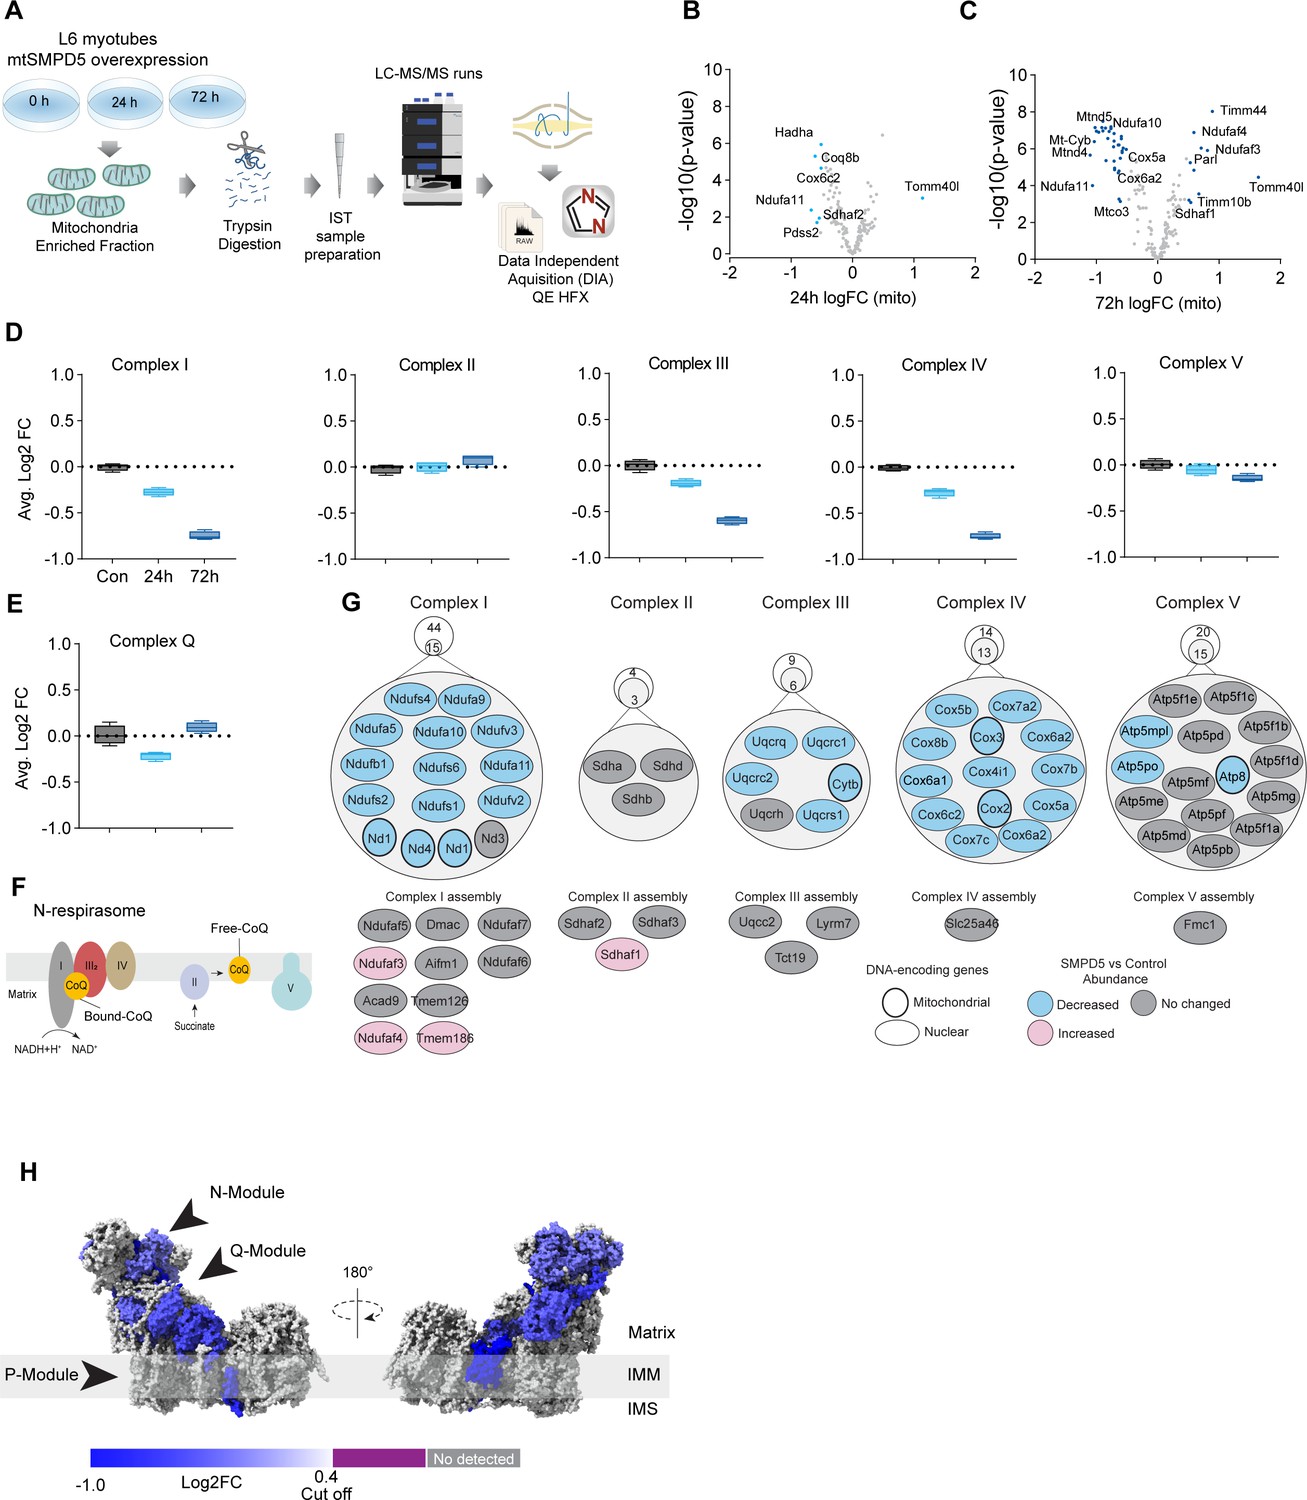
Mitochondrial ceramides induce a selective depletion of supercomplexes-associated proteins in L6 myotubes.
(A) Workflow schematics. (B, C) Pairwise comparisons of mitochondrial proteome between all four groups. Cutoff for -log10 adjusted p-value (-log10(p-value)) was set at 2 and Log2(FC) at 0.5 (blue). (D) Quantification of the OXPHOS protein complexes generated by the summed abundance of all subunits within a given complex. (E) Quantification of the complex Q (CoQ) protein complexes generated by the summed abundance of all subunits within the complex. (F) Schematics of CoQ distribution between CI-binding and free CoQ (Hernansanz-Agustín and Enríquez, 2021). (G) Schematics of OXPHOS subunits (top) and assembly factors (bottom) significantly upregulated (light red), downregulated (blue), and no change (gray) after 72 hr of mtSMPD5 overexpression. (H) Subunit levels for proteins after mtSMPD5 overexpression mapped to the complex I structure (Zhu et al., 2016). The colors were calculated with an in-house Python script, and the resultant model was rendered using ChimeraX. Gray, not detected; purple, below cutoff (Log2FC = 0.4).
Figure 4—figure supplement 1

Proteomic analysis of mitochondrial fractions obtained rom L6 myotubes overexpressing mtSMPD5.
(A) L6 myotubes were exposed to doxycycline for different times to promote mtSMPD5 overexpression. The immunoblot of Flag is shown in (A). (B) Violin plot of proteomic data after median normalized. (C–I) Summed intensities of protein and subunits associated with a specific process as denoted on the top of each graph. N = 4 ± SEM. (J) L6 myotubes were exposed to doxycycline to promote mtSMPD5 overexpression. The immunoblot of Flag is shown in the left panel. mRNA levels for different complex I subunits were determined by RT-PCR and normalized against beta-actin. N = 4 ± SD.
Figure 5 with 1 supplement
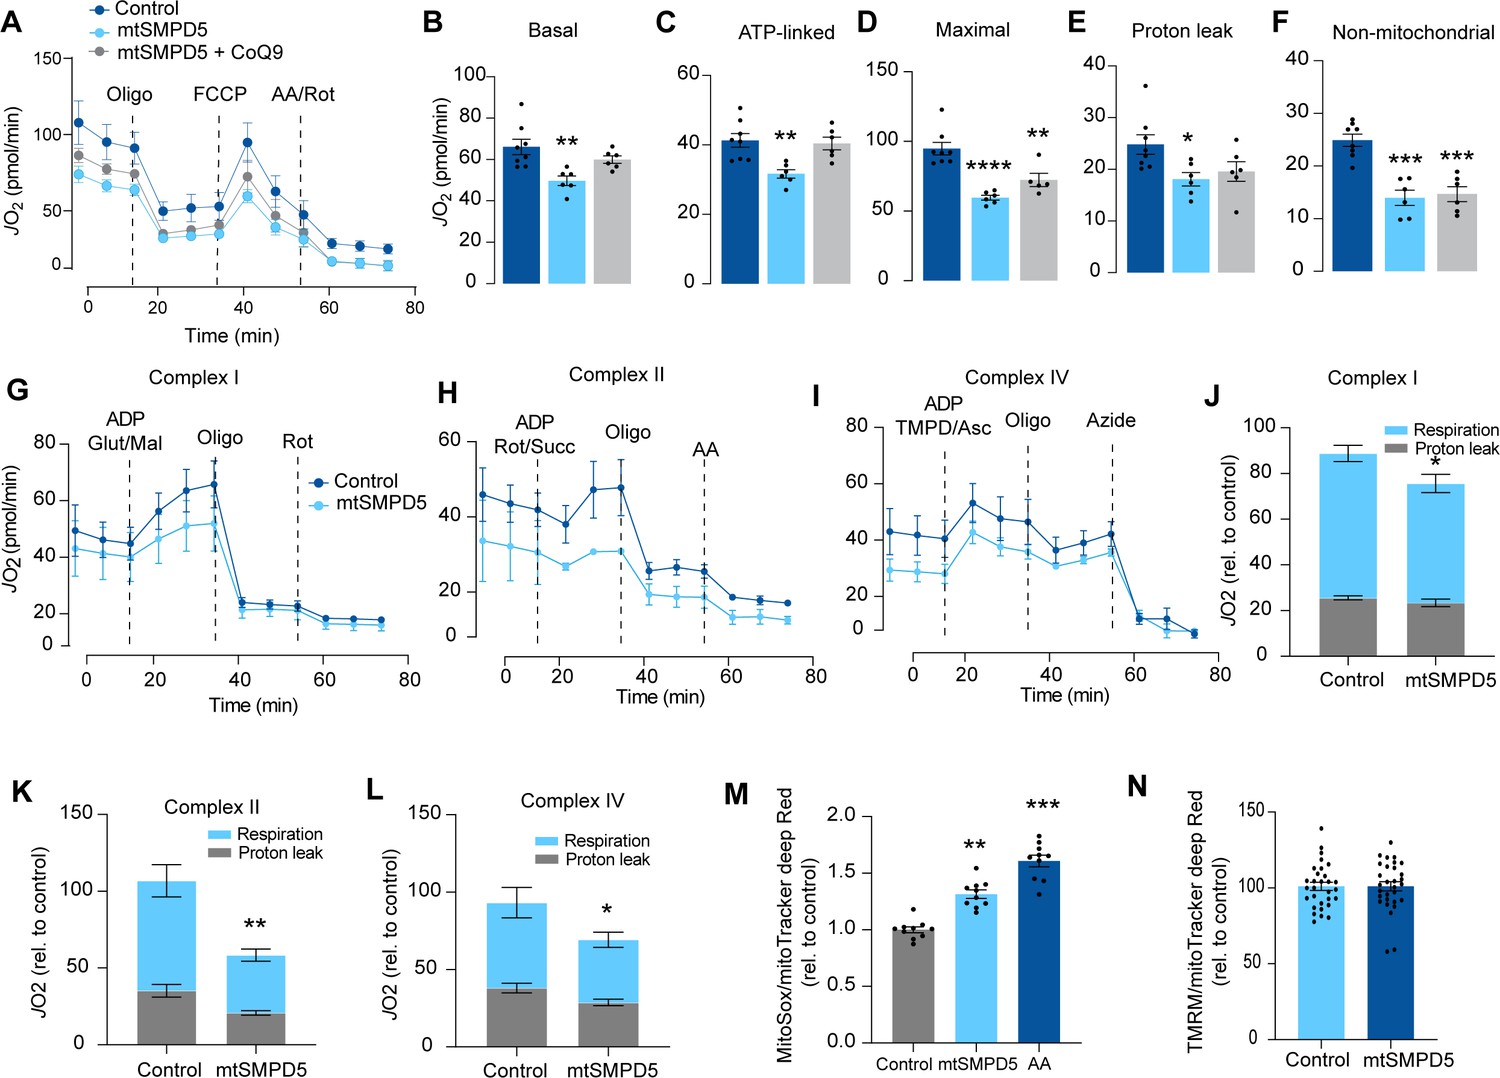
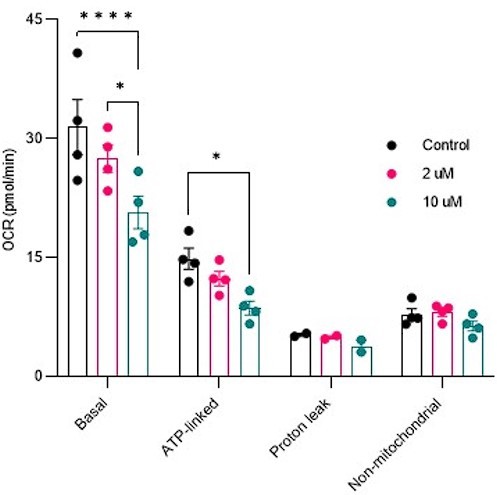
Mitochondrial ceramides impair mitochondrial function.
(A) mtSMPD5 overexpression decreases oxygen consumption rate (JO2) (means ± SEM; n = 6–8 biological replicates) measured by mitochondrial stress test. After 1 hr no CO2 environment, cells were stimulated with oligomycin (Oligo), carbonyl cyanide-p-trifluoromethoxyphenylhydrazon (FCCP), and antimycin A (AA) and Rotenote (Rot) at indicated time points (means ± SEM; n = 6–8 biological replicates). (B–F) Quantification of JO2 measured by mitochondrial stress test from Figure 6A as described in the ‘Materials and methods’ section (means ± SEM; n = 6–8 biological replicates). * p<0.05, ** p<0.01, *** p<0.001 vs Control. (G–L) mtSMPD5 overexpression diminishes respiratory CI (G, J), CII (H, K), and CIV (I, L). JO2 was performed in permeabilized cells supplemented with adenosine diphosphate (ADP) and CI to IV substrates (means ± SEM; n = 3 biological replicates). Mal, malate; Glut, glutamate; Rot, Rotenone; Succ, succinate; TMPD, tetramethyl-phenylenediamine; Asc, ascorbic acid; Oligo, oligomycin. (J), (K), and (L) are quantifications from graphs (G), (H), and (I), respectively. * p<0.05, ** p<0.01 vs Control. (M) mtSMPD5 overexpression increased mitochondrial oxidative stress. Cells were loaded with the redox-sensitive dye MitoSOX and the mitochondrial marker MitoTracker Deep Red for 30 min before imaging in a confocal microscope (see ‘Materials and methods’) (means ± SEM; n = 10 biological replicates). AA, antimycin A. ** p<0.01, *** p<0.001 vs Control. (N) mtSMPD5 overexpression does not alter mitochondrial membrane potential. Cells were loaded with the potentiometric dye tetramethylrhodamine, ethyl ester, perchlorate (TMRM+) in non-quenching mode and the mitochondrial marker MitoTracker Deep Red for 30 min before imaging in a confocal microscope (see ‘Materials and methods’) (means ± SEM; n > 10 biological replicates).
Figure 5—figure supplement 1

Proteomic analysis of mitochondria isolated from human muscle biopsies.
(A) Box plot of all proteomics samples before (top) and after (bottom) median normalization. (B) Pairwise comparisons of mitochondrial proteome between all four groups. (C) Proteins rank against rate glucose disappearance during clamp (Rd) correlation. Proteins within complex IV and V of the electron transport chain associate with Rd. (D) Association of proteins within complex II, III, small and large ribosomal subunits with Rd.
Figure 6
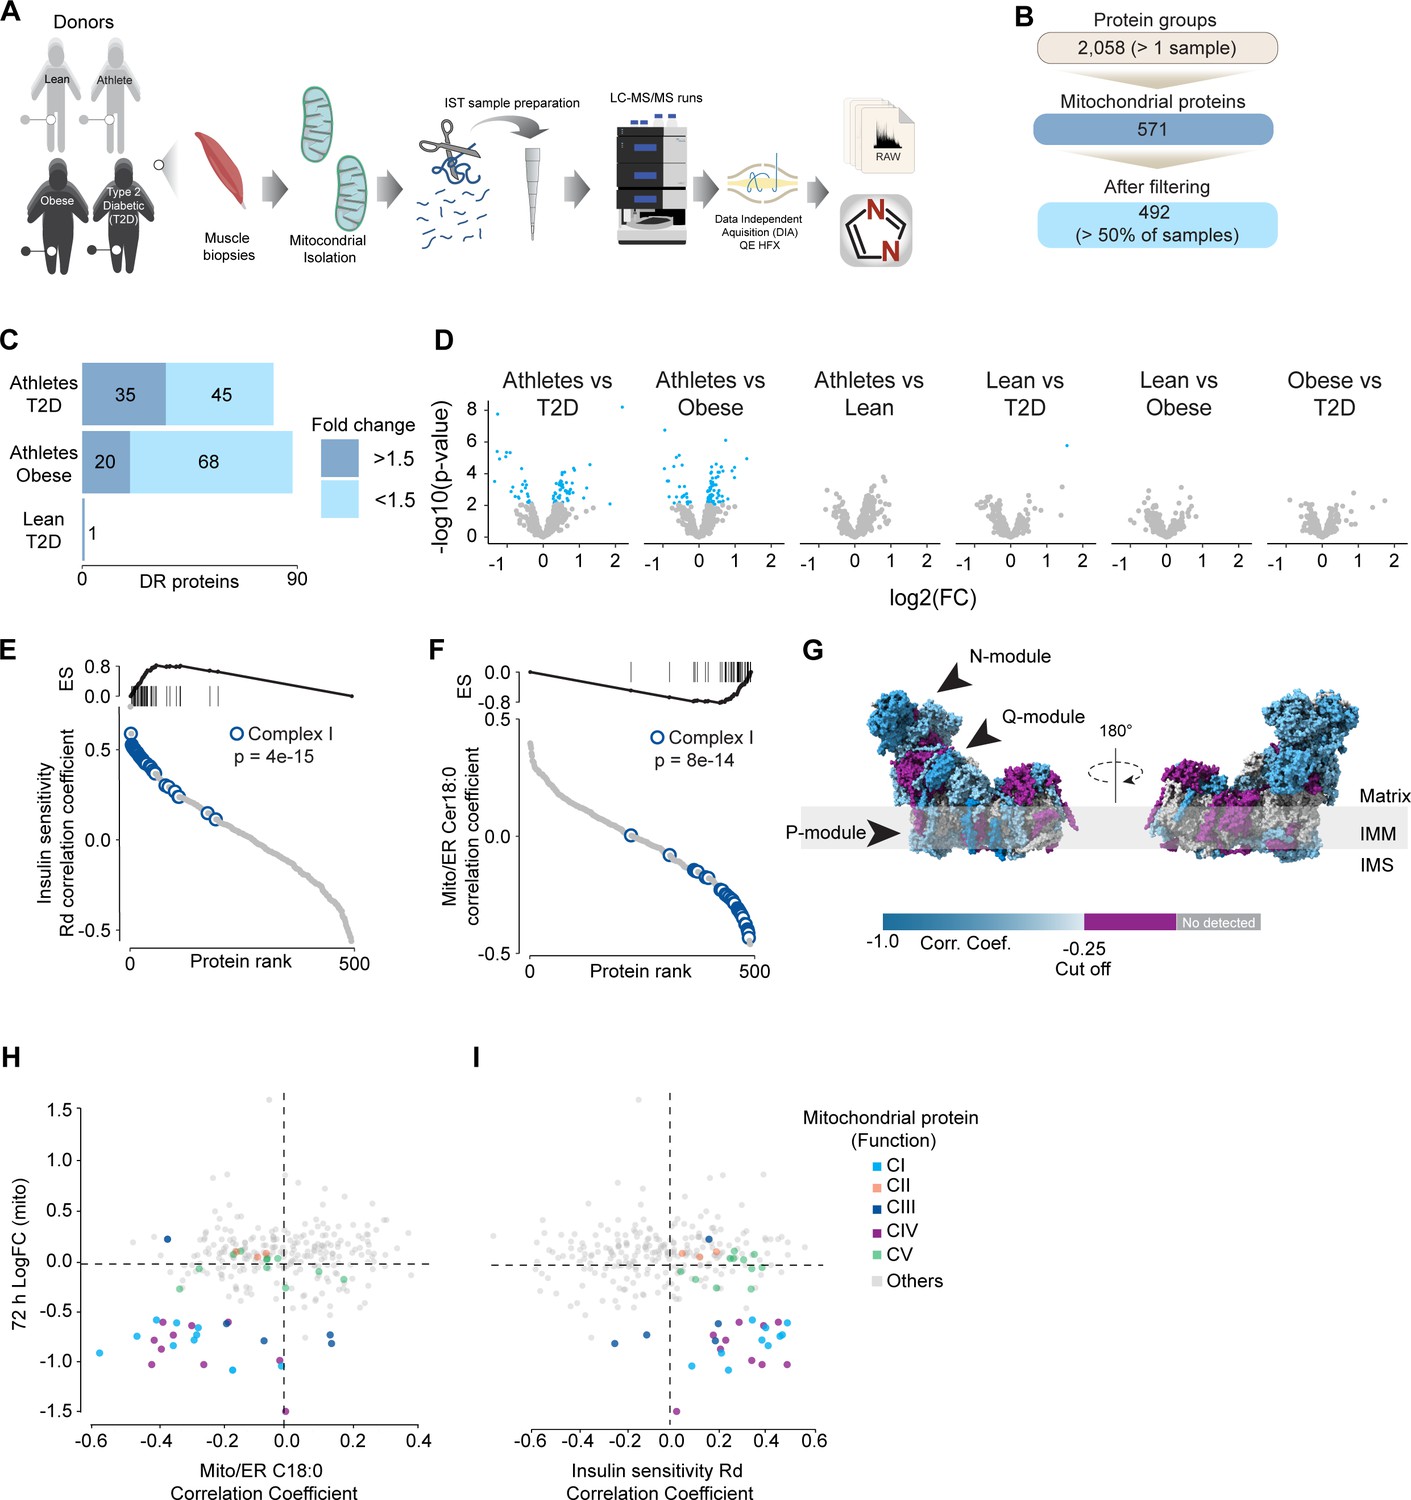
Mitochondrial proteome profiling associates complex I with muscle insulin sensitivity.
(A) Quantification of proteins across samples. (B) Number of significant deferential regulated (DR) proteins by pairwise comparison. Groups not shown have no significantly regulated proteins after correcting for multiple testing. (C) Gene set enrichment between all comparisons. (D) Relative protein abundance in isolated mitochondria from human skeletal muscle cells. Comparisons are shown on the top of each graph. Light blue, significantly regulated proteins (-log10(p-val)=2). (E) Proteins rank against rate glucose disappearance during clamp (Rd) correlation. Proteins within complex I of the electron transport chain are highly significant with Rd. (F) Proteins rank against mitochondrial ceramide (Cer) 18:0 abundance. Proteins within complex I of the electron transport chain are highly significant with Cer18:0. (G) Subunit levels associated with mitochondrial ceramides mapped to the complex I structure (Zhu et al., 2016). The colors were calculated with an in-house Python script, and the resultant model was rendered using ChimeraX. Gray, no detected; purple, below cutoff (Corr. Coef. = –0.25 to 0.25). (H) Quantification of the mitochondrial proteins generated by the summed abundance of all subunits associated with a specific function from mtSMPD5-L6 myotubes after 72 hr vs summed mitochondrial proteins (function) associated with either C18:0 ceramide (left panel) or insulin sensitivity (right panel) from human samples.
Author response image 1
Author response image 2

Author response image 3

Author response image 4

Author response image 5

Author response image 6

Author response image 7
Author response image 8

Author response image 9
Additional files
-
MDAR checklist
- https://cdn.elifesciences.org/articles/87340/elife-87340-mdarchecklist1-v1.pdf
-
Supplementary file 1
Reagents.
- https://cdn.elifesciences.org/articles/87340/elife-87340-supp1-v1.xlsx
-
Supplementary file 2
Sequences.
- https://cdn.elifesciences.org/articles/87340/elife-87340-supp2-v1.docx
-
Source data 1
- https://cdn.elifesciences.org/articles/87340/elife-87340-data1-v1.zip
-
Source data 2
Uncropped gells Figures 2F and 3.
- https://cdn.elifesciences.org/articles/87340/elife-87340-data2-v1.zip
-
Source data 3
Lipidomic analysis L6.
- https://cdn.elifesciences.org/articles/87340/elife-87340-data3-v1.xlsx
-
Source data 4
Lipidomic analysis Hela.
- https://cdn.elifesciences.org/articles/87340/elife-87340-data4-v1.xlsx
-
Source data 5
Lipidomic analysis L6s with mtSMPD5 overexpression.
- https://cdn.elifesciences.org/articles/87340/elife-87340-data5-v1.xlsx
-
Source data 6
Lipidomic analysis of mice exposed to chow or HFD with or without P051.
- https://cdn.elifesciences.org/articles/87340/elife-87340-data6-v1.xlsx
-
Source data 7
Correlation analysis of lipidomics and proteomics in human samples.
- https://cdn.elifesciences.org/articles/87340/elife-87340-data7-v1.xlsx
-
Source data 8
Correlation analysis between proteomics and human traits.
- https://cdn.elifesciences.org/articles/87340/elife-87340-data8-v1.xlsx
-
Source data 9
Correlation analysis between C18 ceramides and human muscle proteomics.
- https://cdn.elifesciences.org/articles/87340/elife-87340-data9-v1.xlsx
-
Source data 10
Human proteomics PairWiseComp.
- https://cdn.elifesciences.org/articles/87340/elife-87340-data10-v1.xlsx
-
Source data 11
Human proteomics analysis median normalised.
- https://cdn.elifesciences.org/articles/87340/elife-87340-data11-v1.xlsx
-
Source data 12
Human proteomics analysis Rd_clamp_correlation_all_protein.
- https://cdn.elifesciences.org/articles/87340/elife-87340-data12-v1.xlsx
Download links
A two-part list of links to download the article, or parts of the article, in various formats.
Downloads (link to download the article as PDF)
Open citations (links to open the citations from this article in various online reference manager services)
Cite this article (links to download the citations from this article in formats compatible with various reference manager tools)
Mitochondrial electron transport chain, ceramide, and coenzyme Q are linked in a pathway that drives insulin resistance in skeletal muscle
eLife 12:RP87340.
https://doi.org/10.7554/eLife.87340.3


