The chemorepellent, SLIT2, bolsters innate immunity against Staphylococcus aureus
- Cell Biology Program, The Hospital for Sick Children Research Institute, Canada
- Faculty of Dentistry, University of Toronto, Canada
- The Keenan Research Centre for Biomedical Science, Unity Health Toronto, Canada
- Department of Laboratory Medicine & Pathobiology, Medical Sciences Building, University of Toronto, Canada
- Department of Molecular Genetics, Medical Sciences Building, University of Toronto, Canada
- Program in Molecular Medicine, The Hospital for Sick Children Research Institute, Canada
- Department of Biochemistry, Medical Sciences Building, University of Toronto, Canada
- Department of Pediatrics, Faculty of Medicine and University Hospital Carl Gustav Carus, Technische Universität Dresden, Germany
- Division of Gastroenterology, Hepatology and Nutrition, The Hospital for Sick Children, Canada
- Department of Physiology, Medical Sciences Building, University of Toronto, Canada
- Department of Paediatrics, Temerty Faculty of Medicine, University of Toronto, Canada
- Department of Anesthesia and Pain Medicine, The Hospital for Sick Children, Canada
- Department of Anesthesiology & Pain Medicine, Temerty Faculty of Medicine, University of Toronto, Canada
- Department of Medicine and Interdepartmental Division of Critical Care Medicine, Temerty Faculty of Medicine, University of Toronto, Canada
- Department of Dental Oncology and Maxillofacial Prosthetics, University Health Network, Princess Margaret Cancer Centre, Canada
- Centre for Advanced Dental Research and Care, Mount Sinai Hospital, Canada
- Institute of Medical Science, University of Toronto, Medical Sciences Building, University of Toronto, Canada
- Division of Nephrology, The Hospital for Sick Children, Canada
Figures
Figure 1 with 1 supplement
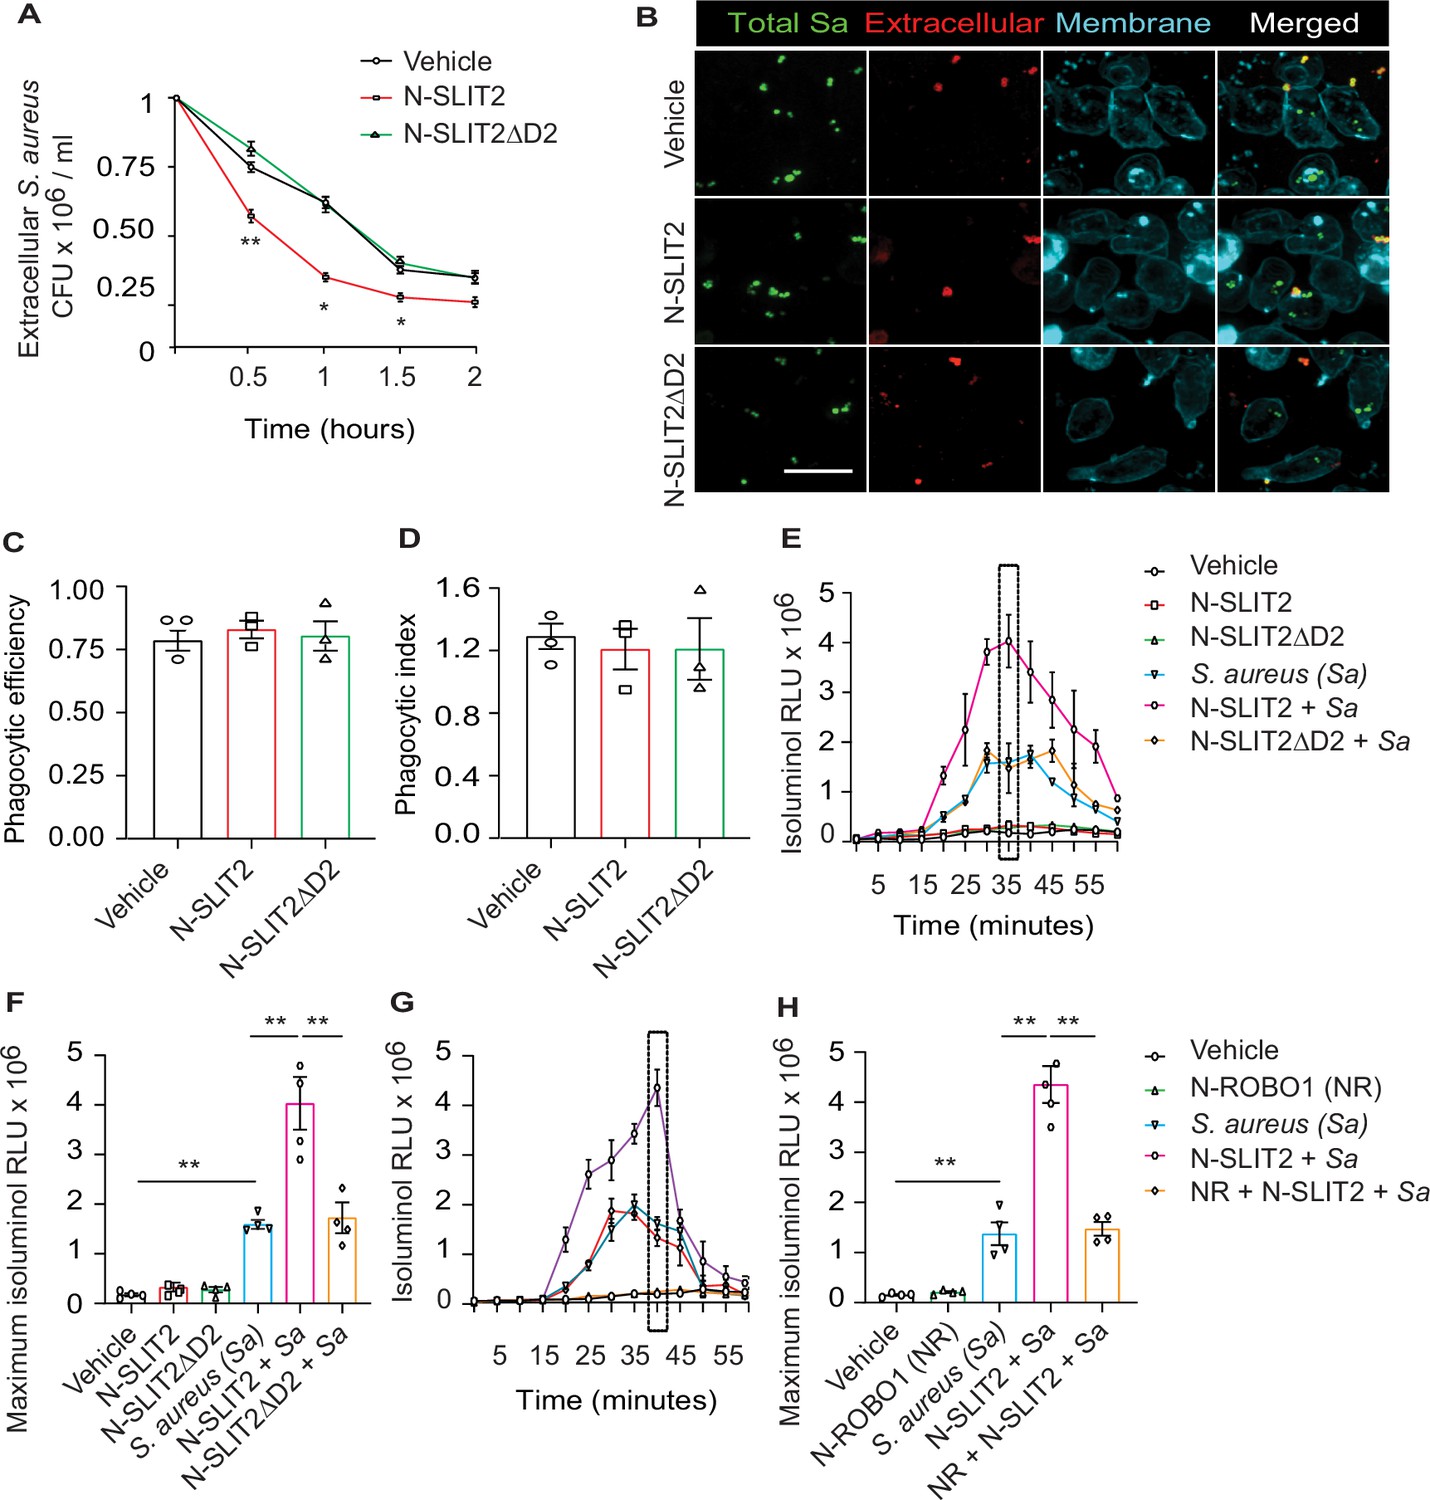
N-SLIT2 augments extracellular reactive oxygen species (ROS) production in response to S. aureus.
(A) Neutrophils, isolated from healthy human donors, were incubated with vehicle (HBSS), N-SLIT2 (30 nM) or N-SLIT2ΔD2 (30 nM) for 15 min, followed by exposure to S. aureus (MOI 10) for the indicated times. Extracellular S. aureus counts were determined by serial dilution. n=3. The statistical comparisons between N-SLIT2 and N-SLIT2ΔD2 groups are shown. p=0.0072 (0.5 hr), p=0.0105 (1 hr), p=0.0478 (1.5 hr), and p=0.0852 (2 hr). (B) Human neutrophils were treated with vehicle, N-SLIT2 or N-SLIT2ΔD2 for 15 min and then incubated with unoposonized S. aureus expressing GFP (MOI 10) for an additional 45 min. Extracellular bacteria were labeled using donkey anti-human IgG-Cy3. Neutrophil plasma membranes were labeled using Concanavalin A-AF647. At least 100 neutrophils per treatment were imaged. n=3. The phagocytic efficiency (C) and index (D) were calculated. (E) The experiments were performed as in ‘A’ and extracellular ROS production was measured every 5 min using isoluminol relative luminescent units (RLU). n=4. The averages of four experiments are shown. The timepoint with maximum extracellular ROS (35 min) is marked with a dotted rectangle. (F) Extracellular ROS production corresponding to maximum isoluminol RLU was compared among experimental groups. p=0.0031 (vehicle vs S. aureus), p=0.0099 (S. aureus vs N-SLIT2 + S. aureus), and p=0.0055 (N-SLIT2 + S. aureus vs N-SLIT2ΔD2 + S. aureus). (G) Experiments were performed as described In (E) in parallel incubating N-SLIT2 (30 nM) with N-ROBO1 (NR; 90 nM) for 1 hr at room temperature before adding to the cells. n=4. Averages of all experiments are shown. The timepoint with maximum extracellular ROS (40 min) is marked with a dotted rectangle. (H) The timepoint with maximum isoluminol relative luminescent units (RLU) was compared across experimental groups. p=0.0057 (vehicle vs S. aureus), p=0.0018 (S. aureus vs N-SLIT2 + S. aureus), and p=0.0028 (N-SLIT2 + S. aureus vs N-ROBO1 +N-SLIT2 + S. aureus). Mean values ± SEM. *p<0.05, and **p<0.01. The source data are available as Figure 1—source data 1.
-
Figure 1—source data 1
The file contains source data for Figure 1A, C, D, F, H.
- https://cdn.elifesciences.org/articles/87392/elife-87392-fig1-data1-v1.xlsx
Figure 1—figure supplement 1
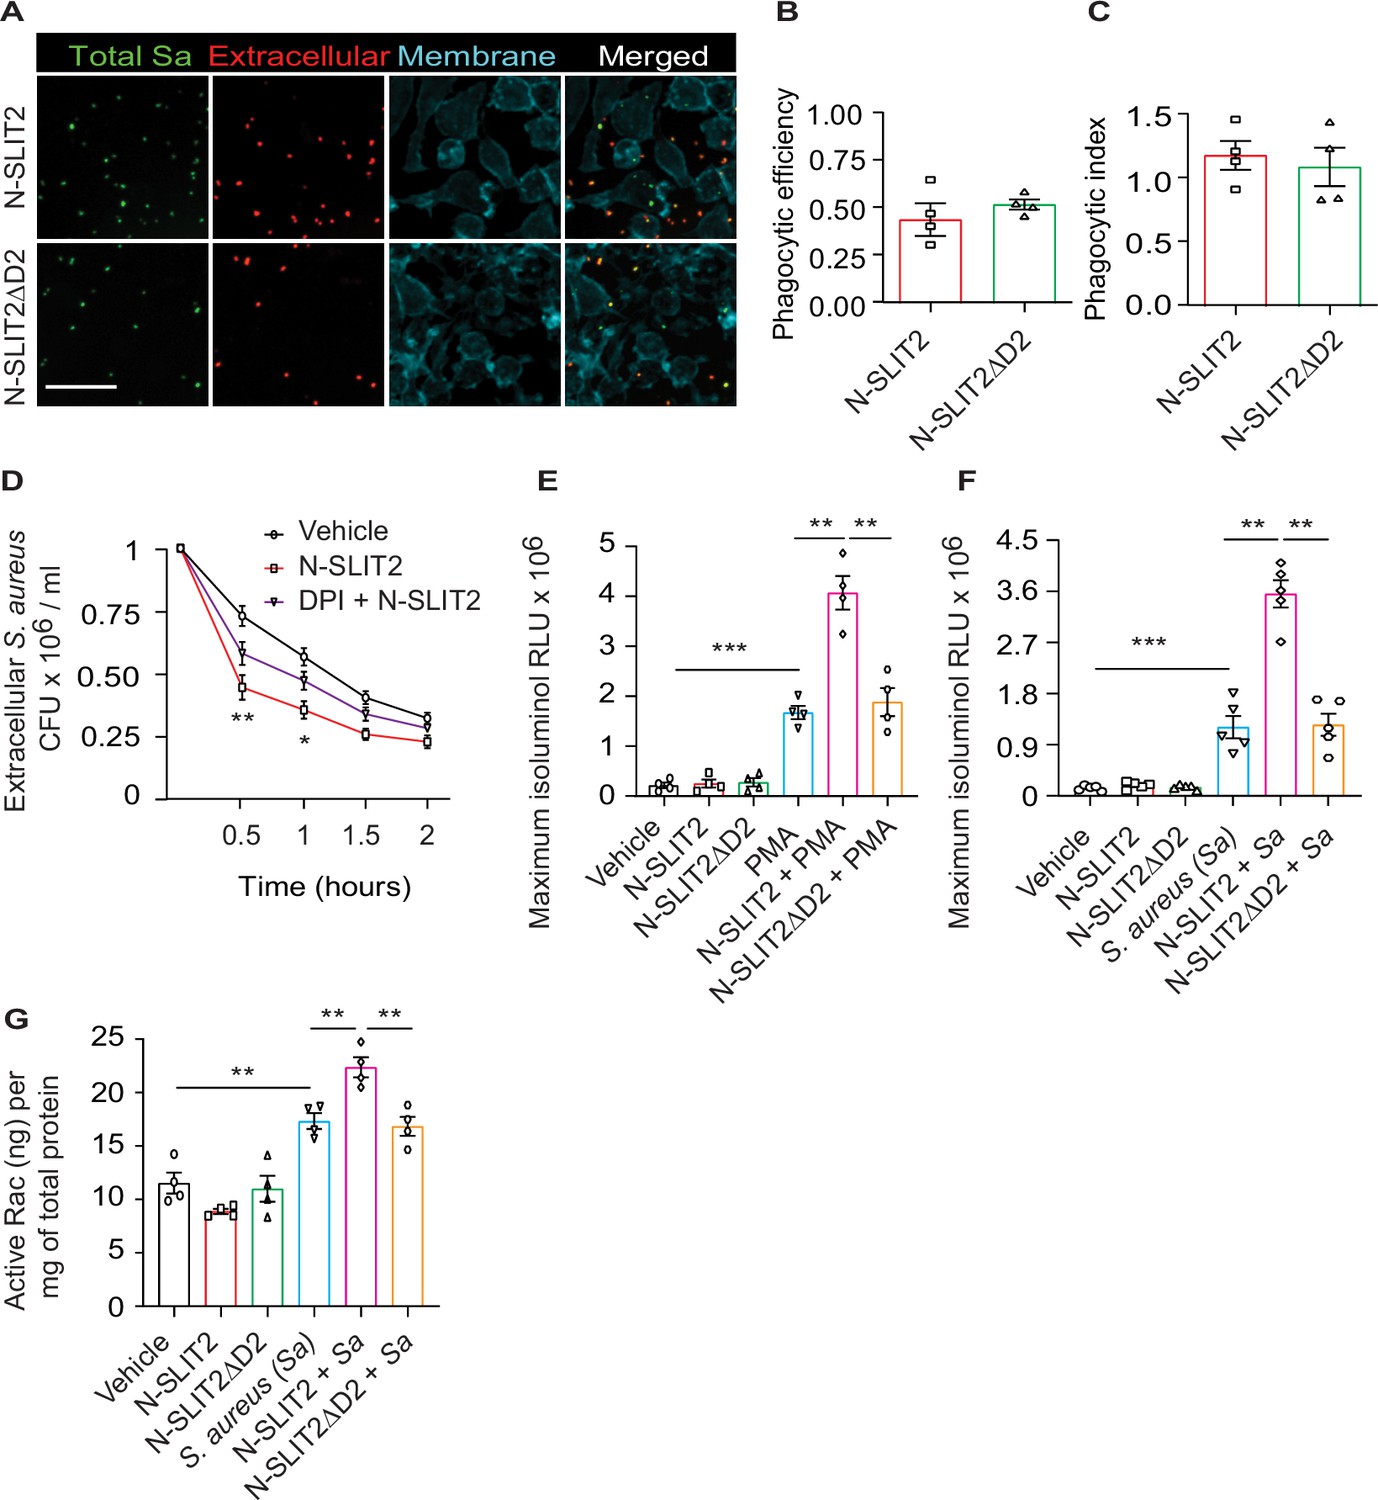
Anti-staphylococcal actions of N-SLIT2 are partially dependent on increases in extracellular ROS production.
(A) RAW264.7 macrophages were incubated with vehicle, N-SLIT2 (30 nM) or N-SLIT2ΔD2 (30 nM) for 15 min and then with unoposonized S. aureus expressing GFP (MOI 10) for an additional 45 min. Extracellular bacteria were labeled using donkey anti-human IgG-Cy3. Macrophage plasma membranes were stained using Acti-stain-AF670. At least 100 macrophages per experimental condition were imaged. n=3. The phagocytic efficiency (B) and index (C) were calculated. (D) Experiments were performed as in Figure (1 A). In some experiments, cells were pre-incubated with DPI (10 μM) for 5 min and then incubated with N-SLIT2 (30 nM) in the presence of diphenyleneiodonium chloride (DPI) for an additional 15 min. n=3. Statistical comparisons between N-SLIT2 and DPI + N-SLIT2 groups are p=0.0082 (0.5 hr), p=0.0259 (1 hr), p=0.1592 (1.5 hr), and p=0.4285 (2 hr). (E) Experiments were performed as in Figure (1E) using PMA (200 nM) as a secondary stimulus instead of S. aureus. Maximum isoluminol relative luminescent units (RLU) was compared. n=4. p=0.0006 (vehicle vs PMA), p=0.0065 (PMA vs N-SLIT2 + PMA), and p=0.0092 (N-SLIT2 + PMA vs N-SLIT2ΔD2 + PMA). (F) Murine bone marrow-derived neutrophils were treated as described in Figure (1E). n=5. p=0.0005 (vehicle vs S. aureus), p=0.0064 (S. aureus vs N-SLIT2 + S. aureus), and p=0.0082 (N-SLIT2 + S. aureus vs N-SLIT2ΔD2 + S. aureus). (G) Human neutrophils were treated as described in (F) and active levels of Rac were measured using a Rac1/2/3 calorimetric G-LISA. n=4. p=0.0024 (vehicle vs S. aureus), p=0.0088 (S. aureus vs N-SLIT2 + S. aureus), and p=0.0038 (N-SLIT2 + S. aureus vs N-SLIT2ΔD2 + S. aureus). Mean values ± SEM. *p<0.05, **p<0.01, ***p<0.001. The source data are available as Figure 1—figure supplement 1—source data 1.
-
Figure 1—figure supplement 1—source data 1
The file contains source data for Figure 1—figure supplement 1B–G.
- https://cdn.elifesciences.org/articles/87392/elife-87392-fig1-figsupp1-data1-v1.xlsx
Figure 2 with 1 supplement
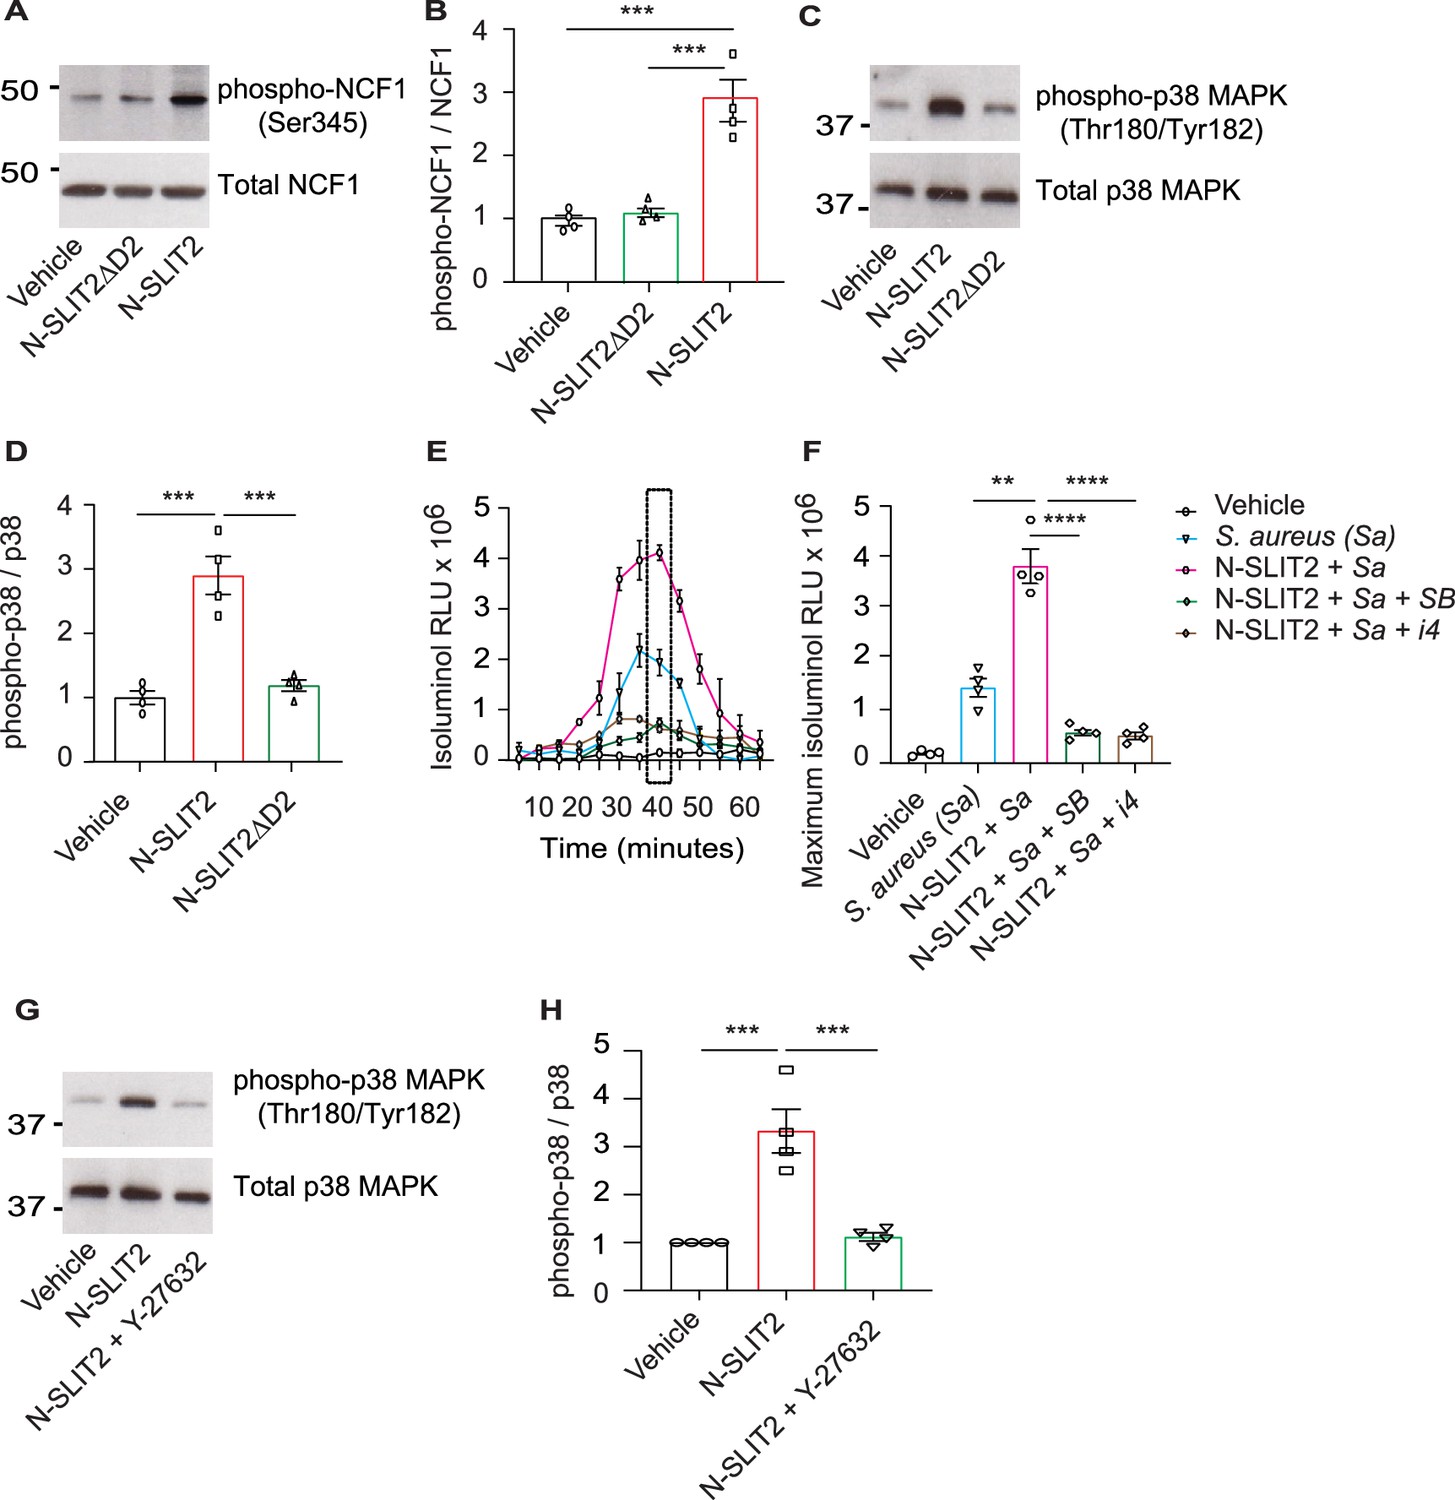
N-SLIT2 primes NADPH oxidase complex (NOX) by p38-mediated phosphorylation of Neutrophil Cytosolic Factor 1 (NCF1).
(A) Human neutrophils were exposed to vehicle, N-SLIT2 or N-SLIT2ΔD2 for 15 min and the protein lysates were immunoblotted for phospho-NCF1 (Ser345) and total NCF1 (Ser345). n=4. A representative blot is shown. (B) Experiments were performed as in (A), densitometry was performed, and the ratio of phospho-NCF1 /NCF1 was obtained. n=4. p=0.0002 (vehicle vs N-SLIT2) and p=0.0004 (N-SLIT2 vs N-SLIT2ΔD2). (C) Experiments were performed as in (A) and immunoblotting performed for phospho-p38 (Thr180/Tyr182) and total p38. n=4. A representative blot is shown. (D) Experiments were performed as in (C), densitometry was performed, and the ratio of phospho-p38 /p38 was obtained. p=0.0006 (vehicle vs N-SLIT2) and p=0.0004 (N-SLIT2 vs N-SLIT2ΔD2). (E) Human neutrophils were incubated with vehicle, S. aureus, N-SLIT2 + S. aureus, N-SLIT2 + S. aureus + SB203580 (SB, 10 μM), or N-SLIT2 + S. aureus + p38 MAPK Inhibitor IV (i4, 10 μM), and extracellular reactive oxygen species (ROS) were measured as described in Figure (1E). n=4. The averages of four experiments are shown. The timepoint with maximum extracellular ROS (40 min) is marked with a dotted rectangle. (F) Experiments were performed as in (E) and extracellular ROS production at 40 min compared among groups. n=4. p=0.0036 (S. aureus vs N-SLIT2 + S. aureus), p<0.0001 (N-SLIT2 + S. aureus vs N-SLIT2 + S. aureus +SB203580), and p<0.0001 (N-SLIT2 + S. aureus vs N-SLIT2 + S. aureus + p38 MAPK Inhibitor IV). (G) Human neutrophils were exposed to vehicle, N-SLIT2 or N-SLIT2 and Y-27632 together for 15 min and immunoblotting was performed for phospho-p38 (Thr180/Tyr182) and total p38. n=4. A representative blot is shown. (H) Experiments were performed as in (G), densitometry was performed, and the ratio of phospho-p38 /p38 was obtained. p=0.0004 (vehicle vs N-SLIT2) and p=0.0007 (N-SLIT2 vs N-SLIT2 + Y-27632). Mean values ± SEM. **p<0.01, ***p<0.001, and ****p<0.0001. The source data are available as Figure 2—source data 1 and Figure 2—source data 2.
-
Figure 2—source data 1
The file contains source data for Figure 2B, D, F, H.
- https://cdn.elifesciences.org/articles/87392/elife-87392-fig2-data1-v1.xlsx
-
Figure 2—source data 2
The file contains source data for Figure 2A, C, G.
- https://cdn.elifesciences.org/articles/87392/elife-87392-fig2-data2-v1.zip
Figure 2—figure supplement 1

N-SLIT2 does not activate PKC signaling in neutrophils.
(A) RAW264.7 cells were incubated with vehicle, N-SLIT2 or N-SLIT2ΔD2 for 15 min, and the protein lysates were immunoblotted for phospho-NCF1 (Ser345), and total Neutrophil Cytosolic Factor 1 (NCF1) (Ser345).n=4. (A) representative blot is shown. (B) Experiments were performed as in (A), densitometry was performed, and the ratio of phospho-NCF1/NCF1 was obtained. p=0.0007 (vehicle vs N-SLIT2) and p=0.0008 (N-SLIT2 vs N-SLIT2ΔD2). (C) Representative immunoblot showing lysates from human neutrophils treated with vehicle, N-SLIT2, N-SLIT2ΔD2, or PMA (200 nM) for 15 min and probed with phospho-PKC (Thr497) and β-actin. n=4. (D) Densitometry analysis of phospho-PKC/β-actin ratios for experiments in (C).p<0.0001 (vehicle vs PMA). (E) Representative immunoblot showing lysates from human neutrophils treated with vehicle, N-SLIT2, N-SLIT2ΔD2, or PMA (200 nM) for 15 min and probed with phospho-PKCδ (Tyr311) and total PKCδ. n=4. (F) Densitometry analysis of phospho-PKCδ/PKCδ ratios for experiments in (E).p<0.0001 (vehicle vs PMA). (G) RAW264.7 cells were treated as described in (A) and the protein lysates were immunoblotted for phospho-p38 (Thr180/Tyr182) and total p38. n=4. A representative blot is shown. (H) Densitometry analysis of phospho-p38/p38 ratios for experiments in (E).p<0.0001 (vehicle vs N-SLIT2) and p<0.0001 (N-SLIT2 vs N-SLIT2ΔD2). Mean values ± SEM. ***p<0.001 and ****p<0.0001. The source data are available as Figure 2—figure supplement 1—source data 1 and Figure 2—figure supplement 1—source data 2.
-
Figure 2—figure supplement 1—source data 1
The file contains source data for Figure 2—figure supplement 1B, D, F, H.
- https://cdn.elifesciences.org/articles/87392/elife-87392-fig2-figsupp1-data1-v1.xlsx
-
Figure 2—figure supplement 1—source data 2
The file contains source data for Figure 2—figure supplement 1A, C, E, G.
- https://cdn.elifesciences.org/articles/87392/elife-87392-fig2-figsupp1-data2-v1.zip
Figure 3 with 1 supplement
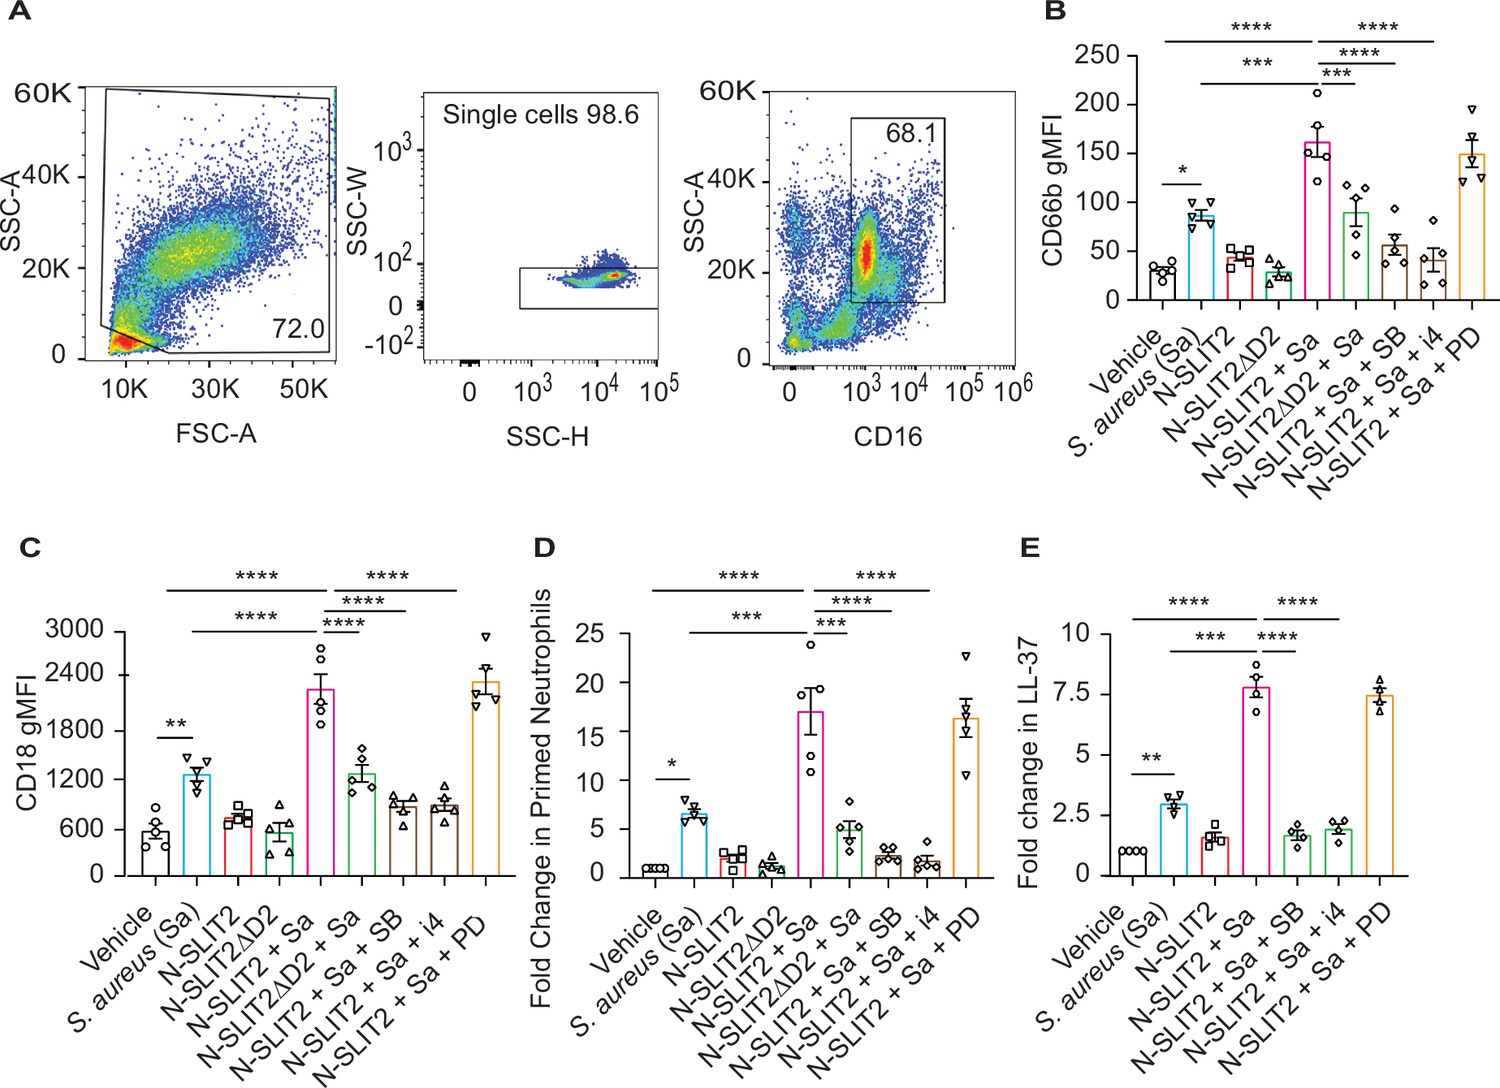
N-SLIT2 enhances p38 MAPK-mediated exocytosis of secondary and tertiary granules.
(A–D) 100 μl whole blood from human subjects was exposed to different treatments for 15 min at 37 °C, as indicated. The samples were immediately fixed on ice with 1.6% paraformaldehyde (PFA) and surface CD markers labeled. n=5. (A) Gating strategy for human blood neutrophils: Red blood cells and dead cell debris were excluded based on FSC-A × SSC-A. Doublets were excluded based on SSC-A × SSC-W. Neutrophils were gated in whole blood leukocytes using CD16high × SSC-Ahigh. (B) Human neutrophils were exposed to vehicle, N-SLIT2, or N-SLIT2ΔD2 with or without the p38 MAPK inhibitors, SB 203580 (SB; 10 μM) or p38 MAPK Inhibitor IV (i4; 10 μM), or the MEK1/2 inhibitor PD 184161 (PD; 10 μM) for 15 min, followed by exposure to S. aureus (Sa) for another 15 min at 37 °C, as indicated. Geometric mean fluorescence intensity (gMFI) for CD66b (secondary granules) is shown. p=0.0122 (vehicle vs Sa), p<0.0001 (vehicle vs N-SLIT2 + Sa) p=0.0003 (Sa vs N-SLIT2 + Sa), p=0.0006 (N-SLIT2 + Sa vs N-SLIT2ΔD2 + Sa), p<0.0001 (N-SLIT2 + Sa vs N-SLIT2 + Sa + SB), and p<0.0001 (N-SLIT2 + Sa vs N-SLIT2 + Sa + i4). (C) Neutrophils were treated as in (B) and gMFI for CD18 (secondary and tertiary granules) is noted. p=0.0022 (vehicle vs Sa), p<0.0001 (vehicle vs N-SLIT2 + Sa) p<0.0001 (Sa vs N-SLIT2 + Sa), p<0.0001 (N-SLIT2 + Sa vs N-SLIT2ΔD2 + Sa), p<0.0001 (N-SLIT2 + Sa vs N-SLIT2 + Sa + SB), and p<0.0001 (N-SLIT2 + Sa vs N-SLIT2 + Sa + i4). (D) Human neutrophils were exposed to vehicle, N-SLIT2, or N-SLIT2ΔD2 with or without the p38 MAPK inhibitors, SB 203580 (SB; 10 μM) or p38 MAPK Inhibitor IV (i4; 10 μM), or the MEK1/2 inhibitor PD 184161 (PD; 10 μM) for 15 min, followed by exposure to S. aureus (Sa) for another 15 min at 37 °C, as indicated. Primed neutrophils were identified by cell surface labeling CD66bhigh × CD11bhigh and fold changes in % primed neutrophils relative to vehicle treatment are shown. p=0.0246 (vehicle vs Sa), p<0.0001 (vehicle vs N-SLIT2 + Sa) p=0.0002 (Sa vs N-SLIT2 +Sa), p=0.0008 (N-SLIT2 + Sa vs N-SLIT2ΔD2+ Sa), p<0.0001 (N-SLIT2 + Sa vs N-SLIT2 + Sa + SB), and p<0.0001 (N-SLIT2 + Sa vs N-SLIT2 + Sa + i4). (E) Human neutrophils were exposed to vehicle or N-SLIT2 with or without p38 MAPK inhibitors, SB or i4, or the MEK1/2 inhibitor PD for 15 min, then exposed to S. aureus (Sa) for another 15 min at 37 °C, as indicated. Supernatants were collected and secreted LL-37 levels were measured using an ELISA. n=4. p=0.0092 (vehicle vs Sa), p<0.0001 (vehicle vs N-SLIT2 + Sa) p=0.0005 (Sa vs N-SLIT2 + Sa), p<0.0001 (N-SLIT2 + Sa vs N-SLIT2 + Sa + SB), and p<0.0001 (N-SLIT2 + Sa vs N-SLIT2 + Sa + i4). Mean values ± SEM. *p<0.05, **p<0.01, ***p<0.001 and ****p<0.0001. The source data are available as Figure 3—source data 1.
-
Figure 3—source data 1
The file contains source data for Figure 3B–E.
- https://cdn.elifesciences.org/articles/87392/elife-87392-fig3-data1-v1.xlsx
Figure 3—figure supplement 1

N-SLIT2 does not significantly affect NETosis.
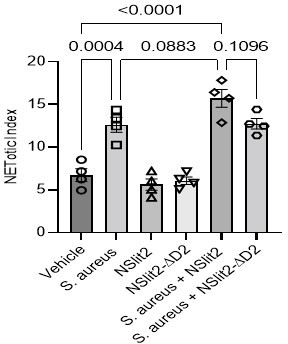
(A–B) Blood isolated from healthy human donors was exposed to vehicle (0.9% NaCl), or N-SLIT2 or N-SLIT2ΔD2 (total volume: 50 μl) for 45 min. Samples were diluted with Real-time deformability cytometry (RT-DC) buffer (950 μl), RT-DC was performed, and neutrophil deformation (A) and neutrophil area (B) were calculated. n=4 biological replicates. For neutrophil deformation (A), p=0.0955 (vehicle vs N-SLIT2) and p=0.0581 (N-SLIT2 vs N-SLIT2ΔD2) and for the neutrophil area (B), p=0.0676 (vehicle vs N-SLIT2) and p=0.0631 (N-SLIT2 vs N-SLIT2ΔD2). (C–G) Representative histograms are shown for human neutrophils with different treatments as described in Figure 3 to detect cell-surface expression of the following CD markers: (C) CD63, (D) CD66b, (E) CD18, (F) CD16, and (G) CD11b. (H–J) Neutrophils isolated from healthy human donors were incubated with vehicle, S. aureus (MOI 10), N-SLIT2, N-SLIT2ΔD2, alone or in combination as indicated in a 96-well plate and Sytox Green (5 μM) was added to each well. Fluorescence was measured at 15 min intervals for 3 hr and NETotic indices were calculated. n=4 biological replicates. (H) Average of all readings is shown. Shaded regions represent Mean values ± SEM. NETotic indices at 2 hr (I), and 3 hr (J) are also shown. (I) p=0.0004 (vehicle vs S. aureus), p<0.0001 (vehicle vs N-SLIT2 + S. aureus), p=0.0003 (vehicle vs N-SLIT2ΔD2+ S. aureus), p=0.0883 (S. aureus vs N-SLIT2 + S. aureus), and p=0.1096 (N-SLIT2 + S. aureus vs N-SLIT2ΔD2+ S. aureus). (J) p<0.0001 (vehicle vs S. aureus), p<0.0001 (vehicle vs N-SLIT2 + S. aureus), p<0.0001 (vehicle vs N-SLIT2ΔD2+ S. aureus), p=0.0949 (S. aureus vs N-SLIT2 + S. aureus), and p=0.0732 (N-SLIT2 + S. aureus vs N-SLIT2ΔD2+ S. aureus). *p<0.05, ***p<0.001, and ****p<0.0001. The source data are available as Figure 3—figure supplement 1—source data 1.
-
Figure 3—figure supplement 1—source data 1
The file contains source data for Figure 3—figure supplement 1A, B, I, J.
- https://cdn.elifesciences.org/articles/87392/elife-87392-fig3-figsupp1-data1-v1.xlsx
Figure 4 with 1 supplement
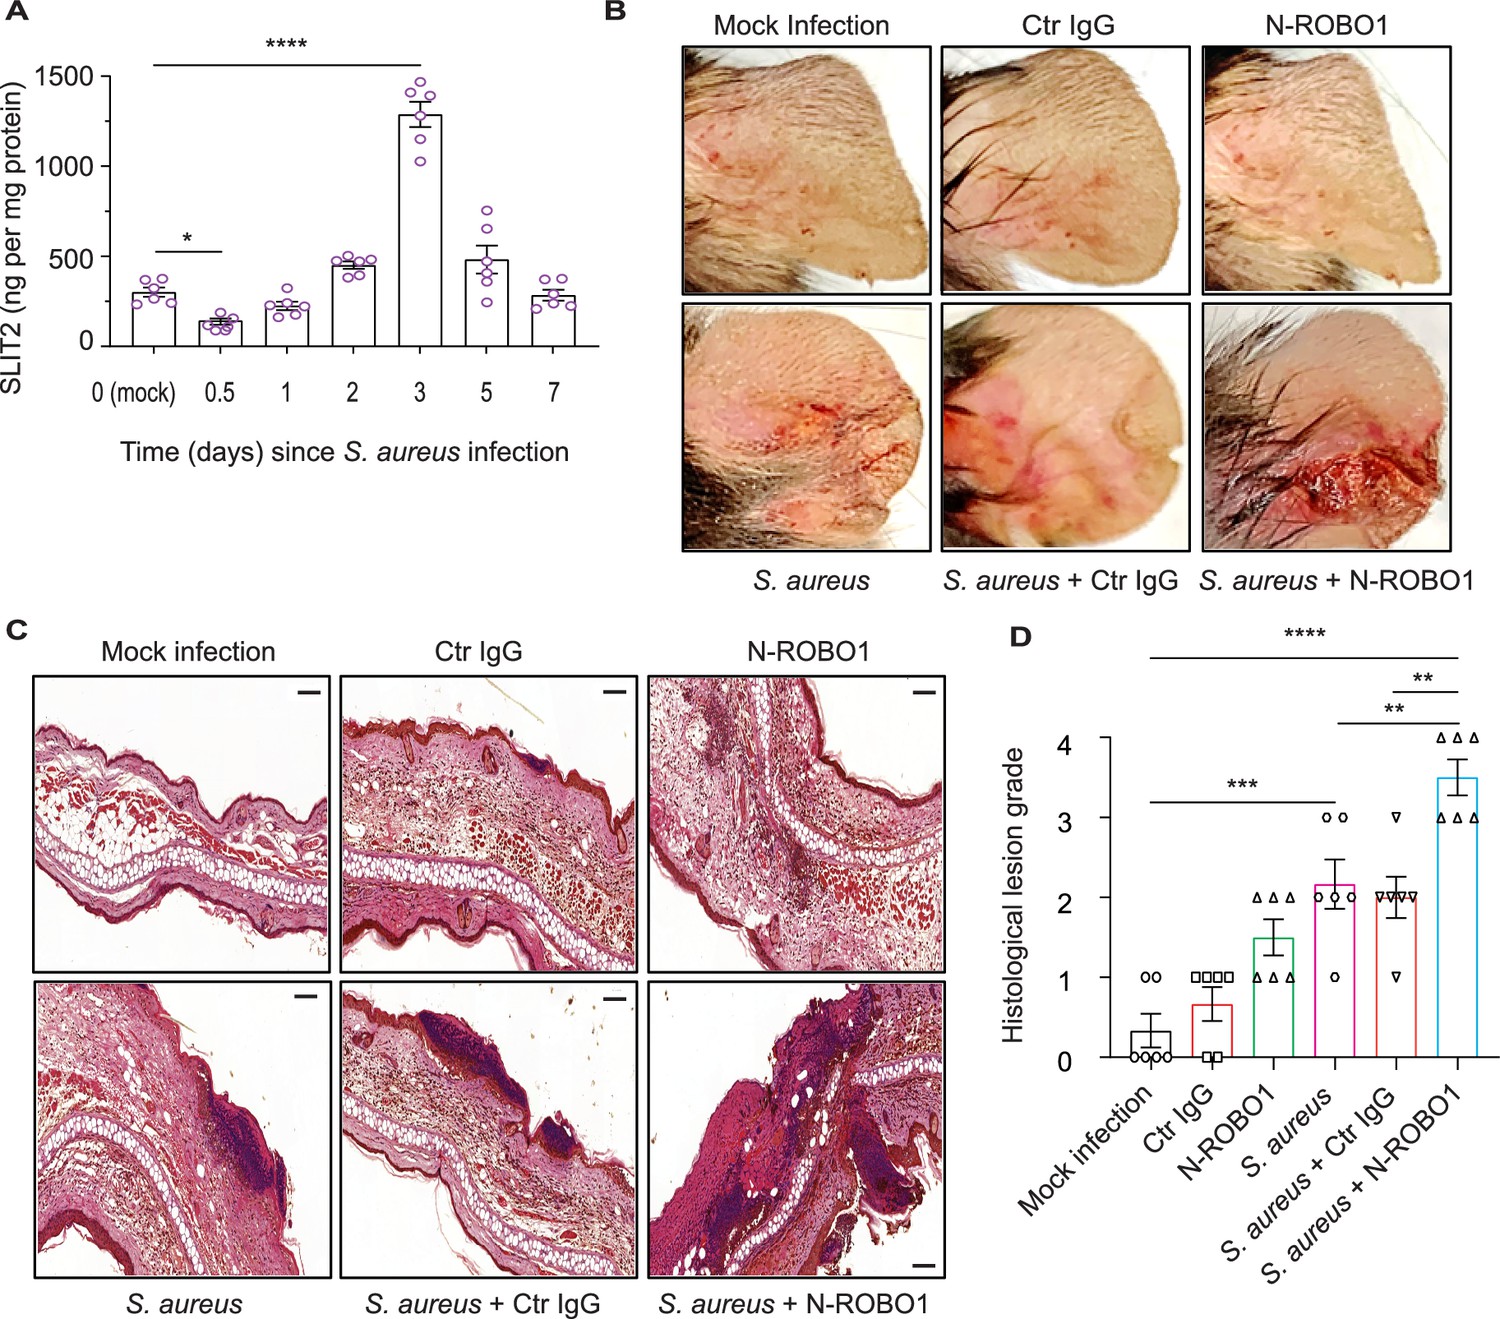
Blocking endogenous SLIT2 exacerbates tissue injury in S. aureus skin and soft tissue infection (SSTI).
(A) Ear skin samples were collected from mock-infected (0) and S. aureus-infected mice at indicated time points, homogenized, and tissue SLIT2 levels were measured using an ELISA. n=6 mice per group. p=0.0290 (Mock infection vs S. aureus 0.5 day), p<0.0001 (Mock infection vs S. aureus 3 days). (B) Representative images of gross pathology of ear tissue from animals treated as described in (Figure 4—figure supplement 1B). (C–D) Samples were collected as described in (B), fixed in formalin, and stained with hematoxylin and eosin. Scale bar = 100 μm (D) Experiments were performed as in (C). The lesions were blindly scored on an ascending scale of severity (0–5). n=6. p=0.0002 (Mock infection vs S. aureus), p<0.0001 (Mock infection vs S. aureus + N-ROBO1), p=0.0060 (S. aureus vs S. aureus + N-ROBO1), p=0.0016 (S. aureus + Ctr IgG vs S. aureus + N-ROBO1). Mean values ± SEM. *p<0.05, **p<0.01, ***p<0.001, and ****p<0.0001. The source data are available as Figure 4—source data 1.
-
Figure 4—source data 1
The file contains source data for Figure 4A, D.
- https://cdn.elifesciences.org/articles/87392/elife-87392-fig4-data1-v1.xlsx
Figure 4—figure supplement 1
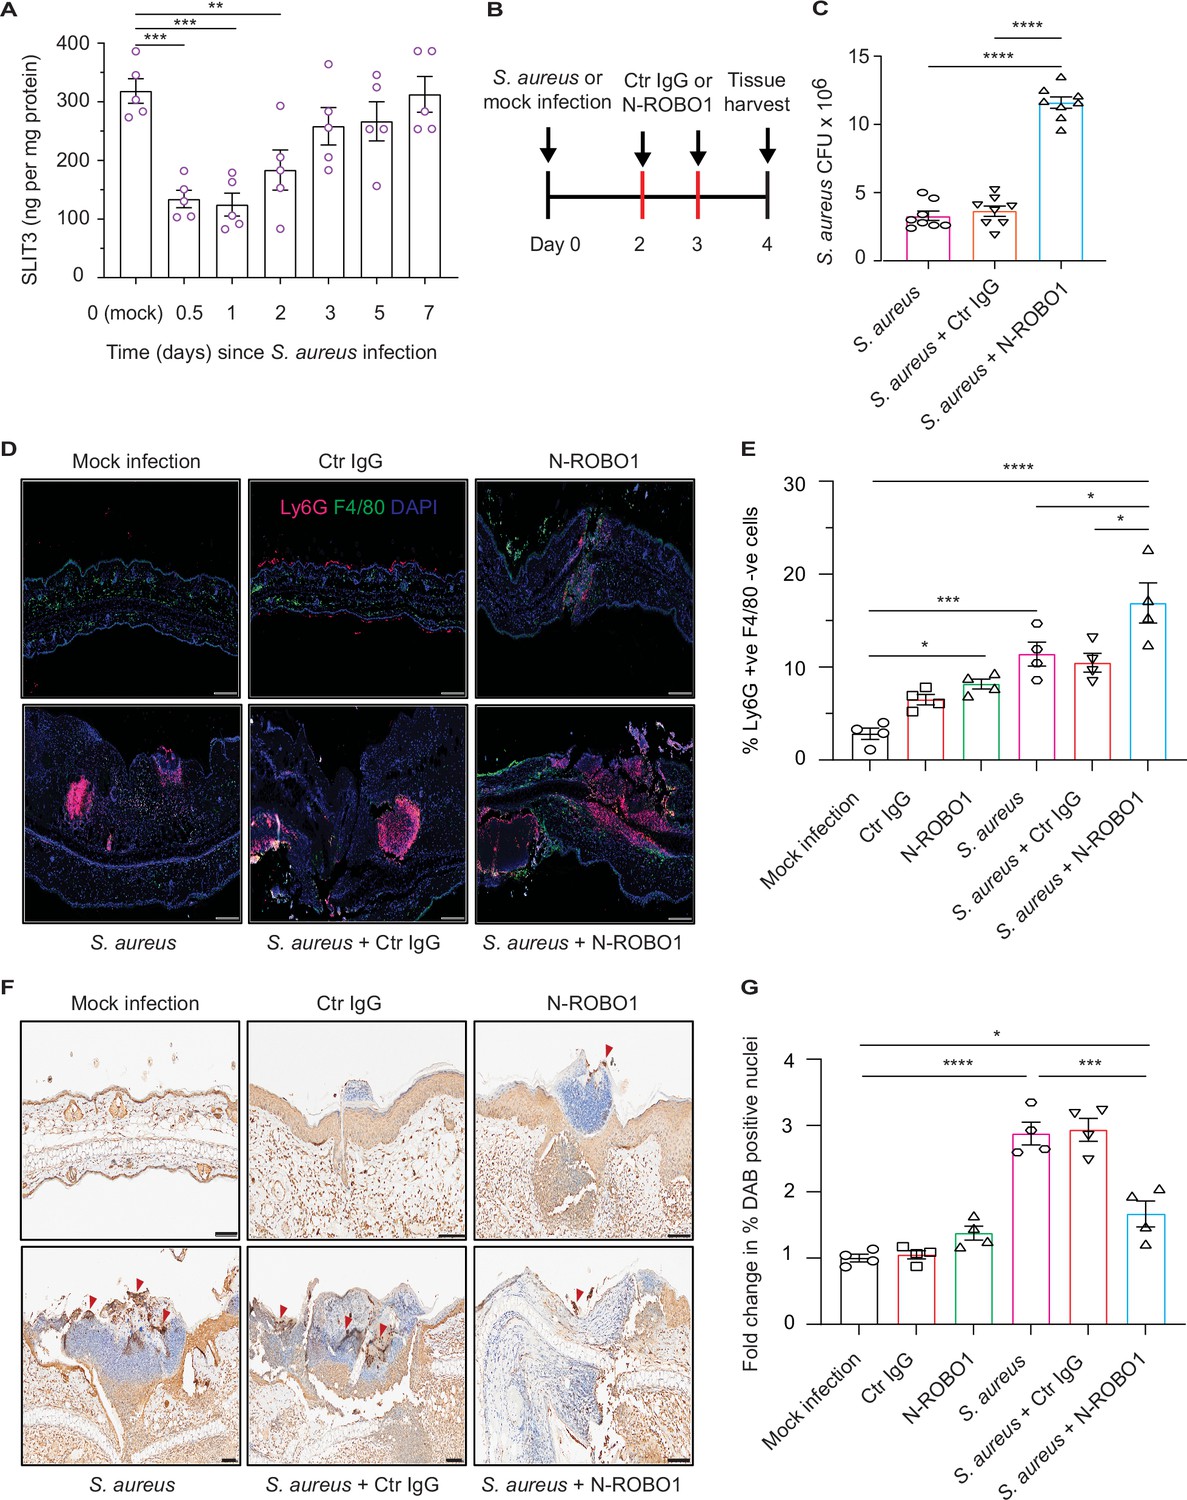
Inhibition of endogenous SLIT2 signaling increases tissue neutrophil infiltration, and attenuates tissue-associated ROS.
(A) Ear skin samples were collected as described in (Figure 4A) and tissue SLIT3 levels were measured using an ELISA. n=5. p=0.0002 (Mock infection vs S. aureus 0.5 day), p=0.0003 (Mock infection vs S. aureus 1 day), and p=0.0067 (Mock infection vs S. aureus 2 days). (B) In vivo protocol to block endogenous SLIT2 during S. aureus skin and soft tissue infection (SSTI). Ear pinnae were infected with 5 × 10⁶ colony forming units (CFU) of S. aureus or mock-infected (saline injection) as indicated on day 0. On 2nd and 3rd day, local injections of either 7 μg of control (Ctr) IgG or N-Roundabout guidance receptor 1 (ROBO1) were given at the site of infection. Skin samples were collected on the 4th day after infection. (C) Samples were collected as described in (B) and were homogenized and S. aureus CFU were counted by serial dilution. p<0.0001 (S. aureus vs S. aureus + N-ROBO1) and p<0.0001 (S. aureus + Ctr IgG vs S. aureus + N-ROBO1). N=8. (D–E) Animals were treated as described in (B), skin samples fixed in formalin, stained with Ly6G (red) and F4/80 (green) antibodies, and DAPI (blue). Scale bar = 200 μm. (E) Percent neutrophils (Ly6G+ F4/80–) per unit tissue area were calculated using HALO software. N=4. p=0.0475 (Mock infection vs N-ROBO1), p=0.0008 (Mock infection vs S. aureus), p<0.0001 (Mock infection vs S. aureus + N-ROBO1), p=0.0397 (S. aureus vs S. aureus + N-ROBO1), and p=0.0127 (S. aureus + Ctr IgG vs S. aureus + N-ROBO1). (F–G) Animals were treated as described in (B), and skin samples were collected, fixed in formalin, stained with an anti-8-OHdG antibody, and developed with 3,3'-Diaminobenzidine (DAB) staining. (F) Red arrowheads indicate DAB positive regions, Scale bar = 100 μm. (G) Fold changes (compared to mock infection) in % DAB +ve nuclei were calculated using HALO software. N=4. p<0.0001 (Mock infection vs S. aureus), p=0.0332 (Mock infection vs S. aureus + N-ROBO1), and p=0.0001 (S. aureus vs S. aureus + N-ROBO1). Mean values ± SEM. *p<0.05, **p<0.01, ***p<0.001 and ****p<0.0001. The source data are available as Figure 4—figure supplement 1—source data 1.
-
Figure 4—figure supplement 1—source data 1
The file contains source data for Figure 4—figure supplement 1A, C, E, G.
- https://cdn.elifesciences.org/articles/87392/elife-87392-fig4-figsupp1-data1-v1.xlsx
Figure 5 with 1 supplement
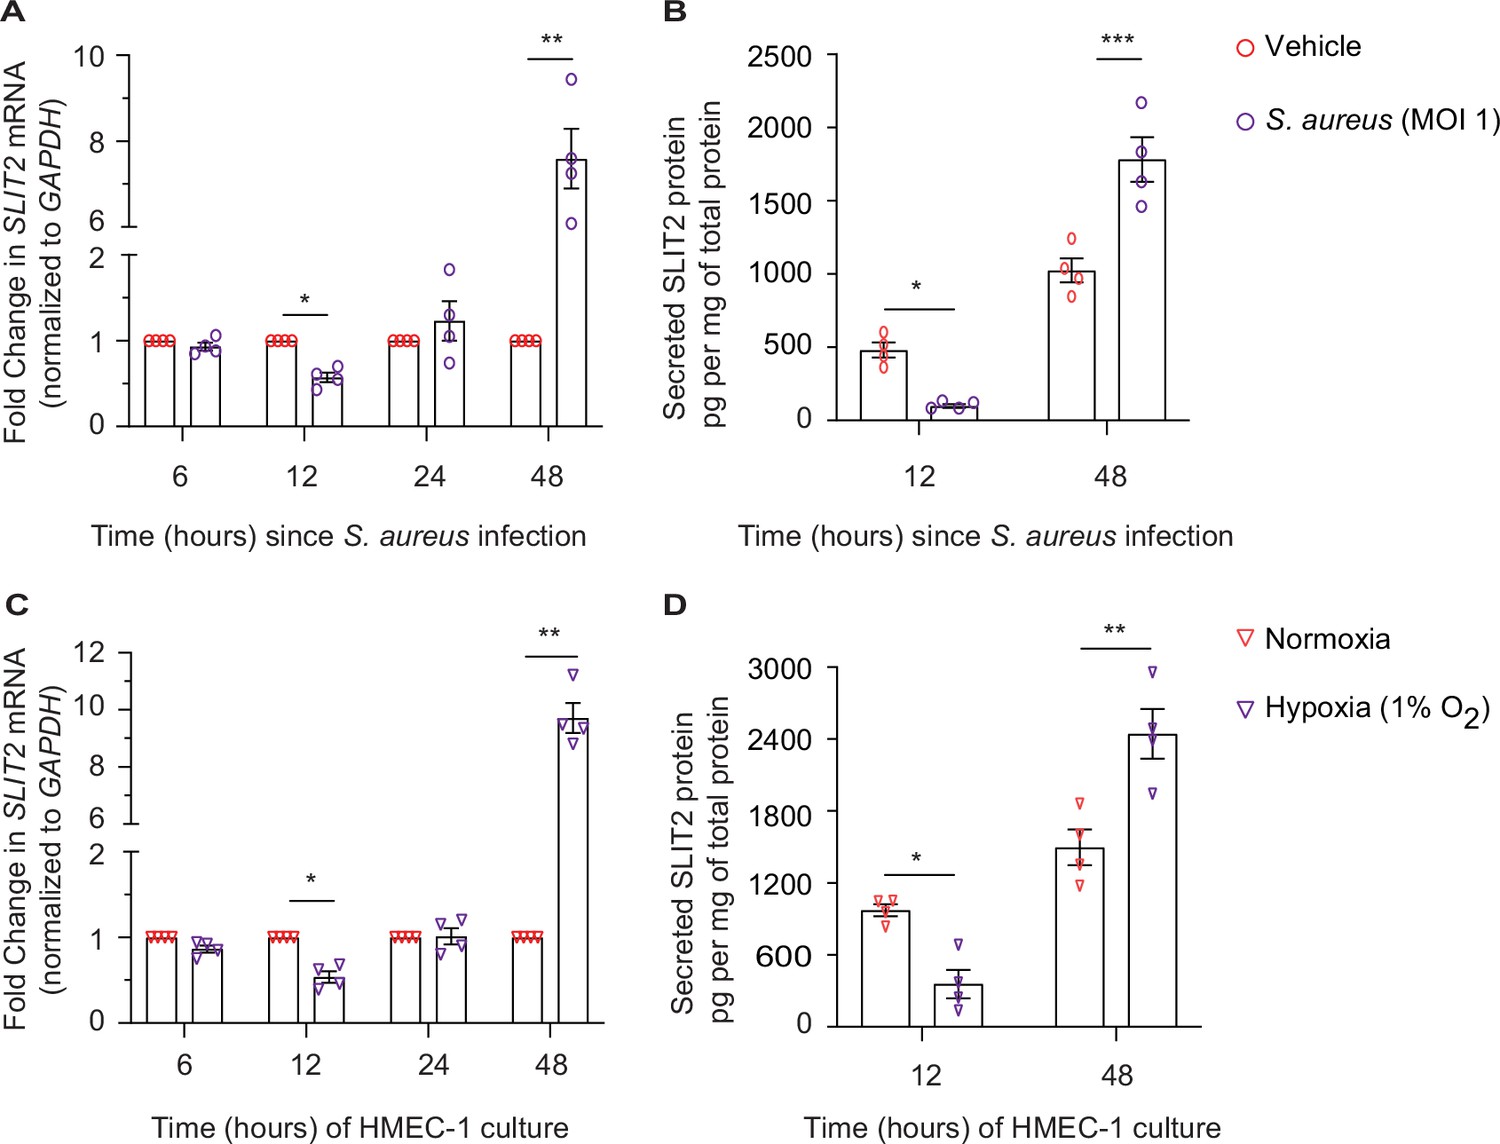
Dermal microvascular endothelial cells are a source of SLIT2 during S. aureus infection.
(A–B) HMEC-1 cells were infected with S. aureus (MOI 1), where indicated and cultured for 6, 12, 24, and 48 hr. Total cellular RNA and culture media were collected at each time point. n=4 biological replicates. (A) SLIT2 and GAPDH (housekeeping gene) mRNA expression levels were measured using Quantitative PCR (qPCR). p=0.0191 (vehicle vs S. aureus at 12 hr), and p=0.0100 (vehicle vs S. aureus at 48 hr). (B) SLIT2 levels were measured in the culture supernatant using ELISA and normalized to the total protein concentration in the supernatant. p=0.0222 (vehicle vs S. aureus at 12 hr), and p=0.0001 (vehicle vs S. aureus at 48 hr). (C–D) HMEC-1 cells were cultured in normoxic (20% O2) or hypoxic (1% O2) conditions for 6, 12, 24, and 48 hr, as indicated. Total cellular RNA and culture media were collected at each time point. n=4 biological replicates. (C) SLIT2 and GAPDH (housekeeping gene) mRNA expression levels were measured using qPCR. p=0.0253 (normoxia vs hypoxia at 12 hr), and p=0.0019 (normoxia vs hypoxia at 48 hr). (D) SLIT2 levels were measured in culture supernatant using ELISA and normalized to total protein concentration in the supernatants. p=0.0204 (normoxia vs hypoxia at 12 hr), and p=0.0011 (normoxia vs hypoxia at 48 hr). Mean values ± SEM. *p<0.05, **p<0.01, and ***p<0.001. The source data are available as Figure 5—source data 1.
-
Figure 5—source data 1
The file contains source data for Figure 5A–D.
- https://cdn.elifesciences.org/articles/87392/elife-87392-fig5-data1-v1.xlsx
Figure 5—figure supplement 1

Dermal microvascular endothelial cells are a source of SLIT2 during S. aureus infection.
(A) HMEC-1 cells were cultured in a medium with pH 7.4, 7.0, and 6.6, as indicated, for 6, 12, 24 hr. Total cellular RNA and culture supernatant were collected at each time point. n=4 biological replicates. (A) SLIT2 and GAPDH (housekeeping gene) mRNA expression levels were measured using Quantitative PCR (qPCR). All p values were >0.05. (B) Experiments were conducted as described in Figures (5A-B) for S. aureus infection and Figures (5C-D) for hypoxia treatment. Culture supernatants were collected at 48 hr. n=4 biological replicates. Before adding culture supernatant to the cells, it was incubated with Ctr IgG (90 nM) or N-ROBO1 (90 nM) for 1 hr, as indicated. Freshly isolated human neutrophils were resuspended in HMEC-1 culture supernatant, and S. aureus (SA; MOI 10) was added as a second stimulus for LL-37 secretion. LL-37 levels in the media were measured using an ELISA. n=4 biological replicates. p=0.0005 (vehicle medium vs SA medium), p=0.0362 (SA medium vs SA medium + N-ROBO1), p=0.0473 (SA medium + Ctr IgG vs SA medium + N-ROBO1). H, hypoxia; N, normoxia. p=0.0002 (N medium vs H medium), p=0.0190 (H medium vs H medium + N-ROBO1), and p=0.0088 (H medium + Ctr IgG vs H medium + N-ROBO1). Mean values ± SEM. *p<0.05, ***p<0.001, and ****p<0.0001. The source data are available as Figure 5—figure supplement 1—source data 1.
-
Figure 5—figure supplement 1—source data 1
The file contains source data for Figure 5—figure supplement 1A, B.
- https://cdn.elifesciences.org/articles/87392/elife-87392-fig5-figsupp1-data1-v1.xlsx
Figure 6
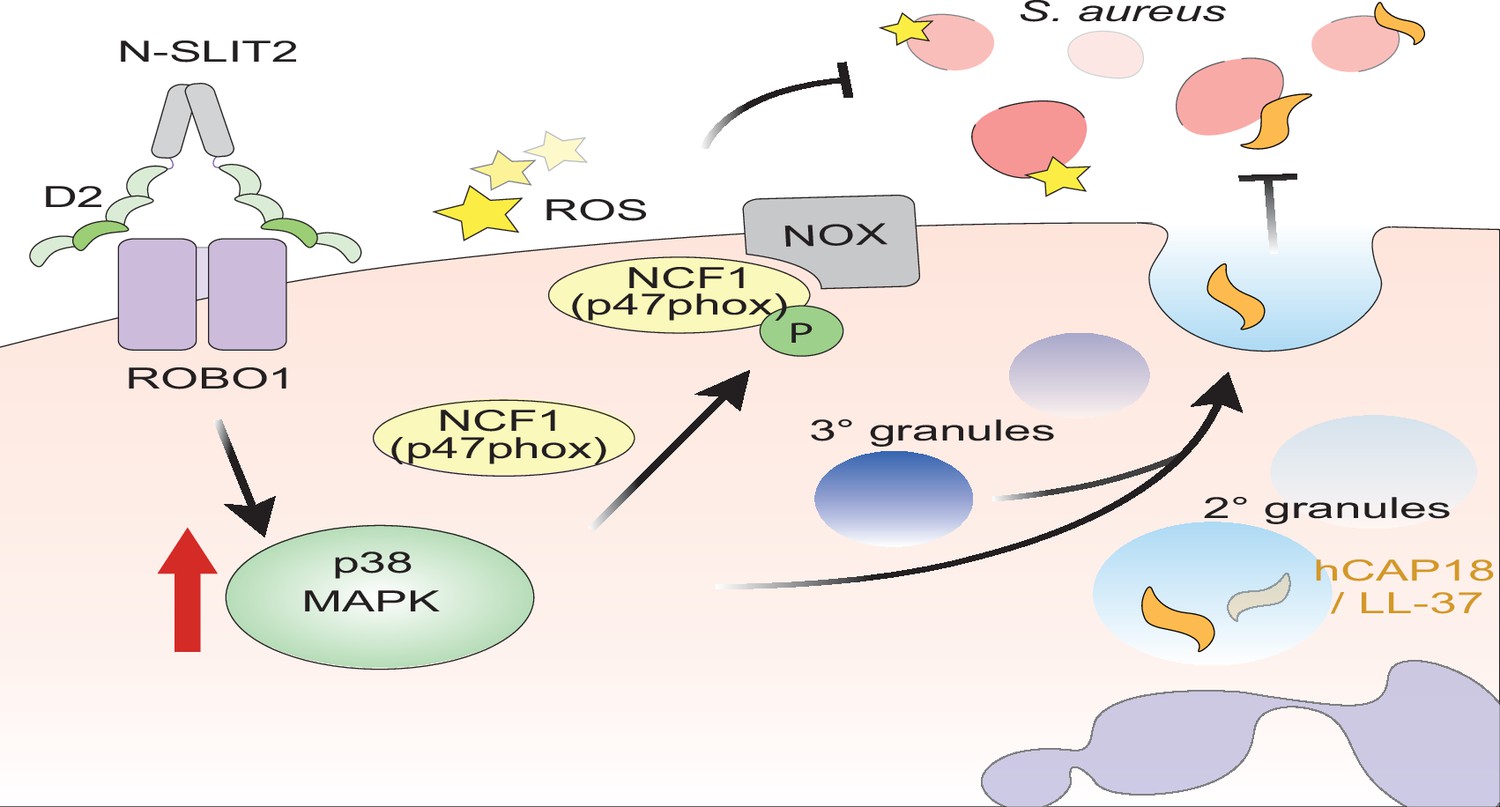
Proposed mechanism of N-SLIT2’s anti-bacterial action.
The binding of the Leucine-rich repeat D2 domain of N-SLIT2 to cell-surface ROBO1 results in the activation of p38 MAPK signaling in neutrophils. Active p38 MAPK phosphorylates cytosolic Neutrophil Cytosolic Factor 1 (NCF1) (p47phox), which is in its resting state, inducing translocation to the plasma membrane, thereby converting NCF1 to its primed state, forming a multi-protein NOX complex. In the presence of secondary stimuli such as S. aureus (and PMA), N-SLIT2-induced phosphorylation of NCF1 results in increased extracellular oxidative burst by neutrophils. The activation of p38 MAPK also augments exocytosis of secondary and tertiary granules. Secondary granules contain hCAP-18 which is cleaved extracellularly into its active form, the anti-microbial peptide, LL-37. Together, the N-SLIT2-mediated upsurge in both reactive oxygen species (ROS) production and LL-37 secretion promotes enhanced extracellular killing of S. aureus.
Author response image 1
Tables
Table 1
Amount of NaHCO3 added to MCDB 131 medium.
| Final pH | NaHCO3 stock (µl) added to 1 ml of medium | Final molarity (NaHCO3) mM |
|---|---|---|
| 7.4 | 42.5 | 14 |
| 7 | 30 | 10 |
| 6.6 | 9 | 3 |
Appendix 1—key resources table
| Reagent type (species) or resource | Designation | Source or reference | Identifiers | Additional information |
|---|---|---|---|---|
| Antibody | Anti-β-Actin (Mouse monoclonal) Clone AC-15 | Sigma-Aldrich, Oakville, ON, Canada | Cat# A5441 RRID:AB_476744 | Western blot (WB)- 1:2000 1 hr @ Room temperature |
| Antibody | Anti-phospho-p38 MAPK (Thr180/Tyr182) (Rabbit polyclonal) | Cell Signaling Technology, Danvers, MA, USA | Cat# 9211 RRID:AB_331641 | WB- 1:2000 1 hr @ Room temperature |
| Antibody | Anti-Total p38 MAPK (Rabbit polyclonal) | Cell Signaling Technology, Danvers, MA, USA | Cat# 9212 RRID:AB_330713 | WB- 1:2000 Overnight (O/N) @ 4 °C |
| Antibody | Anti-phospho-p47phox (NCF1) (Ser345) (Rabbit polyclonal) | Thermo Fisher Scientific, Mississauga, ON, Canada | Cat# PA5-37806 RRID:AB_2554414 | WB- 1:1000 O/N @ 4 °C |
| Antibody | Anti-p47phox (NCF1) (Rabbit monoclonal) Clone G.207.2 | Thermo Fisher Scientific, Mississauga, ON, Canada | Cat# MA5-14778 RRID:AB_10989232 | WB- 1:1000 O/N @ 4 °C |
| Antibody | Anti-phospho-PKC Pan (Thr497) (Rabbit polyclonal) | Thermo Fisher Scientific, Mississauga, ON, Canada | Cat# PA5-38418 RRID:AB_2555019 | WB- 1:1000 1 hr @ Room temperature |
| Antibody | Anti-phospho-PKCδ (Tyr311) (Rabbit polyclonal) | Cell Signaling Technology, Danvers, MA, USA | Cat# 2055 RRID:AB_330876 | WB- 1:2000 1 hr @ Room temperature |
| Antibody | Anti-PKCδ (Rabbit polyclonal) | Cell Signaling Technology, Danvers, MA, USA | Cat# 2058 RRID:AB_10694655 | WB- 1:2000 O/N @ 4 °C |
| Antibody | Anti-His tag (Mouse monoclonal) Clone AD1.1.10 HRP-conjugated | R&D Systems, Inc. Minneapolis, MN, USA | Cat# MAB050H RRID:AB_357354 | WB- 1:2000 1 hr @ Room temperature |
| Antibody | Anti-human IgG-Cy3 (Donkey polyclonal) | Jackson ImmunoResearch Labs, West Grove, PA, USA | Cat# 709-165-149 RRID:AB_2340535 | Phagocytosis- 1:1000 in block buffer, 30 min @ Room temperature |
| Antibody | Anti-8-OHdG (Rabbit polyclonal) | Bioss Antibodies, Woburn, MA, USA | Cat# bs-1278R RRID:AB_10856120 | IHC- 1:500 for 1 hr @ Room temperature |
| Antibody | Anti-mouse Ly6g (Rabbit monoclonal) Clone: EPR22909-135 | Abcam Inc, Toronto, ON, Canada | Cat# ab238132 RRID:AB_2923218 | IHC- 1:500 O/N @ 4 °C |
| Antibody | Anti-mouse F4/80 (Rat monoclonal) Clone: CI:A3-1 | Abcam Inc, Toronto, ON, Canada | Cat# ab6640 RRID:AB_1140040 | IHC- 1:100 O/N @ 4 °C |
| Antibody | Anti-Mouse IgG (H+L) (Goat polyclonal) Peroxidase-conjugated AffiniPure | Jackson ImmunoResearch Labs, West Grove, PA, USA | Cat# 115-035-003 RRID:AB_10015289 | WB- 1:10000 1 hr @ Room temperature |
| Antibody | Anti-Rabbit IgG (H+L) (Goat polyclonal) Peroxidase-conjugated AffiniPure | Jackson ImmunoResearch, West Grove, PA, USA | Cat# 111-035-144 RRID:AB_2307391 | WB- 1:10000 1 hr @ Room temperature |
| Antibody | Anti-Rabbit IgG (H+L) (Goat polyclonal) Cross-Adsorbed 2° Antibody, Alexa Fluor (AF-)555 | Thermo Fisher Scientific, Mississauga, ON, Canada | Cat# A-21428 RRID:AB_141784 | IHC- 1:200 1 hr @ Room temperature |
| Antibody | Anti-Rat IgG (H+L) (Goat polyclonal) Cross-Adsorbed 2° Antibody, Alexa Fluor 488 | Thermo Fisher Scientific, Mississauga, ON, Canada | Cat# A-11006 RRID:AB_141373 | IHC- 1:200 1 hr @ Room temperature |
| Antibody | PE Anti-Human CD16 (Mouse monoclonal) Clone 3G8 | BioLegend, San Diego, CA, USA | Cat# 980102 RRID:AB_2616616 | FC- 1 µl per 50 µl final volume, 30 min @ 4 °C in the dark |
| Antibody | APC/Cyanine7 Anti-Human CD11b (Mouse monoclonal) Clone ICRF44 | BioLegend, San Diego, CA, USA | Cat# 301342 RRID:AB_2563395 | FC- 1.25 µl per 50 µl final volume, 30 min @ 4 °C in the dark |
| Antibody | BV421 Anti-Human CD18 (Mouse monoclonal) Clone 6.7 | BD Biosciences, Mississauga, ON, Canada | Cat# 743370 RRID:AB_2871511 | FC- 1.25 µl per 50 µl final volume, 30 min @ 4 °C in the dark |
| Antibody | PerCP/Cyanine5.5 Anti-Human CD63 (Mouse monoclonal) Clone H5C6 | BioLegend, San Diego, CA, USA | Cat# 353020 RRID:AB_2561685 | FC- 1.25 µl per 50 µl final volume, 30 min @ 4 °C in the dark |
| Antibody | Pacific Blue Anti-Human CD14 (Mouse monoclonal) Clone HCD14 | BioLegend, San Diego, CA, USA | Cat# 325616 RRID:AB_830689 | FC- 2.5 µl per 50 µl final volume, 30 min @ 4 °C in the dark |
| Antibody | APC anti-human CD66b, eBioscience (Mouse monoclonal) Clone G10F5 | Thermo Fisher Scientific, Mississauga, ON, Canada | Cat# 17-0666-42 RRID:AB_2573152 | FC- 1.25 µl per 50 µl final volume, 30 min @ 4 °C in the dark |
| Antibody | Normal Mouse IgG (Mouse polyclonal) | Sigma-Aldrich, Oakville, ON, Canada | Cat# 12–371 RRID:AB_145840 | Flow cytometry (FC)- 2 µg, block 20 min @ 4 °C |
| Antibody | Human IgG control (Human polyclonal) | Sigma-Aldrich, Oakville, ON, Canada | Cat# I4506 RRID:AB_1163606 | Phagocytosis- 1:1000 in block buffer, 30 min @ Room temperature |
| Antibody | InVivoMAb human IgG1 (Human polyclonal) Isotype Control | Bio X Cell, Lebanon, NH, USA | Cat# BE0297 RRID:AB_2687817 | In vivo- 7 µg per injection per mouse |
| Sequence-based reagent | SLIT2_F | This paper | PCR primers | TCCTCCTCGCACCTTTGATGGATT |
| Sequence-based reagent | SLIT2_R | This paper | PCR primers | AGAGGGTTGGCTCCAATTGCTAGA |
| Sequence-based reagent | GAPDH_F | This paper | PCR primers | GGTGTGAACCATGAGAAGTATGA |
| Sequence-based reagent | GAPDH_R | This paper | PCR primers | GAGTCCTTCCACGATACCAAAG |
| Chemical compound, drug | Acti-stain-AF670 | Universal Biologicals, Cambridge, UK | Cat# PHDN1-A | Phagocytosis |
| Commercial assay or kit | BOND Epitope Retrieval Solution 1 | Leica Biosystems, Concord, ON, Canada | Cat# AR9961 | IHC Antigen Retrieval |
| Chemical compound, drug | Concanavalin A-AF647 | Thermo Fisher Scientific, Mississauga, ON, Canada | Cat# C21421 | Phagocytosis |
| Chemical compound, drug | Ethylenediaminetetraacetic acid (EDTA), 0.5 M, pH 8.0, Sterile | Bio-World, Dublin, OH, USA | Cat# 40520000 CAS# 60-00-4 | Flow Cytometry buffer ingredient |
| Commercial assay or kit | Detoxi-Gel Endotoxin Removing Gel | Thermo Fisher Scientific, Mississauga, ON, Canada | Cat# 20339 | Endotoxin removal |
| Commercial assay or kit | Detoxi-Gel Endotoxin Removing Gel Columns | Thermo Fisher Scientific, Mississauga, ON, Canada | Cat# 20344 | Endotoxin removal |
| Chemical compound, drug | Gentamicin (10 mg/mL) | Thermo Fisher Scientific, Mississauga, ON, Canada | Cat# 15710064 | HMEC-1 culture to selectively kill extracellular S. aureus bacteria |
| Chemical compound, drug | Isoluminol (4-Aminophthalhydrazide) | Sigma-Aldrich, Oakville, ON, Canada | Cat# A8264 CAS# 3682-14-2 | Extracellular ROS measurement |
| Chemical compound, drug | p38 MAPK Inhibitor IV | Cayman Chemical, Ann Arbor, MI, USA | Cat# 22219 CAS# 1638-41-1 | p38 MAPK inhibitor |
| Chemical compound, drug | Paraformaldehyde 16% solution | Electron Microscopy Sciences, Hatfield, PA, USA | Cat# 15710 CAS# 50-00-0 | Fixative |
| Chemical compound, drug | PD 184161 | Cayman Chemical, Ann Arbor, MI, USA | Cat# 10012431 CAS# 212631-67-9 | MEK1/2 inhibitor |
| Commercial assay or kit | Percoll | Sigma-Aldrich, Oakville, ON, Canada | Cat# P1644 | Murine neutrophil isolation |
| Commercial assay or kit | PolymorphPrep | Progen, Wayne, PA, USA | Cat# 1895 | Human neutrophil isolation |
| Chemical compound, drug | Power SYBR Green PCR Master Mix | Thermo Fisher Scientific, Mississauga, ON, Canada | Cat# 4367659 | Quantitative PCR |
| Chemical compound, drug | Phorbol 12-myristate 13-acetate (PMA) | Sigma-Aldrich, Oakville, ON, Canada | Cat# P8139 CAS #16561-29-8 | Neutrophil activation |
| Peptide, recombinant protein | Recombinant Human N-SLIT2 | PeproTech, Cranbury, NJ, USA | Cat# 150–11 | Neutrophil treatments |
| Peptide, recombinant protein | Recombinant Human ROBO1 Fc Chimera (N-ROBO1) | R&D Systems, Minneapolis, MN, USA | Cat# 8975-RB | Neutrophil treatment |
| Chemical compound, drug | SB 203580 | Sigma-Aldrich, Oakville, ON, Canada | Cat# S8307 CAS #152121-47-6 | p38 MAPK inhibitor |
| Commercial assay or kit | Superscript VILO MasterMix | Thermo Fisher Scientific, Mississauga, ON, Canada | Cat# 11755 | Reverse Transcription |
| Commercial assay or kit | SYTOX Green Nucleic Acid Stain | Thermo Fisher Scientific, Mississauga, ON, Canada | Cat# S7020 | NETosis assay |
| Chemical compound, drug | Y-27632, ROCK inhibitor | Sigma-Aldrich, Oakville, Canada | Cat# SCM075 CAS# 331752-47-7 | Neutrophil treatment |
| Commercial assay or kit | Bond Polymer Refine Detection kit | Leica Biosystems, Concord, ON, Canada | Cat# DS9800 | 8-OHdG (DAB) staining |
| Commercial assay or kit | G-LISA Rac Activation Assay | Cytoskeleton, Inc, Denver, CO, USA | Cat# BK125 | Rac1/2/3 activation assay |
| Commercial assay or kit | Human LL-37 ELISA kit | Hycult Biotech, Uden, Netherlands | Cat# HK321 | ELISA |
| Commercial assay or kit | Human SLIT2 ELISA kit | Cusabio, Wuhan, P.R. China | Cat# CSB-E11038h | ELISA |
| Commercial assay or kit | Mouse SLIT2 ELISA Kit | Cusabio, Wuhan, P.R. China | Cat# CSB-E11039m | ELISA |
| Commercial assay or kit | Mouse SLIT3 ELISA kit | Lifespan Biosciences Seattle, WA, USA | Cat# LS-F7173 | ELISA |
| Commercial assay or kit | RNeasy Plus Mini Kit | Qiagen, Toronto, ON, Canada | Cat# 74136 | RNA isolation |
| Cell line (H. sapiens) | FreeStyle 293-F Cells (HEK293F) | Thermo Fisher Scientific, Mississauga, ON, Canada | R79007 RRID:CVCL_D603 | N-SLIT2ΔD2 production |
| Cell line (H. sapiens) | HMEC-1 | American Type Culture Collection (ATCC), Manassas, VA, USA | CRL-3243 RRID:CVCL_0307 | Immortalized human dermal microvascular endothelial cells |
| Cell line (M. musculus) | RAW264.7 | American Type Culture Collection (ATCC), Manassas, VA, USA | TIB-71 RRID: CVCL_0493 | Murine macrophage cell line |
| Strain, strain background (Staphylococcus aureus) | Staphylococcus aureus GFP USA300 LAC strain | Dr. Ronald S. Flannagan (University of Western Ontario, London, ON, Canada) PMID: 30619165 | Staphylococcus aureus GFP | Phagocytosis |
| Strain, strain background (Staphylococcus aureus) | Staphylococcus aureus subsp. Aureus Rosenbach | American Type Culture Collection (ATCC), Manassas, VA, USA | ATCC 25923 | S. aureus (all experiments except phagocytosis) |
| Software, algorithm | ShapeOut2 | PMID: 29331015 | ShapeOut2; Müller et al., 2019 | https://github.com/ZELLMECHANIK-DRESDEN/ShapeOut2 |
Additional files
Download links
A two-part list of links to download the article, or parts of the article, in various formats.
Downloads (link to download the article as PDF)
Open citations (links to open the citations from this article in various online reference manager services)
Cite this article (links to download the citations from this article in formats compatible with various reference manager tools)
The chemorepellent, SLIT2, bolsters innate immunity against Staphylococcus aureus
eLife 12:e87392.
https://doi.org/10.7554/eLife.87392


